The Pan-Cancer Crosstalk Between the EFNA Family and Tumor Microenvironment for Prognosis and Immunotherapy of Gastric Cancer
 Rongrong Xie
 Mengping Yuan2†
  Yiyan Jiang
- 1Department of Radiotherapy, The First Affiliated Hospital of Wenzhou Medical University, Wenzhou, China
- 2Department of Gastroenterology, The Second Affiliated Hospital of Wenzhou Medical University, Wenzhou, China
- 3Department of Medical Oncology, The First Affiliated Hospital of Wenzhou Medical University, Wenzhou, China
Background: EFNA1–5 have important physiological functions in regulating tumorigenesis and metastasis. However, correlating EFNA genes in the tumor immune microenvironment (TIME), and the prognosis of patients with gastric cancer remains to be determined.
Methods: Using public databases, the expression of EFNA1-5 in pan-cancer and gastric cancer was comprehensively analyzed using UCSC Xena, the Oncomine dataset and UALCAN. We further completed survival analysis by Kaplan-Meier plotter to evaluate the prognosis of the high and low expression groups of the EFNAs gene in patients with gastric cancer. The TIMER tool was used to reveal the correlation between immune cell infiltration and genes of interest. Spearman correlation was used to find an association between the EFNA genes and tumor stem cells, TIME, microsatellite instability (MSI) or tumor mutational burden (TMB). We also used cBioportal, GeneMANIA and STRINGS to explore the types of changes in these genes and the protein interactions. Finally, we described the TIME based on QUANTISEQ algorithm, predicted the relationship between the EFNA genes and half-maximal inhibitory concentration (IC50), and analyzed the relationship between the EFNA family genes and immune checkpoints.
Results: The expression of EFNA1, EFNA3, EFNA4, and EFNA5 was elevated in pan-cancer. Compared with normal adjacent tissues, EFNA1, EFNA3, and EFNA4 were up-regulated in gastric cancer. In terms of the influence on the survival of patients, the expression of EFNA3 and EFNA4 were related to overall survival (OS) and disease-free survival (DFS) for patients with gastric cancer. High expression of EFNA5 often predicted poor OS and DFS. In gastric cancer, the expression of EFNA3 and EFNA4 showed a significant negative correlation with B cells. The higher the expression of EFNA5, the higher the abundance of B cells, CD4+T cells and macrophages. CD8+T cells, dendritic cells infiltration and EFNA1-4 expression were negatively correlated. The infiltration of CD4+T cells, macrophages and neutrophils was negatively correlated with the expression of EFNA1, EFNA3, and EFNA4. TMB and MSI were positively correlated with EFNA3/EFNA4 expression. In the tumor microenvironment and drug sensitivity, EFNA3/4/5 also showed a significant correlation. In addition, we explored the relationship between the EFNA family genes and the immune microenvironment (B cells, M2 macrophages, monocytes, CD8+ T cells, regulatory T cells, myeloid dendritic cells, natural killer cells, non-regulatory CD4+ T cells), immune checkpoint (PDCD1, PDCD1LG2, CD274, CTLA4), and IC50 of common chemotherapeutic drugs for gastric cancer (5-fluorouracil, cisplatin, docetaxel and gemcitabine).
Conclusions: Our study provides new ideas for tumor treatment and prognosis from the perspective of TIME, and nominates EFNA1–5 to become potential therapeutic targets for gastric cancer.
Introduction
Gastric cancer is the fifth most common malignancy and fourth in incidence worldwide (Bray et al., 2018). The benefit of chemotherapy and targeted therapy for patients with gastric cancer is still lower than that of most other cancers, with treatment failure mostly due to local recurrence, distant metastasis and drug resistance (Song et al., 2017; Biagioni et al., 2019; Kim et al., 2021). Nowadays, anti-cancer immunotherapies are emerging, including immune checkpoint inhibitors, cancer vaccines, adoptive cell transfer, cytokines, and adjuvants (da Silva et al., 2019; Fu et al., 2021). In patients with cancer, tumors often control immune checkpoints (such as CTLA-4 or PD-1/PD-L1) to cause T cell dysfunction or inhibition which blocks the host anti-tumor immune response to protect tumor tissue (Binnewies et al., 2018; Taube et al., 2018; Jia et al., 2020). The tumor microenvironment (TME), which includes immune cells, stromal cells and cancer cells, is dynamic and constantly evolving to promote tumor cell growth, metastasis and immune escape (Anderson and Simon, 2020; Bader et al., 2020; Jia et al., 2020; Lee et al., 2021). Increasing evidence reveals the important role of the TME in the biological behavior, occurrence and progression mechanism of breast cancer, gastric cancer and other tumors (Goff et al., 2021; Lee et al., 2021; Pei et al., 2021).
Erythropoietin producing hepatocyte (Eph) receptors, a large family of receptor tyrosine kinases, are expressed in most tissues during embryogenesis (Nakamura et al., 2005; Strozen et al., 2021). The Eph/Ephrin (EFN) signaling axis is a key signaling pathway in many developmental processes and an important mediator of neurogenesis, capillary budding, cell proliferation, differentiation, morphogenesis, adhesion, migration and death (Hong et al., 2018; Yin et al., 2020; Strozen et al., 2021). Eph receptors are defined as two subfamilies based on their affinity for ligands and sequence homology of extracellular domains, namely 9 Class A receptor members EphA (Epha1-8 and 10) and 5 Class B receptor members EphB (EphB1-4 and 6), for a total of 14 members in mammals (Uchiyama et al., 2015; Koh et al., 2020). These receptors bind to glycosylphosphatidylinositol-anchored ligands Ephrin-A (A1-A5) and transmembrane Ephrin-B (B1-B3) with short cytoplasmic regions containing PDZ binding motifs (Uchiyama et al., 2015). In recent years, members of this family have been investigated for their role in regulating tumorigenesis, aggressiveness, tumor-related angiogenesis, metastasis, and prognosis (Leite et al., 2020; Ieguchi and Maru, 2021). Furthermore, EFNA2 has been found to play an important role in angiogenesis and promoting epithelial-mesenchymal transformation in prostate cancer through in vitro and in vivo migration—and therefore a potential therapeutic target for prostate cancer (Zhao et al., 2021). EFNA4 is up-regulated in hepatocellular carcinoma correlating to a poor prognosis. Its overexpression mainly affects the PIK3R2/GSK3β/β -catenin pathway which significantly promotes the progression (proliferation and migration) of hepatocellular carcinoma (Lin et al., 2021). In recent years, there has also been reports on EphA1 and EphA2 in the field of gastric cancer (Rudno-Rudzińska et al., 2017; Peng C et al., 2018). Previous studies have provided new insights into anti-cancer therapies which prompted us to explore the mechanistic role of EFNA in the TME and its prognostic role in cancer.
In this study, the EFNA genes were analyzed and explored by bioinformatics, and the differences in transcriptional level of each EFNA gene in gastric cancer tissues and normal tissues were compared to evaluate its prognostic value in gastric cancer. The relationship between EFNA expression and immune cell infiltrates, TME, immune checkpoints, IC50 of common chemotherapeutic drugs, tumor mutational burden (TMB) and microsatellite instability (MSI) was also investigated.
Materials and Methods
Transcription Analysis With Oncomine
We used the UCSC Xena (https://xenabrowser.net/datapages/) search tool to obtain gene expression data for various primary cancers, including survival information, as well as data for RNA-sequencing (RNA-seq), immune subtypes, DNA stemness score (DNA-ss), and RNA stemness score (RNA-ss) (Goldman et al., 2020). We also used the Oncomine database, a cancer microarray website (www.oncomine.org) to query, extract tumor genes, and visualize data (Rhodes et al., 2004). The EFNA expression was explored in different cancers, comparing transcriptional differences of EFNA1-5 between cancer samples and normal controls using Student t test. The significance threshold of P value was defined as 0.05.
Identification of Differential Gene Expression With UALCAN
The UALCAN database (http://UALCAN.path.uab.edu/), a comprehensive, online, publicly accessible resource, was used to obtain RNA sequence transcriptome data from The Cancer Genome Atlas (TCGA) database (Chandrashekar et al., 2017). We used UALCAN to search for differential gene expression of EFNA1-5 between gastric cancer tissue and normal tissue samples.
Prognostic Analysis With Kaplan-Meier Plotter
We used Kaplan-Meier plotter, an open database (www.kmplot.com), which contains clinical information such as mRNA levels of tumor genes, prognosis, survival time and survival status of patients (Guo and He, 2020). In this study, median EFNA gene expression data of patients with gastric cancer were used classify them into high or low expression groups. The Kaplan-Meier survival curve was used to focus on EFNA expression, overall survival (OS) and disease-free survival (DFS) of patients with gastric cancer. The hazard ratio was given with a 95% confidence interval (CI), and p < 0.05 was considered statistically significant.
Prediction of Chemosensitivity
From the TCGA database, tumor RNA-seq data from the Genomic Data Commons (GDC) portal was downloaded. We predicted individual chemotherapy responses based on the Genomics of Drug Sensitivity in Cancer (GDSC) (https://www.cancerrxgene.org/). The half-maximal inhibitory concentration (IC50) of drugs was predicted by the pRRophetic algorithm. The ridge regression model of the IC50 of the sample was constructed with the ‘pRRophetic’ R package. A box diagram was drawn of the difference in IC50 between high and low EFNA expression groups as determined using the Wilcoxon signed-rank test of the R v4.1.2 software.
Changes in Patterns and Protein Interaction Analysis Using cBioPortal, GeneMANIA, and STRINGS
cBioportal (https://www.cbioportal.org/) was used for cancer genome information network platform analysis (Cerami et al., 2012). The change patterns (amplification, mutation, deletion, etc.) and proportion of EFNA genes were evaluated based on the TCGA database. The EFNA genes were submitted in GeneMANIA (http://www.genemania.org), an online research tool (Warde-Farley et al., 2010), whereby the site analyzed and displayed genes that performed similar functions—presenting an interaction between protein expression and heredity in a network. Furthermore, STRINGS (https://string-db.org/), contains vast amounts of protein-protein interaction (PPI) data (Szklarczyk et al., 2019) used to elucidate the PPI network of EFNA1-5.
Correlation Between Gene Expression and Immune Cell Abundance
The TIMER resource (http://timer.cistrome.org/), an intuitive, user-friendly tool, was used to visualize immune cell abundance with various factors such as gene expression, somatic cells and the function of the relationship between clinical features (Li T. et al., 2020). We used TIMER to evaluate the relationship between EFNA1–5 expression and infiltration of immune cells in gastric cancer. Besides, we also used the QUANTISEQ algorithm for depicting the tumor immune microenvironment (TIME). The immune score was evaluated by the ‘ggplot2’ and ‘pheatmap’ R packages. Lastly, we used the ‘immunedeconv’ R package which integrated six of the latest algorithms: TIMER, xCell, MCP-counter, CIBERSORT, EPIC, and quanTiseq.
Association of Genes Expression With TIME and Stem Cell Index
The ‘ESTIMATE’ and ‘Limma’ R Packages were used to obtain the level of stromal and immune cell infiltration in various types of cancer. The Spearman method was used to explore the correlation between EFNA genes expression, tumor stem cells, and TIME in pan- and gastric cancer.
Correlation Analysis Between EFNA Family Genes and Immune Checkpoints
To correlate the EFNA family genes with the immune checkpoints, we used the mRNA-seq data from the TCGA tumors (https://tcga-data.nci.nih.gov/tcga/). The two-gene correlation was analyzed with the ‘ggstatsplot’ R package, and the multi-gene correlation was analyzed using the ‘pheatmap’ R package. Spearman’s correlation analysis was used to show the correlation between quantitative variables with non-normal distribution.
Statistical Analysis
All statistical analyses were performed using R v4.1.2 and SPSS v26.0. We used R ‘ggplot2’, ‘pheatmap’, ‘ggpubr’, ‘corrplot’ or ‘survminer’, ‘limma’, and other software packages to map and visualize data. The student’s t-test was used to compare the differential expression of EFNA1-5 genes between gastric cancer and normal specimens. The log-rank test was used to compare the survival time of patients between high and low gene expression groups. The Spearman method was used to analyze the correlation between EFNA1-5 genes and MSI/TMB. p < 0.05 was defined as statistically significant.
Results
Heterosexual Expression of EFNA1-5 in Pan-Cancer
The results showed that EFNA1 and EFNA4 had the highest expression in pan-cancer, followed by EFNA3 and EFNA5 with high expression, and EFNA2 with low expression (Supplementary Figure S1A). EFNA4 had the strongest positive correlation with EFNA3 (Cor = 0.55, Supplementary Figure S1B). On the contrary, EFNA5 and EFNA2 were negatively correlated with each other (Cor = −0.21, Supplementary Figure S1B). The heat map of Supplementary Figure S1C further shows that the expression of each gene in the EFNA is highly heterogeneous in different cancer species. The expression of EFNA1 was high in bladder urothelial carcinoma (BLCA), EFNA2 was highest in stomach adenocarcinoma (STAD), and EFNA3 was highest in lung squamous cell carcinoma (LUSC). EFNA4 was highly expressed in cholangiocarcinoma (CHOL). EFNA5 was also highest in CHOL, but low in most other cancers.
Transcriptional Levels of EFNA1-5 in Gastric Cancer and Versus Healthy Tissues for Diagnosis of Gastric Cancer
In this study, transcription levels of EFNA genes in cancer and normal tissues were retrieved using the Oncomine database. From the results shown in Figure 1A, compared with normal tissues, there was an increase in transcription levels of EFNA2, EFNA3, and EFNA4 in gastric cancer tissues.
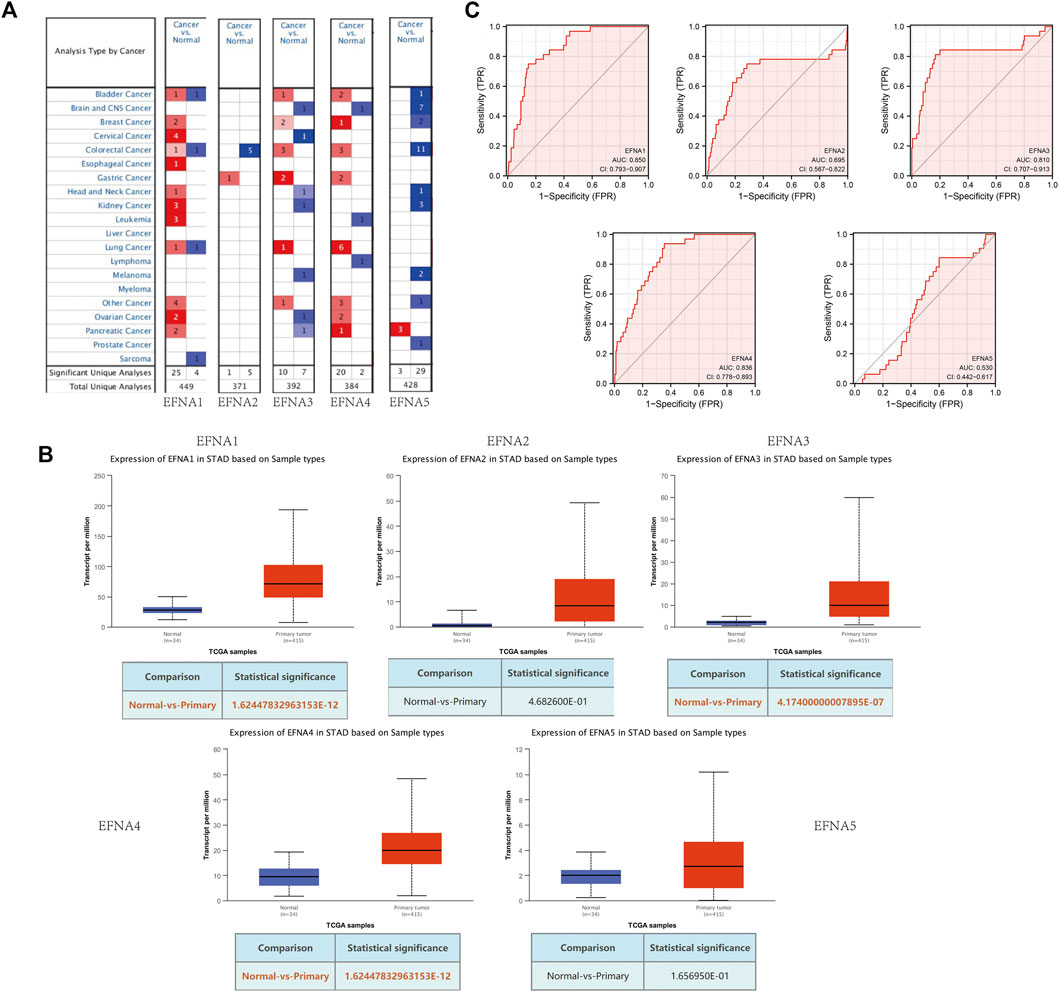
FIGURE 1. Expression of EFNA1-5 in gastric cancer and normal tissues. (A) mRNA levels of EFNA in various cancers. Red represents up-regulated mRNA expression and blue represents down-regulated mRNA expression. (B) Transcription of EFNA1-5 in gastric cancer and normal tissues from UALCAN data. (C) ROC curves of the EFNA genes.
UALCAN was used to analyze the expression pattern of EFNA1-5 in gastric cancer and normal tissues. As shown in Figure 1B, the expression of EFNA1 (p = 1.62E-12), EFNA3 (p = 4.17E-07), and EFNA4 (p = 1.62E-12) were significantly increased in gastric cancer tissues. However, there was no significant difference between EFNA2 (p = 4.68E-01) and EFNA5 (p = 1.66E-01) expression.
We evaluated the sensitivity and specificity of EFNA genes to distinguish between people with gastric cancer and healthy people by using a receiver operating characteristic (ROC) curve. As shown in Figure 1C, EFNA1 (area under curve [AUC] = 0.850, CI: 0.793–0.907), EFNA3 (AUC = 0.810, CI: 0.707–0.913), and EFNA4 (AUC = 0.836, CI: 0.778–0.893) have high diagnostic value. EFNA2 (AUC = 0.695, CI: 0.567–0.822) also showed a high but lower diagnostic value. In contrast, EFNA5 (AUC = 0.530, CI: 0.442–0.617) was of moderate discriminative diagnostic value.
Prognostic Potential of EFNA Genes on Survival in Gastric Cancer
The prognostic value of EFNA1-5 in patients with gastric cancer for OS was evaluated. As shown in Figure 2A, the OS in the high expression group of EFNA3 and EFNA4 was significantly higher than that in the low expression group (p = 0.0035 and p = 0.027, respectively). On the contrary, the OS in the high expression group of EFNA5 was significantly lower than that in the low expression group (p = 0.023). For EFNA1 and EFNA2 expression, there was no significant difference in OS between the high expression and the low expression groups. We next explored the effect of EFNA genes expression on DFS. As shown in Figure 2B, high expression of EFNA3 (p = 0.038) and EFNA4 (p = 0.046) showed longer DFS. However, high expression of EFNA5 suggested poor DFS (p = 0.00017). Similarly, there was no statistical difference in DFS between the EFNA1 and EFNA2 expression groups.
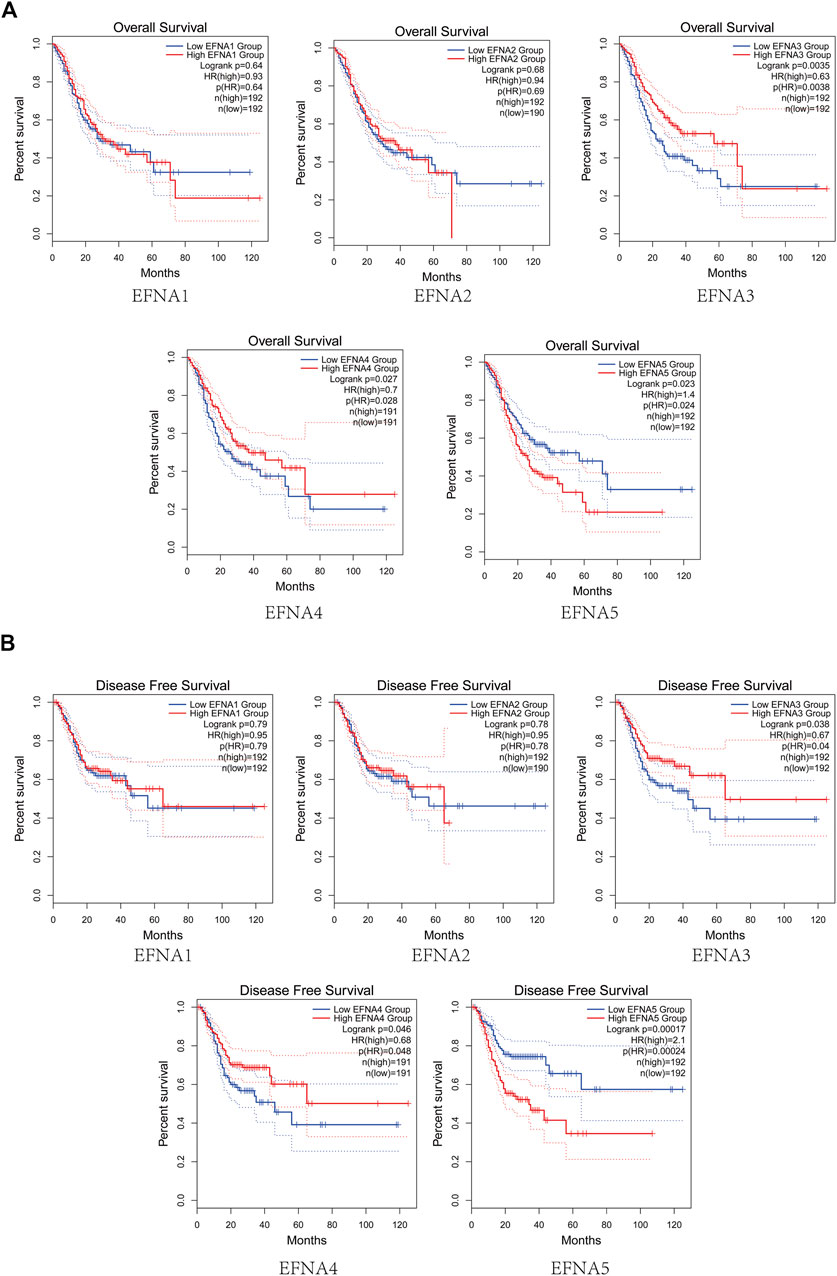
FIGURE 2. Survival analysis of gastric cancer. (A) Analysis curve of EFNA expression and overall survival rate in gastric cancer (Kaplan-Meier plotter). (B) Analysis curve of EFNA expression and disease-free survival rate in gastric cancer (Kaplan-Meier plotter).
Relationship Between the Expression of EFNA Family Genes and the IC50 of Common Chemotherapeutic Drugs for Gastric Cancer
The box diagram for the differences in IC50 of chemotherapeutic drugs between high and low gene expression groups showed that the expression of EFNA1 was related to the IC50 of 5-fluorouracil (p = 0.039) and cisplatin (P = 4E-07) (Figure 3A). The expression of EFNA2 was also associated with IC50 of cisplatin (p = 0.027) (Figure 3B). The expressions of EFNA3 and EFNA4 were related to the IC50 of 5-fluorouracil (p = 0.0062 and p = 0.0024, respectively), docetaxel (p = 7.2E-09 and p = 0.0098, respectively), and gemcitabine (p = 0.0095 and p = 0.00093, respectively) (Figures 3C,D). However, no correlation was found between EFNA5 expression and the IC50 of common gastric cancer chemotherapeutic drugs (Figure 3E).
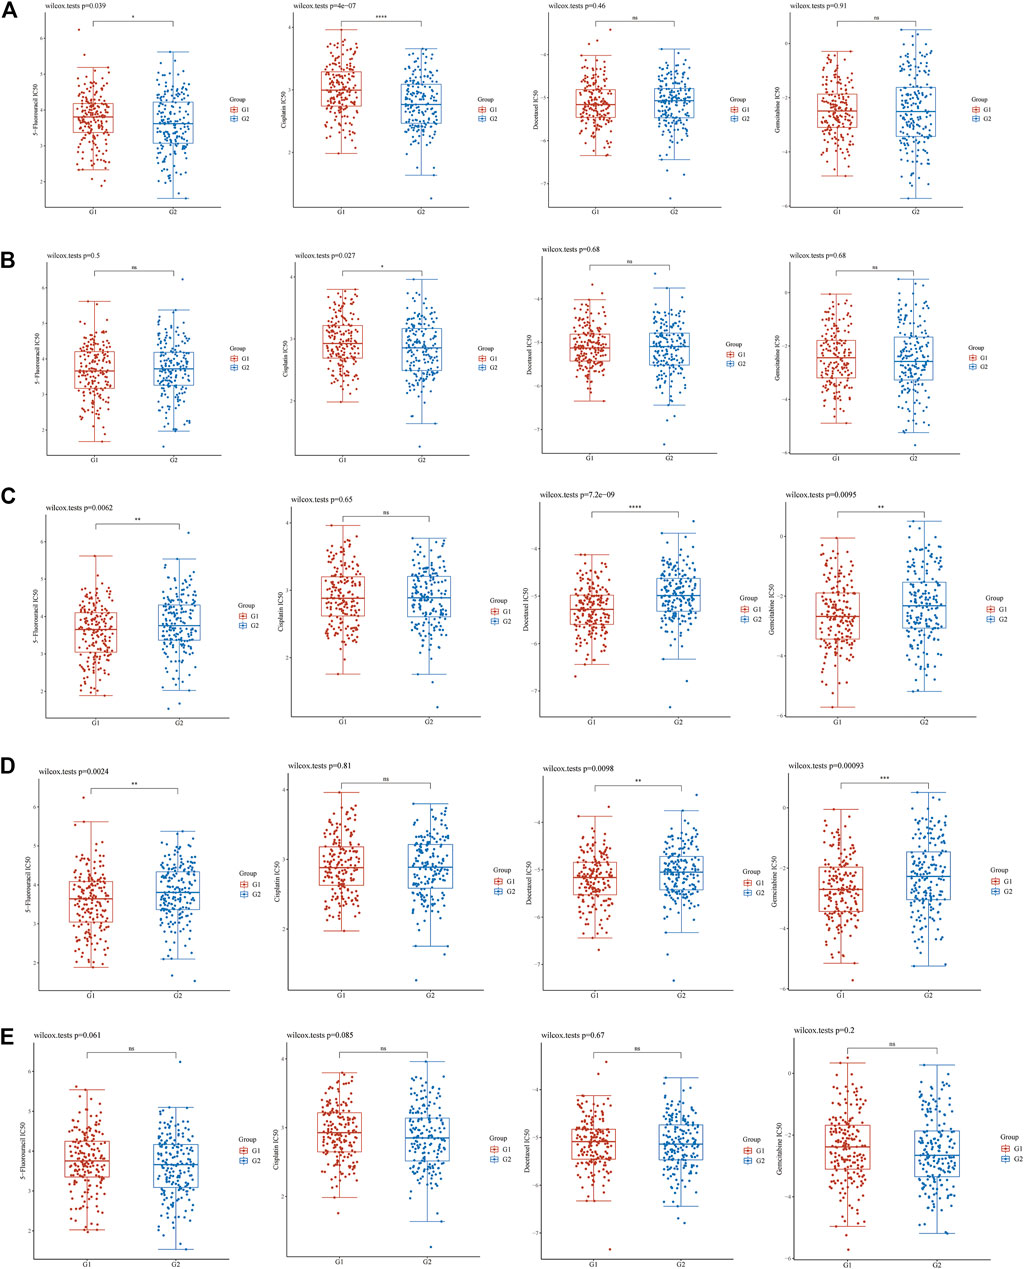
FIGURE 3. IC50 difference between high or low EFNA family genes expression of four chemotherapeutic drugs (5-fluorouracil, cisplatin, docetaxel, and gemcitabine). (A) EFNA1, (B) EFNA2, (C) EFNA3, (D) EFNA4, and (E) EFNA5. The horizontal axis represents samples of different groups, the vertical axis represents the distribution of the IC50 scores, the different colors represent different groups, and the upper left corner represents the significance of the P-value test method.
Drug Sensitivity Analysis of EFNA Genes
We used Pearson correlation analysis to study the relationship between EFNA1-5 expression and drug sensitivity. The scatter plot showed that EFNA3 expression was positively correlated with drug sensitivity of SR16157 (Supplementary Figure S4A, Cor = 0.488, p < 0.001) and fulvestrant (Supplementary Figure S4G, Cor = 0.421, p < 0.001). EFNA4 expression was negatively correlated with drug sensitivity of selumetinib (Supplementary Figure S4D, Cor = –0.456, p < 0.001), cobimetinib (isomer 1) (Supplementary Figure S4E, Cor = −0.445, p < 0.001) and trametinib (Supplementary Figure S4M, Cor = −0.398, p = 0.002). EFNA5 expression was negatively correlated with drug sensitivity of XK-469 (Supplementary Figure S4B, Cor = −0.467, p < 0.001), dimethylaminoparthenolid (Supplementary Figure S4C, Cor = −0.466, p < 0.001), BN-2629 (Supplementary Figure S4F, Cor = −0.429, p < 0.001), lomustine (Supplementary Figure S4H, Cor = −0.414, p = 0.001), arsenic trioxide (Supplementary Figure S4I, Cor = −0.414, p = 0.001), homoharringtonine (Supplementary Figure S4J, Cor = −0.406, p = 0.001), vincristine (Supplementary Figure S4K, Cor = −0.405, p = 0.001), epirubicin (Supplementary Figure S4L, Cor = −0.403, p = 0.001), carmustine (Supplementary Figure S4N, Cor = −0.397, p = 0.002), and daunorubicin (Supplementary Figure S4O, Cor = −0.396, p = 0.002), while positively correlated with irofulven (Supplementary Figure S4P, Cor = 0.381, p = 0.003).
Correlation Between of EFNA Genes, Gene Changes, and Protein Interactions in Gastric Cancer
Figure 4A shows the degree of association between EFNA genes. Among them, the correlation between EFNA3 and EFNA4 was the strongest with a positive correlation. EFNA1 also had moderate positive correlation with EFNA3 and EFNA4. EFNA2 was positively correlated with EFNA1, EFNA3, and EFNA4. EFNA5 showed mild to moderate negative correlation with the other four genes.
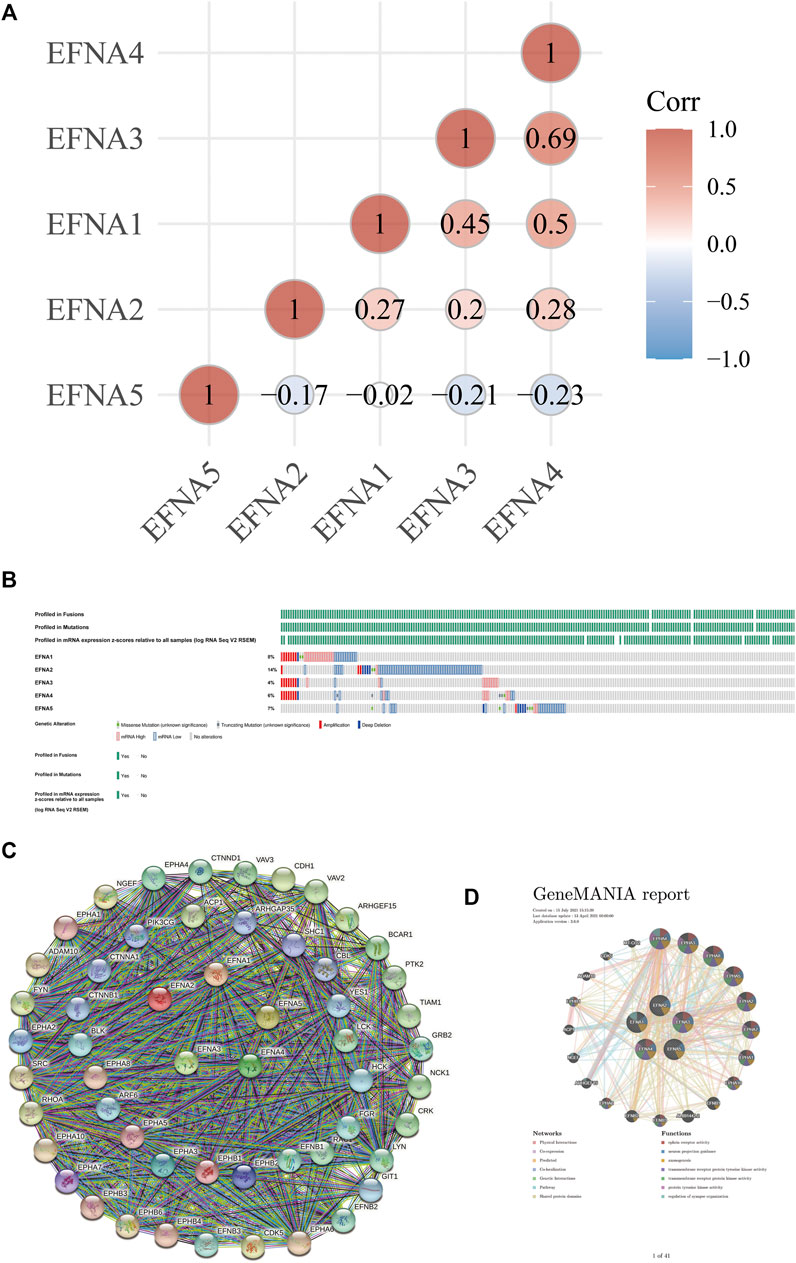
FIGURE 4. Correlation analysis of EFNA genes in gastric cancer, gene changes and protein interactions. (A) Correlation of different genes in between different EFNA genes in gastric cancer. (B) Types and proportions of EFNA gene changes in gastric cancer samples. (C,D) Protein interaction network of different genes in EFNA involved with different EFNA genes.
In terms of genetic changes, we explored the regulatory effect of genetic changes on EFNA transcription level using data from the TCGA database. Figure 4B shows the proportion of EFNA genes altered in samples and the type of genes altered, which was analyzed and visualized using cBioPortal. Among the gastric cancer samples queried, the samples with changes in EFNA1, EFNA2, EFNA3, EFNA4, and EFNA5 accounted for 8, 14, 4, 6, and 7% of the total population, respectively. Gene changes affect the expression of cancer-related genes and thus affect the occurrence and development of tumors. Genetic alterations include missense mutations, truncation mutations, deep deletions, and increased/decreased mRNA expression. The main changes related to the EFNA1 gene were the enhancement of mRNA expression, followed by the decrease and amplification of mRNA expression. The majority of EFNA2 gene changes were in the form of reduced mRNA expression. The gene changes of EFNA3 were mainly concerning mRNA expression enhancement and amplification. The gene changes of EFNA4 were associated with decreased and amplified mRNA expression, followed by enhanced mRNA expression. The EFNA5 gene was most attenuated in mRNA expression. Overall, low mRNA expression was the most common genetic change associated with EFNA genes in our gastric cancer samples.
To explore the potential relationship of EFNA genes, GeneMANIA was used in this study to analyze the PPI network. The network diagram in Figure 4C shows 5 EFNA proteins and 50 proteins associated with them. We also explored the co-expression of the EFNA genes. Thus, the gene-gene network was constructed based on the five EFNA genes. GeneMANIA is available to explore gene interactions, and we used it to predict the genes that interact with gastric cancer and to build our representative interaction network. Figure 4D shows 20 nodes surrounding the central nodes of the five EFNA genes, which are genes associated with EFNA in physical interaction, co-expression, prediction, co-location, genetic interaction, pathways and shared protein domain. Among them, EPHA4, EPHA3, EPHA8, EPHA5, and EPHA2 ranked high in correlation.
Correlation Between EFNA1-5 and Immune Cell Abundance in Patients With Gastric Cancer
In this study, the TIMER database was used to explore the relationship between EFNA expression and immune cell infiltration Figure 5. EFNA1 expression was negatively associated with infiltration of CD8+ T cells (Cor = −0.316, p = 5.18E-10), CD4+ T cells (Cor = −0.202, p = 9.98E-05), macrophages (Cor = −0.227, p = 1.08E-05), neutrophils (Cor = -0.293, p = 9.24E-09) and dendritic cells (Cor = −0.34, p = 1.84E-11). The expression of EFNA2 was negatively correlated with CD8+ T cells (Cor = −0.135, p = 9.19E-03) and dendritic cell infiltration (Cor = −0.137, p = 8.01E-03). The expression of EFNA3 was significantly negatively correlated with B cells, (Cor = −0.167, p = 1.27E-03), CD8+T cells (Cor = −0.249, p = 1.19E-06), CD4+T cells (Cor = −0.324, p = 2.28E-10), macrophages (Cor = −0.368, p = 2.51E-13), neutrophils (Cor = −0.196, p = 1.48E-04), and dendritic cells (Cor = −0.305, p = 1.92E-09). Similarly, EFNA4 expression was negatively associated with B cells (Cor = −0.249, p = 1.27E-06), CD8+ T cells (Cor = −0.167, p = 1.23E-03), CD4+ T cells (Cor = −0.311, p = 1.15E-09), macrophages (Cor = −0.333, p = 5.25E-11), neutrophils (Cor = −0.175, p = 7.20E-04) and dendritic cells (Cor = −0.269, p = 1.40E-07). Different from the previous four genes, the higher the expression of EFNA5, the higher the abundance of B cells (Cor = 0.236, p = 4.69E-06), CD4+ T cells (Cor = 0.134, p = 1.04E-02) and macrophages (Cor = 0.18, p = 5.05E-04).
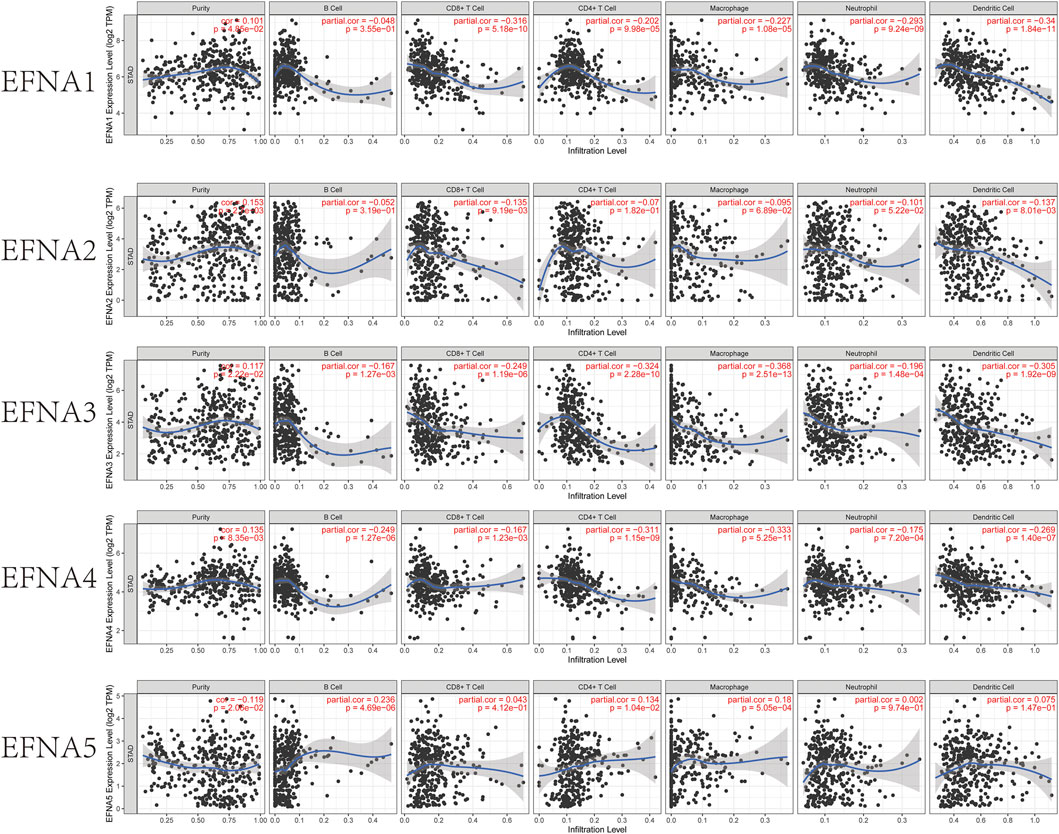
FIGURE 5. TIMER estimation of the immune infiltration level associated with EFNA1–5 genes. The infiltrating immune cells include B cells, CD8+ T cells, CD4+ T cells, M2 macrophages, neutrophils, and dendritic cells. Correlation between EFNA1-5 with the abundance of various immune cells in gastric cancer.
We also used the ‘immunedeconv’ R package to explore the relationship between the EFNA family and TIME (Figure 6). The expression of EFNA1 (Figure 6A) was related to the level of B cells (p < 0.001), M2 macrophages (p < 0.001), monocytes (p < 0.01), CD8+ T cells (p < 0.001), regulatory T cells (Tregs) (p < 0.001), and myeloid dendritic cells (p < 0.05). The expression of EFNA2 (Figure 6B) was related to the level of B cells (p < 0.01), monocyte (p < 0.001), natural killer (NK) cells (p < 0.001), CD8+ T cells (p < 0.01), Tregs (p < 0.001), and myeloid dendritic cells (p < 0.05). The expression of EFNA3 (Figure 6C) was related to the level of B cells (p < 0.001), M2 macrophages (p < 0.001), monocytes (p < 0.01), CD8+ T cells (p < 0.001), Tregs (p < 0.001). The expression of EFNA4 (Figure 6D) was related to the level of B cells (p < 0.001), M2 macrophages (p < 0.001), non-regulatory CD4+ T cells (p < 0.05), CD8+ T cells (p < 0.01), and Tregs (p < 0.001). The expression of EFNA5 (Figure 6E) was only related to the level of B cells (p < 0.001).
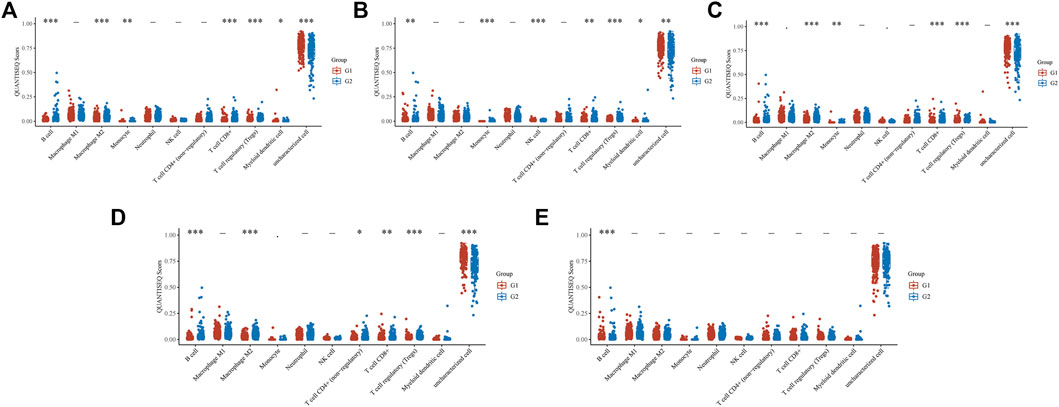
FIGURE 6. The QUANTISEQ Score distribution of immune cells at different EFNA gene expressions. (A) EFNA1, (B) EFNA2, (C) EFNA3, (D) EFNA4, and (E) EFNA5. The horizontal axis represents different immune cells, the vertical axis represents the gene expression distribution, and the different colors represent different groups. Asterisks represent levels of significance (*p < 0.05, **p < 0.01, ***p < 0.001).
Relationship Between EFNA Genes Expression and TME, as Well as the StromalScore in Patients With Pan-Cancer
This study showed that EFNA genes expression was significantly positively or negatively correlated with the StromalScore (Supplementary Figure S2A), ImmuneScore (Supplementary Figure S2B) and ESTIMATEScore (Supplementary Figure S2C) of pan-cancer. Similarly, EFNA genes expression was also associated with DNA-ss (Supplementary Figure S2D) and RNA-ss (Supplementary Figure S2E) in various cancers.
Relationship Between EFNA1-5 Expression and Immune Subtypes, TME and Stem Cell Index in Pan-Cancer and Gastric Cancer
We also investigate the potential correlation between EFNA gene expression and immune subtypes in pan-cancer and gastric cancer. EFNA1-5 showed a significant association with the immune subtype in pan-cancer (p < 0.001, Supplementary Figure S3). Figure 7A shows that the expression of EFNA1-4 in gastric cancer was significantly correlated with immune subtypes (p < 0.001, p < 0.01, p < 0.001, and p < 0.001, respectively). EFNA1-4 was highly expressed in C4. while EFNA1 was highly expressed in C1–C4, and C6. Elevated EFNA2 expression was associated with C1 infiltration.
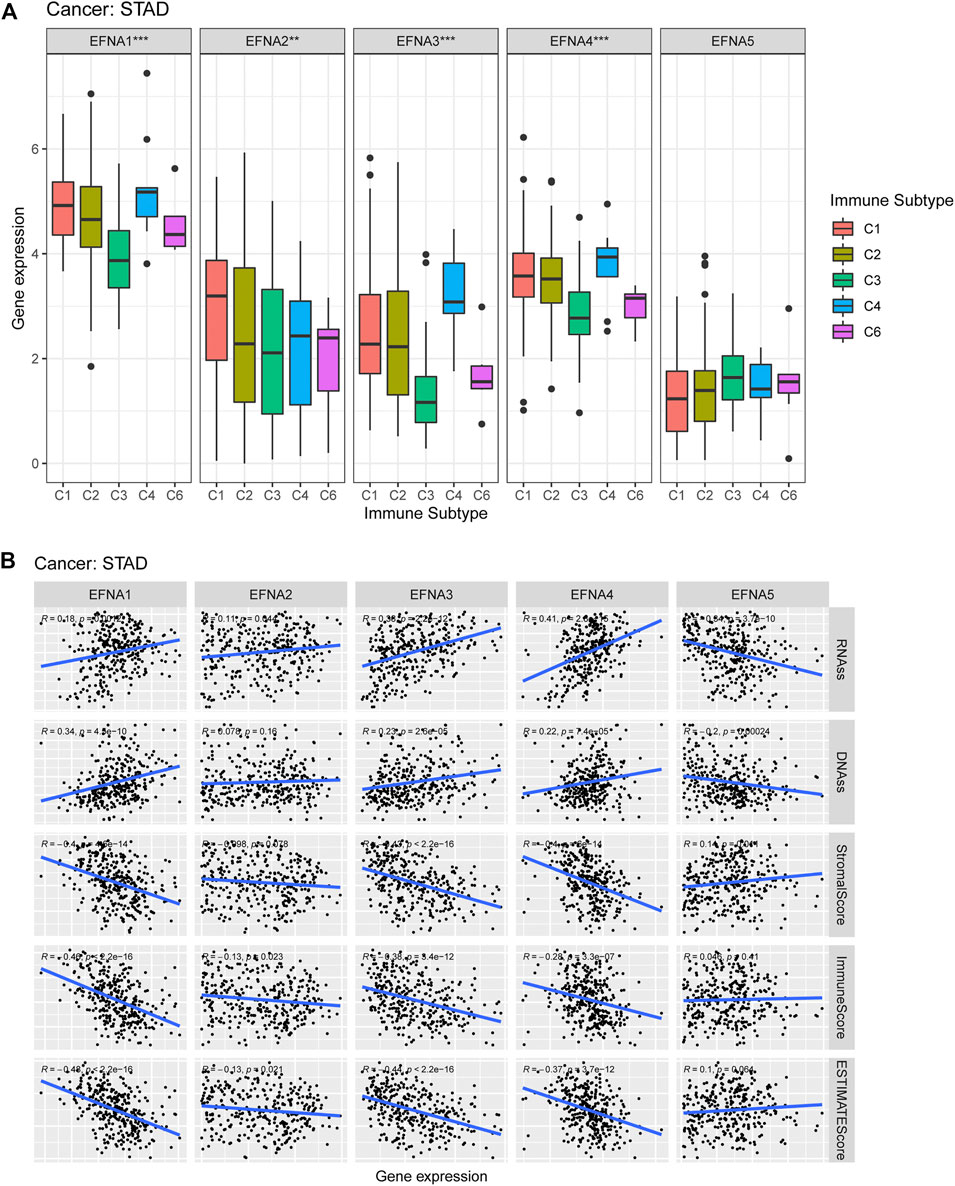
FIGURE 7. Expression of EFNA genes in different immune subtypes, as well as its correlation with the tumor microenvironment and stem cell index. (A) Expression levels of EFNA1-5 in different immune subtypes of gastric cancer. (B) Association between EFNA1-5 expression and RNA-ss, DNA-ss, StromalScore, ImmuneScore and ESTIMATEScore in gastric cancer.
Figure 7B shows that in gastric cancer, EFNA5 was negatively correlated with RNA-ss (R = −0.34, p = 3.7E-10) and DNA-ss (R = −0.2, p = 0.00024), and positively correlated with StromalScore (R = 0.14, p = 0.011). The expression of EFNA1-4 was positively correlated with RNA-ss (R = 0.18, p = 0.0012; R = 0.11, p = 0.044; R = 0.38, p = 2.2E-12; R = 0.41, p = 2.8E-15, respectively). Furthermore, the expression of EFNA1 (R = 0.34, p = 4.5E-10), EFNA3 (R = 0.23, p = 2.6E-05), and EFNA4 (R = 0.22, p = 7.4E-05) were positively correlated with DNA-ss. In terms of StromalScore, EFNA1 (R = −0.4, p =4.6E-14), EFNA3 (R = −0.43, p = 2.2E-16) and EFNA4 (R = −0.4, P = 6E-14) showed negative correlation. The expression of EFNA1-4 was negatively correlated with ImmuneScore (R = −0.46, P =<2.2E-16; R = −0.13, p = 0.023; R = −0.38, p = 3.4E-12; R = −0.28, p = 3.3E-07, respectively). Similarly, EFNA1-4 expression was negatively correlated with ESTIMATEScore (R = −0.48, P = <2.2E-16; R = −0.13, p = 0.021; R = −0.44, p = 2.2E-16; R = −0.37, p = 3.7E-12, respectively).
Relationship Between EFNA1-5 and Immune Checkpoints
The multi-gene correlation hotspot map showed that EFNA family genes were significantly associated with multiple immune checkpoints (Figure 8). PDCD1 was significantly correlated with EFNA1 (p < 0.001), EFNA3 (p < 0.001), EFNA4 (p < 0.001), and EFNA5 (p < 0.001). The higher the expression of EFNA1 (p < 0.001), EFNA2 (p < 0.001), EFNA3 (p < 0.001), and EFNA4 (p < 0.001), the higher the expression of PDCD1LG2. CD274 was significantly correlated with EFNA1 (p < 0.001), EFNA2 (p < 0.05), EFNA4 (p < 0.001), and EFNA5 (p < 0.05). CTLA4 was positively correlated with EFNA1 (p < 0.001), EFNA2 (p < 0.05), EFNA3 (p < 0.05), EFNA4 (p < 0.001), and EFNA5(p < 0.001).
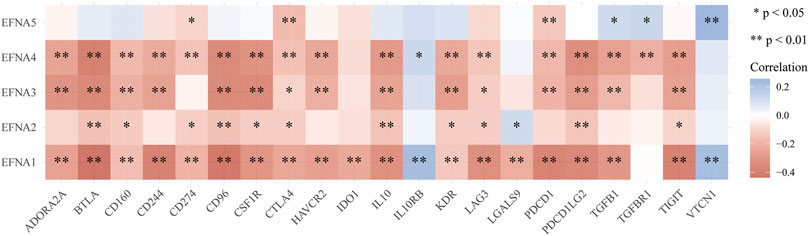
FIGURE 8. Heat map of correlation analysis between EFNA family genes and immune checkpoints. The horizontal and vertical coordinates represent genes, in which different colors represent correlation coefficients (blue represents positive correlation and red represents negative correlation). The darker the color, the stronger the correlation between them; *p < 0.05, **p < 0.01.
Correlation Between EFNA Genes With MSI and TMB
We further explored the association between TMB and MSI and EFNA genes expression using Spearman correlation. The analysis results of Figures 9A,B respectively show that the TMB score (p = 8.65E-20; 0.45, CI:0.36–0.53) and MSI (p = 1.73E-15; 0.40, CI:0.30–0.48) was significantly positively correlated with the expression of EFNA3. This correlation was also reflected in EFNA4. The higher the expression level of EFNA4, the higher the TMB score (Figure 9C, p = 2.37E-13; 0.37, CI:0.27–0.46) and MSI (Figure 9D, p = 2.85E-06; 0.24, CI:0.14–0.34).
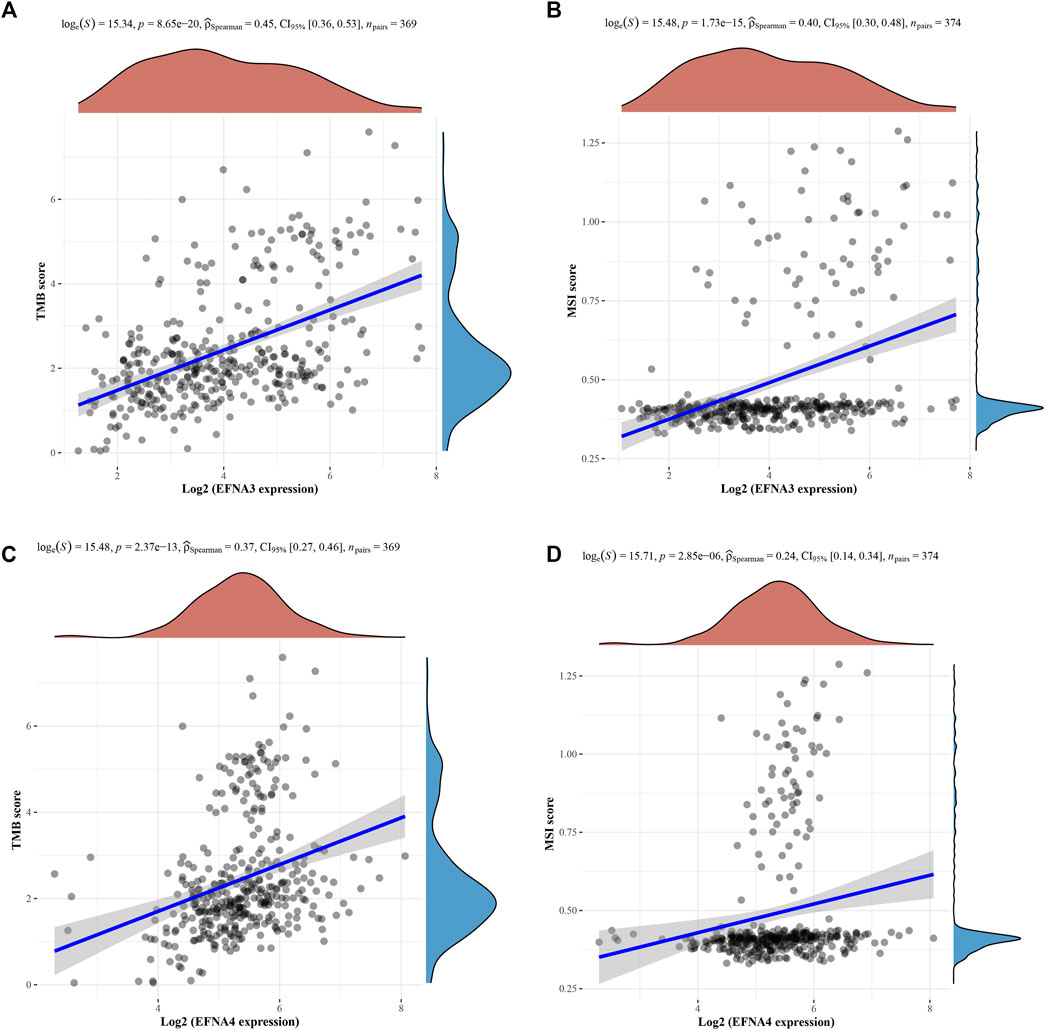
FIGURE 9. Spearman correlation analysis of TMB/MSI and EFNA gene expression. The horizontal axis represents EFNA gene expression, and the vertical axis represents TMB/MSI score distribution. On the upper side is the red density curve showing the distribution trend of EFNA genes. On the right is a blue density curve showing trends in TMB/MSI fractions. (A) EFNA3 and TMB (B) EFNA3 and MSI (C) EFNA4 and TMB (D) EFNA4 and MSI.
Discussion
Immune checkpoint inhibitors are promising strategies for cancer treatment, which are aimed at blocking the invasion of tumor cells to the host immune system and stimulating the immune system’s response to tumor antigens, thereby killing cancer cells (Zhang and Chen, 2018; Han et al., 2020; Wei Q. et al., 2021). The mechanism of tumor development is closely related to the immune system, especially within the TME (Oya et al., 2020). The concept of the TME reveals that tumor formation is not simply abnormal cell proliferation but highly organized and complex (Fu et al., 2021). At present, immunotherapy for gastric cancer targets patients with advanced HER-2 -positive status with only a few people benefiting from immunotherapy (Zhang et al., 2021). This prompted our research into more targeted and individualized immunotherapy in the gastric cancer population to maximize the benefits of patients.
A recent study quantified the TME to construct a scoring system for predicting the response of gastric cancer to immune checkpoint inhibitors (Zeng et al., 2021). Li et al. identified six target genes of gastric cancer by bioinformatics and found that they were associated with the TME score (Li Y. et al., 2020). The TME is associated with a key transcription factor that is frequently up-regulated in gastric adenocarcinoma which may beneficial for prognosis (Liu et al., 2020). Liu et al. constructed a gastric cancer prognostic scoring system based on several genes closely related to gastric cancer progression. There were differences in the TME immune score, stromal score and inhibitory immune checkpoint expression between high- and low-risk groups (Liu et al., 2021). In another study on the TME, the prognostic power of tumor-stromal ratio in gastric cancer was no less than that of the TNM stage (Peng Q et al., 2018). Furthermore, Li et al. evaluated the prognosis of major stromal and immune cells in gastric cancer and showed that the abundance of NK cells and stroma plays a role in selecting individuals who would benefit from chemotherapy for gastric cancer (Li B. et al., 2020).
In our study, we explored the association between the EFNA genes and the infiltration of immune cells. The expression of EFNA1 was negatively associated with the infiltration of CD8+T cells, CD4+T cells, macrophages, neutrophils, and dendritic cells. The expression of EFNA2 was negatively associated with the infiltration of CD8+T cells and dendritic cells. High EFNA3 expression usually indicated low immune cell infiltration. EFNA4 expression was statistically correlated with the above immune cells. The higher the expression of EFNA5, the higher the abundance of B cells, CD4+T and macrophages. We further explored and discussed the TME. EFNA1, EFNA3 and EFNA4 showed a negative correlation with the stromal score and immune score. High expression of EFNA2 often suggested a low immune score, but no statistical correlation was found with the stromal score. In contrast, EFNA5 was positively associated with the stromal score, without showing a positive correlation with the immune score.
MSI is an important concern in gastric cancer. Patients with resectable gastric cancer and microsatellite instability tend to have a better prognosis than patients with microsatellite stability (Puliga et al., 2021). MSI accounts for 8–37% of gastric cancer, which is relatively high (Miceli et al., 2019; Rodriquenz et al., 2020). The results of a meta-analysis involving 21 studies demonstrated a favorable prognosis for patients with gastric cancer and MSI (Polom et al., 2018). Moreover, a bioinformatics study systematically analyzed 271 patients with gastric cancer. In terms of prognosis, the MSI subtype was superior to the microsatellite stable subtype, and this advantage was more significant in the Chinese population (Cai et al., 2020). Ma et al. established a prognostic marker of gastric cancer based on 11 TMB differential genes and found that high TMB may promote immune infiltrate, and patients with high TMB showed a better prognosis (Ma et al., 2021). Baseline tumor burden factors, such as the sum of maximum tumor size and target lesion size, can be used in combination with TMB to evaluate the efficacy of immune checkpoint inhibitors in advanced gastric cancer (Wei X.-L. et al., 2021). In a retrospective analysis of 63 patients with advanced gastric cancer treated with immunotherapy, evidence suggests that PD-L1, CPS, EBV, MSI, and TMB are effective in survival outcomes (Kim et al., 2020). Our study found that TMB score and MSI was positively correlated with the expression of EFNA3 and EFNA4 in gastric cancer.
Cyclin-dependent kinase 5 (CDK5) is a member of the protein kinase family that has been shown to play a role in cancer development and the TME (Do and Lee, 2020). Abnormal activation of CDK5 affects the development of triple negative breast cancer. In contrast, inhibition of CDK5 may reduce stem transformation, reverse the immunosuppressive microenvironment, and add a good approach to anti-PD-1 therapy (Bei et al., 2020). In an animal study using the CRISPR-Cas9 genome editing system, PD-L1 was attenuated by specifically knocking out CDK5 to enhance host anti-tumor immunity (Deng et al., 2020). In our study, analyzing the interaction of EFNA1–5 with the protein network showed that CDK5 was correlated with EFNA genes.
The extensive involvement of EFNA1 in the pathogenesis of tumors has been verified by increasing reports. A microarray analysis combined with basic experiments showed that EFNA1 and GMAN were associated with the invasion ability of gastric cancer cells (Zhuo et al., 2019). In a study of 222 patients with gastric adenocarcinoma that underwent gastrectomy, immunohistochemical analysis of the samples showed that EFNA1 expression suggested a poor disease-specific survival benefit (Miyazaki et al., 2013). However, the results of the survival analysis in our study did not show a difference in gastric cancer survival between the high and low EFNA1 expression groups. This may be due to the differences in our survival assessment indicators and samples. One study, involving 525 gastric cancer samples and 501 controls, found that rs12904 polymorphism in the EFNA1 gene was strongly associated with gastric cancer risk (Li et al., 2014). In a study using RT-PCR to identify the expressions of EPHA2 and EFNA1 in gastric cancer tissues and cell lines compared to normal tissues. EPHA2 expression was higher in 55% of gastric cancer specimens than in the normal group, and 57% of them were overexpressed—suggesting that the expression of these two genes may be related to the behavior of gastric cancer (Nakamura et al., 2005). Our study also found that EFNA1 expression was significantly higher in gastric cancer than in normal tissues. Classification and analysis of cancer types showed that EFNA1 was up-regulated in many tumors, most notably in BLCA. A recent case-control study found that genotype frequency of the EFNA1 rs4971066 polymorphism was associated with susceptibility to gastric cancer (Pu et al., 2021). Another study also showed that EFNA1 knockout in gastric cancer cell lines, reduced its invasion and metastasis in mice (Zhuo et al., 2019). The results of immune subtype analysis showed that EFNA1 was significantly correlated with the immune subtype. Among the queried gastric cancer samples, the samples with changes in EFNA1 accounted for 8%, and the main gene changes were the enhancement of mRNA expression.
A recent study revealed that EFNA3 has the potential to become a new target for oral cancer treatment through molecular biology techniques and xenotransplantation models (Wang et al., 2020). Upregulation of EFNA3 in patients with breast cancer has been associated with shorter metastasis-free survival (Gómez-Maldonado et al., 2015). Bioassay studies demonstrated that EFNA1, EFNA3, and EFNA4 expression were higher in breast cancer than in normal tissues, while EFNA5 showed an opposite trend. High expression of EFNA4 often reveals poor OS and recurrence-free survival in breast cancer (Liang et al., 2021). Pei et al. created a SERPINE1-and EFNA3-based hypoxia risk index for gastric cancer (Pei et al., 2021). In our study, the expression of EFNA3 in gastric cancer was significantly higher than that of the adjacent tissues. The expression of EFNA3 was elevated in pan-cancer, and the differential expression heat map of different cancers showed that it was elevated in many tumors, but significantly down-regulated in GBM. Drug sensitivity analysis showed that its expression was significantly positively correlated with the sensitivity of SR16157 and fulvestrant.
In recent years, it has been reported that Mir-645 promotes tumor growth, metastasis, invasion and other malignant biological behaviors in colorectal cancer by targeting EFNA5 (Li S. et al., 2020). EFNA5 plays a role in the prognostic effects of chemotherapy in patients with advanced gastric cancer (Liu et al., 2019). EFNA5 is also a possible therapeutic target in ovarian cancer (Yang et al., 2019). From the results of our analysis, EFNA5 expression was low in most cancers but elevated in CHOL. Survival analysis showed that the EFNA5 high expression group showed less survival benefit. EFNA5 was negatively correlated with the sensitivity of many drugs, but its high expression was correlated with a higher sensitivity for irofulven. Furthermore, the high expression of EFNA3 and EFNA4 indicates that it is beneficial for OS and DFS of gastric cancer, while the high expression of EFNA5 indicates a low survival rate. This may be related to the negative correlation between the expression of EFNA5 and the other four genes of the EFNA family.
There are some limitations in this study. The samples in this study were all from online databases, some of which lacked detailed patient information, such as specific treatment regiments. Second, as a retrospective study, the reliability of the results should be confirmed by a large prospective experimental study.
Conclusion
This study comprehensively analyzed the expression of EFNA genes in gastric cancer as well as its correlation with survival prognosis, immunity, the TME, MSI/TMB, IC50 of common chemotherapeutic drugs for gastric cancer and drug sensitivity. Our research is expected to provide a new direction for targeted and immunotherapy of gastric cancer.
Data Availability Statement
Publicly available datasets were analyzed in this study. This data can be found here: Publicly available datasets were analyzed in this study. The datasets analyzed for this study can be found in the following databases: TCGA (https://cancergenome.nih.gov/), UCSC Xena (https://xenabrowser.net/datapages/), Oncomine (www.oncomine.org), cBioportal (https://www.cbioportal.org/), UALCAN (http://UALCAN.path.uab.edu/), and GeneMANIA (http://www.genemania.org).
Author Contributions
RX and MY conceived and designed the study and assisted in writing the manuscript. MY and YJ performed the data analyses and contributed to the writing of the manuscript. YJ and RX reviewed the manuscript. All authors contributed to the article and approved the submitted version.
Funding
This study was supported by grants from the Wenzhou Science & Technology Bureau (Y20180089) and Zhejiang Xinmiao Talents Program (No. 2021R413054).
Conflict of Interest
The authors declare that the research was conducted in the absence of any commercial or financial relationships that could be construed as a potential conflict of interest.
Publisher’s Note
All claims expressed in this article are solely those of the authors and do not necessarily represent those of their affiliated organizations or those of the publisher, the editors, and the reviewers. Any product that may be evaluated in this article, or claim that may be made by its manufacturer, is not guaranteed or endorsed by the publisher.
Supplementary Material
The Supplementary Material for this article can be found online at: https://www.frontiersin.org/articles/10.3389/fcell.2022.790947/full#supplementary-material
References
Anderson, N. M., and Simon, M. C. (2020). The Tumor Microenvironment. Curr. Biol. 30 (16), R921–R925. doi:10.1016/j.cub.2020.06.081
Bader, J. E., Voss, K., and Rathmell, J. C. (2020). Targeting Metabolism to Improve the Tumor Microenvironment for Cancer Immunotherapy. Mol. Cel. 78 (6), 1019–1033. doi:10.1016/j.molcel.2020.05.034
Bei, Y., Cheng, N., Chen, T., Shu, Y., Yang, Y., Yang, N., et al. (2020). CDK5 Inhibition Abrogates TNBC Stem‐Cell Property and Enhances Anti‐PD‐1 Therapy. Adv. Sci. 7 (22), 2001417. doi:10.1002/advs.202001417
Biagioni, A., Skalamera, I., Peri, S., Schiavone, N., Cianchi, F., Giommoni, E., et al. (2019). Update on Gastric Cancer Treatments and Gene Therapies. Cancer Metastasis Rev. 38 (3), 537–548. doi:10.1007/s10555-019-09803-7
Binnewies, M., Roberts, E. W., Kersten, K., Chan, V., Fearon, D. F., Merad, M., et al. (2018). Understanding the Tumor Immune Microenvironment (TIME) for Effective Therapy. Nat. Med. 24 (5), 541–550. doi:10.1038/s41591-018-0014-x
Bray, F., Ferlay, J., Soerjomataram, I., Siegel, R. L., Torre, L. A., and Jemal, A. (2018). Global Cancer Statistics 2018: GLOBOCAN Estimates of Incidence and Mortality Worldwide for 36 Cancers in 185 Countries. CA: a Cancer J. clinicians 68 (6), 394–424. doi:10.3322/caac.21492
Cai, L., Sun, Y., Wang, K., Guan, W., Yue, J., Li, J., et al. (2020). The Better Survival of MSI Subtype Is Associated with the Oxidative Stress Related Pathways in Gastric Cancer. Front. Oncol. 10, 1269. doi:10.3389/fonc.2020.01269
Cerami, E., Gao, J., Dogrusoz, U., Gross, B. E., Sumer, S. O., Aksoy, B. A., et al. (2012). The cBio Cancer Genomics Portal: An Open Platform for Exploring Multidimensional Cancer Genomics Data: Figure 1. Cancer Discov. 2 (5), 401–404. doi:10.1158/2159-8290.Cd-12-0095
Chandrashekar, D. S., Bashel, B., Balasubramanya, S. A. H., Creighton, C. J., Ponce-Rodriguez, I., Chakravarthi, B. V. S. K., et al. (2017). UALCAN: A Portal for Facilitating Tumor Subgroup Gene Expression and Survival Analyses. Neoplasia 19 (8), 649–658. doi:10.1016/j.neo.2017.05.002
da Silva, J. L., Dos Santos, A. L. S., Nunes, N. C. C., de Moraes Lino da Silva, F., Ferreira, C. G. M., and de Melo, A. C. (2019). Cancer Immunotherapy: the Art of Targeting the Tumor Immune Microenvironment. Cancer Chemother. Pharmacol. 84 (2), 227–240. doi:10.1007/s00280-019-03894-3
Deng, H., Tan, S., Gao, X., Zou, C., Xu, C., Tu, K., et al. (2020). Cdk5 Knocking Out Mediated by CRISPR-Cas9 Genome Editing for PD-L1 Attenuation and Enhanced Antitumor Immunity. Acta Pharmaceutica Sinica. B 10 (2), 358–373. doi:10.1016/j.apsb.2019.07.004
Do, P. A., and Lee, C. H. (2020). The Role of CDK5 in Tumours and Tumour Microenvironments. Cancers 13 (1), 101. doi:10.3390/cancers13010101
Fu, T., Dai, L.-J., Wu, S.-Y., Xiao, Y., Ma, D., Jiang, Y.-Z., et al. (2021). Spatial Architecture of the Immune Microenvironment Orchestrates Tumor Immunity and Therapeutic Response. J. Hematol. Oncol. 14 (1), 98. doi:10.1186/s13045-021-01103-4
Goff, P. H., Zeng, J., Rengan, R., and Schaub, S. K. (2021). Radiation and Modulation of the Tumor Immune Microenvironment in Non-small Cell Lung Cancer. Semin. Radiat. Oncol. 31 (2), 133–139. doi:10.1016/j.semradonc.2020.11.010
Goldman, M. J., Craft, B., Hastie, M., Repečka, K., McDade, F., Kamath, A., et al. (2020). Visualizing and Interpreting Cancer Genomics Data via the Xena Platform. Nat. Biotechnol. 38 (6), 675–678. doi:10.1038/s41587-020-0546-8
Gómez-Maldonado, L., Tiana, M., Roche, O., Prado-Cabrero, A., Jensen, L., Fernandez-Barral, A., et al. (2015). EFNA3 Long Noncoding RNAs Induced by Hypoxia Promote Metastatic Dissemination. Oncogene 34 (20), 2609–2620. doi:10.1038/onc.2014.200
Gong, Z., Chu, H., Chen, J., Jiang, L., Gong, B., Zhu, P., et al. (2021). DEPDC1 Upregulation Promotes Cell Proliferation and Predicts Poor Prognosis in Patients with Gastric Cancer. Cbm 30 (3), 299–307. doi:10.3233/cbm-201760
Guo, Y., and He, Y. (2020). Comprehensive Analysis of the Expression of SLC30A Family Genes and Prognosis in Human Gastric Cancer. Sci. Rep. 10 (1), 18352. doi:10.1038/s41598-020-75012-w
Han, S., Huang, K., Gu, Z., and Wu, J. (2020). Tumor Immune Microenvironment Modulation-Based Drug Delivery Strategies for Cancer Immunotherapy. Nanoscale 12 (2), 413–436. doi:10.1039/c9nr08086d
Hong, H. N., Won, Y. J., Shim, J. H., Kim, H. J., Han, S. H., Kim, B. S., et al. (2018). Cancer-associated Fibroblasts Promote Gastric Tumorigenesis through EphA2 Activation in a Ligand-independent Manner. J. Cancer Res. Clin. Oncol. 144 (9), 1649–1663. doi:10.1007/s00432-018-2683-8
Ieguchi, K., and Maru, Y. (2021). Eph/Ephrin Signaling in the Tumor Microenvironment. Adv. Exp. Med. Biol. 1270, 45–56. doi:10.1007/978-3-030-47189-7_3
Jia, Y., Liu, L., and Shan, B. (2020). Future of Immune Checkpoint Inhibitors: Focus on Tumor Immune Microenvironment. Ann. Transl Med. 8 (17), 1095. doi:10.21037/atm-20-3735
Kim, J., Kim, B., Kang, S. Y., Heo, Y. J., Park, S. H., Kim, S. T., et al. (2020). Tumor Mutational Burden Determined by Panel Sequencing Predicts Survival after Immunotherapy in Patients with Advanced Gastric Cancer. Front. Oncol. 10, 314. doi:10.3389/fonc.2020.00314
Kim, S.-W., Roh, J., Lee, H. S., Ryu, M.-H., Park, Y.-S., and Park, C.-S. (2021). Expression of the Immune Checkpoint Molecule V-Set Immunoglobulin Domain-Containing 4 Is Associated with Poor Prognosis in Patients with Advanced Gastric Cancer. Gastric Cancer 24 (2), 327–340. doi:10.1007/s10120-020-01120-1
Koh, H. M., Hyun, C. L., Jang, B. G., and Lee, H. J. (2020). Ephrin Receptor B2 Expression May Be a Prognostic Marker for Patients with Cancer: A Meta-Analysis. Anticancer Res. 40 (8), 4309–4317. doi:10.21873/anticanres.14433
Lee, H., Na, K. J., and Choi, H. (2021). Differences in Tumor Immune Microenvironment in Metastatic Sites of Breast Cancer. Front. Oncol. 11, 649004. doi:10.3389/fonc.2021.649004
Leite, M., Marques, M. S., Melo, J., Pinto, M. T., Cavadas, B., Aroso, M., et al. (2020). Helicobacter Pylori Targets the EPHA2 Receptor Tyrosine Kinase in Gastric Cells Modulating Key Cellular Functions. Cells 9 (2), 513. doi:10.3390/cells9020513
Li, B., Jiang, Y., Li, G., Fisher, G. A., and Li, R. (2020). Natural Killer Cell and Stroma Abundance Are Independently Prognostic and Predict Gastric Cancer Chemotherapy Benefit. JCI insight 5 (9). doi:10.1172/jci.insight.136570
Li, S., Hou, X., Wu, C., Han, L., Li, Q., Wang, J., et al. (2020). MiR-645 Promotes Invasiveness, Metastasis and Tumor Growth in Colorectal Cancer by Targeting EFNA5. Biomed. Pharmacother. 125, 109889. doi:10.1016/j.biopha.2020.109889
Li, T., Fu, J., Zeng, Z., Cohen, D., Li, J., Chen, Q., et al. (2020). TIMER2.0 for Analysis of Tumor-Infiltrating Immune Cells. Nucleic Acids Res. 48, W509–W514. doi:10.1093/nar/gkaa407
Li, Y., Nie, Y., Cao, J., Tu, S., Lin, Y., Du, Y., et al. (2014). G-A Variant in miR-200c Binding Site ofEFNA1alters Susceptibility to Gastric Cancer. Mol. Carcinog. 53 (3), 219–229. doi:10.1002/mc.21966
Li, Y., Wang, J.-S., Zhang, T., Wang, H.-C., and Li, L.-P. (2020). Identification of New Therapeutic Targets for Gastric Cancer with Bioinformatics. Front. Genet. 11, 865. doi:10.3389/fgene.2020.00865
Liang, Z., Wang, X., Dong, K., Li, X., Qin, C., and Zhou, H. (2021). Expression Pattern and Prognostic Value of EPHA/EFNA in Breast Cancer by Bioinformatics Analysis: Revealing its Importance in Chemotherapy. Biomed. Research International 2021, 1–20. doi:10.1155/2021/5575704
Lin, J., Zeng, C., Zhang, J., Song, Z., Qi, N., Liu, X., et al. (2021). EFNA4 Promotes Cell Proliferation and Tumor Metastasis in Hepatocellular Carcinoma through a PIK3R2/GSK3β/β-Catenin Positive Feedback Loop. Mol. Ther. - Nucleic Acids 25, 328–341. doi:10.1016/j.omtn.2021.06.002
Liu, F., Yang, Z., Zheng, L., Shao, W., Cui, X., Wang, Y., et al. (2021). A Tumor Progression Related 7-Gene Signature Indicates Prognosis and Tumor Immune Characteristics of Gastric Cancer. Front. Oncol. 11, 690129. doi:10.3389/fonc.2021.690129
Liu, H., Ni, S., Wang, H., Zhang, Q., and Weng, W. (2020). Charactering Tumor Microenvironment Reveals Stromal‐related Transcription Factors Promote Tumor Carcinogenesis in Gastric Cancer. Cancer Med. 9 (14), 5247–5257. doi:10.1002/cam4.3133
Liu, J.-B., Jian, T., Yue, C., Chen, D., Chen, W., Bao, T.-T., et al. (2019). Chemo-resistant Gastric Cancer Associated Gene Expression Signature: Bioinformatics Analysis Based on Gene Expression Omnibus. Anticancer Res. 39 (4), 1689–1698. doi:10.21873/anticanres.13274
Ma, W., Li, W., Xu, L., Liu, L., Xia, Y., Yang, L., et al. (2021). Identification of a Gene Prognostic Model of Gastric Cancer Based on Analysis of Tumor Mutation Burden. Pathol. Oncol. Res. 27, 1609852. doi:10.3389/pore.2021.1609852
Miceli, R., An, J., Di Bartolomeo, M., Morano, F., Kim, S. T., Park, S. H., et al. (2019). Prognostic Impact of Microsatellite Instability in Asian Gastric Cancer Patients Enrolled in the ARTIST Trial. Oncology 97 (1), 38–43. doi:10.1159/000499628
Miyazaki, K., Inokuchi, M., Takagi, Y., Kato, K., Kojima, K., and Sugihara, K. (2013). EphA4 Is a Prognostic Factor in Gastric Cancer. BMC Clin. Pathol. 13 (1), 19. doi:10.1186/1472-6890-13-19
Nakamura, R., Kataoka, H., Sato, N., Kanamori, M., Ihara, M., Igarashi, H., et al. (2005). EPHA2/EFNA1 Expression in Human Gastric Cancer. Cancer Sci. 96 (1), 42–47. doi:10.1111/j.1349-7006.2005.00007.x
Oya, Y., Hayakawa, Y., and Koike, K. (2020). Tumor Microenvironment in Gastric Cancers. Cancer Sci. 111 (8), 2696–2707. doi:10.1111/cas.14521
Pei, J.-P., Zhang, C.-D., Yusupu, M., Zhang, C., and Dai, D.-Q. (2021). Screening and Validation of the Hypoxia-Related Signature of Evaluating Tumor Immune Microenvironment and Predicting Prognosis in Gastric Cancer. Front. Immunol. 12, 705511. doi:10.3389/fimmu.2021.705511
Peng, C., Liu, J., Yang, G., and Li, Y. (2018). The Tumor-Stromal Ratio as a strong Prognosticator for Advanced Gastric Cancer Patients: Proposal of a New TSNM Staging System. J. Gastroenterol. 53 (5), 606–617. doi:10.1007/s00535-017-1379-1
Peng, Q., Chen, L., Wu, W., Wang, J., Zheng, X., Chen, Z., et al. (2018). EPH Receptor A2 Governs a Feedback Loop that Activates Wnt/β-Catenin Signaling in Gastric Cancer. Cell Death Dis 9 (12), 1146. doi:10.1038/s41419-018-1164-y
Polom, K., Marano, L., Marrelli, D., De Luca, R., Roviello, G., Savelli, V., et al. (2018). Meta-analysis of Microsatellite Instability in Relation to Clinicopathological Characteristics and Overall Survival in Gastric Cancer. Br. J. Surg. 105 (3), 159–167. doi:10.1002/bjs.10663
Pu, Y., Wen, X., Jia, Z., Xie, Y., Luan, C., Yu, Y., et al. (2021). Association between Polymorphisms in Gastric Cancer Related Genes and Risk of Gastric Cancer: A Case-Control Study. Front. Mol. Biosci. 8, 690665. doi:10.3389/fmolb.2021.690665
Puliga, E., Corso, S., Pietrantonio, F., and Giordano, S. (2021). Microsatellite Instability in Gastric Cancer: Between Lights and Shadows. Cancer Treat. Rev. 95, 102175. doi:10.1016/j.ctrv.2021.102175
Rhodes, D. R., Yu, J., Shanker, K., Deshpande, N., Varambally, R., Ghosh, D., et al. (2004). ONCOMINE: a Cancer Microarray Database and Integrated Data-Mining Platform. Neoplasia 6 (1), 1–6. doi:10.1016/s1476-5586(04)80047-2
Rodriquenz, M. G., Roviello, G., D’Angelo, A., Lavacchi, D., Roviello, F., and Polom, K. (2020). MSI and EBV Positive Gastric Cancer's Subgroups and Their Link with Novel Immunotherapy. Jcm 9 (5), 1427. doi:10.3390/jcm9051427
Rudno-Rudzińska, J., Kielan, W., Kielan, W., Frejlich, E., Kotulski, K., Hap, W., et al. (2017). A Review on Eph/ephrin, Angiogenesis and Lymphangiogenesis in Gastric, Colorectal and Pancreatic Cancers. Chin. J. Cancer Res. = Chung-kuo yen Cheng yen chiu 29 (4), 303–312. doi:10.21147/j.issn.1000-9604.2017.04.03
Song, Z., Wu, Y., Yang, J., Yang, D., and Fang, X. (2017). Progress in the Treatment of Advanced Gastric Cancer. Tumour Biol. 39 (7), 101042831771462. doi:10.1177/1010428317714626
Strozen, T. G., Sharpe, J. C., Harris, E. D., Uppalapati, M., and Toosi, B. M. (2021). The EphB6 Receptor: Kinase-Dead but Very Much Alive. Ijms 22 (15), 8211. doi:10.3390/ijms22158211
Szklarczyk, D., Gable, A. L., Lyon, D., Junge, A., Wyder, S., Huerta-Cepas, J., et al. (2019). STRING V11: Protein-Protein Association Networks with Increased Coverage, Supporting Functional Discovery in Genome-wide Experimental Datasets. Nucleic Acids Res. 47, D607–D613. doi:10.1093/nar/gky1131
Taube, J. M., Galon, J., Sholl, L. M., Rodig, S. J., Cottrell, T. R., Giraldo, N. A., et al. (2018). Implications of the Tumor Immune Microenvironment for Staging and Therapeutics. Mod. Pathol. 31 (2), 214–234. doi:10.1038/modpathol.2017.156
Uchiyama, S., Saeki, N., and Ogawa, K. (2015). Aberrant EphB/ephrin-B Expression in Experimental Gastric Lesions and Tumor Cells. Wjg 21 (2), 453–464. doi:10.3748/wjg.v21.i2.453
Van Cutsem, E., Sagaert, X., Topal, B., Haustermans, K., and Prenen, H. (2016). Gastric Cancer. The Lancet 388 (10060), 2654–2664. doi:10.1016/s0140-6736(16)30354-3
Wang, L., Song, Y., Wang, H., Liu, K., Shao, Z., and Shang, Z. (2020). MiR‐210‐3p‐EphrinA3‐PI3K/AKT axis Regulates the Progression of Oral Cancer. J. Cel Mol Med 24 (7), 4011–4022. doi:10.1111/jcmm.15036
Warde-Farley, D., Donaldson, S. L., Comes, O., Zuberi, K., Badrawi, R., Chao, P., et al. (2010). The GeneMANIA Prediction Server: Biological Network Integration for Gene Prioritization and Predicting Gene Function. Nucleic Acids Res. 38, W214–W220. doi:10.1093/nar/gkq537
Wei, Q., Xu, Q., Yuan, X., Li, J. J., Chen, L., Luo, C., et al. (2021). Immunological Impact of Chemotherapy on the Tumor Microenvironment in Gastric Cancer. J. Surg. Oncol. 123 (8), 1708–1715. doi:10.1002/jso.26449
Wei, X.-L., Xu, J.-Y., Wang, D.-S., Chen, D.-L., Ren, C., Li, J.-N., et al. (2021). Baseline Lesion Number as an Efficacy Predictive and Independent Prognostic Factor and its Joint Utility with TMB for PD-1 Inhibitor Treatment in Advanced Gastric Cancer. Ther. Adv. Med. Oncol. 13, 175883592198899. doi:10.1177/1758835921988996
Yang, F., Wang, Z., and Zhang, X. (2021). Tumor Microenvironment Characterization in Stage IV Gastric Cancer. Biosci. Rep. 41 (1). doi:10.1042/bsr20201248
Yang, L., Bie, L., Sun, L., and Yue, Y. (2019). Neural Activities Are Unfavorable for the Prognosis of Ovarian Cancer through mRNA Expression Analysis. Biomarkers Med. 13 (8), 663–673. doi:10.2217/bmm-2019-0056
Yin, J., Li, Z., Ye, L., Birkin, E., Li, L., Xu, R., et al. (2020). EphB2 Represents an Independent Prognostic Marker in Patients with Gastric Cancer and Promotes Tumour Cell Aggressiveness. J. Cancer 11 (10), 2778–2787. doi:10.7150/jca.38098
Zeng, D., Wu, J., Luo, H., Li, Y., Xiao, J., Peng, J., et al. (2021). Tumor Microenvironment Evaluation Promotes Precise Checkpoint Immunotherapy of Advanced Gastric Cancer. J. Immunother. Cancer 9 (8), e002467. doi:10.1136/jitc-2021-002467
Zhang, H., and Chen, J. (2018). Current Status and Future Directions of Cancer Immunotherapy. J. Cancer 9 (10), 1773–1781. doi:10.7150/jca.24577
Zhao, Y., Cai, C., Zhang, M., Shi, L., Wang, J., Zhang, H., et al. (2021). Ephrin-A2 Promotes Prostate Cancer Metastasis by Enhancing Angiogenesis and Promoting EMT. J. Cancer Res. Clin. Oncol. 147 (7), 2013–2023. doi:10.1007/s00432-021-03618-2
Zhuo, W., Liu, Y., Li, S., Guo, D., Sun, Q., Jin, J., et al. (2019). Long Noncoding RNA GMAN, Up-Regulated in Gastric Cancer Tissues, Is Associated with Metastasis in Patients and Promotes Translation of Ephrin A1 by Competitively Binding GMAN-AS. Gastroenterology 156 (3), 676–691. e611. doi:10.1053/j.gastro.2018.10.054
Glossary
AUC area under curve
BLCA bladder urothelial carcinoma
BRCA breast invasive carcinoma
CDK5 cyclin-dependent kinase 5
CHOL cholangiocarcinoma
CI 95% confidence interval
DFS disease-free survival
DNA-ss DNA stemness score
EFN Eph/ephrin
Eph erythropoietin-producing hepatocyte
GBM glioblastoma multiforme
GDC Genomic Data Commons
GDSC Genomics of Drug Sensitivity in Cancer
IC50 half-maximal inhibitory concentration
MSI microsatellite instability
NK natural killer
OS overall survival
PPI protein-protein interaction
RNA-seq RNA-sequencing
RNA-ss RNA stemness score
ROC receiver operating characteristic
TCGA The Cancer Genome Atlas
TIME tumor immune microenvironmen
TMB tumor mutational burden
TME tumor microenvironment
Tregs regulatory T cells
ESCA Esophageal carcinoma
STAD Stomach adenocarcinoma
UCEC Uterine corpus endometrial carcinoma
LIHC Liver hepatocellular carcinoma
LUAD Lung adenocarcinoma
LUSC Lung squamous cell carcinoma
KICH Kidney cancer
HNSCC Head and neck squamous cell carcinoma
PRAD Prostate adenocarcinoma
KIRP Kidney renal papillary cell carcinoma
THCA Thyroid carcinoma
KIRC Kidney renal clear cell carcinoma
TGCT Testicular germ cell tumor
THYM Thymoma
COAD Colon adenocarcinoma
READ Rectum adenocarcinoma
ACC Adrenocortical carcinoma
CESC Cervical cancer, Cervical squamous cell carcinoma and endocervical adenocarcinoma
DLBC Lymphoid neoplasm diffuse large B-cell lymphoma
HNSC Head and neck squamous cell carcinoma
LAML Acute myeloid leukemia
LGG Brain lower grade glioma
OV Ovarian cancer
MESO Mesotheliom
PAAD Pancreatic cancer endocrine neoplasms
PCPG Pheochromocytoma and Paraganglioma
SARC Sarcoma
SKCM Skin cutaneous melanoma
UCS Uterine carcinosarcoma
UVM Uveal melanoma
Keywords: EFNA, gastric cancer, tumor microenvironment, immune cell infiltration, drug sensitivity, microsatellite instability, tumor mutational burden, immune checkpoint
Citation: Xie R, Yuan M and Jiang Y (2022) The Pan-Cancer Crosstalk Between the EFNA Family and Tumor Microenvironment for Prognosis and Immunotherapy of Gastric Cancer. Front. Cell Dev. Biol. 10:790947. doi: 10.3389/fcell.2022.790947
Received: 07 October 2021; Accepted: 08 February 2022;
Published: 02 March 2022.
Edited by:
Yongqian Shu, Nanjing Medical University, ChinaReviewed by:
Fenglei Wu, The First People’s Hospital of Lianyungang, ChinaLingyun Wu, Shanghai Jiao Tong University, China
Copyright © 2022 Xie, Yuan and Jiang. This is an open-access article distributed under the terms of the Creative Commons Attribution License (CC BY). The use, distribution or reproduction in other forums is permitted, provided the original author(s) and the copyright owner(s) are credited and that the original publication in this journal is cited, in accordance with accepted academic practice. No use, distribution or reproduction is permitted which does not comply with these terms.
*Correspondence: Yiyan Jiang, jiangyiyan@wzhospital.cn
†These authors have contributed equally to this work