Green roof infrastructure outperforms grey technology in flood mitigation in São Paulo’s urbanized region
 Mauricio Jonas Ferreira
  Humberto Ribeiro da Rocha*
- Climate and Biosphere Laboratory, Department of Atmospheric Sciences, Institute of Astronomy, Geophysics, and Atmospheric Sciences, University of São Paulo, São Paulo, SP, Brazil
São Paulo City, Brazil, a densely urbanized area in a tropical climate region, is facing increasing challenges from flooding. However, a promising solution has emerged in the form of Nature-Based Solutions (NBS) infrastructure, surpassing traditional grey technology in flood mitigation. This article examines the effectiveness of green roofs in reducing flood risks and highlights their superiority over conventional approaches. We analyzed the direct impacts of surface permeabilization in public areas (sidewalks, streets, and squares) and private areas (urban lots, subdivisions) on runoff volume and peak flow in the Aricanduva River basin in São Paulo city. We used a thoroughly validated hydrological model to compare the interference in the land use of the watershed between a green infrastructure type called Green Roof (GR) and a gray technology called Permeable Pavement (PP), in terms of hydrological efficiency in mitigating floods. The flow and water level simulations for varying areas with GR or PP covered a wide range, allowing for situations above or below the canal overflow level, which provided a good distinction of the impact of boundary conditions. Overall, we observed a positive hydrological response, with a reduction in peak flow and runoff volume proportional to the increase in permeable area, and consequently, proportional to the increase in GR or PP surface within the contributing area. As the main contribution, the hydrological performance calculated with the variation of GR was remarkably superior to the variation of PP in terms of requiring a smaller coverage area with interference to prevent overflow or achieve equivalent efficiency. It is worth noting that the substitution of approximately 24% of the gray roof area with GR prevented canal overflow, which is notably lower than the required substitution of approximately 40% for PP interference. We reinforce the relevance of green roofs as an option to mitigate intense hydrological effects in urban areas and, more importantly, paves the way for other NBS with the same hydrological principles and environmental co-benefits to work individually or in combination.
1 Introduction
Urbanized areas represent a small fraction, up to 5%, of the planet’s occupied surface, but they concentrate some of the major sustainability challenges due to population density (Seto et al., 2010). Between 1950 and 2020, the global population in urbanized areas grew from 30% to 56%, while in Brazil, the increase was much greater, from 36% to 87%, exemplified by the São Paulo Metropolitan Region (RMSP), which experienced a growth of approximately 11 times, from 2 to 22 million inhabitants, while Brazil’s population only grew 4 times (from 54 to 214 million inhabitants) during the same period (IBGE, 2022; UN, 2022).
In developing countries, this rapid urban growth has brought problems for basic social services (Semadeni-Davies et al., 2008; Seto et al., 2010), and especially due to changes in land use management, it has affected the environment, health, and wellbeing of the population. For example, it has resulted in reduced thermal comfort, increased air, water, and soil pollution, and an increase in flooding events (Oleson et al., 2015; Liang et al., 2019).
The irregular growth of urban areas, especially in large cities, can alter the formation, intensity, trajectory, and duration of precipitation events (Xiaomeng et al., 2021). For instance, the increase in convective precipitation during the summer in Beijing, China, stimulated by the urban heat island effect and increased surface roughness, intensified by the convergence of atmospheric moisture transport in the urban boundary layer (Ganeshan et al., 2013; Dou et al., 2015).
The climate change, this has led to an increase in the frequency and magnitude of intense rainfall, consequently increasing runoff volume and peak flow in urban areas (Nobre et al., 2011; Silva Dias et al., 2013; Pathak and Eastaff, 2014).
Between 1995 and 2015, a total of 7,130 natural disaster cases were recorded globally, with 43% attributed to floods, resulting in 157,000 casualties and over $662 billion in damages. In South America, for example, an average of 560,000 people were affected by floods each year between 1995 and 2004, reaching 2.2 million people between 2005 and 2014 (UNISDR, 2015). The increasing impermeability of urban areas mainly contributes to increased surface runoff and peak flow, and it is possible to project potential hydrological impacts through simulations (Arnold and Gibbon, 1996). These impacts directly affect individuals, public and private properties, and the local, regional, and national economy (Hallegatte et al., 2013; Haddad and Teixeira, 2015; Klomp, 2015).
Dealing with present challenges is difficult due to past structural solutions of engineering that have resulted in socio-environmental degradation (Brink et al., 2016). To address these issues in urban areas, a combination of structural and non-structural measures can be implemented for stormwater management. These measures are based on sustainable low-impact development practices and aim to mitigate the negative impacts of floods on society and the economy (Culligan, 2019; Liu et al., 2020a; Liu et al., 2020b). Cities with good governance practices often face social, environmental, and economic problems with innovative and multifunctional nature-inspired solutions (Allaire, 2018; Yildirim and Demir, 2019; Ghafouri and Weber, 2020; Miyahara et al., 2022). This includes the assessment of flood risks and the proposal of efficient mitigation actions (Cummings et al., 2012; Tate et al., 2015; Alabbad and Demir, 2022).
Among current stormwater management practices, gray infrastructure solutions include precipitation retention reservoirs used in São Paulo (DAEE, 2013), as well as other yet-to-be-implemented options like permeable pavement (PP). Green infrastructure options include green roofs (GR), which are accepted by public officials and users as a technical solution for rainwater reuse (Bianchini and Hewage, 2012), as well as the revegetation of sidewalks and open residential spaces (Culligan, 2019; Liu et al., 2020a).
Conventional roofs of the paved public and private areas significantly contribute to the volume of water in the micro and macro drainage network. Although it is known that intensive GRs, with a substrate depth >15 cm, provide greater stormwater mitigation, most studies focus on extensive GRs with relatively shallow substrates (<15 cm). The use of intensive GRs in large-scale projects is limited due to their high weight (approximately 300 kg/m2) and high initial construction and maintenance costs. As a result, extensive GRs are more commonly employed in these projects, given their lower weight (around 70 kg/m2) and more accessible installation and maintenance expenses (Zheng et al., 2021). GRs retain an average of 67% of rainfall, with the retention percentage varying based on the precipitation event volume (Berndtsson, 2010; Muhammad et al., 2018; Joshi and Teller, 2021). Notably, for rainfall events of less than 10 mm, GRs can retain about 100% of the rain (Zheng et al., 2021).
Permeable pavement (PP) is used in commerce and residences, providing hydrological benefits. It increases infiltration rates from 40 mm/h up to 110 mm/h (Bateni et al., 2021). Commercially, PP is available in five categories: permeable asphalt, permeable concrete, permeable interlocking concrete pavement, and concrete or plastic grid pavements filled with grass, sand, and gravel. The hydrological performance of all types of permeable pavement (PP) reduces peak flow by 50%–90% and can achieve a variety of rainwater volume reduction from 50% to 100% (Collins et al., 2008; Gomez-Ullate et al., 2011; Bateni et al., 2021). The degree of reduction depends on factors such as construction design, material quality, and regular maintenance (Lin et al., 2014; Barszcz, 2015; Weiss et al., 2015).
The complexity of an urban flooding event favors the use of hydrological modeling, which deals with extreme precipitation events and evaluates channel flow volume, flood level, and duration, under a detailed prescription of boundary conditions involving permeability and water retention parameters. Numerical simulations allow for the assessment of flood impacts, alert procedures, population evacuation, and assist in land use planning to improve human wellbeing, reducing material losses and human lives (Rangari et al., 2021; Teague et al., 2021; Alabbad and Demir, 2022).
The city of São Paulo is a typical location with recurrent flooding problems (Escobar-Silva et al., 2023), for example, in the urban basin of the Aricanduva River, where challenges are frequent and severe, including disruptions in mobility, property damage, loss of lives, injuries, property devaluation, loss of working and leisure hours, health problems, and mental stress (Santos and Haddad, 2014; Haddad and Teixeira, 2015; Simas, 2017).
Driven by the recognition of knowledge gaps related to strategic issues of urban water security and contemporary technological alternatives that employ Nature-Based Solutions (NBS), our study aims to deepen the hydrological response of a highly urbanized watershed within São Paulo. We seek to assess the effectiveness of green infrastructure, such as green roofs, and permeable pavement technologies, in enhancing hydrological efficiency for flood mitigation during periods of extreme weather events.
2 Materials and methods
2.1 Climate and land use characteristics
The study area is in the Aricanduva River basin, a left-bank tributary of the Tietê River, which is highly urbanized. It is situated in the eastern zone of the city of São Paulo and is part of a cluster of 39 municipalities that make up the urban conurbation of the São Paulo metropolitan region (Figure 1A). The basin stretches for approximately 20 km in the SSE-NNW direction and covers an area of 100.62 km2. The elevation ranges from 994 m above sea level (asl) upstream to 718 m downstream (Figure 1B). The climate in the study area is characterized by a humid summer from October to March and a dry winter from May to August. Precipitation levels vary seasonally, with a climatological average of 211 mm in February during the high wet season, and 38 mm in August during the dry season (EM, 2020).
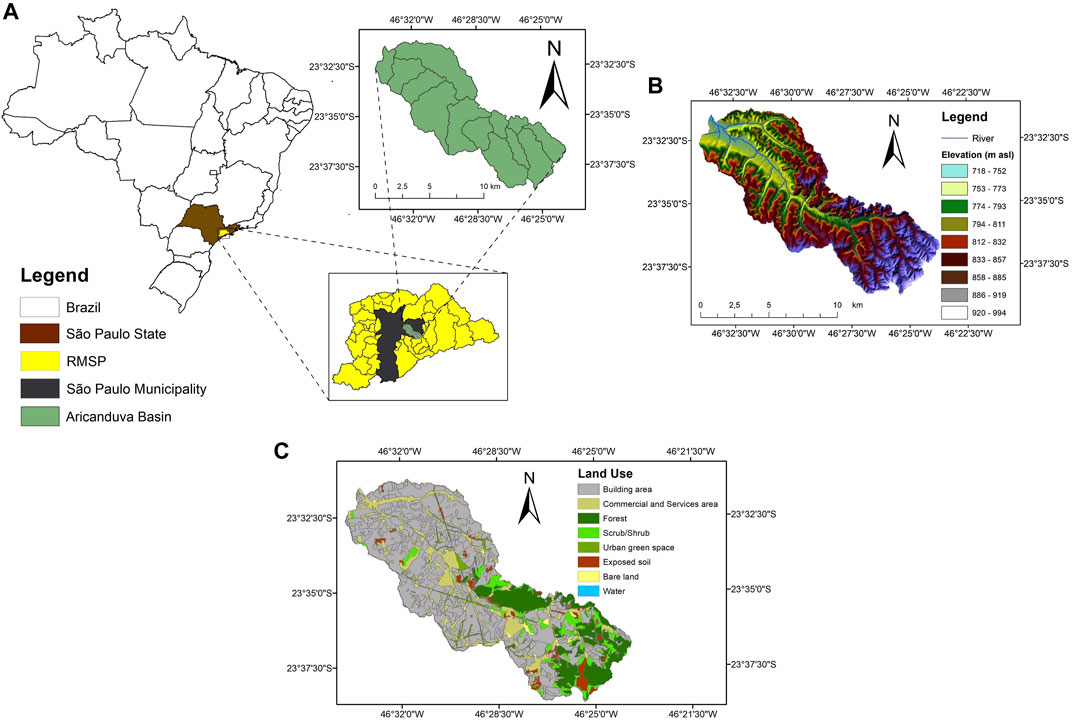
FIGURE 1. (A) Location of Aricanduva River Basin; (B) Digital Elevation Model of the basin using LiDAR3D data. The blue lines show the drainage pattern; (C) land use. Source: GeoSampa (2020).
The classification of land use and land cover, based on physical aspects, shape, and surface texture, obtained using high spatial resolution satellite images (SPOT 2.5 m, Rapid Eye 5 m) and orthophotos (1 m) (Rossini-Penteado et al., 2007; Rossini-Penteado and Gilberti, 2008), resulting in eight distinct classes (Table 1).
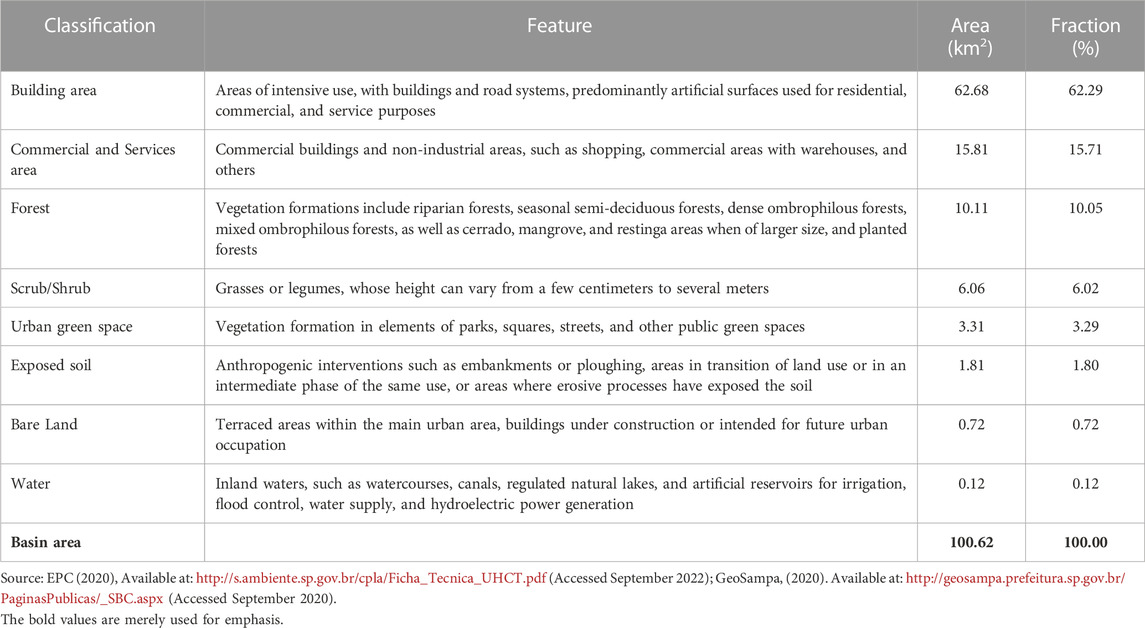
TABLE 1. Classification of homogeneous urban land occupation and land use units, area, and fraction of land use and occupation in the Aricanduva River Basin.
The Aricanduva River basin is occupied by approximately 62% of small residential, commercial, and service buildings, as well as streets and sidewalks. It is occupied by 16% of large commercial buildings such as malls, commercial warehouses, and others. Vegetation covers 19% of the area, including urban forests, shrubs, grasslands, and trees in public spaces. Approximately 3% of the area consists of exposed soil without buildings or vegetation, transitioning into urban development (Table 1; Figure 1C).
2.2 Conditions for hydrological modelling
The boundary conditions and meteorological forcing for the hydrological modelling were defined using a database containing topographic, geological available at: http://geosampa.prefeitura.sp.gov.br/PaginasPublicas/_SBC.aspx, meteorological and hydrological information available at: https://www.saisp.br/estaticos/sitenovo/home.html.
These following conditions are essential to set up the model simulations in the study area:
i) Topography and soils: Digital elevation model with 0.1 m resolution using LiDAR 3D data in the urban area (Figure 2), and soil classes used to estimate the Curve Number (CN) of the basin for the HEC-HMS model, obtained from GEOSAMPA/Secretaria Municipal de Urbanismo e Licenciamento (SMUL) of the city of São Paulo.
ii) Precipitation and streamflow: 10-min resolution data measured at 4 gauges in the telemetric network of the São Paulo Flood Alert System (SAISP/FCTH) (Table 2).
iii) Retention volume, stage-storage relation, and stage-discharge relation of the 8 detention reservoirs (piscinões) in the Aricanduva River basin, provided by the Department of Water and Electric Energy of São Paulo State. Reservoirs 1–4 are gravity-controlled for drainage, while Reservoir 5 is pumped for drainage (Figure 2).
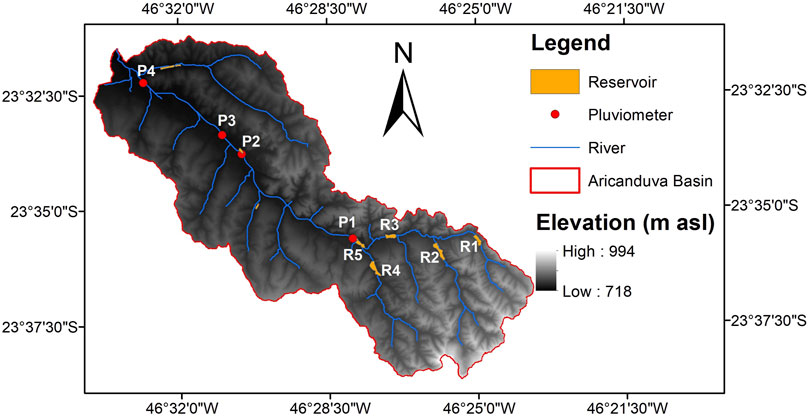
FIGURE 2. Digital Elevation Model (DEM) of the Aricanduva River Basin. Red circles indicate the position of rainfall and water level gauges (P1–P4). Orange areas are buffering reservoirs (piscinões) R1–R5 upstream of the gauge P2. Source: GeoSampa (2020).
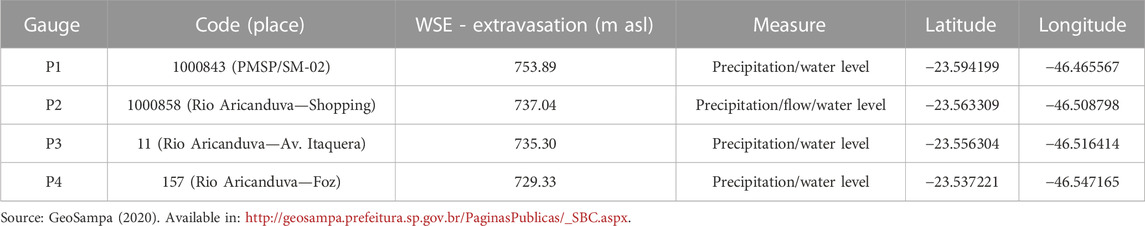
TABLE 2. Measurement locations (P1 to P4) with data at a 10-min resolution for precipitation, runoff, and water level. WSE: Aricanduva River overflow level.
The flow and water level data observed at 10-min intervals during flood events underwent quality control procedures, including the application of filters to identify faults, sensor malfunctions, spurious records, and extreme values. Consistency checks were performed in three stages, following Feng et al. (2004) and Tomaz (2016): 1) Removal of values outside prescribed thresholds for maximum and minimum values; 2) Analysis of data from the previous and subsequent days for each event in the station series to detect inconsistent sequences; 3) Exclusion of inconsistent data by comparison with nearby stations and 4) Gap filling of missing flow and level data using Simple Linear Regression, constrained by strong correlation with one or more nearby stations (Bertoni and Tucci, 2020).
The spatial distribution of precipitation in the basin was determined using data from the four rain gauges (Figure 3; Table 3) calculated with the Thiessen Polygons method using the Analysis Tools—Proximity tool in ArcGIS, which provides the percentage of precipitation for the centroids of the sub-basins (Pokojski and Pokojska, 2018). For the hydrological modelling case studies, seven intense precipitation events were selected from a time series of 236 events between years 2010 and 2020. The events were chosen accordingly to classification of emergency or overflow conditions (Table 3), that were predominantly in the range of 45–115 mm (Figure 4). The measured rainfall was spatially distributed within the contributing area at a 10 min resolution.
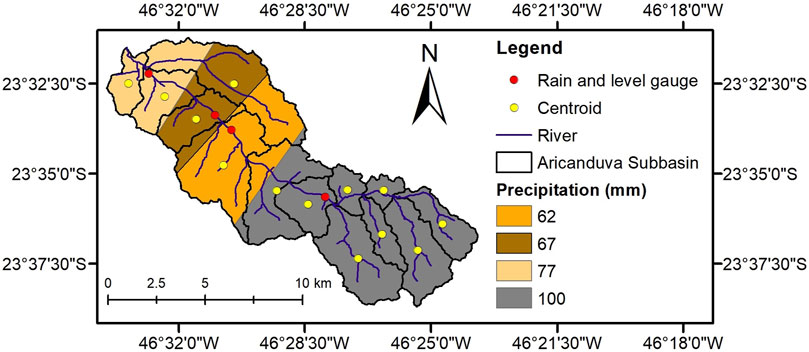
FIGURE 3. Spatial distribution of daily precipitation for the event on 16/02/2019.
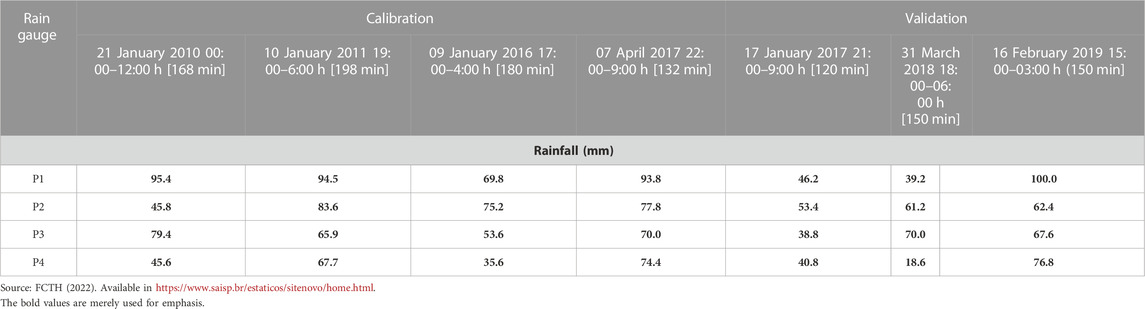
TABLE 3. Cumulative precipitation at a 10-min resolution used in the hydrological simulations.
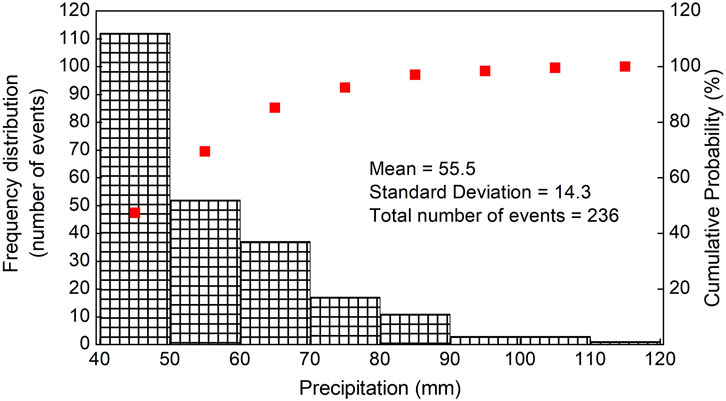
FIGURE 4. Occurrence and cumulative probability of 236 intense precipitation events measured between years 2010 and 2020 in the contributing area for gauges P1, P2, P3, and P4 (FCTH, 2022). Squares represent the cumulative probability.
2.3 Hydrological modelling
Our study involved three main steps in the calculations: 1) a comprehensive dataset of boundary conditions and hydrometeorological forcings was prescribed to configure the hydrological contributing area with high-resolution and quality control. This dataset was then used to run the computational codes of the HEC-HMS and HEC-RAS 2D models; 2) the model was calibrated and validated using multiple case studies of flood events, with significant statistical performance and sensitivity analysis, and 3) hypothetical scenarios were built to evaluate the impact of introducing Green Roofs (GR), or permeable pavement (PP), on runoff and peak flow during a flood event. These scenarios involved replacing impermeable surfaces with permeable alternatives of GR or PP. The analysis focused on evaluating the changes in runoff and peak flow resulting from the implementation of those infrastructure.
The HEC-HMS (Hydrologic Engineering Center—Hydrologic Modelling System) version 4.10 was chosen to simulate the rainfall-runoff processes in our urban basin to quantify the flow during rapidly changing water level events. The computational code is integrated with database information and geoprocessing tools, resulting in various outputs of soil moisture and flow (Rouf, 2015; USACE, 2016a). This integration occurs through a database management platform known as HEC-DSS, designed to store and retrieve time series and paired data generated in hydraulic projects within the HEC family. HEC-DSS was built to standardize data transfer between the programs. All communication between the HEC-HMS and HEC-RAS models is conducted through these DSS-format files. Technical information on database generation can be accessed online at https://www.hec.usace.army.mil/confluence/dssdocs/dssvueum/introduction/overview-of-the-hec-data-storage-system.
The basin was defined by seven hydrological elements: 1) Subbasins: the physical subdivisions of individual micro basins within the larger basin. 2) Reaches: segments of the river where discharge occurs from upstream to downstream. 3) Junctions: nodes representing the confluence of rivers and their tributaries. 4) Sources: a flow introduced at a specific point in the system through the drainage area. 5) Sinks: water withdrawal from a specific micro basin. 6) Reservoirs: elements of water storage and loss within the system. 7) Derivations: the transfer of flow between different elements of the system (USACE, 2016a-b). With the definition of these elements, meteorological forcings were spatially distributed within the basin, that enabled the simulation for a temporal interval. The storage and discharge functions of the attenuation reservoirs were considered in the simulations (Decina, 2012). The simulations employed the simple methods of initial and constant loss and the unit hydrograph method, to estimate the runoff resulting from net precipitation in the subbasins (USACE, 2016a), see Table 4. The methods assumed a single hypothetical soil layer, considering changes in moisture content without accounting for detailed subsurface characteristics. Soil moisture uptake was neglected, supposed to be suitable for short-duration and intense rainfall events.

TABLE 4. Methods and parameters used in the simulations of HEC-HMS model.
The estimation of urban flooding was performed using the hydrodynamic model HEC-RAS 2D version 6.3.1 (USACE, 2016b; Rangari et al., 2019). The 2D computational mesh was generated in the pre-processing step using a high-resolution digital terrain model (DTM) with 10 cm resolution. This DTM raster file was input into RAS-MAPPER to generate the computational mesh, allowing for the estimation of water level elevation and flow velocity and the temporal and spatial evolution of the flood. The floodplain was modeled using a 2D flow mesh consisting of 2,853 cells, each measuring 40 m × 40 m. Manning’s roughness values (n) were spatially prescribed in the model based on the land use classification (Table 1; Figure 1C) of the floodplain. The values were estimated as the average for the left and right banks and the main channel of the Aricanduva River. In addition, flow hydrographs and water surface profiles (hydrograph) were used as boundary conditions to simulate the spatial and temporal evolution of flow in the basin. The simulations were conducted using a time step of 1 min, enabling a detailed analysis of the flood dynamics.
2.4 Calibration and validation
To ensure the consistency and robustness of the modelled scenarios, we previously built the calibration and validation of the HEC-HMS and HEC-RAS 2D models (Cunderlik and Simonovic, 2004; USACE, 2016a). For the HEC-HMS model, the initial parameter values for Initial Loss (IL) and Constant Rate (CR) were predefined based on USACE (2016a). The automatic calibration was performed using the Univariate method with a maximum of 100 iterations and a tolerance of 0.01 in the optimization tests. Four precipitation events (Table 3) were used for calibration. Manual calibration (Golmohammadi et al., 2014; Ouédraogo et al., 2018) was only required in cases where convergence was not achieved during the automatic calibration. The values of the Impervious (IM) parameters were determined based on the Land Use classification (Table 1; Figure 1C) (USDA, 2017), and the Lag time (LT) parameters were determined in the pre-processing step using ArcHydro and HEC-GeoHMS extensions (USACE, 2016a). The optimized parameter values are shown in Supplementary Table S1, which were found to be comparable to estimates of permeable pavements (Collins et al., 2008; Monrose and Tota-Maharaj, 2018; Zheng et al., 2021).
In the HEC-RAS model, flow, and water level observations at P2 and the observed water level at P3 were used as boundary conditions in the internal 2D grid to evaluate the lateral contributions from streams. The observed water level at P4 (Figure 2) was also used for validation. Initial values of the Manning’s roughness coefficient were estimated in the 2D flow mesh area (Chow, 1959) (Figure 5). The maximum elevation of the event was recommended to adjust the Manning’s roughness coefficient (n) in the mesh, as described in the application guide provided by USACE (2016b). The first step of the calibration estimated the Manning’s roughness coefficient (n) considering different land use types on the right and left banks of the river, and hydraulic characteristics of the channel, with values of 0.034, 0.035, and 0.036, respectively. To ensure the best condition of stability and numerical accuracy, a spatial resolution of 40 m × 40 m was used for the 2D flow mesh. Subsequently, numerical stability tests were performed for different time steps, and instability issues were observed for computational intervals above 5 min. Therefore, a time step of 1 min was chosen for the final simulations.
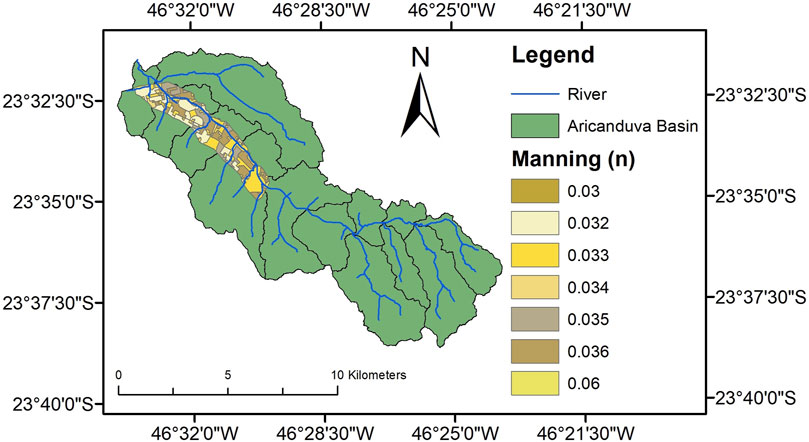
FIGURE 5. Initial conditions of Manning’s roughness coefficient (n) in the simulation mesh of the HEC-RAS 2D model.
The performance was assessed based on the following statistical indices: PEV, PEPF, PEE, R2, RSR, NSE, and PBIAS, as listed in Supplementary Table S2.
2.5 Sensitivity analysis
To enhance the understanding of the model’s functioning as a predictive tool for this study, we assessed the sensitivity of key parameters. Sensitivity analyses assess how variations in the value of a parameter can result in significant disparities between observed and simulated volumes, capturing the isolated impact of each variation (Cunderlik and Simonovic, 2004; USACE, 2016a). The following parameters were selected: 1) Initial loss (in mm); 2) Constant rate (in mm/h); 3) Imperviousness (in %); and 4) Lag time (in minutes). The optimized values obtained after the calibration of each parameter were perturbed from −25% to 25%, with increments of 5%, while keeping the remaining parameters constant.
2.6 Hypotheses of gray and green infrastructure interference
In our simulations, we assumed that all activities following the pre-development period in the upstream basin of observation point P2 influenced the hydrological properties of the soils, leading to a shift towards soil types D and D/D with Curve Numbers (CN) ranging from 77 to 98, as suggested in TR-55 (USDA, 1986) and estimated during preprocessing using ArcHydro and HEC-GeoHMS extensions (USACE, 2016a) (Figure 5). We also assumed that all impervious surfaces are hydraulically connected to the micro and macro drainage network upstream of observation point P2.
The two GIs considered in this study, namely, Extensive Green Roofs (GR) and Permeable Pavement (PP), form the basis of our simulation scenarios. Technical information on the hydraulic behavior of extensive green roofs and permeable pavement used in this study was obtained from literature sources, drawing upon various microscale experiments conducted worldwide (Bateni et al., 2021; Zheng et al., 2021). The retention of precipitation by green roofs correlates inversely with the volume of rainfall, with retention efficiency varying considerably based on rainfall event volume. On average, green roofs can retain approximately 62.2% of rainfall and 69.3% of peak flow (Berndtsson, 2010). Carter and Rasmussen (2006) found that the percentage of rainfall retained for small storms (<25.4 mm) reached 88%, retention for medium storms (25.4–76.2 mm) was around 54%, and for large storms (>76.2 mm), it could be as high as 48% of precipitation. For rainfall events with precipitation less than 10 mm, green roofs can retain nearly all the rainfall, as reported by Zheng et al. (2021). For a 12 mm precipitation event, green roofs showed retention ranging from 26% to 88%, depending primarily on precipitation intensity, residual moisture in the substrate, vegetation species, geometric properties (such as coverage area and slope), substrate characteristics (type, depth, porosity, and density), and drainage layer (type and depth), as observed by Simmons et al. (2008). Larger precipitation events of 28 mm and 49 mm showed retention ranging from 43% to 8% and 44% to 13%, respectively (Berndtsson, 2010; Liu et al., 2020a; Zheng et al., 2021).
In contrast to traditional pavements that generate runoff from almost all rainfall, permeable pavements encourage rainfall infiltration, increasing moisture within the soil profile (Bateni et al., 2021) and has multiple applications in commerce, and residences, reducing runoff volume by over 40% and decreasing peak flow by 50% to 90%. Commercially, there are five categories: permeable asphalt (PA), permeable concrete (PC), permeable interlocking concrete pavement (PICP), and concrete grid pavement (CGP) or plastic grid pavement (PGP), filled with grass or sand and gravel (Collins et al., 2008; Bateni et al., 2021). Gomez-Ullate et al. (2011) demonstrated that the hydrological performance of all permeable pavements (PPs) in terms of peak flow reduction is very similar, with runoff reduction potentially exceeding 98%. Weiss et al. (2015) found that variability in peak flow and infiltration rates among different types of PPs was primarily influenced by design, material quality, aggregate mix, periodic maintenance, and other factors (Lin et al., 2014; Barszcz, 2015; Bateni et al., 2021).
The evaluation of the effectiveness of GIs involves the use of values from the Soil Conservation Service—Curve Number (SCS-CN) method to simulate runoff based on local precipitation, land use, and soil data (Ahiablame et al., 2012; USDA, 2017). The CN method is an empirical two-parameter procedure (CN and initial abstraction, S) widely used in stormwater management as well as in complex watershed models to determine how much of a given rainfall event becomes direct runoff (USDA, 1986; Sample et al., 2001). The initial abstraction, which describes all precipitation losses before runoff begins (interception, infiltration, surface storage, and evaporation), is a function of CN and is calculated as (USDA, 1986):
Considering that the precipitation, Ph (mm), is greater than 0.2S, the direct runoff, Qh (mm), is estimated as:
Qh = 0 when Ph ≤ 0.2S
where Qv is the water volume, and A is the area of interest.
In this context, simulations of GRs and PPs with the HEC-HMS model involve the use of SCS-CN values to estimate runoff. CN is a key parameter common to both GIs used in this study. The two green infrastructures (GRs and PPs) are represented with initial CN values suggested in USDA (1986), Sample et al. (2001), MDE (2009), and Ahiablame et al. (2012). In the simulations, we will assume that all activities following the pre-development period in the watershed have influenced the soil’s hydrological properties, leading to a shift to hydrological group D, with CN ranging from 77 to 98, as suggested in TR-55 (USDA, 1986) and estimated in the preprocessing using ArcHydro and HEC-GeoHMS extensions (USACE, 2016b). In the study, we also accept that all impervious surfaces are hydraulically connected to the micro and macro drainage network in the watershed.
The CN values used for green roofs are 85 for all four Hydrologic Soil Groups A, B, C, and D, corresponding to low, moderately low, moderately high, and high runoff potential, respectively (Sample et al., 2001). For permeable pavement, the CN values used are 70, 80, 85, and 87 for the 4 Hydrologic Soil Groups A, B, C, and D (Sample et al., 2001). These CN values were recommended to adjust the model values to characterize the effects of GIs on runoff, allowing for comparison between hydrological conditions before and after GI implementation. Therefore, for the construction of simulation scenarios with green infrastructures (GIs) in the Aricanduva River basin, we considered extensive green roofs (substrate thickness <15.24 cm) and a reduction in the Curve Number to 77, along with permeable pavements (PPs) with a Curve Number of 79. The hydraulic conductivity for both green roofs and permeable pavements was set at 25.4 mm/h, following the guidelines of MDE (2009) and USDA (2017). Simulations incorporating green roofs and permeable pavements adhered to the following criteria: i) the grey roofs of buildings were replaced with green roofs; ii) areas with established vegetation in the basin were not replaced by green infrastructure; iii) paved areas (streets, sidewalks, parking lots, and open areas on private properties) were replaced by permeable pavements.
The hypothesis of this investigation aims to evaluate the hydrological response of the urban watershed under interference conditions with green infrastructure, such as Green Roofs (GR), or gray infrastructure, such as Permeable Pavement (PP). We assume significant attenuation of the hydrological pulse in both conditions but with different performances. The interference of GR or PP is compared to the Control simulation, which serves as the model calibration.
Interference boundary conditions were applied to the 13 sub-basins within the domain (Table 5). However, hydrological results were effectively derived only from the upstream contributing area of gauge P2, which encompassed 9 sub-basins. These sub-basins consisted of built-up areas, green spaces, and other small spaces, totaling an area of 67.01 km2 (Supplementary Table S3). We used the precipitation event of 16/02/2019 when the river overflowed at gauges P2 and P3.

TABLE 5. Permeable area values (as a percentage of the sub-basin area) in the conditions of the scenarios: control (1), GR (2, 3, 4), and PP (5–7).
The Control simulation was configured with a uniformly distributed conventional (gray) roof across the watershed. The average built-up area on impermeable gray roof surfaces within the watershed was 36%, varying from 19% (sub-basin W880), with extensive vegetated areas, to 48% (sub-basin W550), with high building density.
For streets and sidewalks in public areas, the average built-up area was 22% across the watershed, ranging from 19% (sub-basins W810 and W750) to 26% (sub-basin W530). In private areas, the ground plot area was defined as the open space available for the insertion of PP or internal open space (plot area minus roof area), accounting for 41% of the total area across the watershed. The variation in ground plot area ranged from 26% (sub-basin W530) to 60% (sub-basin W880). Detailed occupancy information can be found in Supplementary Table S3.
Thus, we constructed 7 simulation scenarios for GR or PP (Table 5). Starting from scenario 1 (Control), scenarios 2, 3, and 4 introduced GR roofs, replacing gray roofs in increasing order of individual plot area (A), i.e., conditioned on A > 500 m2 (scenario 2), A > 200 m2 (scenario 3), and A > 50 m2 (scenario 4), respectively, thereby increasing the surface coverage with GR. In the remaining scenarios, PP was introduced in 50% of the ground plot area for scenario 5, in streets and sidewalks of public areas for scenario 6, and in scenario 7 as the combination of scenarios 5 + 6.
3 Results
3.1 Model calibration
The calibration and validation of the model generally showed high performance in simulating runoff volume and peak flow (Supplementary Table S4), within the acceptable range of indices: R2 > 0.50, NSE ≥0.65, PBIAS ≤ ±10%, and RSR ≤0.60 (Moriasi et al., 2007; Ouédraogo et al., 2018). Figure 6 shows the good agreement between observed and simulated runoff in the model validation events. Overall, we noticed that the fit was slightly better in the rising limb of the hydrograph compared to the falling limb. There was a small delay in the model’s peak flow timing in some cases (Figures 6B, C, F), no more than 15 minutes, while in other cases, the simulation of the peak timing was very close (Figures 6A, D, E).
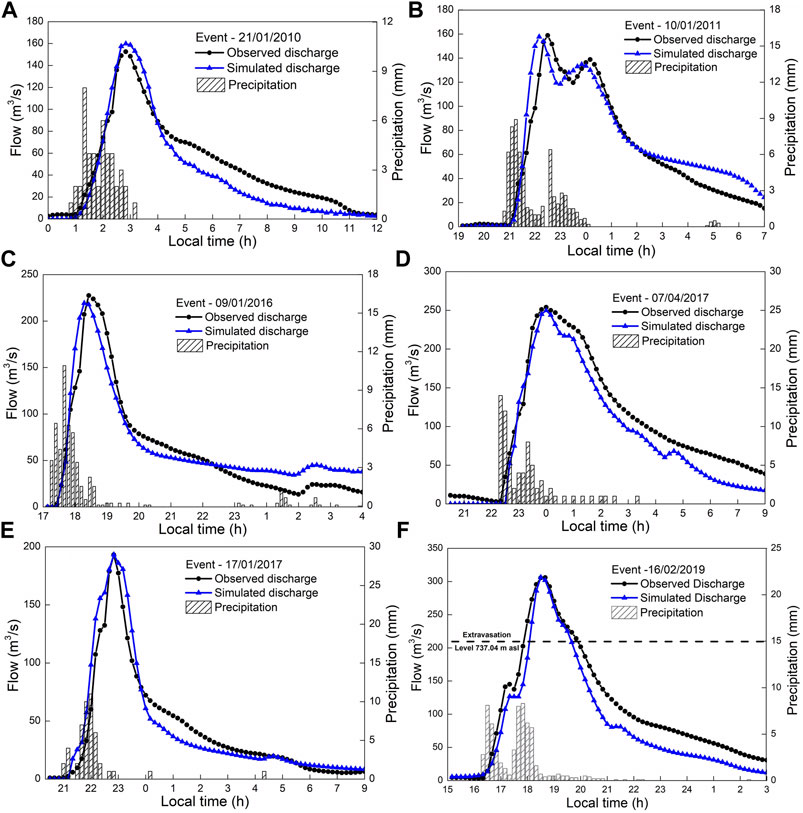
FIGURE 6. Measured and simulated discharge (in m³/s) for the 4 meteorological events in the calibration period (A–D) and 2 events in the validation period (E–F); vertical bar represents precipitation in mm per 10 min.
In the event of 16/02/2019, the water level at gauge P2 (Figure 7A) caused flooding when it reached the maximum channel elevation (737.04 m asl) at approximately 17:50 h. It then rose an additional 0.76 m by 18:40 h, reaching a peak discharge of 306 m3/s. Finally, it returned to the overflow level 2 h later at 19:50 h, leaving flooded areas downstream of the gauge. At gauge P3, the hydrological pulse was slightly ahead of P2 but followed a similar pattern. It started overflowing at 17:30 h, rose 1.29 m, reached its maximum elevation at 18:40 h, and then gradually receded back to the channel level after approximately 2 h (Figure 7B). At gauge P4, the river reached a maximum elevation of 727.89 m at 19:30 h, below the overflow level (Figure 7C). The calibration of water levels at the three gauges showed excellent performance in this event and equally in the validation simulations (not shown), as indicated by the obtained statistical indices (Supplementary Table S5).
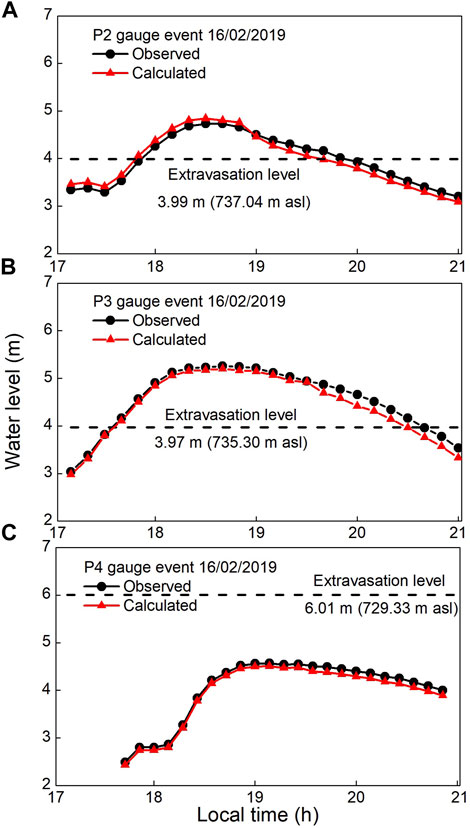
FIGURE 7. Elevation of runoff level (in m), at 10 min increment, observed (black line) and simulated (red line) at gauges: (A) P2, (B) P3, and (C) P4, in the main channel of the Aricanduva River on 16/02/2019.
The 5 attenuation reservoirs played a role in delaying the inflow of water into the main channel and mitigating both the peak flow and total runoff volume in the channel, as evident from the flow hydrograph pattern (Figure 6F). However, they were unable to prevent the occurrence of overflow. The reservoirs had a maximum retention capacity of 2.02 million m3 and operated upstream of gauges P2 and P3. In the event of 16/02/2019, all reservoirs operated below their maximum capacities. When calculating the ratio between the peak storage during the event and the maximum storage capacity, we observed values ranging from approximately 27% in reservoir 2 to 46% in reservoir 4. The total volume attenuated in the five reservoirs was approximately 2.35 million m3, which retained 49.7% of the observed volume (4.67 million m3) in P2, with peak discharges in 4 reservoirs occurring after 20:00 h (Table 6).
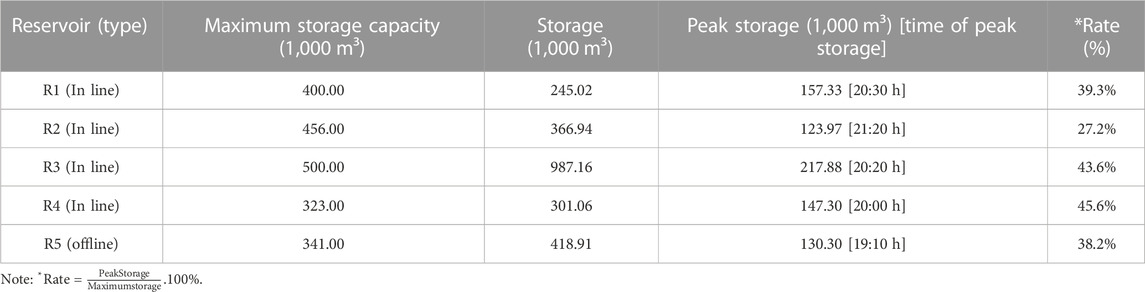
TABLE 6. Operation of the five attenuation reservoirs (R1–R5) upstream of gauge P2 during the event on 16/02/2019, including maximum storage capacity, retained volume, peak of retained volume, and the time and ratio between the peak of retained volume and the maximum storage volume of the reservoirs.
For a more detailed verification of the role of the reservoirs, we conducted additional simulations of the event by sequentially disconnecting the reservoirs from the drainage pattern, one by one cumulatively, so as not to assimilate the surface runoff water. In summary, Table 7 shows that the rate of change in runoff volume increases by less than 2% compared to the peak flow, which increases at more significant rates of up to 26.4% because of retention.
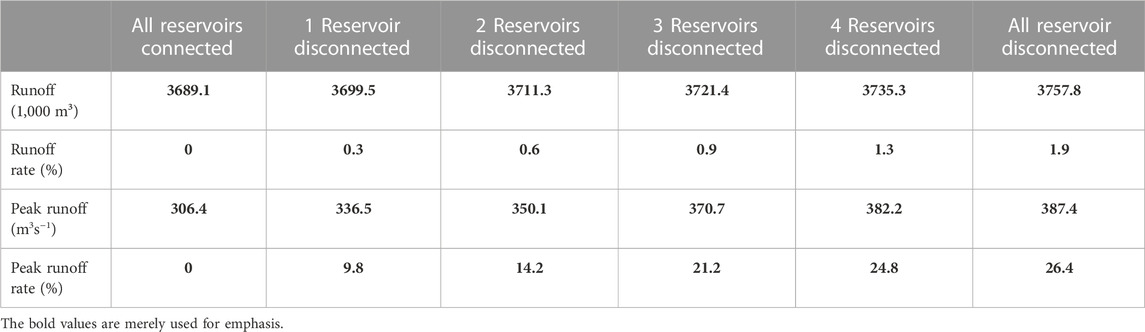
TABLE 7. Rate of change of volume and peak flow at observation gauge P2, considering the time interval (15:00–03:00 LT) and the simulated values with all reservoirs connected (R1–R5).
The model simulated the flooding over a spatial extent around the overflow of the Aricanduva River canal, as observed at gauges P2 and P3 (Figure 8A) and noted in records from the Flood Alert System of São Paulo (FCTH, 2022). For a pictorial illustration, we sketched the elevation level reached on the side of the river channel, with the water level above the level of vehicles on the avenue (Figure 8B).
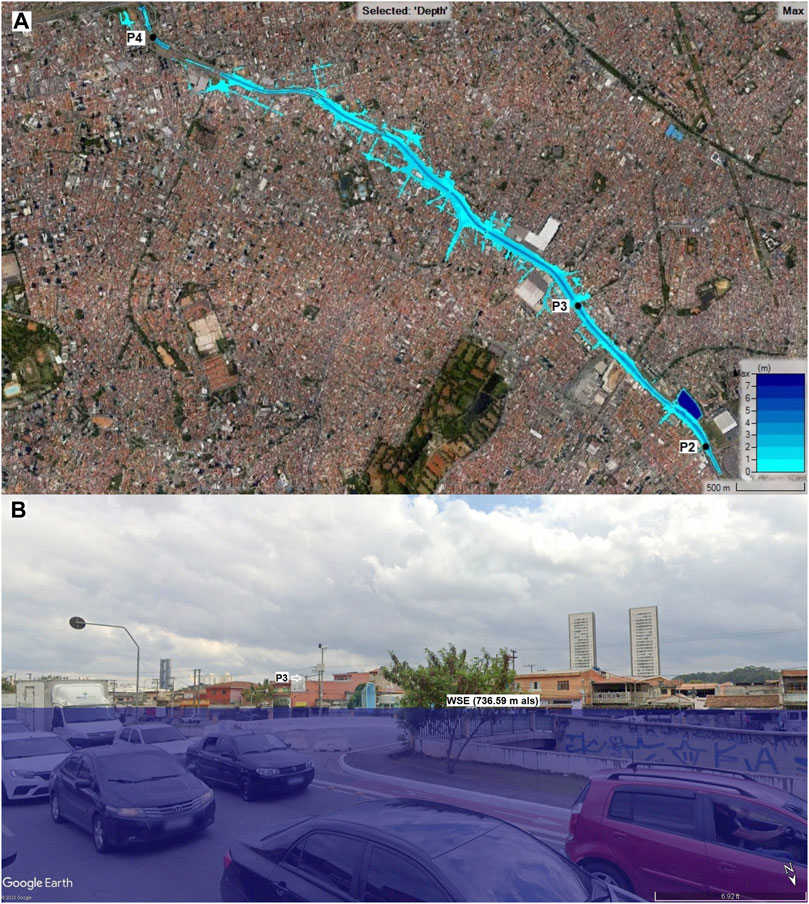
FIGURE 8. (A) Spatial distribution of the maximum water level in the Aricanduva River; (B) pictorial illustration of the maximum water level at gauge P3 on 16/02/2019, simulated in the HEC-RAS 2D model (KML file inserted in the Google Earth Pro platform).
3.2 Sensitivity analysis
We conducted a simple sensitivity analysis to assess the scale dimension of the hydrological response, as it depends on the variation of key model parameters that characterize the degree of surface impermeability. With a 25% increase in impermeability, we observed a 3.7% increase in runoff volume, and with a 25% reduction, there was a corresponding 3.7% reduction in volume (Figure 9A). According to the Percent Error in Peak Flow (PEPF) criterion, the peak flow showed higher sensitivity to the Lag time parameter, exhibiting an inversely proportional relationship. A 25% increase in Lag time resulted in a 9.8% reduction in peak flow, while a 25% reduction led to a 9.8% increase (Figure 9B).
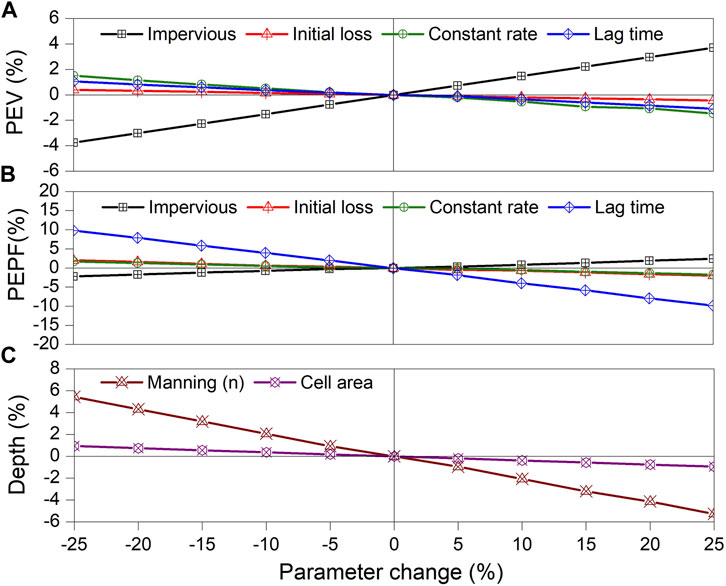
FIGURE 9. HEC-HMS model response for (A) Runoff Volume (PEV); (B) Peak Runoff (PEPF) for Initial Loss, Constant Rate, Impervious, and Lag Time parameters. HEC-RAS 2D model result for (C) Manning’s roughness coefficient (n) and grid cell area in depth.
The other parameters showed lower sensitivity in the model. For example, the Initial loss parameter resulted in a variation of approximately ±0.4% in runoff volume and ±2.0% in peak flow. Similarly, the Constant rate parameter, associated with saturated hydraulic conductivity, exhibited low sensitivity, with the runoff volume varying approximately between ±1.4% and the peak flow between ±1.1% (Figures 9A, B) (Supplementary Table S6).
The Manning’s roughness coefficient (n), which varies spatially, showed a more pronounced inverse relationship with the depth of inundation (in percentage terms). The variation in n by approximately ±25% resulted in a depth change of approximately ±5.3% (Figure 9C). On the other hand, perturbing the cell area of the computational grid had a very small effect on the depth of inundation (in percentage terms), with a variation of approximately ±0.9%.
We identified the Impervious parameter as the most sensitive based on the Percent Error in Volume (PEV) criterion.
3.3 Hydrological response to GR and PP infrastructure
We conducted simulations for scenarios 2, 3, and 4, gradually expanding the coverage of GR in the contributing area of the watershed. In scenarios 2 and 3, 1,164 and 6,444 conventional roofs were replaced upstream of P2, totaling 1.6 and 2.9 km2 of area, resulting in a percentage of permeable area of 3.5% and 6.3%, respectively. Scenario 4 prescribed a significant increase in permeable surface, with 125,843 conventional roofs covering 13.9 km2 with GR, resulting in a permeable area percentage of 30.4%, that showcased approximately 9 times more than scenario 2 and 5 times more than scenario 3.
The introduction of GR confirmed the hypothesis of reduced runoff impact. In scenarios 2 and 3, the peak flows were significantly reduced compared to the Control scenario and were very close to each other throughout the runoff event (red and green lines in Figure 10). Despite reducing peak flow by around 15% and runoff volume by approximately 23%, these scenarios fell short in preventing canal overflow, as the runoff remained above the critical level for about 1 h. In contrast, scenario 4 showed a significantly different outcome. It achieved a reduction of approximately 37% in peak flow and approximately 31% in runoff volume, and importantly, it successfully prevented canal overflow (orange line in Figure 10).
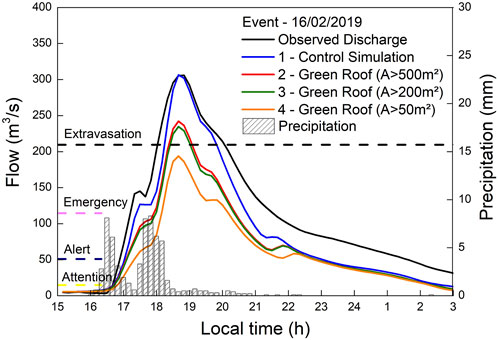
FIGURE 10. Simulations of the event on 16/02/2019 (discharge in m³/s and precipitation in mm per 10 min): measurement (black line); 1—Control (blue line); 2—GR (A > 500 m2), 3—GR (A > 200 m2), and 4—GR (Area > 50 m2) (red, green, orange lines) respectively.
The simulations of scenarios 5, 6, and 7 described, in sequence, an increasing area of the watershed covered by PP instead of traditional gray pavement. In scenario 5, only public areas such as streets and sidewalks were replaced, while in scenario 6, only private areas (50% of the opened ground) were replaced. Scenarios 5 and 6 both entailed a replaced area of 10.1 and 9.8 km2 respectively, with a permeable area percentage of 22.1% and 21.4% upstream of P2, indicating comparable extents of permeable areas in both. Scenario 7 represented the combination of scenarios 5 and 6, resulting in a total replaced area of 19.9 km2 and a permeable area percentage of 43.5%.
The results of scenarios 5, 6, and 7 confirmed the hypothesis of attenuating the hydrological pulse with the introduction of PP. In scenarios 5 and 6, the reduction in total volume was approximately 43% and 44% respectively, and the reduction in peak flow of 31% and 32% respectively (Figure 11). In both cases, calculated the peak flow was approximately equal to the critical overflow level. Scenario 7 excelled, reducing runoff volume by 52% and peak flow by 44%, successfully averting canal overflow unlike the previous scenarios.
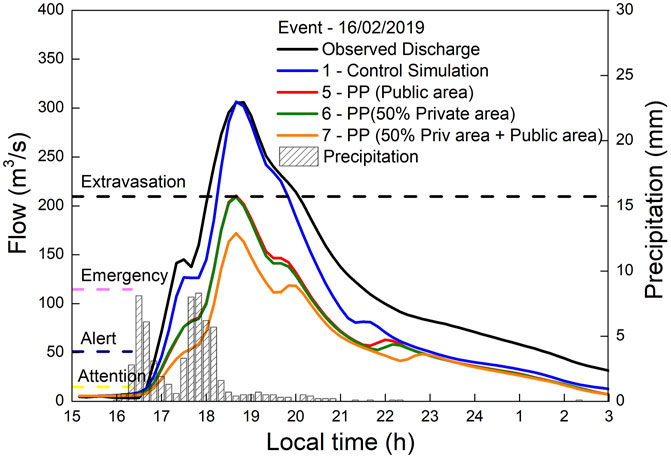
FIGURE 11. Simulations of the event on 16/02/2019 (discharge in m³/s and precipitation in mm per 10 min): measurement (black line); 1—Control (blue line); 5—PP (streets and sidewalks), 6—PP (50% of opened ground), and 7—PP (streets and sidewalks +50% of opened ground) (red, green, orange lines) respectively.
3.3.1 Dependency relationships of the hydrological response with the permeable area
The previous results showed that both green infrastructure GR and gray infrastructure PP could potentially be sufficient to attenuate the hydrological runoff and prevent canal overflow in the case study. However, these examples showcased a restricted range of permeable area values as dictated by the scenarios, failing to adequately illustrate the full spectrum of how extending permeable areas influences the efficacy of infrastructure interventions required to mitigate hydrological criticality. Therefore, we reevaluated the pattern of dependence of hydrological response on the permeable area of the basin under a more comprehensive spatial variation. Based on the Control scenario, we tested a range of individual replacement areas ranging from A < 10 m2 incrementally up to A < 200 m2, with a 10 m2 increment, totaling 20 simulations for each type of infrastructure GR or PP.
The simulations were analyzed based on the percentage of permeable area within the basin, calculated in relation to the total built area of 45.75 km2 in the 9 sub-basins upstream of gauge P2. In the case of GR, the permeable area of intervention varied in the range of 2.9–16.0 km2, or approximately 6.0%–35.0% of the built area (Figure 12A). For the case of PP, the prescribed permeable area ranged from 16.4 to 24.8 km2, corresponding to approximately 36%–54% of the built area (Figure 12B).
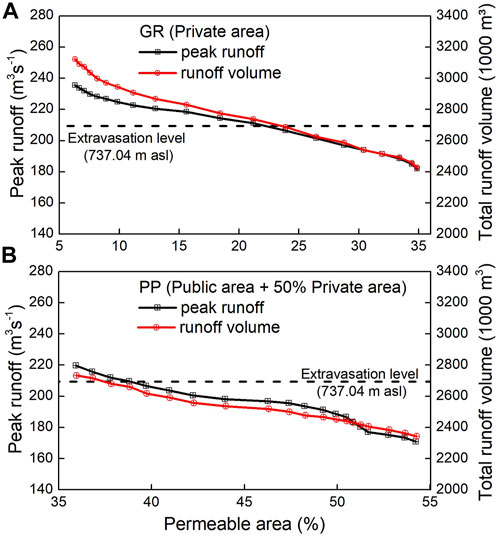
FIGURE 12. Peak flow and runoff volume calculated as a function of the percentage of permeable built-up area for three infrastructure scenarios: (A) Green roof GR; (B) Permeable pavement PP. The black dashed line represents the water overflow level at gauge P2.
We confirmed a notable response pattern of reducing peak flow and runoff volume with increasing permeable area for the entire range of GR or PP. In detail, within the range of variation for GR, we observed that the substitution of approximately 24% of grey roof area prevented canal overflow (extravasation level in Figure 12A), corresponding to a total permeable area of approximately 11 km2. For the variation in area with PP, the replacement of approximately 40% of paved impermeable area prevented canal overflow (extravasation level in Figure 12B), corresponding to a total permeable area of approximately 18 km2.
In this regard, we evaluated the hydrological efficiency of the GR and PP infrastructures using the parameters of runoff retention (RR, in %) and peak runoff retention (PRR, in %), following Zheng et al. (2021):
where Robs and Rsim are the observed runoff volume in the meteorological event and the calculated volume at gauge P2 for each prescribed permeable area, respectively, and similarly PRobs and PRsim are the observed and simulated peak runoff.
As a result of the reduction in the calculated peak runoff and runoff volume caused by the increase in permeable area, the estimates of RR and PRR increased with the permeable surface due to increased water retention upstream. Across the entire range of permeable areas, the hydrological efficiency in the case of GR ranged from approximately 15% to 34% for RR, and from approximately 23% to 35% for PRR (Figure 13A). In the case of PP, the RR parameter ranged from approximately 26% to 37%, and PRR from approximately 28% to 44% (Figure 13B). To prevent canal overflow, in the scenario of widespread use of extensive GR, the estimated RR was approximately 27% and PRR was 33%, corresponding to a permeable area of 24% at the critical level (vertical line, Figure 13A). In the case of replacing gray infrastructure with PP, the estimated RR was approximately 29% and PRR was approximately 32% to prevent overflow, corresponding to a permeable area of approximately 40% at the critical level (vertical line, Figure 13B).
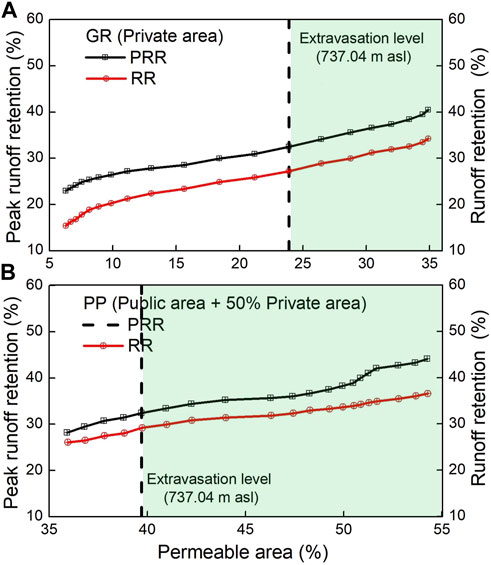
FIGURE 13. Hydrological performance indices: (A) runoff retention (RR, in %) and (B) peak runoff retention (PRR, in %), evaluated in the replacement of impermeable surfaces by (A) green roof GR and (B) permeable pavement PP in public and private areas (50% opened ground). The dashed vertical line represents the water level at the channel overflow at gauge P2.
4 Discussion of the results
The hydrological performance of urban hydrological infrastructures, whether green or gray, depends on the intensity and duration of precipitation. Under low precipitation, runoff is small, and the water retention rate can reach 100% (Zheng et al., 2021). The capacity to retain infiltrated water diminishes during intense or prolonged precipitation events, particularly accentuated under conditions of high initial soil moisture, as commonly observed during the summer in the Southeast region of Brazil. Our calibration case studies had rainfall intensities ranging from 25 to 40 mm/h, which corresponded to an approximate occurrence probability of 70% (Figure 4). The comparative case study of the hydrological sensitivity of GR and PP had accumulated rainfall ranging from 62 to 100 mm between the gauges, with a similar duration of approximately 150 min. Thus, using the Intensity-Duration-Frequency curves for the city of São Paulo (DAEE, 1999), we estimated the return period of the meteorological events, which ranged from 5 years at gauge P2 to 50 years at P1, indicating that the conditions represented in the simulations were adequately extreme.
Other studies that reported the efficiency of GR and PP as individual water retention methods have shown a wide range of retention (RR) and peak runoff retention (PRR) efficiency (Table 8), usually due to variations in climate conditions, technical design differences such as material properties and thickness, antecedent dry period, and precipitation intensity (Gregoire and Clausen, 2011). Our results of hydrological impact, considering a large spatial extent of GR or PP infrastructure, showed efficiency rates within the range observed at a smaller scale in the literature.
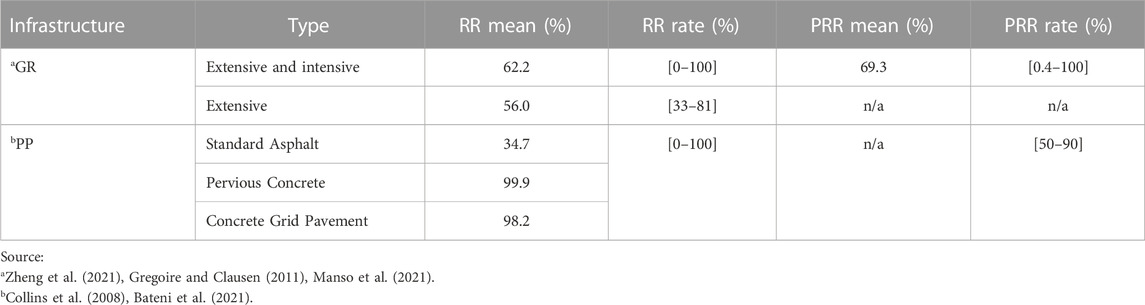
TABLE 8. Runoff retention (RR) and peak runoff retention (PRR) from studies with green roof (GR) and permeable pavement (PP).
The pattern of calculated runoff reduction and peak runoff was directly proportional to the fraction of prescribed permeable area in the contributing watershed, in both the GR and PP cases. This was expected to some extent, but the response was not exactly linear, partly because the statistical distribution of area for units with replacement coverage was not exactly homogeneous within the range of 10–200 m2, according to 10 m2 variation classes. There are also other reasons that can explain the variation in the rate of peak and runoff volume reduction with permeable area, due to the dynamics of infiltration, generation, and propagation of surface runoff, which depend on the physical parameters of the model and the configuration of the watershed.
The attenuation reservoirs in operation in the influence area of P2 were designed for a 100-year return period, with a 39% failure risk and a lifespan of 50 years (PMSP, 1999). The ratio results between the peak of the retained volume and the maximum storage volume showed that all reservoirs functioned properly and operated below their maximum storage capacity. The reservoirs made a modest contribution to the 2% reduction in runoff volume but had a more notable impact in reducing peak flow, with a reduction of approximately 26%. If the reservoirs were not present, it is likely that the superior hydrological efficiency of the GR compared to the PP would remain unchanged. However, it is evident that the required fractions of interfering area to reach the extravasation level would not be the same.
5 Conclusion
Our investigation obtained the hydrological response of a densely urbanized watershed in a tropical climate region using a thoroughly validated hydrological model to compare the interference in the land use of the watershed between a green infrastructure type called Green Roof (GR) and a gray technology called Permeable Pavement (PP), in terms of hydrological efficiency in mitigating floods. The calculated flow and water level in the cases of GR or PP area variations fell within a wide range, allowing for situations sufficiently above or below the canal overflow level, providing a good distinction of the impact of the permeable surfaces. Overall, we noted a positive hydrological response, with a proportional decrease in peak flow and runoff volume corresponding to the increase in permeable area and, consequently, the expansion of GR or PP within the contributing watershed.
We emphasize that the assessment of interference around the overflow level encompassed in the Green Roof (GR) a permeable area ranging from approximately 6% to 35% of built-up area, which is smaller than that of the Pervious Pavement (PP) ranging from approximately 36% to 54%. Additionally, we originally noted that replacing approximately 24% of gray roof area with GR prevented channel overflow, significantly less than the approximately 40% replacement required for PP interference.
These levels of efficiency were achieved for significantly intense events, but there may be a decrease in hydrological efficiency during extremely intense events, such as those following a succession of rainy days or a high severe storm with a return period exceeding 50 years.
The GR and PP hydrological infrastructures are generally spatially distributed works that increment small spaces within the hydrological contribution area. This can be a comparative advantage over large storage reservoirs, which occupy large areas and not only lack aesthetic value in urban planning but also depreciate local property values. However, the installation and maintenance costs of PP are higher than those of conventional pavement. For example, the cost of permeable asphalt pavement per linear meter is 75% higher than that of regular asphalt. Furthermore, permeable pavements may not be suitable for high-traffic areas and require maintenance expenses to mitigate pore clogging with sediments, which can range from $5 to $70 per square meter (CENTER, 2005; Bateni et al., 2021).
The implementation of GR has some disadvantages, such as higher installation and maintenance costs, and additional water demand. For instance, the installation and maintenance costs of GR are about 39% higher than those of gray roofs (Gregoire and Clausen, 2011; Pirouz et al., 2023). However, water demand can be a minor concern that can be mitigated using drip irrigation systems and supplemented by precipitation, particularly during the summer months when atmospheric evaporative demand is at its peak. Furthermore, there are co-benefits of implementing GR, such as the attenuation of urban heat islands at a local scale and the cultural and aesthetic enhancement of urban biodiversity. For example, the surface temperature reduction provided by GR can improve the energy efficiency of buildings during hot days, with potential savings of approximately $200 per square meter of roof area (GSA, 2011; Nguyen et al., 2022).
Our conclusion reinforces the relevance of green roofs as an option for Nature-Based Solutions (NBS) to mitigate intense hydrological effects in urban areas and, more importantly, paves the way for other solutions with the same hydrological principles and environmental co-benefits to work individually or in combination. We mention, for example, the activation of small-scale ground surfaces with natural coverings (e.g., grass, bush, short trees) to promote infiltration. External corridors of residences, exposed driveways, and public sidewalks are additional examples where these nature-based solutions (NBS) can be implemented. Assessing the precise hydrological efficiency of these options and their respective drawbacks is beyond the scope of this study. However, considering the substantial construction and maintenance costs associated with green roofs, it is crucial to further investigate these alternatives as NBS in urban areas, especially concerning their interference and quantification at a large urban scale.
Data availability statement
Publicly available datasets were analyzed in this study. This data can be found here: http://geosampa.prefeitura.sp.gov.br/PaginasPublicas/_SBC.aspx; https://www.saisp.br/estaticos/sitenovo/home.html.
Author contributions
MF: Conceptualization, Formal Analysis, Investigation, Methodology, Software, Validation, Writing–original draft, Writing–review and editing. HR: Conceptualization, Formal Analysis, Funding acquisition, Investigation, Methodology, Project administration, Resources, Software, Supervision, Validation, Writing–original draft, Writing–review and editing.
Funding
The authors declare financial support was received for the research, authorship, and/or publication of this article. This research was supported by the São Paulo Research Foundation (FAPESP) grants 2019/23853-5 and 2021/11762-5.
Conflict of interest
The authors declare that the research was conducted in the absence of any commercial or financial relationships that could be construed as a potential conflict of interest.
Publisher’s note
All claims expressed in this article are solely those of the authors and do not necessarily represent those of their affiliated organizations, or those of the publisher, the editors and the reviewers. Any product that may be evaluated in this article, or claim that may be made by its manufacturer, is not guaranteed or endorsed by the publisher.
Supplementary material
The Supplementary Material for this article can be found online at: https://www.frontiersin.org/articles/10.3389/fbuil.2023.1254942/full#supplementary-material
References
Ahiablame, L., Engel, B., and Chaubey, I. (2012). Representation and evaluation of low impact development practices with L-THIA-LID: an example for site planning. Environ. Pollut. 1 (2), 1e13. doi:10.5539/ep.v1n2p1
Alabbad, Y., and Demir, I. (2022). Comprehensive flood vulnerability analysis in urban communities: Iowa case study. Int. J. disaster risk Reduct. 74, 102955. doi:10.1016/j.ijdrr.2022.102955
Allaire, M. (2018). Socio-economic impacts of flooding: a review of the empirical literature. Water Secur. 3, 18–26. doi:10.1016/j.wasec.2018.09.002
Arnold, C. L., and Gibbons, C. J. (1996). Impervious surface coverage – the emergence of a key environmental indicator. J. Am. Plan. Ass. 62, 243–258. doi:10.1080/01944369608975688
Barszcz, M. (2015). Influence of applying infiltration and retention objects to the rainwater runoff on a plot and catchment scale – case study of służewiecki stream subcatchment in warsaw. Pol. J. Environ. Stud. 24 (1), 57–65. doi:10.15244/pjoes/29197
Bateni, N., Lai, S., Bustami, R., Mannan, M., and Mah, D. (2021). A review on green pavement hydrological design and recommended permeable pavement with detention storage A review on green pavement hydrological design and recommended permeable pavement with detention storage. IOP Conf. Ser. Mater. Sci. Eng. 1101, 1–14. doi:10.1088/1757-899X/1101/1/012014
Berndtsson, J. C. (2010). Green roof performance towards management of runoff water quantity and quality: a review. Ecol. Eng. 36 (4), 351–360. doi:10.1016/j.ecoleng.2009.12.014
Bertoni, J. C., and Tucci, C. E. M. (2020). “Precipitação,” in Hidrologia: ciência e Aplicação. Porto Alegre, editora da UFRGS/ABRH. v4. Editor C. E. M. Tucci, 177–241. ISBN (online): 9788570259240.
Bianchini, F., and Hewage, K. (2012). Probabilistic social cost-benefit analysis for green roofs: a lifecycle approach. Build. Environ. 58, 152–162. doi:10.1016/j.buildenv.2012.07.005
Brink, E., Aalders, T., ´Ad´am, D., Feller, R., Henselek, F., Hoffmann, A., et al. (2016). Cascades of green: a review of ecosystem-based adaptation in urban areas. Glob. Environ. Chang. 36, 111–123. doi:10.1016/j.gloenvcha.2015.11.003
Carter, T. L., and Rasmussen, T. C. (2006). Hydrologic behavior of vegetated roofs. J. Am. Water Resour. Assoc. 42 (5), 1261–1274. doi:10.1111/j.1752-1688.2006.tb05299.x
Center, L. I. D. (2005). Low impact development for big box retailers. Beltsville, MD, 20705: Prepared By: The Low Impact Development Center, Inc–75. Available at: https://www.waterboards.ca.gov/rwqcb2/water_issues/programs/stormwater/muni/nrdc/19%20lid%20for%20bigbox%20retailers.pdf (Accessed March, 2022).
Collins, K., William, H., and Jon, H. (2008). Hydrologic comparison of four types of permeable pavement and standard asphalt in eastern North Carolina. J. Hydrologic Eng. 13, 1146–1157. doi:10.1061/(ASCE)1084-0699(2008)13:12(1146)
Culligan, P. J. (2019). Green infrastructure and urban sustainability: a discussion of recent advances and future challenges based on multiyear observations in New York City. Sci. Technol. Built Environ. 25 (9), 1113–1120. doi:10.1080/23744731.2019.1629243
Cummings, C. A., Todhunter, P. E., and Rundquist, B. C. (2012). Using the Hazus-MH flood model to evaluate community relocation as a flood mitigation response to terminal lake flooding: the case of Minnewaukan, North Dakota, USA. Appl. Geogr. 32 (2), 889–895. doi:10.1016/j.apgeog.2011.08.016
Cunderlik, J., and Simonovic, S. P. (2004). Calibration, verification and sensitivity analysis of the HEC-HMS hydrologic model. Water Resources Research Report. 11. Available at: https://ir.lib.uwo.ca/wrrr/11 (Accessed April, 2022).
DAEE (Departamento de Águas e Energia Elétrica) (1999). Equações de Chuvas intensas do estado de São Paulo. São Paulo: DAEE/FCTH, 141p. Available online at: http://www.leb.esalq.usp.br/leb/disciplinas/Fernando/leb1440/Aula%203/DAEE_Eq_Chuvas_SP.pdf (Accessed April, 2022).
DAEE (Departamento de Águas e Energia Elétrica) (2013). Plano diretor de aproveitamento de recursos hídricos para a macrometrópole Paulista, no estado de São Paulo. Final Report Volume 1. São Paulo: DAEE. Available online at: https://docs.google.com/uc?export=download&confirm=gKjf&id=0B8iXiItOrl5aQ3FOc3psV0I5b0k (Accessed April 23, 2022).
Decina, T. G. T. (2012). “Análise de medidas de controle de inundações a partir da avaliação de cenários de uso e ocupação do solo na bacia hidrográfica do Córrego do Gregório. São Carlos – SP. Dissertação de Mestrado,” in Engenharia Hidráulica e Saneamento da Escola de Engenharia de São Carlos (Brasil: Universidade de São Paulo. São Carlos-SP), 176.
Dou, J., Wang, Y., Bornstein, R., and Miao, S. (2015). Observed spatial characteristics of Beijing urban climate impacts on summer thunderstorms. J. Appl. Meteorology Climatol. 54 (1), 94–105. doi:10.1175/JAMC-D-13-0355.1
EM - Estação Meteorológica do IAG USP (2020). Boletim climatológico anual da Estação Meteorológica do IAG USP. Available in: http://www.estacao.iag.usp.br/boletim.php (Accessed September, 2021).
EPC (2020). Environmental planning coordinator. Homogeneous units for the use and occupation of urban soil in the São Paulo state, secretary for infrastructure and environment of the São Paulo state. Available at: http://s.ambiente.sp.gov.br/cpla/Ficha_Tecnica_UHCT.pdf (Accessed September 22, 2022).
Escobar-Silva, E. V., Almeida, C. M., Silva, G. B. L., Bursteinas, I., Rocha Filho, K. L., de Oliveira, C. G., et al. (2023). Assessing the extent of flood-prone areas in a south American megacity using different high resolution DTMs. Water 15 (6), 1127. doi:10.3390/w15061127
FCTH - Fundação Centro Tecnológico de Hidráulica (2022). Sistema de Alerta a inundações de São Paulo (SAISP). Available in Portuguese: https://www.saisp.br/historic/201902/dia15/ (Accessed September, 2022).
Feng, S., Hu, Q., and Qian, W. (2004). Quality control of daily meteorological data in China 1951 -2000: a new dataset. Internacional J. Climatol. 24, 853–870. doi:10.1002/joc.1047
Ganeshan, M., Murtugudde, R., and Imhoff, M. L. (2013). A multi-city analysis of the UHI—influence on warm season rainfall. Urban Clim. 6, 1–23. doi:10.1016/j.uclim.2013.09.004
GeoSampa (2020). Coordenadoria de Produção e Análise de Informação (GEOINFO) Secretaria Municipal de Urbanismo e Licenciamento (SMUL) Prefeitura Municipal de São Paulo (PMSP). Available in: https://geosampa.prefeitura.sp.gov.br/PaginasPublicas/_SBC.aspx (Accessed September, 2020).
Ghafouri, A., and Weber, C. (2020). Multifunctional urban spaces a solution to increase the quality of urban life in dense cities. Manzar. Iran. Acad. Open Acc. J. Landsc. 12 (51), 34–45. doi:10.22034/manzar.2020.214183.2023
Golmohammadi, G., Prasher, S., Madani, A., and Rudra, R. (2014). Evaluating three hydrological distributed watershed models: MIKE-SHE, APEX, SWAT. Hydrology 1 (1), 20–39. doi:10.3390/hydrology1010020
Gomez-Ullate, E., Castillo-Lopez, E., Castro-Fresno, D., and Bayon, J. R. (2011). Analysis and contrast of different pervious pavements for management of storm-water in a parking area in northern Spain. Manag 25, 1525–1535. doi:10.1007/s11269-010-9758-x
Gregoire, B. G., and Clausen, J. C. (2011). Effect of a modular extensive green roof on stormwater runoff and water quality. Ecol. Eng. 37, 963–969. doi:10.1016/j.ecoleng.2011.02.004
Gsa, UGSA (2011). The benefits and challenges of green roofs on public and commercial buildings. NW Washington, DC 20405: A Report of the United States General Service Administration, 152. Available at: https://www.gsa.gov/system/files/The_Benefits_and_Challenges_of_Green_Roofs_on_Public_and_Commercial_Buildings.pdf (Accessed February, 2023).
Haddad, E. A., and Teixeira, E. (2015). Economic impacts of natural disasters in megacities: the case of floods in São Paulo, Brazil. Habitat Int. 45 (2), 106–113. doi:10.1016/j.habitatint.2014.06.023
Hallegatte, S., Green, C., Nicholls, R., and Corfee-Morlot, J. (2013). Future flood losses in major coastal cities. Nat. Clim. Change 3, 802–806. doi:10.1038/nclimate1979
IBGE – Instituto Brasileiro de Geografia e Estatística (2022). Censo demográfico. Rio de Janeiro: IBGE. Available online at: https://www.ibge.gov.br/estatisticas/downloads-estatisticas.html.
Joshi, M. Y., and Teller, J. (2021). Urban integration of green roofs: current challenges and perspectives. Sustainability 13 (22), 12378. doi:10.3390/su132212378
Klomp, J. (2015). Economic development and natural disasters: a satellite data analysis. Glob. Environ. Change 6, 67–88. doi:10.1016/j.gloenvcha.2015.11.001
Liang, L., Wang, Z., and Li, J. (2019). The effect of urbanization on environmental pollution in rapidly developing urban agglomerations. J. Clean. Prod. 237, 117649. doi:10.1016/j.jclepro.2019.117649
Lin, W., Ryu, S., and Cho, Y. (2014). A case study of flow characteristics of permeable pavements by time and space model. Can. J. Civ. Eng. 41, 660–666. doi:10.1139/cjce-2013-0165
Liu, W., Feng, Q., Chen, W., and Deo, R. C. (2020b). Stormwater runoff and pollution retention performances of permeable pavements and the effects of structural factors. Environ. Sci. Pollut. Res. 27, 30831–30843. doi:10.1007/s11356-020-09220-2
Liu, W., Feng, Q., Chen, W., and Wei, W. (2020a). Assessing the runoff retention of extensive green roofs using runoff coefficients and curve numbers and the impacts of substrate moisture. Hydrology Res. 51 (4), 635–647. doi:10.2166/nh.2020.167
Manso, M., Teotónio, I., Silva, C. M., and Cruz, C. O. (2021). Green roof and green wall benefits and costs: a review of the quantitative evidence. Renew. Sustain. Energy Rev. 135, 110111. doi:10.1016/j.rser.2020.110111
MDE (2009). Maryland stormwater design manual, environmental site design. Chapter 5, Volumes I, Revised, 128p. Available at: https://mde.maryland.gov/programs/Water/StormwaterManagementProgram/Pages/stormwater_design.aspx (Accessed March, 2023).
Miyahara, A. A. L., Wild, T., Sandre, A. A., Pellegrino, P. R. M., da Silva Filho, C. A., Buckeridge, M. S., et al. (2022). Developing and classifying urban biomes as a basis for nature-based solutions. Urban Clim. 45, 101251. doi:10.1016/j.uclim.2022.101251
Monrose, J., and Tota-Maharaj, K. (2018). Technological review of permeable pavement systems for applications in small island developing states. CLEAN-Soil Air Water 46 (9). doi:10.1002/clen.201700168
Moriasi, D. N., Arnold, J. G., Van Liew, M. W., Bingner, R. L., Harmel, R. D., and Veith, T. L. (2007). Model evaluation guidelines for systematic quantification of accuracy in watershed simulations. Am. Soc. Agric. Biol. Eng. 50 (3), 885–900. doi:10.13031/2013.23153
Moriasi, D. N., Gitau, M. W., Pai, N., and Daggupati, P. (2015). Hydrologic and water quality models: performance measures and evaluation criteria. Trans. ASABE 58, 1763–1785. doi:10.13031/trans.58.10715
Muhammad, S., Reeho, K., and Kwon, K. (2018). Green roof for stormwater management in a highly urbanized area: the case of seoul. Korea. Sustainability 10, 584. doi:10.3390/su10030584
Nguyen, C. N., Muttil, N., Tariq, M. A. U. R., and Ng, A. W. M. (2022). Quantifying the benefits and ecosystem services provided by green roofs - a review. Water 14, 68. doi:10.3390/w14010068
Nobre, C., Young, A. F., Saldiva, P., Marengo, J. A., Nobre, A. D., Alves Jr, S., et al. (2011). “Vulnerability of Brazilian megacities to climate change: the São Paulo metropolitan region (RMSP),” in Climate change in Brazil: economic. social and regulatory aspects. Editors S. Motta Ronaldo, and J. Hargrave (Brasília: IPEA), 197–219. ISBN (online): 9788578111281.
Oleson, K. W., Monaghan, A., Wilhelmi, O., Barlage, M., Brunsell, N., Feddema, J., et al. (2015). Interactions between urbanization, heat stress, and climate change. Clim. Change 129 (3), 525–541. doi:10.1007/s10584-013-0936-8
Ouédraogo, W. A. A., Raude, J. M., and Gathenya, J. M. (2018). Continuous modeling of the mkurumudzi river catchment in Kenya using the HEC-HMS conceptual model: calibration. Validation. Model performance evaluation and sensitivity analysis. Hydrology 5 (3), 44. doi:10.3390/hydrology5030044
Pathak, J., and Eastaff, R. (2014). “Flood forecasting and early warning: an example from the UK environment agency,” in Reducing disaster: early warning systems for climate change (Netherlands: Springer), 185–207. doi:10.1007/978-94-017-8598-3_10
Pirouz, B., Palermo, S. A., Becciu, G., Sanfilippo, U., Nejad, H. J., Piro, P., et al. (2023). A novel multipurpose self-irrigated green roof with innovative drainage layer. Hydrology 10, 57. doi:10.3390/hydrology10030057
PMSP (1999). Diretrizes de projeto para estudos hidrológicos – período de Retorno. Available in: https://www.prefeitura.sp.gov.br/cidade/secretarias/upload/infraestrutura/arquivos/SMSO%202018/DRENAGEM%20URBANA/dh_h01_diretrizes_de_projeto_para_estudos_hidrologicos_periodo_de_retorno.pdf (Accessed March 15, 2023).
Pokojski, W., and Pokojska, P. (2018). Voronoi diagrams – inventor, method, applications. Pol. Cartogr. Rev. 50 (3), 141–150. doi:10.2478/pcr-2018-0009
Rangari, V. A., Umamahesh, N. V., and Bhatt, C. M. (2019). Assessment of inundation risk in urban floods using HEC RAS 2D. Earth Syst. Environ. 5, 1839–1851. doi:10.1007/s40808-019-00641-8
Rangari, V. A., Umamahesh, N. V., and Patel, A. K. (2021). Flood-hazard risk classification and mapping for urban catchment under different climate change scenarios: a case study of Hyderabad city. Urban Clim. 36, 100793. doi:10.1016/j.uclim.2021.100793
Rossini-Penteado, D., Ferreira, C. J., and Giberti, P. P. C. (2007). “Mapeamento do uso e ocupação do solo urbano aplicado à análise de risco (escala 1:10.000),” in FERREIRA CJ [coord]. 2007. Diretrizes para a regeneração socioambiental de áreas degradadas por mineração de saibro (caixas de empréstimo), Ubatuba, SP. Relatório Técnico 3.
Rossini-Penteado, D., and Giberti, P. P. C. (2008). “Uso e ocupação do solo urbano – abordagem na escala 1:50.000,” in Diretrizes para a regeneração socioambiental de áreas degradadas por mineração de saibro (caixas de empréstimo). Editor C. J. Ferreira (Ubatuba, SP: Relatório Técnico 4).
Rouf, T. (2015). “Flood inundation map of sirajgonj district using mathematical model,” in Master of science in water Resources engineering department of water Resources engineering (Dhaka. Bangladesh: Bangladesh University of Engineering and Technology), 126. Available at: http://lib.buet.ac.bd:8080/xmlui/handle/123456789/966 (Accessed March 25, 2023).
Sample, D. J., Heaney, J. P., Wright, L. T., and Koustas, R. (2001). Geographic information systems, decision support systems, and urban storm-water management. J. Water Resour. Plan. Manag. 127 (3), 155–161. doi:10.1061/(ASCE)0733-9496(2001)127:3(155)
Santos, E. T. dos, and Haddad, E. A. (2014). Mapeamento das perdas econômicas potenciais dos pontos de alagamento do município de São Paulo, 2008-2012. Ambiente Sociedade 17 (4), 77–94. doi:10.1590/1809-4422ASOC969V1742014
Semadeni-Davies, A., Hernebring, C., Svensson, G., and Gustafsson, L. G. (2008). The impacts of climate change and urbanisation on drainage in helsingborg, Sweden: combined sewer system. J. Hydrology 350 (1), 100–113. doi:10.1016/j.jhydrol.2007.05.028
Seto, K. C., Sanchez-Rodrıguez, R., and Fragkias, M. (2010). The new geography of contemporary urbanization and the environment. Annu. Rev. Environ. Resour. 35, 167–194. doi:10.1146/annurev-environ-100809-125336
Silva Dias, M. A. F., Dias, J., Carvalho, L. M. V., Freitas, E. D., and Silva Dias, P. L. (2013). Changes in extreme daily rainfall for São Paulo. Brazil. Clim. Change 116 (116), 705–722. doi:10.1007/s10584-012-0504-7
Simas, I. T. H. (2017). Análise retrospectiva de episódios de inundações na Bacia Hidrográfica de Rio Aricanduva - São Paulo. São Paulo: Dissertação de Mestrado, Faculdade de Filosofia, Letras e Ciências Humanas, Universidade de São Paulo, 169. doi:10.11606/D.8.2017.tde-21072017-162915
Simmons, M. T., Gardiner, B., Windhager, S., and Tinsley, J. (2008). Green roofs are not created equal: the hydrologic and thermal performance of six different extensive green roofs and reflective and non-reflective roofs in a sub-tropical climate. Urban Ecosyst. 11, 339–348. doi:10.1007/s11252-008-0069-4
Tate, E., Munoz, C., and Suchan, J. (2015). Uncertainty and sensitivity analysis of the HAZUS-MH flood model. Nat. Hazards Rev. 16 (3), 04014030. doi:10.1061/(ASCE)NH.1527-6996.0000167
Teague, A., Sermet, Y., Demir, I., and Muste, M. (2021). A collaborative serious game for water resources planning and hazard mitigation. Int. J. Disaster Risk Reduct. 53, 101977. doi:10.1016/j.ijdrr.2020.101977
Tomaz, U. R. (2016). Tratamento de Grandes Volumes de Dados Hidrometeorológicos Apoiados por Validação Cruzada em Workflows Científicos. Dissertação (Mestrado em Modelagem Matemática e Computacional) - Instituto de Ciências Exatas, Universidade Federal Rural do Rio de Janeiro, Seropédica - RJ, 2016 117. Available at: https://tede.ufrrj.br/jspui/handle/jspui/2592 (Accessed March, 2023).
UNISDR (2015). The human cost of weather-related disasters: 1995–2015, 30p. Disponível em: https://www.undrr.org/quick/11451 (Accessed March, 2023).
UN - United Nations (2022). The 2030 agenda for sustainable development. United Nations, New York, USA: Department of Economic and Social Affairs Sustainable Development. Available at: https://www.un.org/sustainabledevelopment/ (Accessed January, 2022).
USACE – US Army Corps of Engineers, Hydrologic Engineering Center (2016a). Hydrologic modeling system (HEC – HMS): user’s manual. Davis, 614p. Available at: https://www.hec.usace.army.mil/software/hec-hms/documentation/HEC-HMS_Users_Manual_4.2.pdf (Accessed March, 2023).
USACE – US Army Corps of Engineers, Hydrologic Engineering Center (2016b). River analysis system (HEC – RAS): user’s manual. Davis, 960p. Available at: https://www.hec.usace.army.mil/software/hec-ras/documentation/HEC-RAS%205.0%20Users%20Manual.pdf (Accessed March, 2023).
USDA (1986). Natural resource conservation service. Urban hydrology for small watersheds, TR-55, natural Resources conservation service. Washington, DC: USDA, 164. Available at: https://www.nrc.gov/docs/ML1421/ML14219A437.pdf.
USDA - Natural Resource Conservation Service (2017). “National engineering handbook - Part 630,” in Chapter 9: hydrologic soil cover complexes. September 2017 revision, 53. Available at: https://directives.sc.egov.usda.gov/OpenNonWebContent.aspx?content=41606.wba.
Weiss, P. T., Kayhanian, M., Khazanovich, L., and Gulliver, J. S. (2015). Permeable pavements in cold climates: state of the art and cold climate case studies, Minnesota. 375 Available at: https://hdl.handle.net/11299/174178 (Accessed March 25, 2023).
Xiaomeng, S., Yuchen, M., Yunqing, X., Quan, J. W., Wenyan, W., Jianyun, Z., et al. (2021). Impacts of urbanization on precipitation patterns in the greater Beijing–Tianjin–Hebei metropolitan region in northern China. Environ. Res. Lett. 16 (1), 014042. doi:10.1088/1748-9326/abd212
Yildirim, E., and Demir, I. (2019). An integrated web framework for HAZUS-MH flood loss estimation analysis. Nat. Hazards 99 (1), 275–286. doi:10.1007/s11069-019-03738-6
Keywords: nature-based solutions (NBS), urban area, green infrastructure (GI), green roofs (GRs), permeable pavement, flood mitigation, HEC-HMS model, HEC-RAS model
Citation: Ferreira MJ and da Rocha HR (2023) Green roof infrastructure outperforms grey technology in flood mitigation in São Paulo’s urbanized region. Front. Built Environ. 9:1254942. doi: 10.3389/fbuil.2023.1254942
Received: 07 July 2023; Accepted: 10 November 2023;
Published: 27 November 2023.
Edited by:
Petra Schneider, Magdeburg-Stendal University of Applied Sciences, GermanyReviewed by:
Susanne Charlesworth, Coventry University, United KingdomBarnaby Dobson, Imperial College London, United Kingdom
Copyright © 2023 Ferreira and da Rocha. This is an open-access article distributed under the terms of the Creative Commons Attribution License (CC BY). The use, distribution or reproduction in other forums is permitted, provided the original author(s) and the copyright owner(s) are credited and that the original publication in this journal is cited, in accordance with accepted academic practice. No use, distribution or reproduction is permitted which does not comply with these terms.
*Correspondence: Humberto Ribeiro da Rocha, humberto.rocha@iag.usp.br