Impact Assessment of Storm Surge and Climate Change-Enhanced Sea Level Rise on Atoll Nations: A Case Study of the Tarawa Atoll, Kiribati
 Audrius Sabūnas
 Takuya Miyashita
 Nobuki Fukui
 Tomoya Shimura
 Nobuhito Mori
- 1Graduate School of Engineering, Kyoto University, Kyoto, Japan
- 2Disaster Prevention Research Institute, Kyoto University, Kyoto, Japan
- 3School of Engineering, Swansea University, Swansea, United Kingdom
The Pacific region consists of numerous Small Island Developing States (SIDS), one of the most vulnerable to flooding caused by compound effects of sea level rise (SLR) and storms. Nevertheless, individual studies regarding the impact assessment for SIDS, such as the low-lying Kiribati, remain scarce. This study assessed the impact of climate change-induced storm surge and SLR compounding effects on Tarawa, the most populous atoll of Kiribati, the largest coral atoll nation. It projected the impact using a combined dynamic surge and SLR model based on the IPCC AR5 RCP scenarios and 1/100 and 1/50 years return period storm events. This approach allows estimating the inundation scope and the consecutive exposed population by the end of the 21st century. The results of this study show that the pace of SLR is pivotal for Tarawa, as the sea level rise alone can claim more than 50% of the territory and pose a threat to over 60% of the population under the most intense greenhouse gas emissions scenario. Furthermore, most coasts on the lagoon side are particularly vulnerable. In contrast, the contribution of extreme events is generally minimal due to low wind speeds and the absence of tropical cyclones (TC). Despite this, it is clear the compound effects are critical and may inescapably bring drastic changes to the atoll nations by the end of this century. The impact assessment in this study draws attention to the social impact of climate change on SIDS, most notably atoll islands, and evaluates their adaptation potential.
Introduction
Human-related activities aggravate climate change. One of the phenomena directly related to climate change is sea level rise (SLR). The SLR is the average long-term rise of the ocean surface globally, as observed by the coastal tide gauge and satellite data. In addition to a global scale, the SLR rate may also vary depending on the region (Church et al., 2013). The primary causes of this phenomenon are the thermal expansion of water due to warming and water from melting glaciers and ice sheets (Frederikse et al., 2020). According to NASA’s satellite sea level observations, the sea height variation has increased by 99 (±4) mm between January 1993 and May 2021, making a rate of change 3.4 mm/year globally (NASA’s Goddard Space Flight Center, 2021). This number is more than two times quicker than the increase throughout the 20th century (Frederikse et al., 2020). In addition, the combined individual measurement, tide gauge, and satellite data show that the sea level change has increased over 200 mm between the years 1900 and 2018 (Frederikse et al., 2020).
There should be a complementarity between quantitative and qualitative approaches when assessing vulnerability (Cardona et al., 2012). In the case of disaster risk, the vulnerability includes the characteristics of a group (the island’s population) and their situation influencing their capacity to withstand the adverse effects of physical events (Lavell et al., 2012). A function of four main stressors (physical, socioeconomic, socio-ecological, and climate-induced) can often define vulnerability for islands. As a result, evaluating each stressor is vital for a better estimation of impact magnitudes (Nurse et al., 2014), as the capacity to adapt differs between regions and even within nation-states, with typically little climate adaptation in peripheral islands in the Pacific region (Nunn et al., 2014). In addition, 16% of the land area of small island states lies in low elevation coastal areas (<10 m), in contrast to a global average of 2%, making the small island states vulnerable. The small island states also have the most significant proportion of low-elevation coastal urban land area: 13% (along with Australia and New Zealand), compared to the global average of 8% (McGranahan, 2007). The effect of SLR on Small Island Developing States (SIDS) can be particularly severe since the coastal zones harbour a significant human population and infrastructure. Furthermore, the direct impact is not limited to coastal areas for SIDS consisting of atoll islands.
Measures against inundation and coastal erosion can be categorised into hard protection measures, soft protection measures, and retreat or migration (Donner and Webber, 2014). The hard protection measures include land reclamation and man-built physical barriers. Meanwhile, the soft measures include beach nourishment, reef restoration, and mangrove planting.
The atoll islands are the most vulnerable due to the lack of resilience because of a limited land area offering limited relocation opportunities (Woodroffe, 2008). This situation is further aggravated in some areas in the Pacific where a rise in sea level has been 3–6 mm/year between 1993 and 2017) (Aucan, 2018). In addition, large-scale interannual variability in sea level, up to ±20–30 cm, associated with El Niño-Southern Oscillation (ENSO), has also been reported in this region (Cazenave and Remy, 2011; Becker, 2012). These reasons make accurate SLR projection for the area more challenging.
King tides further aggravate the SLR impact on low-lying lagoon coasts. The king tides is a non-scientific term used to describe extremely or exceptionally high tides, influenced by ENSO cycles, in addition to the gravitational pull of the celestial bodies (Donner, 2012). They could elevate the sea level by an additional 30 cm in the Central Pacific (Duvat, 2013). The king tides could enhance flooding and erosion, especially if coinciding with storm surges. One of the examples of devastating king tide-related events occurred twice in 2004–2005 when the tides flooded several causeways in South Tarawa and damaged a hospital in Betio (Donner, 2012). The number of studies about the impact of SLR on Kiribati in the past is limited. However, there is a record that two of its uninhabited islands, Abanuea and Tebua Tarawa, sank in 1999 due to SLR (Republic of Kiribati, 2015).
Even though the studies and reports regarding the climate change impact on the Pacific Islands, including Kiribati, exist (AusAID, 2006; Oakes et al., 2016), there is a lack of studies, which attempted to estimate inundation scopes in future climate using the existing topography data. The lack of studies can be explained by limited reliable topography data for many islands (Donner and Webber, 2014). Furthermore, the past studies have not done more comprehensive research on how future inundation may affect the indigenous communities. Therefore, this study aims to estimate the total inundation and exposed population scopes due to compounding SLR and storm surge effects on an atoll island under different future climate scenarios and extreme storm events, using existing topography data. In addition, our study further discusses the potential social impact on the population via displacement due to exposure. As a result, a numerical model was used to simulate a storm surge. Firstly, we inputted the topography, bathymetry, atmospheric forcing, and population data. Then SLR was simulated to project compounding effects for modelling the inundation and exposed population scope in the second step. The results allow us to discuss a possible scope of a long-term displacement and assume the social issues that follow if adequate adaptation measures are not secured. Even though the population of Oceania comprises only 0.5% of the world population, biological and cultural diversity, its vulnerability to climate change and high impact variability make this region an important study object.
Study Area
This study focuses on Tarawa Atoll (Kiribati), a low-lying atoll island located in Oceania. Kiribati is an island nation in Micronesia, the smallest subregion of Oceania in the Central Pacific. The country consists of 32 atolls and one raised coral island. Despite being only 811 km2 in land area, the islands that belong to Kiribati are scattered in a vast territory. The islands stretch from 11°25′ S to 4°41′ N and from 169°32′ E to 150°12′ W and are divided into three groups (from west to east): Gilbertese Islands, Phoenix Islands, and the Line Islands. Due to its location close to the equator, Kiribati can be classified as Central Pacific Island. With a population of 110,136 as of 2015, Kiribati is one of the biggest countries by population size in the Micronesia subregion, accounting for more than one-fifth of the total Micronesian population (National Statistics Office of Kiribati, 2016). However, population distribution is very uneven and highly depends on a region. For example, over 90% of the population live in the Gilbertese Islands, constituting only 34.7% of the total land area. In contrast, Phoenix Islands are almost uninhabited, while less than 10% of the country’s population reside in the Line Islands, constituting 61.5% of the country’s area and locating further east.
Tarawa atoll in Kiribati is an equatorial island that belongs to the Gilbertese Islands group located in the intertropical convergence zone (ITCZ) and equatorial doldrum belt (EDB). As a result, the atoll lies outside the tropical cyclone (TC) belt and is not threatened by the TCs passing near its shores. However, occasional winds, primarily easterly winds, are prevalent all year and not strong (Burgess, 1987). The direction differs depending on the season (dry or wet): the winds between the north and east prevail from December to May, while those from the south to east prevail from June to November (Burgess, 1987). El Niño activity may generate intense and persistent winds blowing from the north (Duvat, 2013). The island is long and narrow and has an area of 31.02 km2, and is administratively divided into North Tarawa (15.26 km2) and South Tarawa (15.76 km2). South Tarawa is the seat of the capital. In addition, it is home to >50% of the islands’ population. Therefore, despite a very similar area, South Tarawa, with a population of 56,388, is 8.5 times more populous than North Tarawa, with 6,629 inhabitants (2015 data).
The analysis of Tarawa helps to understand the climate change-induced effects on other low-lying atoll islands, primarily atoll islands in the Pacific Region. The effects on Tarawa atoll (31.02 km2) are analysed, focusing on South Tarawa (15.76 km2). The Tarawa island is a typical low-lying atoll island consisting of a string of islets connected by man-built causeways, forming a large lagoon to the west. It consists of an outer rim of many narrow islets surrounding a lagoon. The islets do not exceed 400 m in width. It has a shallow lagoon-ward slope and an ocean-ward ridge that does not exceed 2–3 m above mean sea level, and a long flat reef. The highest elevation for both North and South Tarawa is 3 m.
Meanwhile, 80% of the area is below 3 m, 55% is below 2 m, and 42% is below 1 m. The tallest point in South Tarawa (Eita village) is only 3 m above sea level. Therefore the SLR is a primary threat to Kiribati (Woodroffe, 2008). The estimates of the SLR speed in Kiribati range between 2.5 mm/year (Becker et al., 2012) and 4.7 mm/year (AusAID, 2006).
Even though they are regarded more as short-term solutions, sea walls are the most widely used hard measures in Kiribati (Duvat, 2013). They are built primarily from coral rock, sandbags, and concrete blocks. These structures dominate the protection measures, as over 90% of the engineered coastal structures in Tarawa are sea walls (Duvat, 2013). However, Duvat reported (2013) that the sea wall has enhanced beach erosion and coastal flooding. The islanders in Kiribati also use mangrove planting, a soft measure, as tidal protection to a lesser extent. Mangrove afforestation has been more successful in outer atolls in Kiribati and Tarawa to a certain extent (Baba et al., 2019).
If these protection measures fail, the population will have no other choice but to migrate. Even though migration is not common among the inhabitants of Kiribati, 14% of all migrations are attributed to environmental change (10% for men and 19% for women), according to the report by Oakes et al. (2016). Furthermore, according to the survey conducted by Kaiteie and Hogan (2008), only 22% of the respondents were willing to move to another island in Kiribati. In contrast, as many as 74% expressed willingness to move to another country, particularly the inhabitants of South Tarawa. Such a tendency contradicts the Kiribati government’s efforts to encourage migration from South Tarawa to Kiritimati, a scarcely populated island from the Line Islands group (Oakes et al., 2016). Too expensive travel costs are among the primary reasons (Oakes et al., 2016). Therefore, the population movements, especially inside the islands of Kiribati, are associated with a higher vulnerability.
On the other hand, the vast majority of migration ambitions remain unrealised due to a lack of money. The mobility in Kiribati highly depends on economic status and factors such as the absence or presence of relatives abroad. The primary destinations for migrants have been Australia, Fiji, Marshall Islands, and Australia. The United Nations report also estimated an increased migration caused by the increasing impact of climate change and population growth, particularly in the capital area (Oakes et al., 2016). For example, the population in South Tarawa has increased more than five times between 1968 and 2015 (Bedford and Bedford, 2010). The continuous population increase in already crowded areas in South Tarawa is creating environmental pressures. However, a considerable international migration may result in the potential loss of culture, identity, land rights, and power (Donner and Webber, 2014).
South Tarawa is densely populated, with the most populated areas exceeding 10,000 people/km2, or almost three times higher than the islands’ average (Figure 1A). Three coastal regions on the island located in the western, central, and southeastern parts of South Tarawa are selected for a more thorough analysis, Figures 1A,B. All three areas are presumably vulnerable to the compounding effects and, besides a high population density, are significant economically and culturally: Betio (location #1 in Figure 2) serves as the country’s principal port, Bairiki (location #2) is a capital area. At the same time, Bonriki is a ground for an international airport (location #3). The northern part of Tarawa was not analysed more in detail, as it has no more significant settlements and is thus considerably less populated than the southern half, despite being of almost the same size.
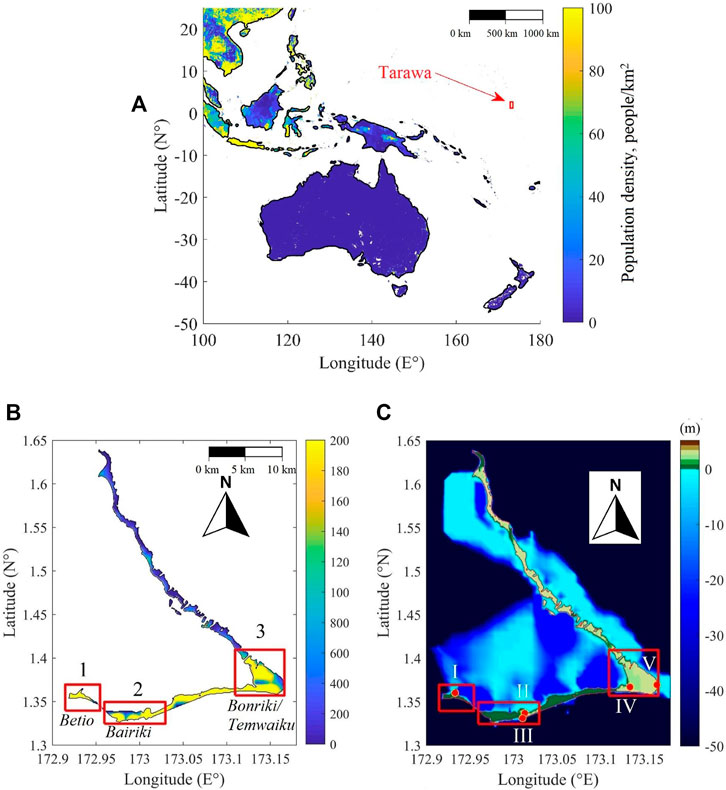
FIGURE 1. Population density map (B) and bathymetry and topography data (C)of Tarawa, with the selected locations in South Tarawa (B): 1—Betio, 2—Bairiki, 3—Bonriki/Temwaiku, and the five points (C), I-V) with the highest local surface elevations [unit: (A), (B) number of people/km2], (C) meters above sea level) and the location of the island in the region (A).
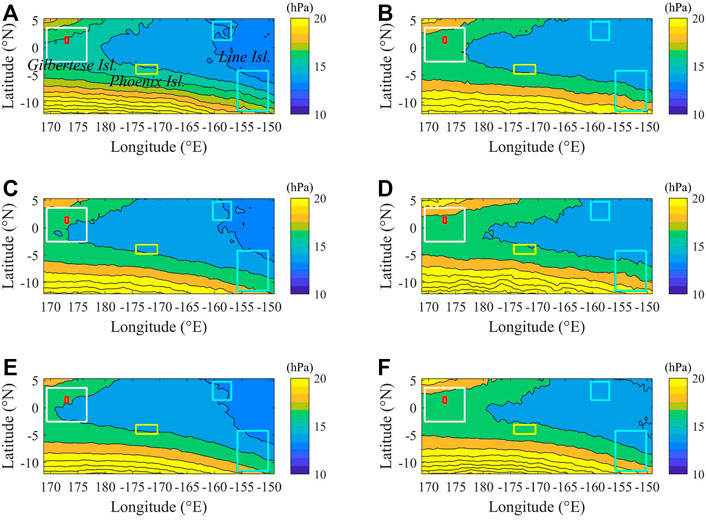
FIGURE 2. Extreme pressure anomalies in the case of 50 (A,C,E) and 100-years-return-periods (B,D,F) events in Kiribati, under the historical climate conditions (E,F), mild radiative forcing future climate, +2K (C,D), and severe radiative forcing future climate projection, +4K (A,B), unit: hPa). A small red box on the top left indicates the location of Tarawa. In contrast, other boxes indicate island groups belonging to Kiribati: the Gilbertese Islands (white), the Phoenix Islands (yellow), and the Line Islands (light blue).
In addition, the study projected height extremes of sea surface elevation in five points (I-V) within three locations (1–3), located in the western, southern, and southeastern parts of South Tarawa (Figure 1A):
#1 Betio area, located 1°21’ N, 172°56’ E. Sea surface elevation on the northern coast of Betio, inside the lagoon, is checked (Point #I, Figure 1B). The number of inhabitants: 13,010.
#2 Bairiki area, located 1°20’ N, 172°59’ E. Sea surface elevation is checked in two points: outside (Point #II) and inside (Point #III) the lagoon. The number of inhabitants: 12,840.
#3 Bonriki/Temwaiku area. Sea surface elevation is checked in two points: inside and outside the lagoon (Points #IV #V, respectively). The number of inhabitants: 21,950.
As coastal features differ depending on the location, the projection of maximal surface elevation may help select appropriate adaptation measures in the future.
Materials and Methods
This section describes the methods developed and used in this study for projecting compounding effects-induced inundation and its impact on the population. The Section 3.1 describes each dataset used for topography, bathymetry, population, and climate data, the Section 3.2 explains the rationale behind bias correction, while the Section 3.3 explains a numerical model.
Topographical, Social and Climate Data
We used data input from topography, bathymetry. The topography and bathymetry data of the target region were compiled using NASA’s Shuttle Radar Topography Mission (SRTM) and General Bathymetric Chart of the Oceans (GEBCO) databases, respectively. Meanwhile, the Global Self-consistent Hierarchical High-resolution Geography (GSHHG) was used for shoreline validation and The Gridded Population of the World, Version 4 (GPWv4) data was used for population numbers.
In addition, Section 3.1.2, Section 3.1.3, and Section 3.1.4 describe SLR data, estimated wind speed data and central pressure, and observed wind speed data and central pressure, respectively.
Topography and Social Data
SRTM was used for topography data input. The SRTM digital elevation model (DEM) provides 3 arcseconds topography data (Jarvis et al., 2008). In addition, GEBCO provided ocean bathymetry data. It is based on a global bathymetric grid with 30 arc-seconds resolution (Becker et al., 2009). A global self-consistent hierarchical high-resolution geography (GSHHG) data corrected the islands’ shoreline. Since a target island is relatively small, we used a shapefile from this dataset. Therefore, the full-resolution shapefiles from the Global Self-consistent Hierarchical High-resolution Geography (GSHHG), Version 2.3.7, June 15, 2017, were used. The study used GPWv4 data produced by NASA Socioeconomic Data and Applications Center (SEDAC) for the population density (Center for International Earth Science Information Network, 2018). It provides an output resolution of 30 arcseconds. The GPWv4 used in this study is a raster data collection, including the population data from the national population and housing censuses conducted in 2005–2014 (CIESIN, 2018). National estimates had been adjusted to the United Nations World Population Prospects to avoid potential overreporting or underreporting (United Nations, 2013). In addition, the dataset used for Tarawa population estimates was corrected using the 2015 Kiribati Census data (Republic of Kiribati, 2015). The aforementioned data were interpolated into the same grid size (3 arcseconds).
Sea Level Rise Data
SLR and sea level pressure (SLP) were integrated into the model as static sea level change linearly. SLR values were inputted from the IPCC Special Report on the Ocean and Cryosphere in a Changing Climate (SROCC; 2019). This study projected two scenarios corresponding to mild and extreme radiative forcing values (IPCC Assessment Report 5 (AR5) RCP2.6 and RCP8.5) (IPCC, 2014). IPCC (2014) AR5 explains the relationship between the SLR and RCPs. According to the SROCC, the projected global mean sea level fluctuates between 0.29–0.59 m and 0.61–1.1 m by the end of the 21st century, depending on the future radiative forcing scenario compared to 1986–2005 (Oppenheimer et al., 2019). This study uses 43 and 84 cm for the respective future scenarios, corresponding to the RCP2.6 and RCP8.5 average values. We chose the RCP2.6 scenario to represent future climate under the scenario, which is the most compatible with the Paris Agreement’s goal. In addition, we selected the RCP8.5 scenario as the opposite scenario, which is likely under the business-as-usual trend.
Climate Projection Dataset From d4PDF
This study used d2PDF and d4PDF mega ensemble climate projections for inputting the SLP values. d4PDF and d2PDF are a set of long-term ensemble climate projections for historical and future climate conditions containing 90–100 members of 60 years of climate runs (Mizuta et al., 2017; Fujita et al., 2019). The ensembles are based on a general circulation model with 60 km resolution and estimate the storm surge along the coast. The projections assume a 4K and 2K global mean atmospheric temperature increase by the end of the 21st century, respectively, compared to the pre-industrial climate conditions. Thus, the +4K climate scenario roughly corresponds to the temperature change under the RCP8.5 scenario by the end of the 21st century. In the same way, +2K roughly corresponds to the RCP2.6 scenario. The large size of the past and future data of climate projections facilitates analysing extreme events, such as 50 and 100-years return value storms, and beyond, without the need for extrapolation or fitting extreme value distribution.
This study considered the SLP when projecting the compounding effects, as its reduction affects sea surface elevation during wind-induced storms. Silvester has defined the relation between this anomaly and surface elevation as (Silvester, 1971):
Sa is the surge amplitude (m), and Pc is the pressure at the storm centre, in hPa. The latter relation is often referred to as the inverse barometer effect and indicates an increase in water level by 0.01 m for a decrease by 1 hPa in atmospheric pressure. We are going to refer to the reduction of SLP as a pressure anomaly.
The area around Tarawa is not known for more intense storms, as it lies out of the TC belt. Therefore, according to the dataset, even 100-years-return period events would not cause a higher than 15 hPa anomaly in either historical or future climates. However, Tarawa and Gilbertese Islands are not an exception in the Kiribati case. Other atolls belonging to Kiribati do not witness intense storms either, with Phoenix and Northern Line Islands located close to the equator even having lower records. Only uninhabited Southern Islands are exposed to more intense storms. The climate projections project a slight increase in SLP in the future, as seen in Figure 2.
As seen from Figure 3 below, territories that constitute Kiribati have low wind speed records. For example, according to the d4PDF past climate projection dataset, the wind hardly ever exceeds 15 m/s in Tarawa. Most islands that belong to Kiribati are also known for weak winds, except for uninhabited southern Line Islands (Figure 3). Meanwhile, the models project a slight rise in the wind speed in the future climate, which is more significant under the +2K scenario. These tendencies differ from the trends in many locations in the Southern Hemisphere, where the intensity of TCs will decrease in the future climate (Mori et al., 2019).
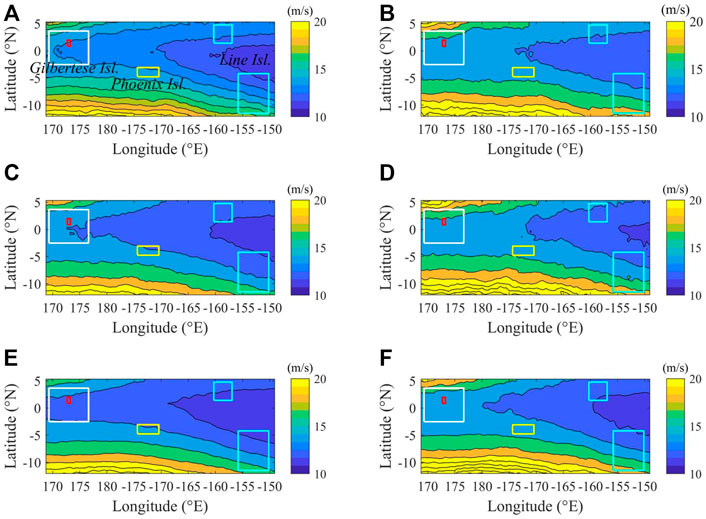
FIGURE 3. Extreme wind speed values in the case of 50 (A,C,E) and 100-years-return-period (B,D,F) events in Kiribati, under the historical climate conditions (E,F), mild radiative forcing future climate (C,D) and severe radiative forcing future climate projection (A,B), unit: m/s). A small red box on the top left indicates the location of Tarawa. In contrast, other boxes indicate island groups belonging to Kiribati: the Gilbertese Islands (white), the Phoenix Islands (yellow), and the Line Islands (light blue).
We compared the projected results with the historical reanalysis data (ERA5) with presumed bias correction as a next step. Then, we inputted a population density dataset (explained in subsection 2.2.1) into the interpolated model for the social impact assessment as a final step. Finally, the study could draw conclusions based on the vulnerability of the Tarawa atoll. The climate data input is explained more in detail in subparagraph 2.2.4.
Historical Dataset From ERA5
The study uses two datasets for wind speed inputs, d4PDF and European Centre for Medium-Range Weather Forecasts (ECMWF) Reanalysis v5 (ERA5), for the wind speed and central pressure values in the past climate. Meanwhile, d4PDF and d2PDF datasets are used for simulating the future climate.
The ERA5 dataset enables tracking the wind speed, pressure and angle tendencies around Tarawa and applying the bias correction for the projected d4PDF past climate dataset. ERA5 is the fifth generation European Centre for Medium-Range Weather Forecasts (ECMWF) atmospheric reanalysis project, which provides global climate data starting from 1950 (out of which the data from 1979 onwards is the final release) (Hersbach et al., 2019). The reanalysis combines model data with observations from across the world into a global dataset through data assimilation. The horizontal resolution is a regular latitude-longitude grid with a horizontal resolution of 0.25° × 0.25°. The wind speed data input used in this study is based on 10 m height wind speed (
Strong winds are not common around Kiribati and typically range between 7.2 m/s and 14.32 m/s. Furthermore, there has been a tendency for the maximal annual wind speed to decrease around Kiribati over the past 4 decades. The trend of a maximum wind speed has weakened by 15%, according to ERA5 data (Figure 4A). Meanwhile, the maximal pressure anomaly around Tarawa is relatively steady and fluctuates between 13.84 hPa and 17.26 hPa. Furthermore, there is no clear trend of increase or decrease in pressure anomaly, as seen in Figure 4B.
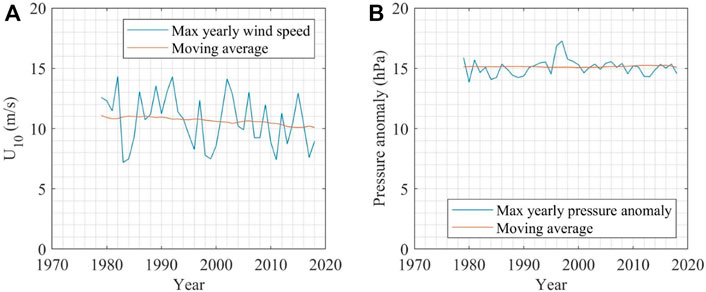
FIGURE 4. Maximum annual wind speed (A) and maximum annual pressure anomaly (B) around Tarawa, according to the ERA 5 data. The blue line indicates max yearly wind speed (A) and pressure anomaly (B), the red line indicates the 40-years moving average [unit—m/s (A), hPa (B)].
After analysing the ERA5 historical wind data, it became clear that the most intensive storms, the most common angles for stronger winds for Tarawa are from the eastern direction (180° and 195° angles). Half of the most intense annual winds tend to blow from these directions (Figure 5). Therefore, these angles tend to have the most intense winds affecting Tarawa. The 180° has had a record of storms exceeding 14 m/s wind speed and 16 hPa in pressure anomaly. It is important to note that there are slight differences in storm features for north-eastern angles when comparing intensity in wind speed and pressure anomaly. While relatively strong winds (by wind speed) have been recorded from the 210° angle, the 195° angle has had more intense winds (by central pressure). Despite being less common, some winds may blow from the north as well, including the winds exceeding 11 m/s wind speed and 15 hPa pressure anomaly (Figure 5). Stronger winds blowing from the angles between 165° and 285° are rare.
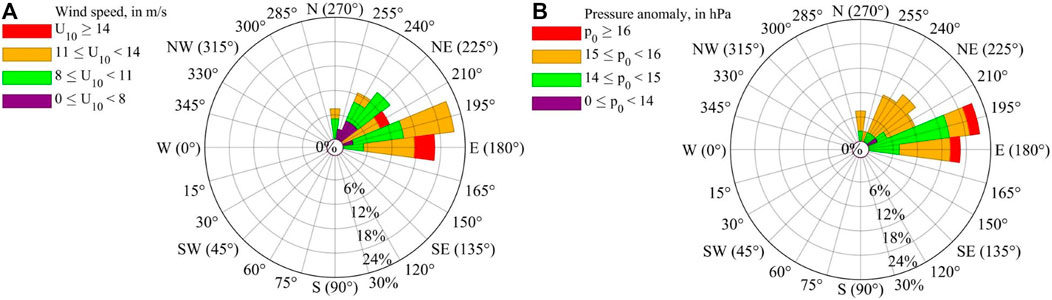
FIGURE 5. Distribution of the most intense storms near Tarawa by the approach angle and (A) speed, (B) pressure anomaly, based on 40 years reanalysis data [colour: (A) wind speed, (B) pressure anomaly, unit—(A) m/s, (B) hPa].
Wind distribution from the reanalysis dataset confirms the New Zealand Meteorological Service data, which reports the prevalence of easterly winds throughout the year (Burgess, 1987). As only the angles between the north and the east have had recorded annual maximum storms, it is possible to conclude that stronger winds blow between December and May (Burgess, 1987). Other than that, more intense northern winds are attributable to El Niño activity (Duvat, 2013). However, the pressure and particularly wind speed of such winds are lower compared to the easterly winds. Therefore the wind angle probability is considered when calculating a weighted average, as depicted in Figure 5 (explained more in detail in subsection 3.3).
Bias Correction of Climate Projection Datasets
The generalised extreme value distribution (GEV) method facilitates the analysis between the d4PDF past dataset and the ERA5 reanalysis dataset, used to correct the bias between the historical datasets. We used the non-parametric method for the correction of future climate models. We used the interpolated ERA5 line as a standard line for the historical climate conditions. A constant for bias correction was derived from the difference between the two lines for correcting future climate averages. We acquired the correction from average annual differences (40-year period) between ERA5 and the historical d4PDF datasets. The d4PDF historical dataset includes annual maximal wind speed values for 6,000 years until 2010. We then recomputed the data for the future d4PDF and d2PDF to correct presumed biases in the climate data by shifting d4PDF and d2PDF return values by the constant). Figure 6 shows the d4PDF and d2PDF extreme wind speed distributions for the historical, +4K, and +2K climates after the bias correction using the non-parametric method.
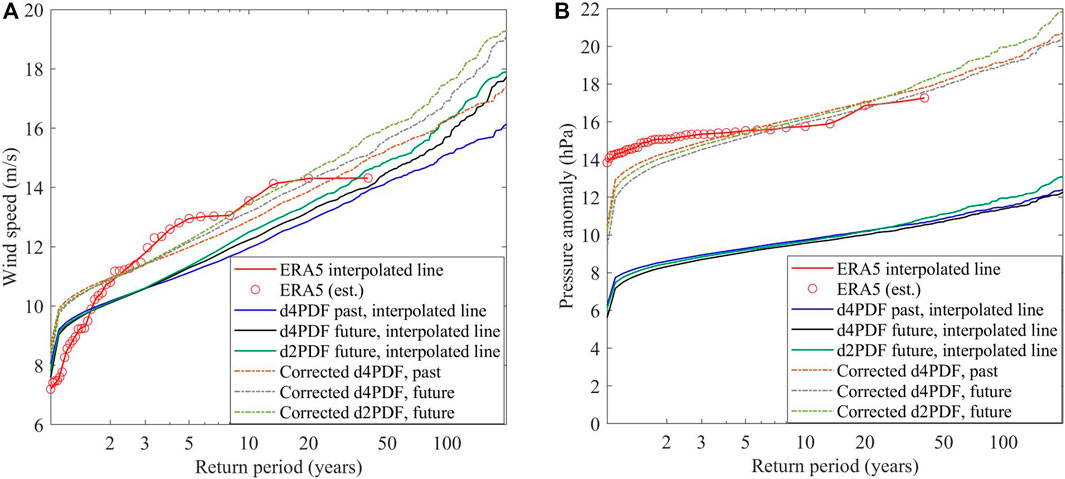
FIGURE 6. Extreme value distributions of annual maximum wind speed, in m/s, (A) and pressure anomaly, in hPa (B). Return period distributions before (solid lines; black: d4PDF future, blue: d4PDF historical, green: d2PDF future) and after the bias correction (dotted lines; grey: d4PDF, green: d2PDF, orange: historical) against the ERA5 dataset (solid red line).
Table 1 presents the values after bias correction. Maximal wind speed values for Kiribati are improbable to exceed 20 m/s under the current climate conditions. Nevertheless, wind speed can exceed 20 m/s in a warmer future scenario in a 500-years return value event. The bias correction results in an increase in wind speed by 7.7% and a 66% increase in pressure anomaly for the given period. Higher bias can be attributable to different average values between ERA5 and d4PDF datasets and potential minor errors in calculating the central pressure of the passing winds. For instance, the most common intense storm is characterised by 10.5 m/s wind speed and 9 hPa pressure anomaly, according to the d4PDF past climate dataset. However, the ERA5 reanalysis depicts the strongest annual storm as 11.5 m/s in wind speed and 15.5 hPa in pressure anomaly. However, due to low values even after a bias correction, a potential error attributed to the differences makes a negligible impact during the further analysis.
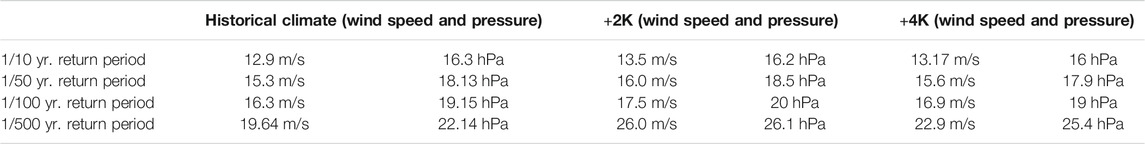
TABLE 1. Comparison of extreme wind speed and pressure anomaly values between past and future climate scenarios after applying bias correction.
After the bias correction, we simulated 50- and 100-years return period storms from the possible angles (refer to Figure 5) for current and future climate conditions. Since the differences in surface elevation under future shoreline change are negligible, we started analysing the storms under the current climate. As a next step, individual contributions were evaluated by modelling the effects of SLR alone, in addition to the analysis of compounding effects. Besides the overall island’s general projection, the exposed population in three selected locations was also thoroughly examined (Figure 1B).
Even though the wind direction did not impact the scope of the exposed population, its impact on the surface elevation height differed two times between northern and eastern wind angles for Point #V.
In addition to modelling the SLR effects, the numerical analysis was applied considering only storm surge and then examining both SLR and storm surge. However, in many cases, the inundated area due to compounding effects was more large-scale than the combined value of individual SLR and storm surge effects. Therefore, we refer to the components attributable to neither SLR nor storm surge as residual effects. The residual effects (RE) are calculated by subtracting the compounding effects (CE), SLR, and storm surge (S) individual effects (Eq. 2).
Residual effects are attributable to peculiarities in a coastal topography, such as spatial dependence of coastal slopes.
Numerical Model Description and Implementation
We used a numerical model for simulating a storm surge under steady wind speed and wind direction, also considering SLR numbers. The numerical model was validated using the analytical solution for ideal bathymetry. The numerical storm surge modelling was based on the linear shallow water equations (SWE) with spherical coordinates, as in an earlier study by Sabūnas et al. (2020). We computed a linear SWE in a spherical coordinate, using surface elevation (η), water flux per unit length in the longitudinal direction (P), and water flux per unit length in the latitudinal direction (Q). The conditions are expressed by the following governing equations:
where t is the time, h the water depth,
In addition, the model also includes SLR by assuming bathymetry subsidence. We used the global mean sea level rise (GMSL) values rather than regional fluctuations, as the resolution of the available regional SLR projections is too coarse for the target region (Oppenheimer et al., 2019). In addition, this study considered the additional effects of king tides, assuming a uniform tide capable of raising the water surface by 30 cm (Duvat, 2013). However, no alterations due to the warming climate were considered.
We calculated the expected values of inundated areas and the population exposed to them under various scenarios. Calculation of the averaged values also took the wind angle probabilities into account. For this reason, the weighted averages,
where
Results
SLR Impact on the Inundated Area and Population
We started Tarawa hazard and risk analysis from the SLR by the end of the 21st century, threatening a large part of the island with a permanent inundation. According to the RCP2.6 scenario, the SLR alone will cause inundation of 4.58 km2, or 14.76% of the total land area, while the RCP8.5 estimated that the inundation area will be 2.5 times larger, i.e., 11.47 km2 (or 37%) of the total land area. Therefore, South Tarawa will be affected much more significantly compared to North Tarawa. Thus, the analysis focuses on inundation effects on South Tarawa (Figure 7A). Meanwhile, the susceptibility of South Tarawa differs by location. Betio area located on the western tip is particularly susceptible to severe inundation even in the RCP2.6 scenario in the future. Therefore, according to the projections, most of the territory will be submerged (Figure 7B).
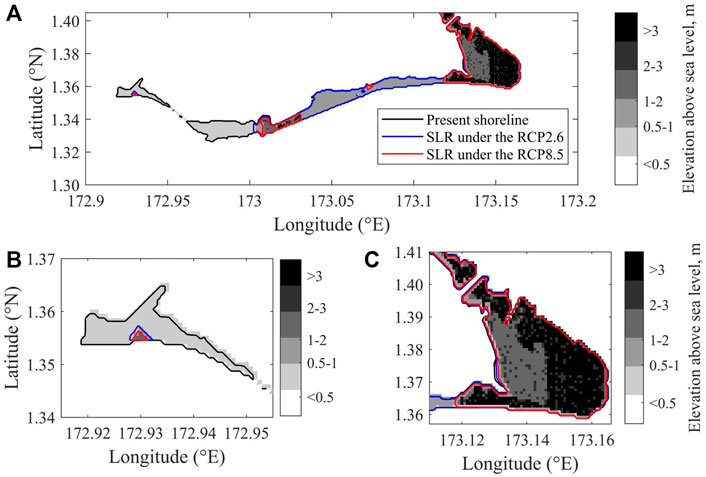
FIGURE 7. Changes in the shoreline by SLR in South Tarawa (A) and locations #1 (B) and #3 (C), refer to Figure 1A) by the end of the 21st century under different SLR scenarios. The black line corresponds to the coastline under present climate conditions; the blue line corresponds to the retreat of the coastline due to SLR under the RCP2.6 scenario. The red line corresponds to the shift in the shoreline due to SLR under the RCP8.5 scenario.
Furthermore, Betio is reportedly the most overcrowded part of Kiribati. On the other hand, the central-southern part of South Tarawa, which includes the capital area, is relatively less affected, but it could be submerged for the most part if the SLR GMSL under the RCP8.5 persists. Meanwhile, the eastern part of South Tarawa is the most secure for the effects of SLR and considerably affected only under the RCP8.5 scenario (Figure 7C). That makes this area among the least susceptible ones to inundation in the South Tarawa context. The results show that the western tip (Location #1) and the central region (Location #2), both the most densely populated areas, have most territories lying below 1 m, which signifies almost a total submersion under the RCP8.5 scenario. Despite having a more elevated topography, the northern tip of the Tarawa Atoll may suffer from similar scopes of inundation to the southwestern tip.
However, permanent inundation projections and the figures of the population living in these areas are critically high for Tarawa, particularly the more densely populated southern part. Therefore, considerable portions of the three screened sites are going to be considerably affected. Over 90% of the population will be exposed in Location #1. This location has the highest proportion of areas below 0.5 m. Meanwhile, SLR will impact almost half of the population under the RCP2.6 scenario in the capital area (Location #2). Unlike the previous two, the displacement threat for the inhabitants in Location #3 is minimal under this scenario. However, despite relatively low proportions of inundated areas, over 28% of the local population may be displaced if the GMSL reaches the projections of the RCP8.5 scenario. Such figures are still below the estimates of the whole Tarawa atoll, where the exposed population numbers under the RCP8.5 scenario is over 58%. Table 2 provides a more detailed explanation for each location in South Tarawa.
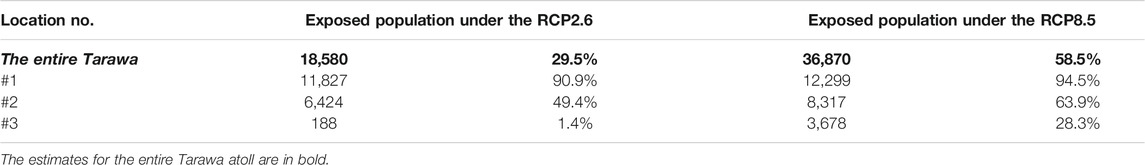
TABLE 2. Estimated exposed population (total number and percentage) under different SLR scenarios.
Site-Dependence of Coastal Inundation
The analysis of the compounding effects-induced sea surface elevation height is essential for considering future adaptive measures for protecting low-lying areas from inundation in the future. The study compared surface elevation heights near the selected five sites inside (#I, #II, #IV) and outside (#III, #V) the lagoon in the numerical model to make this analysis.
Furthermore, less probable northern winds can elevate a larger surface area of a lagoon than other wind angles. It is only under the winds blowing between 240° and 270° that South Tarawa is more affected by ocean surface elevation (Figure 8A). The 50 and 100-years return value storms are capable of causing up to 14% of the difference in the elevation height. This difference is observed in Point #V, where the highest elevation is caused by 270°-angled winds and the lowest for 180°–210°. Meanwhile, 100-years return values can elevate sea surface 25.5 cm under the historical climate conditions in Point #II, with northern winds being the most impactful. In general, winds from none of the directions can cause more significant elevation on the south shore of South Tarawa. However, surface elevation is slightly higher in the points inside the lagoon (15–26 cm) than on the ocean side (14 cm), except for Point #IV (up to 15 cm elevation), partly due to the more shallow north shore. The elevation under 50-years return value storms fluctuates between 0.13 and 0.23 cm but could be only 0.11 cm if only a barometer effect plays a principal role.
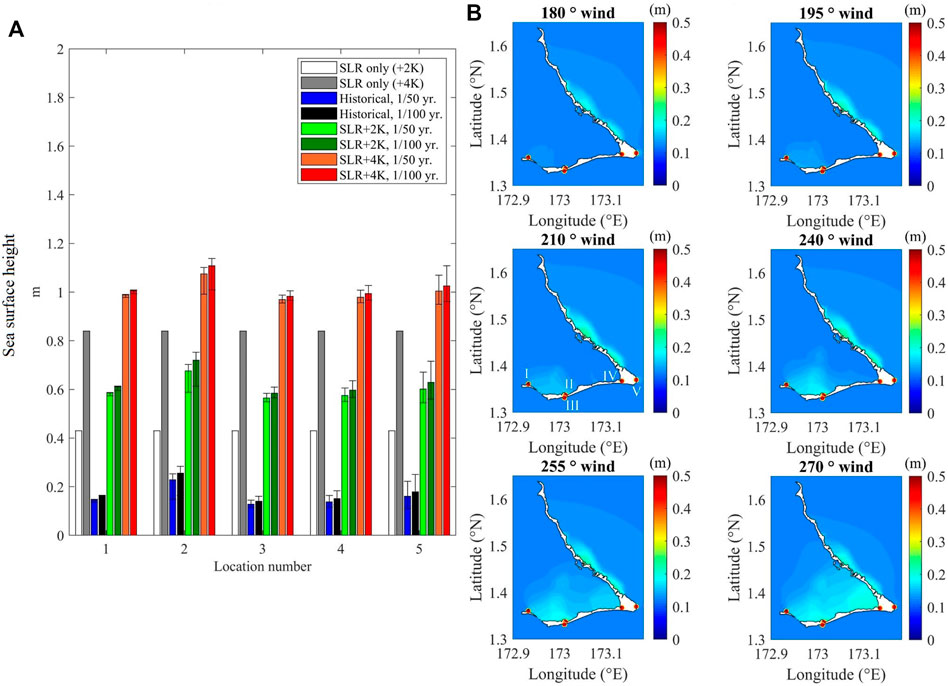
FIGURE 8. Maximum surface elevation height in coastal points [(A), bars: weighted average surface elevation height under different SLR (white and grey) and cumulative SLR and surge (blue to red) scenarios] and spatial distribution under varying wind angles [(B), refer to Figure 5 for a numbering convention; circles: the selected #I-#V points]; unit: m).
As we may notice, sea surface elevation predominantly depends on the SLR pace rather than wind angles or even the return period of a storm. However, due to compounding effects though, surface elevation can reach 0.98–1.11 m in the above-mentioned coastal points (Figure 8A). In addition, king tides can increase these numbers to 1.28–1.41 m, critical to the coastlines inside the lagoon and generally steeper shores on the ocean side. As a tendency, similar height both inside (#I, #II, #IV) and outside (#III, #V) of the lagoon.
Compounding Effects Impact on Inundation
This section analyses an individual contribution of each component of the compounding effect, i.e., SLR and storm surge.
The weighted average of inundation in a 1/100 years storm under the +4K future climate fluctuates is 11.47 km2 or 36.98% of the territory. The inundated area scope is quite similar among the storms of different return periods. The difference between inundated areas between 1/100 and 1/50 years return period storms is smaller than 0.08% (Figure 9).
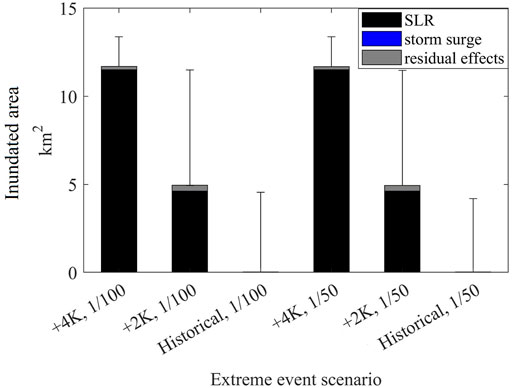
FIGURE 9. Weighted average values of inundated areas under different storm intensity and climate scenarios (1/100 and 1/50 under the +4K, +2K, and historical climate conditions), indicating the contribution of SLR and storm surge (error bars: additional inundation in the case of king tides; unit: km2).
SLR effects were the most contributing factor for the inundation in Kiribati for either storm or future climate scenario, but particularly under the +4K climate where over 98% of the inundation could be attributed to the SLR. Meanwhile, storm surge contributions were minimal, did not exceed 1% even under the +2K climate, and were negligible under the +4K climate. Residual effects fluctuated between 1.5 and 6.6% for the inundated areas under future scenarios and were, therefore, a few times more significant than storms. Consequently, either 1/100 return or 1/50 return period storms would inundate as little as 0.04 km2 (or 0.13%) of the island’s territory (Figure 9).
In the case of such storms., the king tides may increase the inundated area over 100 times, i.e., to 4.2 and 4.56 km2, respectively. King tides’ contribution is also very significant under the +2K climate, where inundated areas would increase 2.5 times and reach the inundation scope of inundation under the +4K climate scenario. Meanwhile, the individual contribution of king tides is less critical for +4K storms where the inundated area would increase by 17%. However, the presence of king tides would result in the inundation of 43% of the island’s territory.
While the inundated areas projected for Kiribati are critically large, the vulnerability levels are uneven inside South Tarawa (Figure 10A). However, SLR played a significant role in the inundation of all locations. Betio area (location #1) is particularly susceptible, as the most critical parts will be submerged because of the effects of SLR under the RCP2.6 scenario (Figure 10B). Meanwhile, the storm-induced effects are almost negligible. On the other hand, Bonriki/Temwaiku area will not significantly affect inundated regions, while the storm-related effects are minor (Figure 10C).
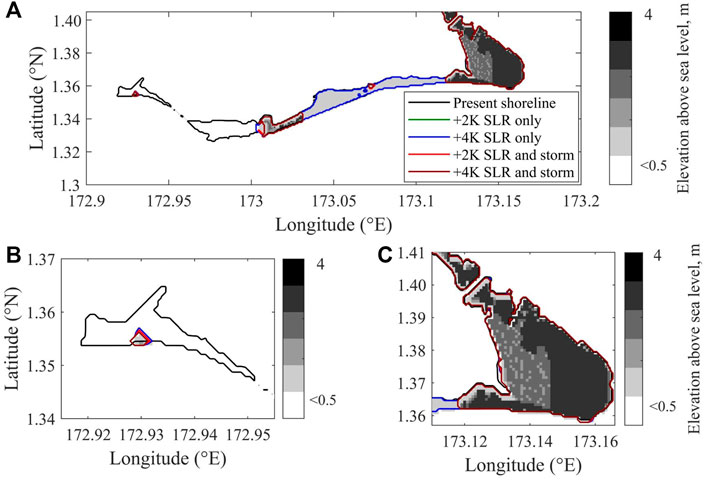
FIGURE 10. Inundated area due to the compounding effects in South Tarawa (A), locations #1 (B) and #3 (C), (refer to Figure 1B) by the end of the 21st century (lines; black: coastline under present climate conditions, green: coastline under the RCP2.6 future climate, blue: coastline under the RCP8.5 future climate, red: maximum inundation boundaries due to compounding effects under the RCP2.6, crimson: maximum inundation boundaries due to compounding effects under the RCP8.5).
Exposed and Displaced Population Estimates
The weighted average of the population exposed to the compounding effects in a 1/100 years storm under the +4K future climate is 59.4% of the population. As one may see, the proportion of the population to be exposed is significantly higher than the proportion of the land to be inundated. Nevertheless, the exposed population scope is quite similar between 1/50 and 1/100 years storms, irrespective of the return period of a storm—the estimates differ by only 0.04%. This tendency is because the wind direction does not have or have a negligible effect on the population size to be exposed.
The contribution of SLR to the exposed population in Kiribati is even more pronounced compared to its effects on inundation. While this applies for storms in either future climate scenario, it is particularly pronounced under the +4K climate, where 98.5% of the inundation could be attributed to the SLR. Meanwhile, storm surge contributions were negligible for all future storms and did not exceed 0.6% even under the +2K climate. Consequently, residual effects were lower than in the calculations for the inundated areas. The values fluctuated between 1.2 and 5.8%. The findings allow us to conclude that residual effects from the storms are more critical than storms in both inundated areas and exposed population cases. Consequently, either 1/100 return and 1/50 return period storms would directly affect only 47 inhabitants (or 0.07% of the island’s population) under current climate conditions (Figure 11).
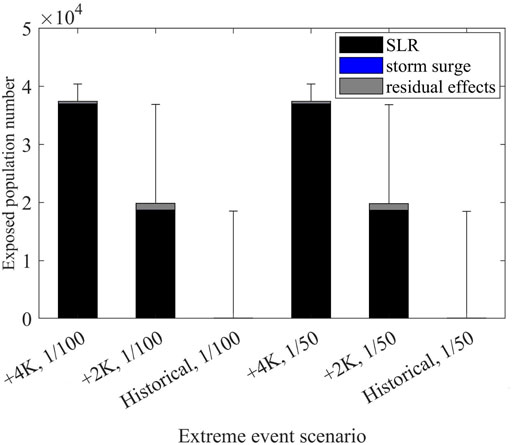
FIGURE 11. Weighted average values of the population numbers exposed to inundation under different storm intensity and climate scenarios (1/100 and 1/50 under the +4K, +2K, and historical climate conditions), indicating the contribution of SLR and storm surge (error bars—additional inundation in the case of king tides).
However, storms under the current climate conditions can be devastating for the local population if strengthened by king tides. The king tides may increase the exposed population numbers almost 400 times, i.e., to 18,500 people, respectively, under such storms. King tide contribution is also very significant under the +2K climate, where such numbers would increase 86% and reach the scope under the +4K climate scenario. Meanwhile, the individual contribution of king tides is less critical for +4K storms where the exposed population would increase by 8%. However, the presence of king tides would result in the exposure of the majority of the island’s population, i.e., 64%.
As we have already seen, South Tarawa is generally susceptible to the compounding effects, particularly the SLR and king tides. However, the vulnerability level differs depending on the location (Figure 12A). As previously noted in the SLR-related effect analysis, Location #1 is sensitive even to lower future SLR projections due to very low elevation. In contrast, strong winds for the current climate do not pose any significant threat to the local population in Location #1. The most probable winds would not result in the inundation of inhabited areas. The situation changes dramatically if these storms coincide with king tides. The compounding effect of king tides can expose approximately 90% of the population in this location. Meanwhile, storms and SLR compound effects would increase the exposed population numbers to 93.8–96.8% under +2K and +4K climate, respectively. The presence of king tides may result in the exposure of literally the entire population, i.e., 94.5–97.6% of the local population (Figure 12C). Apart from a large-scale displacement from this area, we may assume tremendous economic impact due to the infrastructure loss of the country’s most prominent port.
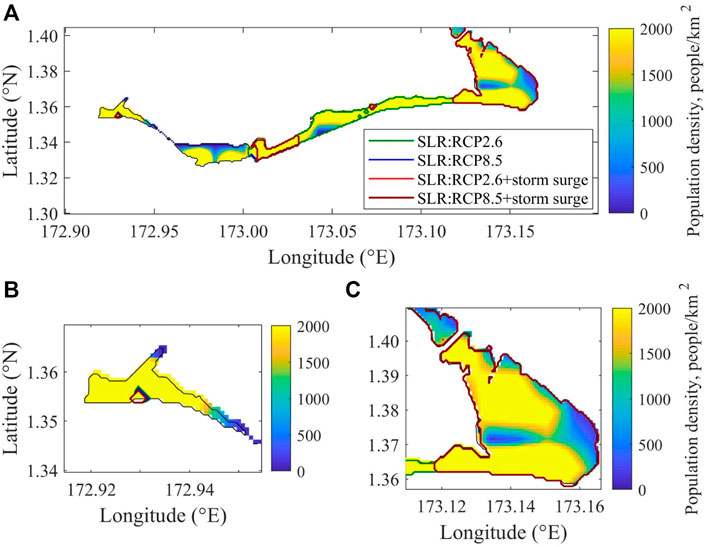
FIGURE 12. Projected shoreline change in South Tarawa (A), location #1 (B), location #3 (C) (lines; green: shoreline change due to SLR by the end of the 21st century under the RCP2.6 scenario effects, blue: shoreline change due to SLR under the RCP8.5 scenario effects, red: shoreline change due to compounding effects under the RCP2.6 scenario, crimson: shoreline change due to compounding effects under the RCP8.5).
In comparison, the population in Location #2 will be less affected, and the exposure rates are likely to resemble the average of Tarawa (Figure 12A). However, Location #1 (Figure 12B) has particularly low-lying areas, thus populated regions could become inundated even during the storm events alone under current climate conditions. Despite this, the number of the population to be exposed during such events is only 0.71%. The situation is dramatically different if king tides are present, as they would increase the number of the exposed population over 70 times—to 49.8%. Overall, compound effects of storms and SLR can affect most local people, i.e., 51.2–65.3%, depending on the future climate. The impact of king tides would aggravate the situation by exposing 64.8–78.2% of the populace in the area under the +2K and +4K future climate, respectively (Figure 12A). Considering that this location is a capital area, this would bring heavy consequences to the country.
Conversely, Location #3 appears to be the least affected area in South Tarawa, owing to its relatively higher elevation above MSL (Figure 12C, Figure 12). Similar to Location #1, extreme storm events alone would have negligible effects on the local population. However, differently from the previously analysed locations, the strong winds and king tide would expose only 0.63–0.73% of the local populace. Furthermore, the consequences will remain minimal under the +2K climate—3.9% of the local population will be directly exposed due to rising sea levels. By contrast, the presence of king tides would increase this number more than fourfold—to 16.8%. Only under the +4K climate would the compounding effects become graver on the population, as 16.9% of the population will be exposed. Furthermore, if king tides are present, these numbers would increase to 21.3–21.4%, depending on the return period of the storm. Therefore, while the percentage of the exposed population is approximately three times lower than the island’s average, +4K future climate may also pose a considerable threat to the populace in Location #3 (Figure 12C, Figure 13). Even though less vulnerable than capital or port area, the location may suffer from adverse effects, as it is where an airport is situated. Furthermore, the scope of the potentially displaced population from the western regions will aggravate the possibility to relocate to a relatively safer Location #3. In addition, limited land area and the developed industrial infrastructure would limit the construction of new houses.
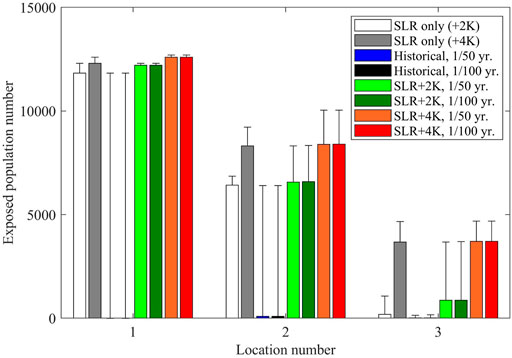
FIGURE 13. Exposed population numbers in different locations compared to the effect of the SLR only by the end of the 21st century (bars: weighted average under various SLR (white and grey) and cumulative SLR and surge (blue to red) scenarios; error bars—additional inundation in the case of king tides).
To summarise, one may conclude that populated areas in Tarawa are vulnerable to future SLR, but the vulnerability depends on the location. The Discussions paragraph provides the discussion on the possible long-term displacement scopes of the inundated population.
Discussion and Conclusion
This study presents an impact assessment of coastal inundation by the SLR, storm surge, including the tidal effects, on Tarawa, the principal island of Kiribati. The study uses a numerical model for projecting the area inundated by the SLR and storm surge. In addition, the population density data allows us to estimate the population displacement scope. A few studies about the SLR-driven coastal changes on atoll islands exist. One of them used an improved digital elevation model (CoastalDEM) and projected the displacement of 32% of people in Tarawa by 2,100, assuming the SLR limits between 0.5 and 1.2 m (Mulhern, 2020). These findings roughly correspond to the exposed population numbers projected in the case of +2K climate in this study (29.5%).
Even though it focuses primarily on climate-induced and physical stressors, a brief discussion about socio-ecological and socioeconomic stresses is crucial for better understanding the issues for Kiribati throughout the 21st century due to compounding effects. This study contributes to a better understanding of the social impact of climate change on low-lying island populations. The efficiency of adaptation measures will be a decisive factor for the actual scope of the displaced population. Therefore, we will discuss the space for climate adaptation and mitigation for Kiribati based on the findings from the projections and the data regarding adaptation and mitigation capacity. There is high confidence that anthropogenic coastal modifications can mitigate the SLR effects (Oppenheimer et al., 2019). However, the adaptive capacity highly depends on economic power. Kiribati is recognised as a least developed country with a small economy characterised by slow growth and thus not possessing a promising capacity (Republic of Kiribati, 2015). Furthermore, since most of the island lies below 2 m above sea level, successful adaptation will require international assistance, putting the country into uncertainty and creating new vulnerabilities, as foreign aid already makes a significant part of the country’s GDP. World Bank has estimated impacts on Tarawa to cost between US$8 and US$16 million annually (∼13.2% of the country’s GDP) by 2050 (The World Bank, 2020).
Nonetheless, even though presumably high GMSL poses an existential threat to atoll islands, the response of each islet will depend on sediment dynamics, human modification, and reef growth (Donner and Webber, 2014). This study found that the storms under the current climate conditions can be considerably devastating, as long as high king tides accompany them. In Kiribati, South Tarawa Island heavily relies on sea walls (Duvat, 2013), which are not long-term solutions. In addition, mangrove forests serve as bio-shields for their ability to dissipate storms (Feagin et al., 2010). Even though mangrove forests had initially sharply decreased due to development, some afforestation initiatives have been implemented successfully in Tarawa in recent years. For example, the International Society for Mangrove Ecosystems based in Okinawa, Japan, has been planting Rhizophora stylosa along the shores of sheltered lagoons with the help of a local community to increase the area covered with these plants, even though the total numbers for Tarawa remain unknown (Baba et al., 2019). Spalding et al. (2010) estimate 2.58 km2 of areas covered in mangroves as of 2010, although these are limited to Gilbert group islands. In addition, mangroves and seagrass are essential for biodiversity in coastal areas. Furthermore, mangroves and seagrass also play a role as carbon sinks, thus creating synergies between climate change adaptation and mitigation (van der Werf et al., 2009).
Finally, this study may spark new discussions about displacement-related social issues. However, we could not draw a linear relationship between the exposed population and displacement due to the multi-causality of migration. On the other hand, one may note that compounding effects could aggravate the following climate-sensitive risks: water security and safety, food security and safety, vector-borne diseases, and population pressures (McIver et al., 2016). All these lead to the assumption that people could not come back once their households are inundated permanently. A lack of area to migrate internally and the possible freshwater resources salinisation due to continuous ocean water intrusion may force a significant part of the displaced population to flee abroad. In theory, however, the response of the affected population may differ depending on multiple factors. A study by Curtain and Dornan (2019) draws three possible scenarios of a mass population movement caused by climate change: 1) migration which is limited to well-prepared people, 2) movement of displaced people (i.e., forced displacement), 3) no movement, irrespective of dire circumstances. Therefore, climate change-related migration issues may become a challenge in the 21st century (Brown, 2008). Even though based on the anecdotal evidence brought upon by journalists and activists, it is probable that countries with substantial permanent displacement numbers could face the extinction of local cultures and languages. One documented case when a language vitality becomes critical after an extreme event claimed the lives of the speakers of Dusner language in Dusner village, Papua, Indonesia, is mentioned by Malvem (2011).
Another example was Japanese dialects in the Tōhoku area that have become on the verge of extinction because of the Tōhoku earthquake and tsunami in 2011 (The Japan Times, 2018). Several sociological studies conclude that displaced people are subject to physical, economic, and social exclusion (Cernea, 2005). In addition, they are forced to abandon their usual ways of life (Berchin et al., 2017), which might facilitate the loss of languages that are already endangered, with the vulnerability and exposure also depending on wealth and education. However, in the case of Kiribati, it is doubtful whether the displacement due to SLR may make an impact. There are a couple of reasons for that. First, due to meagre migration rates to this date, migration patterns in the case of Kiribati are highly unknown. Secondly, Gilbertese, a local language, does not fall into a category of endangered languages. In addition, fertility rates are high and exceed replacement-level fertility. According to the IUCN Red List, used to evaluate the extinction risk of species, small geographical range sizes, small speaker population sizes, and rapid declines in speaker numbers signalise the threat of languages and cultures (Amano et al., 2014).
Meanwhile, I-Kiribati, the local language, may arguably fall into the first category. However, it is impossible to estimate how rapid the decline in speaker numbers is and to what extent it will be attributable to climate-driven migration. Even if adaptability does not save Tarawa from the population decrease, it is impossible to accurately predict the behaviour and migration opportunities for the local population. Some islands, namely Kiritimati, the most spacious eastern island in the Line Islands Group, are in a better situation, thus providing theoretical relocation possibilities. However, the results of some surveys indicate that the people would be likely to migrate abroad in case they had to leave their island (Kaiteie, Hogan, 2008). Other options include purchasing parts of Vanua Levu Island in Fiji for relocation when climate change impact becomes too severe or international migration to other countries (Hermann and Kempf, 2017). This situation, however, could put international migrants at risk of “becoming economically, politically, socially and culturally marginalised” (Oakes et al., 2016). As a consequence, it could create social issues regarding the survival of indigenous Kiribati culture and language if such migrations were to become large-scale in the future.
As seen from the results of this study, the extent of inundation for Kiribati highly differs depending on the future radiative forcing scenarios, as exceeding +2K warming may be fatal to Tarawa Island. The Paris Agreement, signed in 2016, if seriously adhered to by the state parties, can serve as a constructive framework to address climate change and thus minimise its effects on the low-lying island nations and territories (Ekardt et al., 2018). While SIDS’s contribution to the global GHG emissions is highly insignificant, Kiribati and many other SIDS in Oceania will be affected by the SLR gravely even in future climates below the +2K warming threshold. Nevertheless, the Government of Kiribati has pledged to promote renewable energy and minimise its reliance on fossil fuel exports that remains a critical issue, weakening adaptation and mitigation positions (Republic of Kiribati, 2015). Tarawa Island suffers from coastal erosion as a negative consequence of SLR. Meanwhile, a good combination of hard and soft measures may improve the situation. A sustainable and long-term design requires additional means to reduce wave energy, such as vegetation or engineering breakwaters, adequate planning and an appropriate hydrodynamic analysis that remain challenging for SIDS.
However, even in the case of an exceptional adaptation to the rising sea levels, salinisation of the lens is a serious issue, which could significantly aggravate adaptation efforts and may force to leave all projected exposed population (or even higher numbers, Kuruppu and Liverman, 2011).
To sum up, based on the analysis, one can note that storms under current climate conditions do not pose any considerable threat to Tarawa unless intensified by king tides. Sea walls may be capable of countering sea surface elevation, which can reach 0.26 m in coastal zones in the case of 100-years return period storms, especially if king tides are not present.
Meanwhile, this contrasts with the effects of SLR on the island and its population under the future climate. Due to many low-lying areas, even SLR alone under the RCP2.6 scenario can inundate more than one-seventh of the island’s surface area and 37% in the case of the RCP8.5 scenario. In addition, compounding effects may elevate such numbers to 37.6–37.7%, depending on the storm surge return period. As storms are typically not intense, the inundated scope is almost the same, regardless of wind direction. In contrast, sea surface elevation fluctuates between 0.11 and 0.26 m, depending on the wind angle and location. King tides, if reached 30 cm, could also be significant for inundation and risk exposure. The compounding effects of storms, king tides and SLR could inundate over 37% of Tarawa, mostly South Tarawa. On top of that, the main port and capital infrastructure are situated in particularly vulnerable locations.
Furthermore, due to a very high population density in South Tarawa, the ratio of the exposed population exceeds one of the inundated areas. Therefore, even though relatively strong storms under the current climate conditions could impact only 0.07% of the populace even in more vulnerable areas of South Tarawa, the SLR alone can directly affect almost 30% to approximately 59% of local people in Tarawa, depending on the RCP scenario. That could mean a complete submersion of considerable territories in Betio and around the capital region. In the case of relatively strong winds, these numbers would increase 6.8–1.5%, respectively. Furthermore, the presence of king tides would inundate the areas inhabited by 59–64% population.
Speculation on the number of displaced people who would have to become international environmental migrants would inescapably create more inaccuracies in the study. On the one hand, the response depends on adaptation, namely the success in blending hard and soft protection measures, the dynamics of local SLR, and the SLR-reef growth dynamics. On the other hand, looking from the global perspective, the future climate change mitigation policies can be a crucial factor that will decide whether low-lying islands will be habitable or not. However, if the worst climate scenario follows, the effects of climate change may ultimately have profoundly negative impacts on the culture of Kiribati due to large-scale forced migrations.
The major limitation of this study is neglecting individual tropical cyclone characteristics (intensity, angle, size and moving speed) to reduce computational costs. Future studies would also benefit from a more thorough social impact analysis on the island’s population and similar studies on other SIDS in Oceania. Furthermore, making a more complex model, which considers the local sea level rise rather than the GMSL in the future and waves contributions to coastal flooding, may yield better results for the impact assessment (Wandres et al., 2020). The estimated projections of the inundated areas may be slightly lower, based on the newest IPCC report, which estimates a 5 cm lower sea level increase under the very high GHG emissions scenario (IPCC, 2021). However, the new report also projects a 1.5°C-compatible very low GHG emissions scenario, under which the sea level increase would be 1–2 cm lower on average than according to the IPCC AR5 report (IPCC, 2021). Therefore there is a small overestimation in projections only for the RCP8.5 scenario. On the other hand, the study does not take into consideration population growth by the end of the 21st century, including the most populated areas, which could mean an underestimation of the percentage of the exposed population in some cases. In addition, a topography model with a higher resolution would enable us to identify the most vulnerable zones in the island more accurately. Moreover, the study lacks a more detailed analysis of human behaviour, which is crucial for more accurately discussing the arising vulnerabilities in the future.
Data Availability Statement
The original contributions presented in the study are included in the article/Supplementary Material, further inquiries can be directed to the corresponding author.
Author Contributions
Numerical simulation, validation, analysis of the results, preparation of the manuscript, and revisions (AS); interpolation of coastline, bathymetry and topography datasets, improvements of the SWE storm surge code stability, revisions (TM); updating the SWE storm surge code (NF); ERA5, d2PDF, d4PDF data input, revisions, improvements of the SWE storm surge code stability (TS); initial SWE storm surge model, supervising, modifications, improving the coastline in the model (NM).
Funding
A part of this research is supported by the Integrated Research Program for Advancing Climate Models (TOUGOU) Grant Number JPMXD0717935498 by the Ministry of Education, Culture, Sports, Science, and Technology (MEXT), and the Climate Adaptation Program by the National Institute for Environmental Studies (NIES).
Conflict of Interest
The authors declare that the research was conducted in the absence of any commercial or financial relationships that could be construed as a potential conflict of interest.
Publisher’s Note
All claims expressed in this article are solely those of the authors and do not necessarily represent those of their affiliated organizations, or those of the publisher, the editors and the reviewers. Any product that may be evaluated in this article, or claim that may be made by its manufacturer, is not guaranteed or endorsed by the publisher.
Acknowledgments
AS would like to express utmost gratitude to the Ministry of Education, Culture, Sports, Science and Technology of Japan (MEXT) for providing with a scholarship.
References
Amano, T., Sandel, B., Eager, H., Bulteau, E., Svenning, J.-C., Dalsgaard, B., et al. (2014). Global Distribution and Drivers of Language Extinction Risk. Proc. R. Soc. B. 281 (1793), 20141574. doi:10.1098/rspb.2014.1574
Aucan, J. (2018). Effects of Climate Change on Sea Levels and Inundation Relevant to the Pacific Islands, Pacific Marine Climate Change Report Card. Sci. Rev., 43–49.
AusAID (2006). Pacific Country Report on Sea Level and Climate: Their Present State. Kiribati, 32. Available online at: https://www.sprep.org/att/IRC/eCOPIES/Countries/Kiribati/4.pdf (Accessed October 10, 2021).
Baba, S., Chan, H. T., Kainuma, M., Oshiro, N., Kezuka, M., Kimura, N., et al. (2019). Adaptation to Climate Change through Mangrove Rehabilitation Involving Local Community Participation. ISME/GLOMIS Electron. J. 17 (2), 4–14.
Becker, J. J., Sandwell, D. T., Smith, W. H. F., Braud, J., Binder, B., Depner, J., et al. (2009). Global Bathymetry and Elevation Data at 30 Arc Seconds Resolution: SRTM30_PLUS. Mar. Geodesy 32 (4), 355–371. doi:10.1080/01490410903297766
Becker, M., Meyssignac, B., Letetrel, C., Llovel, W., Cazenave, A., and Delcroix, T. (2012). Sea Level Variations at Tropical Pacific Islands since 1950. Glob. Planet. Change 80-81, 85–98. doi:10.1016/j.gloplacha.2011.09.004
Bedford, R., and Bedford, C. (2010). “International Migration and Climate Change: a post-Copenhagen Perspective on Options for Kiribati and Tuvalu,” in Climate Change And Migration: South Pacific Perspectives. B. Burson (Wellington, New Zealand: Institute of Policy Studies,Victoria University of Wellington), 89–134. doi:10.13140/RG.2.1.2910.2166
Berchin, I. I., Valduga, I. B., Garcia, J., and de Andrade Guerra, J. B. S. O. (2017). Climate Change and Forced Migrations: An Effort towards Recognizing Climate Refugees. Geoforum 84, 147–150. doi:10.1016/j.geoforum.2017.06.022
Brown, O. (2008). “Migration and Climate Change,” in. IOM Migration Research Studies, Grand-Saconnex, Switzerland, International Organization for Migration, 16–20. doi:10.18356/26de4416-en
Burgess, S. M. (1987). The Climate and Weather of Western Kiribati. Report No. 188. Wellington, New Zealand, New Zealand Meteorological Service.
Cardona, O. D., van Aalst, M. K., Birkmann, J., Fordham, M., McGregor, G., Perez, R., et al. (2012). “Determinants of Risk: Exposure and Vulnerability,” in Managing The Risks Of Extreme Events And Disasters To Advance Climate Change Adaptation [Field. A Special Report of Working Groups I and II of the Intergovernmental Panel on Climate Change (IPCC). Editors C. B. Field, V. Barros, T. F. Stocker, D. Qin, D. J. Dokken, K. L. Ebiet al. (Cambridge, UK, and New York, NY, USA: Cambridge University Press), 65–108.
Cazenave, A., and Remy, F. (2011). Sea Level and Climate: Measurements and Causes of Changes. Wires Clim. Change 2 (5), 647–662. doi:10.1002/wcc.139
Center for International Earth Science Information Network (CIESIN) (2018). Documentation for the Gridded Population of the World, Version 4 (GPWv4), Revision 11 Data Sets. Palisades, NY: NASA Socioeconomic Data and Applications Center (SEDAC), Columbia University.
Cernea, M. M. (2005). ‘Restriction of Access’ Is Displacement: A Broader Concept and Policy. Forced Migr. Rev. 23 (1), 48–49.
Church, J. A, Clark, P. U, Cazenave, A., Gregory, J. M, Jevrejeva, S., Levermann, A., et al. (2013). “Sea Level Change,” in Climate Change 2013: The Physical Science Basis. Contribution of Working Group I to the Fifth Assessment Report of the Intergovernmental Panel on Climate Change. Editors T. F. Stocker, D. Qin, G. K. Plattner, M. Tignor, S. K. Allen, J. Boschunget al. (Cambridge, United Kingdom and New York, NY, USA: Cambridge University Press).
Curtain, R., and Dornan, M. (2019). A Pressure Release Valve? Migration and Climate Change in Kiribati, Nauru and Tuvalu. Development Policy Center, 34.
Donner, S. D., and Webber, S. (2014). Obstacles to Climate Change Adaptation Decisions: a Case Study of Sea-Level Rise and Coastal protection Measures in Kiribati. Sustain. Sci. 9, 331–345. doi:10.1007/s11625-014-0242-z
Donner, S. (2012). Sea Level Rise and the Ongoing Battle of Tarawa. Eos Trans. AGU 93 (17), 169–170. doi:10.1029/2012EO170001
Duvat, V. (2013). Coastal protection Structures in Tarawa Atoll, Republic of Kiribati. Sustain. Sci. 8, 363–379. doi:10.1007/s11625-013-0205-9
Ekardt, F., Wieding, J., and Zorn, A. (2018). Paris Agreement, Precautionary Principle and Human Rights: Zero Emissions in Two Decades? Sustainability 10, 2812. doi:10.3390/su10082812
Feagin, R. A., Mukherjee, N., Shanker, K., Baird, A. H., Cinner, J., Kerr, A. M., et al. (2010). Shelter from the Storm? Use and Misuse of Coastal Vegetation Bioshields for Managing Natural Disasters. Conserv. Lett. 3 (1), 1–11. doi:10.1111/j.1755-263X.2009.00087.x
Flather, R. A. (1984). A Numerical Model Investigation of the Storm Surge of 31 January and 1 February 1953 in the North Sea. Q.J R. Met. Soc. 110, 591–612. doi:10.1002/qj.49711046503
Frederikse, T., Landerer, F., Caron, L., Adhikari, S., Parkes, D., Humphrey, V. W., et al. (2020). The Causes of Sea-Level Rise since 1900. Nature 584, 393–397. doi:10.1038/s41586-020-2591-3
Fujita, M., Mizuta, R., Ishii, M., Endo, H., Sato, T., Okada, Y., et al. (2019). Precipitation Changes in a Climate with 2‐K Surface Warming from Large Ensemble Simulations Using 60‐km Global and 20‐km Regional Atmospheric Models. Geophys. Res. Lett. 46 (1), 435–442. doi:10.1029/2018GL079885
Hermann, E., and Kempf, W. (2017). Climate Change and the Imagining of Migration: Emerging Discourses on Kiribati's Land Purchase in Fiji. Contemp. Pac. 29, 231–263. doi:10.1353/CP.2017.0030
Hersbach, H., Bell, B., Berrisford, P., Biavati, G., Horányi, A., Muñoz Sabater, J., et al. (2019). ERA5 Monthly Averaged Data on Single Levels from 1979 to Present. Copernicus Clim. Change Serv. (C3s) Clim. Data Store (Cds). doi:10.24381/cds.f17050d7
IPCC (2014). Climate Change 2014: Synthesis Report. Contribution of Working Groups I, II and III to the Fifth Assessment Report of the Intergovernmental Panel on Climate Change. Editors Core Writing Team, R. K. Pachauri, and L. A. Meyer (Geneva, Switzerland: IPCC), 151.
IPCC (2021). Climate Change 2021: The Physical Science Basis. Contribution of Working Group I to the Sixth Assessment Report of the Intergovernmental Panel on Climate Change. Editors V. Masson-Delmotte, P. Zhai, A. Pirani, S. L. Connors, C. Péan, S. Bergeret al. (Cambridge: Cambridge University Press). In Press.
Jarvis, A., Reuter, H., Nelson, A., and Guevara, E. (2008). Hole-filled Seamless SRTM Data V4. International Centre for Tropical Agriculture (CIAT). Retrieved from http://srtm.csi.cgiar.org/ (Accessed October 31, 2021).
Kaiteie, T., and Hogan, C. (2008). Baseline Study Report 2008Survey of Public Awareness of and Attitudes towards Climate Change Issues and Challenges. Kiribati Adaptation Programme (KAP) Stage II. Kiribati, Tarawa, 67. Available at: http://climate.gov.ki/wp-content/uploads/2013/05/Survey-of-public-attitudes-to-climate-change-pilot-report.pdf (Accessed October 31, 2021).
Kuruppu, N., and Liverman, D. (2011). Mental Preparation for Climate Adaptation: the Role of Cognition and Culture in Enhancing Adaptive Capacity of Water Management in Kiribati. Glob. Environ. Change 21, 657–669. doi:10.1016/j.gloenvcha.2010.12.002
Lavell, A., Oppenheimer, M., Diop, C., Hess, J., Lempert, R., Li, J., et al. (2012). “Climate Change: New Dimensions in Disaster Risk, Exposure, Vulnerability, and Resilience,” in Managing the Risks of Extreme Events and Disasters to Advance Climate Change Adaptation. A Special Report of Working Groups I and II of the Intergovernmental Panel on Climate Change (IPCC). Editors C. B. Field, V. Barros, T. F. Stocker, D. Qin, D. J. Dokken, K. L. Ebiet al. (Cambridge, UK, and New York, NY, USA: Cambridge University Press), 25–64.
Malvem, J. (2011). Last Few Speakers of Indonesian Language Dusner Nearly Wiped Out by Flood, Volcano, the Australian. Available online at: https://www.theaustralian.com.au/news/health-science/last-few-speakers-of-indonesian-language-dusner-nearly-wiped-out-by-flood-volcano/news-story/3c5ed5f03a4e5bce0b2062393dca8d8f (Accessed October 10, 2021).
McGranahan, G., Balk, D., and Anderson, B. (2007). The Rising Tide: Assessing the Risks of Climate Change and Human Settlements in Low Elevation Coastal Zones. Environ. Urbanization 19 (1), 17–37. doi:10.1177/0956247807076960
McIver, L., Kim, R., Woodward, A., Hales, S., Spickett, J., Katscherian, D., et al. (2016). Health Impacts of Climate Change in Pacific Island Countries: A Regional Assessment of Vulnerabilities and Adaptation Priorities. Environ. Health Perspect. 124 (11), 1707–1714. doi:10.1289/ehp.1509756
Mizuta, R., Murata, A., Ishii, M., Shiogama, H., Hibino, K., Mori, N., et al. (2017). Over 5,000 Years of Ensemble Future Climate Simulations by 60-km Global and 20-km Regional Atmospheric Models. Am. Meteorol. Soc. 98, 1383–1398. doi:10.1175/BAMS-D-16-0099.1
Mori, N., Shimura, T., Yoshida, K., Mizuta, R., Okada, Y., Fujita, M., et al. (2019). Future Changes in Extreme Storm Surges Based on Mega-Ensemble Projection Using 60-km Resolution Atmospheric Global Circulation Model. Coastal Eng. J. 61, 295–307. doi:10.1080/21664250.2019.1586290
Mulhern, O. (2020). Sea Level Rise Projection Map – Kiribati. Earth.org. Available at: https://earth.org/data_visualization/sea-level-rise-by-2100-kiribati/ (Accessed October 10, 2021).
NASA’s Goddard Space Flight Center (2021). Satellite Sea Level Observations. Available online at: https://climate.nasa.gov/vital-signs/sea-level/ (Accessed October 10, 2021).
National Statistics Office of Kiribati (2016). 2015 Population and Housing Census. in Management Report and Basic Tables, Bairiki, Tarawa: Ministry of Finance, Vol. 1, 196.
Nunn, P. D., Aalbersberg, W., Lata, S., and Gwilliam, M. (2014). Beyond the Core: Community Governance for Climate-Change Adaptation in Peripheral Parts of Pacific Island Countries. Reg. Environ. Change 14, 221–235. doi:10.1007/s10113-013-0486-7
Nurse, L. A., McLean, R. F., Agard, J. P., Duvat-Magnan, V., Pelesikoti, N., Tompkins, E., et al. (2014). “Small Islands,” in Climate Change 2014: Impacts, Adaptation, and Vulnerability. Part B: Regional Aspects. Contribution Of Working Group II to the Fifth Assessment Report Of the Intergovernmental Panel On Climate Change. Editors V. R. Barros, C. B. Field, D. J. Dokken, M. D. Mastrandrea, K.J. Mach, T. E. Biliret al. (Cambridge, United Kingdom and New York, NY, USA: Cambridge University Press), 1613–1654.
Oakes, R., Milan, A., and Campbell, J. (2016). Kiribati: Climate Change and Migration – Relationships between Household Vulnerability, Human Mobility and Climate change. Report No. 20. Bonn: United Nations University Institute for Environment and Human Security UNU-EHS.
Oppenheimer, M., Glavovic, B. C., Hinkel, J., van de Wal, R., Magnan, A. K., Abd-Elgawad, A., et al. (2019). “Sea Level Rise and Implications for Low-Lying Islands, Coastal Areas, and Communities,”in IPCC Special Report on the Ocean and Cryosphere in a Changing Climate. Geneva, Switzerland: IPCC.
Sabūnas, A., Mori, N., Fukui, N., Miyashita, T., and Shimura, T. (2020). Impact Assessment of Climate Change on Storm Surge and Sea Level Rise Around Viti Levu, Fiji. Front. Clim. 2, 579715. doi:10.3389/fclim.2020.579715
Silvester, R. (1971). “Computation of Storm Surge,” in Proceedings of the 12th Conference On Coastal Engineering (New York: ASCE). Washington, United States. 13–18 September 1970. doi:10.9753/icce.v12.121
Spalding, M., Kainuma, M., and Collins, L. (2010). World Mangrove Atlas. second ed. London: Routledge, 336.
The Japan Times (2018). Dialects at Risk of Extinction in Tohoku’s Disaster Zones. Available online at: https://www.japantimes.co.jp/news/2018/03/18/national/dialects-risk-extinction-tohokus-disaster-zones (Accessed October 10, 2021).
Republic of Kiribati (2015). Intended Nationally Determined Contribution (INDC), 27, 2015. Available at: https://policy.asiapacificenergy.org/sites/default/files/INDC_KIRIBATI.pdf (Accessed October 31, 2021).
The World Bank (2020). Reducing the Risk of Disasters and Climate Variability in the Pacific Islands: Republic of Kiribati Country Assessment World Bank Washington, DC. Available online at: https://documents1.worldbank.org/curated/en/640141468292212101/pdf/532040WP0P112010KIRIBATI1ASSESSMENT.pdf (Accessed October 10, 2021).
United Nations (2013). Overview of National Experiences for Population and Housing Censuses of the 2010 Round. New York, NY: United Nations, Statistics Division.
van der Werf, G. R., Morton, D. C., DeFries, R. S., Olivier, J. G. J., Kasibhatla, P. S., Jackson, R. B., et al. (2009). CO2 Emissions from forest Loss. Nat. Geosci. 2, 737–738. doi:10.1038/ngeo671
Wandres, M., Aucan, J., Espejo, A., Jackson, N., De Ramon N’Yeurt, A., and Damlamian, H. (2020). Distant-Source Swells Cause Coastal Inundation on Fiji's Coral Coast. Front. Mar. Sci. 7, 546. doi:10.3389/fmars.2020.00546
Keywords: Kiribati, sea level rise, population displacement, social impact of climate change, inundation, exposed population, SIDS
Citation: Sabūnas A, Miyashita T, Fukui N, Shimura T and Mori N (2021) Impact Assessment of Storm Surge and Climate Change-Enhanced Sea Level Rise on Atoll Nations: A Case Study of the Tarawa Atoll, Kiribati. Front. Built Environ. 7:752599. doi: 10.3389/fbuil.2021.752599
Received: 03 August 2021; Accepted: 25 October 2021;
Published: 10 November 2021.
Edited by:
Pedro Lomonaco, Oregon State University, United StatesReviewed by:
Alec Torres-Freyermuth, Universidad Nacional Autónoma de México, MexicoMireille Escudero, National Autonomous University of Mexico, Mexico
Copyright © 2021 Sabūnas, Miyashita, Fukui, Shimura and Mori. This is an open-access article distributed under the terms of the Creative Commons Attribution License (CC BY). The use, distribution or reproduction in other forums is permitted, provided the original author(s) and the copyright owner(s) are credited and that the original publication in this journal is cited, in accordance with accepted academic practice. No use, distribution or reproduction is permitted which does not comply with these terms.
*Correspondence: Audrius Sabūnas, audrius.sabunas@gmail.com