Reliability of Wavelet Analysis of Mode Shapes for the Early Detection of Damage in Beams
 Luc Chouinard
 Vahid Shahsavari
 Josée Bastien
- 1Department of Civil Engineering and Applied Mechanics, McGill University, Montreal, QC, Canada
- 2Department of Civil and Environmental Engineering, University of New Hampshire, Durham, NC, United States
- 3Department of Civil Engineering and Water Engineering, Université Laval, Quebec City, QC, Canada
Numerous procedures have been developed for the detection and the localization of damage in structures based on changes in the dynamic or static response of structures. Among these, procedures based on wavelet analysis of mode shapes appear to offer a superior performance especially for low levels of damage. In order to evaluate the relative merit of these approaches, criteria based on statistical and probabilistic performance are evaluated as a function of damage level for an experimental beam. These measures include the probability of detection, the probability of false alarms, and the safety index. The safety index used in this application is for the beam under pure bending, which provides a uniform criteria for damage at any location along the beam. The experimental data is obtained on a steel beam where the level of damage is controlled at two locations along its length. A total of 16 equally spaced accelerometers are deployed along the length of the beam. The dynamic properties used to illustrate the proposed procedure are changes in the frequency of the first mode of vibration of the beam and changes in the wavelet coefficients for the first mode of vibration. The data obtained for 5 increasing level of damage at two locations is used to derive prediction equations for the dynamic properties and to estimate the probability of detection and of false alarms as a function of damage level. The results indicate that the procedure based on wavelets is more efficient than the one based on natural frequencies in detecting and localizing low levels of damage. The results also indicate that a monitoring strategy based on wavelets can detect damage before structural safety is significantly compromised while maintaining low probabilities of false alarms.
Introduction
Structural health monitoring is used to evaluate the state and rate of deterioration of existing structures as well as the state of structures that have been exposed to extreme loads (e.g., following exposure to earthquakes, hurricanes, tornadoes, etc.). Damage in structures can be caused by changes in material properties, geometric properties and/or support conditions that result in a reduction of structural performance (Worden et al., 2007). Measurements to estimate these properties can be obtained either through static or dynamic tests. The objectives of structural health monitoring are to: (i) identify the presence of damage, (ii) determine the damage location, (iii) estimate the extent and type of damage, and (iv) assess its significance for structural performance and safety. Methods using wavelet analysis on mode shapes have shown promising results for the detection of damage and localization of damage in beams at multiple locations. A statistical procedure is proposed for the analysis of data on an experimental beam that is efficient in filtering noise and in extending detection to lower levels of damage. Data compiled for different levels of damage is combined to derive predictions equations for dynamic properties as a function of damage level. The same model is also used to determine the relation between the probability of damage detection and the probability of false alarms as a function of damage level. Finally, the safety index of the beam as a function of damage level is used to identify optimal detection protocols that minimize negative impacts on structural safety and number of unnecessary interventions due to false alarms.
Overview of SHM for Civil Structures
Vibration measurements provide useful information on the dynamic parameters of structures and their relation to the presence of damage. Starting in the early 1980's, various techniques have been developed to monitor bridges based on changes in the modal frequencies and modal shapes due to changes in the geometry, mass or stiffness of the structure (Sun and Chang, 2004; Alvandi and Cremona, 2006). However, the stand-alone performance of these techniques is not adequate when damage levels are low (Taha et al., 2006; Alvandi et al., 2009). Farrar et al. (1994) failed to detect changes in frequencies and mode shapes on surveys of 40 highway bridges unless the damage level was significantly large, in this instance, a cut through the mid-height of the web and the entire flange at mid-span of the main girder of the bridge. Moreover, changes in natural frequencies provide no information on the location of damage (Doebling et al., 1998). In the analysis of vibration data, the uncertainties associated with modeling, measurements, and environmental conditions must be properly accounted for (Kim and Stubbs, 2002, 2003). Also, depending on the location of damage, several modes of vibration can be considered simultaneously since the effect of damage on modes can vary greatly as a function of location of damage. A greater change in frequency is detected when the damage is at the location of highest curvature for a given mode of vibration. Other measures derived from modal properties have been used for damage detection; for example, the Modal Assurance Criterion (MAC) and Coordinate Modal Assurance Criterion (COMAC) factors are used to compare modal shapes between undamaged and damaged states (Ndambi et al., 2002).
Various methods have been investigated to localize damage using changes in modes shapes; however, these methods are not very effective to detect low levels of damage (Kim et al., 2003). Neural network have been used to improve detection using training samples of modal shapes for intact and damaged structures. These techniques have been applied to numerical models of beams and multidirder bridges (Lee et al., 2005). An impediment to the applciation of these techniques to actual structures is the requirement for large structure-specific training samples from both the undamaged and damaged states, which are rarely available in practice (Sohn et al., 2004). Mode Shape Curvature (MSC) methods have also been suggested to improve damage detection and localization and demonstrated on numerical models for cantilever and simply supported beams (Pandey et al., 1991). Using similar concepts, Catbas et al. (2007) use changes in the flexibility matrix and its derivatives for beam-like structures. However, curvature methods tend to amplify noise in field application, which can mask low levels of damage (Chance et al., 1994; Maeck et al., 2000; Cao and Qiao, 2008; Perera and Huerta, 2008).
Detection of changes in modal parameters due to low levels of damage can be improved with post-processing of vibration data (Chen et al., 1995). In particular, the Wavelet Transform (WT) has been used to extract more detailed information from modal shapes (Gentile and Messina, 2003; Rucka and Wilde, 2006; Solís et al., 2013). The WT provides a means to characterize local features in signals at different scales of time and space (Wang and Deng, 1999). The wavelet analysis can be performed as the Discrete Wavelet Transform (DWT) or the Continuous Wavelet Transform (CWT). The DWT is most suitable for decomposition, compression, and feature extraction of signals, while the CWT is adapted for the continuous monitoring of signals over the entire record. The WT provides a “wavelet coefficient” which is a measure of the extent of agreement between the wavelet and the signal; hence, sharp transitions in the signal will result in wavelet coefficients with large magnitudes and this is precisely the principal basis for damage identification using the wavelet theory (Liew and Wang, 1998). The wavelet analysis has been applied to a variety of vibration-based damage identification problems. For example, Jaiswal and Pande (2015) use the DWT on mode shapes from a numerical model of a beam to demonstrate the detection of damage location. DWT has also been used on mode shapes in combination with neural networks for detecting and quantifying damage in a cantilever beam (Vafaei et al., 2015) and in a simply supported beam using both a finite element model and experimental data (Zhong and Oyadiji, 2007, 2011). Bakry et al. (2018) conduct a detailed parametric study to show the applicability of the discrete wavelet analysis for damage detection on the first mode shape of a numerically simulated beam. He et al. (2019) apply the DWT to decompose the displacement response change on an experimental beam subjected to different moving-load velocities and demonstrate that damage localization can be compromised due to a high moving vehicle velocity.
Besides the DWT, the continuous wavelet transform (CWT) has also been the subject of numerous investigations over the last two decades. Most recently, Zhu et al. (2019) apply the CWT to the mode shapes of numerically simulated cracked beams and propose an intensity factor to estimate the crack depth. Ramesh and Rao (2018) conduct an experimental modal analysis on a cantilever beam subjected to a dynamic pulse load and used spatial CWT to locate small perturbations in mode shapes due to damage. Fan and Qiao (2009) demonstrate the application of a CWT-based damage detection algorithm on mode shapes for plate-type structures. Patel et al. (2016) demonstrate the feasibility of using CWT for damage identification for a 6-story scaled reinforced concrete building using wireless accelerometers. Janeliukstis et al. (2017a,b) discuss the efficiency of the continuous wavelet method for the identification of multiple damage zones on a numerically simulated aluminum beam. Mardasi et al. (2018) study the sensitivity of the wavelet analysis for crack detection by applying the CWT to the deflection of an experimental beam subjected to displacements. Janeliukstis et al. (2017a,b) use a non-contact laser scanning vibrometer to extract the deflected shapes of aluminum and composite beams with varying levels of damage and successfully use the spatial wavelet transform for damage localization. Both DWT and CWT have also been used to detect damage from static deflected shapes using numerical models of a beam and a simple frame (Ovanesova and Suarez, 2004).
In general, the DWT is more practical for data compression and signal reconstruction as it uses a fast algorithm of evaluating wavelet coefficients in discrete resolutions; whereas the CWT is computationally more demanding but provides better spatial resolution of wavelet coefficients and is hence more suitable for damage detection problems (Antoine et al., 2008). The focus of this study is also on damage-sensitive features derived from performing the CWT. However, in the context of civil structural health monitoring, the apparent limitation of the wavelet transform is that the rational evaluation of the wavelet coefficient from structural vibration modes requires the mode shape measurement with a relatively high spatial resolution and reasonable accuracy. The mode shape spatial resolution can be further enhanced by performing a large number of modal tests, utilizing advanced vibration instrument such as non-contact scanning laser Doppler vibrometer (Janeliukstis et al., 2017a,b; Reu et al., 2017), and applying interpolation techniques to smooth the sampling interval from one instrument to the other (Rucka and Wilde, 2006; Shahsavari et al., 2017). In this paper, the mode shapes are interpolated using a spline function with 20 interpolation nodes between each measuring point, resulting in a total number of 316 sampling nodes (or pseudo sensors).
The main advantage gained by using wavelets is their multi-resolution characteristics allowing to zoom-in on any interval of time and space and the ability to perform a local analysis of a signal. The objective of this paper is to show that the procedures based on wavelet analysis of mode shapes offer a superior performance over traditional vibration-based damage assessment methods, especially for low levels of damage. Different criteria based on statistical and probabilistic performance, namely the probability of detection, probability of false alarms and safety index, are evaluated as a function of damage level for an experimental beam and discussed in detail in the following sections. The damage detection criterion in this paper is formulated in the form of statistical test of hypothesis and based on comparing dynamic properties of a beam for increasing levels of damage.
Continuous Wavelet Method
The Continuous Wavelet Method is used to detect damage through the characterization of anomalies in the vibration modes of a structure or more specifically in this application, for a beam. The dynamic response of the beam is analyzed by comparing with a wavelet that is scaled and shifted along the length of the beam. The CWT of a one-dimensional function f (x) (mode shape in this application) is defined as (Shahsavari et al., 2017):
where Ψ*(x) represents the complex conjugate of the wavelet mother function Ψ(x), s and u denote the scale and the position parameters of the mother wavelet, and CWT(x) is defined as the wavelet coefficient in the vicinity of x.
Wavelets with higher coefficients indicate a high correlation between the signal and the wavelet function. If a significant change is detected in wavelet coefficients, it may be indicative of damage (Cao and Qiao, 2008). However, CWT fails to clearly detect and locate damage in noisy conditions and for low levels of damage at multiple locations. In order to overcome these limitations, Shahsavari et al. (2015, 2017) propose a novel wavelet-based approach for filtering out noise present in wavelet coefficients and localizing small increments of damage at different locations along the length of an experimental beam. The authors' main contributions for noise removal from experimental data set and damage localization are summarized as follows: (a) Statistical pattern recognition techniques are first used to improve the efficiency of CWT for data with low signal to noise ratios, (b) Principal Component Analysis (PCA) is then applied to wavelet coefficients obtained at a set of locations along the beam for two successive sets of measurements. This technique improves the identification of patterns of variation that are most correlated with damage and filters out noise present in measurements. The scores associated with the dominant components of the PCA are found to be highly correlated with incremental damage; whereas the scores associated with higher components are assumed to be correlated with existing noise in wavelet coefficients and, hence, are discarded from further investigations, (c) statistical tests of hypothesis are used on the selected PCA scores to detect statistically significant changes in the distribution of scores to conclude to damage detection. Tests are performed on location parameters of the PCA scores derived from wavelet coefficients with the t-test for the equality of score means values and the Mann-Whitney U-test for the equality of medians scores, (d) when a statistically significant incremental damage is detected, a Likelihood Ratio (LR) test is then performed to determine the most likely location of damage. The wavelet coefficients and PCA scores used for performing the reliability study of this paper are based on the above-mentioned procedure formulated in detail by Shahsavari et al. (2017).
Experimental Setup
The tests are conducted under controlled conditions with a steel beam where boundary conditions and damage levels at two locations can be varied (Shahsavari, 2017). The test specimen is an I-beam (W150x37) with three sections connected by bolts and plates. Figure 1 shows the setup in the initial assembled state. The beam in this initial state has a 12% reduction in stiffness at the two damage locations compared to an intact I beam. The full-damage state consists of a 0.002 m notch across half of the depth (top half portion) of the beam. Levels of damage are simulated by adding or removing sets of bolted connections at the two locations which are at 0.5 m (0.17L) and 1.95 m (0.67L) from the left end of the beam (Figure 2).
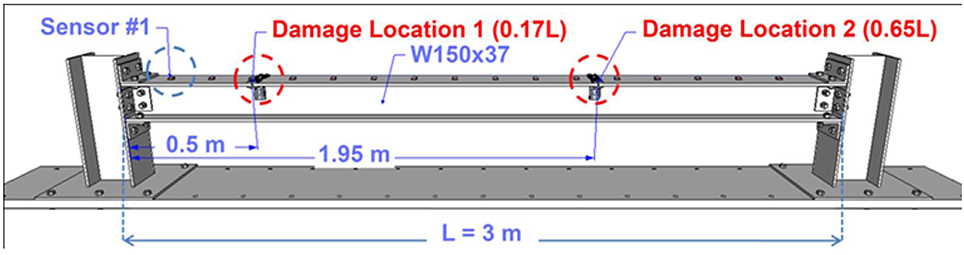
Figure 1. Test beam configuration (Shahsavari et al., 2017).
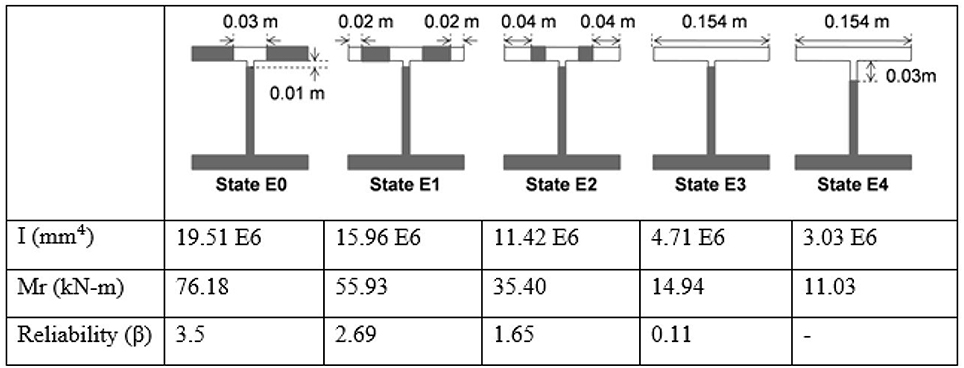
Figure 2. Incremental damage levels and sectional properties of the beam (Fy = 345 MPa) (Shahsavari, 2017).
Sixteen equally spaced accelerometers installed on the top flange of the beam are used for measurements. The accelerometers (Kistler model 8305B2SP4M and 8310A25A1M1SP15M) have similar specifications. Random impulses are applied with a hammer with a mass sufficiently large to engage the first few modes of vibration. Series of measurements are recorded for each damage state to account for the variability of the mode shapes due to experimental errors and noise. The test setups used in this experiment consists of introducing incremental damage at only one of the two locations at a time. The locations at 0.17L and 0.65L are used to compare the effect of damage location on the detectability of damage. In all cases, the beam is considered to be in an initially damaged state (E0) at the locations of the connections but with only one location where damage is increased incrementally. The moment of inertia of the beam and the elastic (nominal) bending moment capacity (Fy = 345 MPa) are computed and used to characterize each damage level. For our purposes, the damage level (dl) is defined as the percentage change in the moment of inertia (I–I0) relative to the moment of inertia in the initial state (I0).
The experimental program consists of dynamic measurements performed at five levels of incremental damage (E0, E1, E2, E3, and E4) at two locations along a beam. The change in dynamic properties is used to derive predictive equations for the dynamic properties as a function of damage level. The prediction equations are used to derive the probability of detection and the probability of false alarms as a function of the damage level.
Probability of Detection, Probability of False Alarms and Safety Index
Alvandi and Cremona (2006) compare four vibration-based damage identification techniques to detect damage on a simply supported beam. The probability of detection and of false alarm are analyzed for different levels of damage and noise and with different detection threshold levels. The authors showed that a high threshold produces fewer false alarms but has a low probability of detection, while a low threshold not only increases the probability of detection but also the number of false alarms. In addition, by considering data from elements adjacent to the damage location, the probability of detection is increased while reducing the probability of false alarms. In conclusion, a higher damage level has a higher probability of detection since the corresponding damage index is higher and more likely above the threshold levels.
The damage detection criterion investigated in this paper is derived by comparing the dynamic parameters of a system for increasing levels of damage. Since there is uncertainty and variability associated with measurements of dynamic parameters, the criterion is formulated in the form of a statistical test of hypothesis. Tests can be performed to compare the full distributions of the dynamic parameters or some specific statistics such as the median or mean value. The null hypothesis in this application is that there is no incremental damage and the mean values for the dynamic properties are equal when comparing data from two sets of measurements (Δ0 = 0 in Equation 2). Note that the same principle could be applied to the full distribution or other statistics. The alternative hypothesis is that the average values are not equal in a scenario of incremental damage since all other conditions (notably environmental conditions) were kept constant in the laboratory. In this application, the t-test for the comparison of means is used (the assumption of samples from normal distributions is verified).
The significance level (α) of the test corresponds to the probability of the type I error, which is to reject the null hypothesis (no change in the mean value or no incremental damage (μ1-μ2 = Δ0 = 0) when it is true, and corresponds to the probability of false detection of incremental damage. For given samples from two populations, the p-value is the lowest level of significance that would provide the rejection limit of the null hypothesis. The null hypothesis is rejected when the p-value is smaller than the significance level of the test. In practice, a significance level of 5% is often selected in statistics; however, in the context of SHM, it results in a large number of false alarms and thus lower significance levels of 1% or even 0.1% may be more appropriate. The power of the statistical test is defined as the probability of rejecting the null hypothesis (i.e., no incremental damage) given that the null hypothesis is in fact false or (1-β), where β is the probability of a type II error for a given significance level α (Montgomery and Runger, 2014). The test used in this application is for the equality of means for two random populations that follow the normal distribution when the variance is unknown but equal. All these assumptions are validated for the data set used in this application. Given that variance is unknown but equal, a pooled estimate of the common variance is obtained as,
where S1 and S2 are the sample standard deviations from data from the two populations and n1 and n2 are the corresponding sample sizes. The test statistic T0 has a t-distribution with (n1 + n2 – 2) degrees of freedom,
The rejection criterion is specified as t0 > tα,n1+n2−2 where is the sample mean in the initial state while is the sample mean for the following inspection (Δ0 = 0). The probability of detection is defined as the power of the test (1–β) when the null hypothesis is not true for incremental damage associated with a change in the dynamic properties (Figure 3). By definition, the power (of probability of detection) increases monotonically to 1.0 as a function of |Δ1| or with an increase in damage. Using the con-central t-distribution, β solves the following equation,
For a given significance level (α) and sample size, as the value of Δ1 (the difference between the mean values under the alternative H1) increases, β decreases, which results in an increase in the power of the test (i.e., the probability of detection).
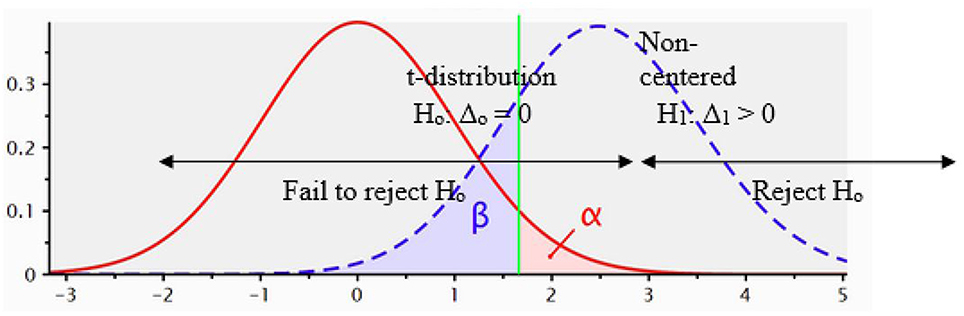
Figure 3. t-distribution and definition of significance level (α) and power (1–β) for the test of Hypothesis (H0 : μ1 − μ2 = Δ0, H1 : μ1 − μ2 = Δ1 > Δ0).
For our purposes, the safety index of the beam is defined for (positive) pure bending as a function of the level of damage, and provides a homogenous criteria for defects located anywhere along the length of the beam. For the purposes of the reliability analysis, the elastic moment capacity (MR) of the beam is used to characterize its resistance. It is assumed that the safety index is equal to 3.5 in pure bending in the initial state E0, which corresponds to the recommended target reliability level for ductile failures mode for regular structures (CSA/ACNOR S408-11, 2011).
The mean value of the moment capacity is obtained by assuming a bias factor of 1.05 on the yield strength of steel. The coefficients of variation of the moment capacity and of the moment demand (MD) are assumed to be 0.1 and 0.2, respectively. The average of the moment demand is specified to match the target safety index of 3.5 in the initial state and is kept constant for all damage levels (Tables 1, 2).
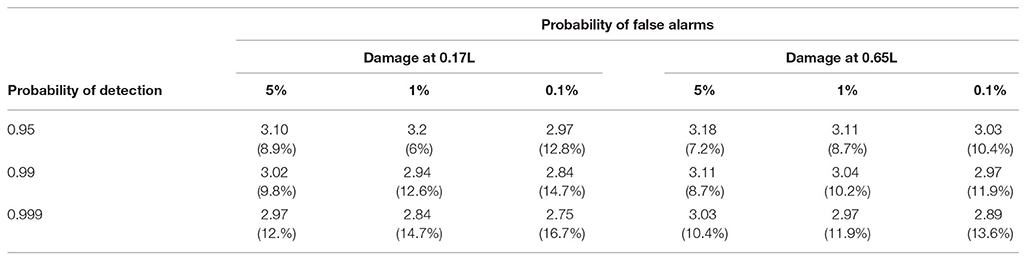
Table 1. Safety Index (and percentage of damage) as a function of the probability of detection and the probability of false alarms—fundamental frequency.
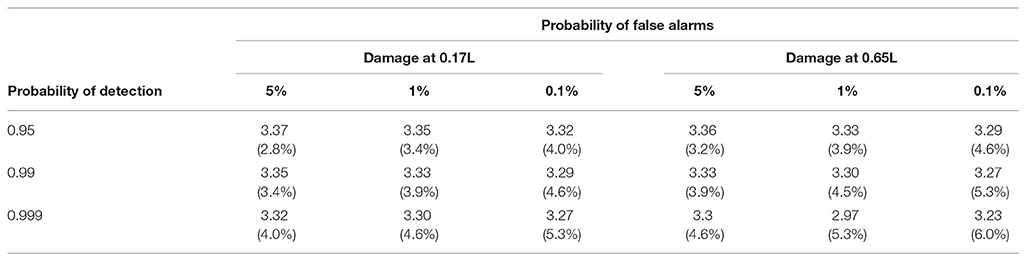
Table 2. Safety Index (and percentage of damage) as a function of the probability of detection and the probability of false alarms—wavelets.
Analysis and Discussion of Results
Damage Detection With the Natural Frequency
The measurement of the natural frequency of a beam is a simple and widely used method for damage detection that requires a minimal amount of equipment. The change in frequency depends on the location of damage and its severity (e.g., crack depth). Various combinations of depth and location of cracks can provide similar results and the analysis of different modes of vibration can be used to provide a pattern that converges to the likely location of damage.
The experimental protocol consists in taking several measurements at each damage level to account for the variability in the measurement of dynamic properties. Extreme outliers are identified by using box-and-whisker plots prior to the statistical analysis (Figures 4A, 5A). The measured frequencies are assumed to follow a normal distribution with a decreasing mean as a function of the level of damage. The results also indicate a greater reduction in frequencies for damage located at 0.65L compared to 0.17L due to higher stresses for the first mode of vibration at that location. The change in frequency at low levels of incremental damage is not as pronounced as for higher levels and hints at potential ambiguities in detecting low levels of incremental damage. The damage level is quantified in this case as the percentage change in the moment of inertia of the beam compared to the initial condition (state E0). The frequencies as a function of damage for the first three levels (E0, E1, and E2) show a linear trend with constant variance when damage is located at 0.17L data (Figure 4A). The trend is non-linear for damage located at 0.65L with a larger variance for higher damage levels (Figure 5A). The frequency as a function of the change in the moment of inertia is almost linear for low damage levels and increases rapidly for higher damage levels. The trend is more pronounced for the 0.65L data and highlights that damage located in a region of high curvature produces a larger reduction in frequency as mentioned by other authors (Salawu, 1997).
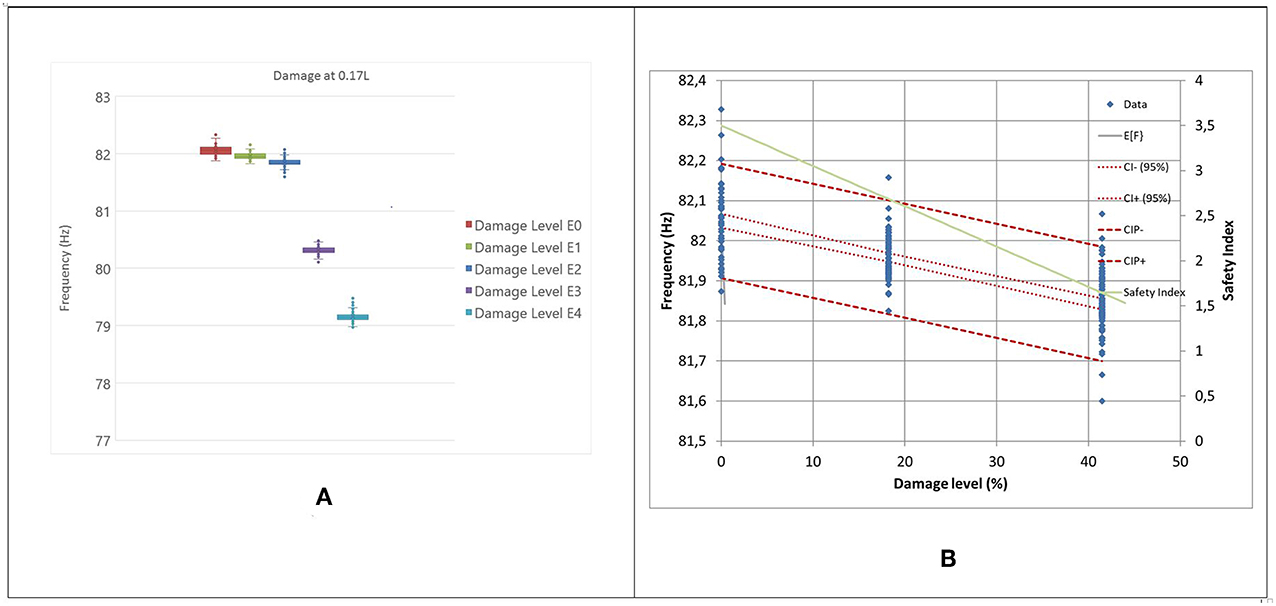
Figure 4. Damage located at 0.17L. (A) Whisker plot of the frequency of the first mode of vibration at 5 damage levels, (B) Linear regression of frequency as a function of damage level (Damage levels E0, E1, and E2).
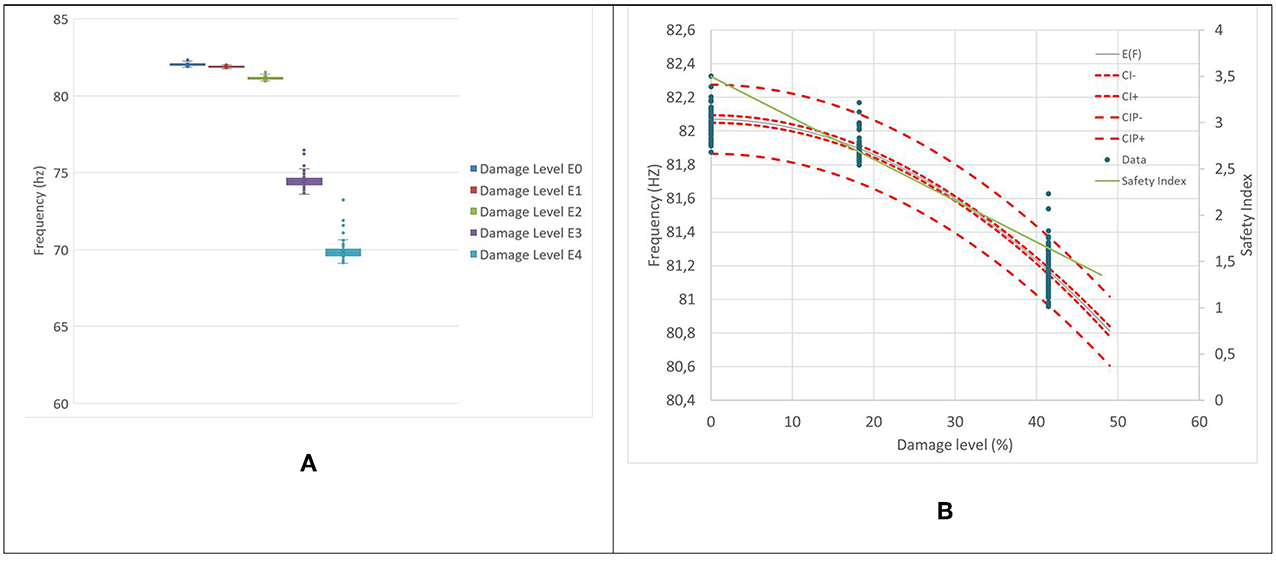
Figure 5. Damage located at 0.65L. (A) Whisker plot of the frequency of the first mode of vibration at 5 damage levels, (B) Linear regression of frequency as a function of damage level (Damage levels E0, E1, and E2).
Since the main objective of SHM is the early detection of damage, a predictive model in the form of a linear regression is derived for the fundamental frequency as a function of the damage level using the data for states E0, E1, and E2 for damage at 0.17 and 0.65L. The regression models provide estimates of the fundamental frequency as a function of damage level for intermediate levels of damage between state E0 and E1 (Figures 4B, 5B). Also shown are 95% confidence intervals on the regression line and for a new prediction. The difference between the two confidence intervals is indicative of the uncertainty associated with experimental measurements of fundamental frequency using impacts and the need for several repeated measurements for each damage level. Also shown is the safety index as a function of damage level. The initial safety level was selected as 3.5 in state E0 and is reduced to 1.65 in state E2. The two regressions indicate that the damage location has an effect on the fundamental frequency of the damaged beam with a larger decrease for damage located closer to the midspan of the beam.
The performance of changes in the fundamental frequency for detecting early stages of damage is evaluated by performing tests of hypothesis on the mean value of the fundamental frequency between the initial state and increasing states of damage. The distribution of natural frequencies as a function of damage level is found to satisfy the assumption of a normal distribution. The mean and standard deviation in the initial state are obtained experimentally while the mean and standard deviation for intermediate levels of damage are obtained from the regression model. The uncertainty on the mean in the damaged state is computed for a set of 25 repeat impact measurements to reproduce the experimental protocol. The t-test is performed with the pooled estimate of the variance since the variance of observations can be assumed constant at low levels of damage. The latter is evaluated for a given intermediate damage state (dl) by using the distribution for a prediction and averaging for a given number of repeat measurements (e.g., n = 25). The probability of detection is evaluated as a function of damage level (dl) and significance level (α or the probability of false alarm),
where is the average of the dynamic properties in the initial state (E0), is the pooled variance for a set of 25 observations in each state (X1 and X2 = [X | dl]), is the average of the damage levels used to estimate the regression parameters, is the standard deviation of the residuals, and
The probability of detection, of false alarms and the safety index as a function of the level of damage are jointly shown in Figure 6 for damage located at 0.17 and 0.65L, respectively. The three levels for false detection (5, 1, and 0.1%) are selected to illustrate the effect of reducing the significance level of the test on the probability of detection. In many applications, the standard significance level is set at 5%, but in the context of SHM, this has the potential for a large number of false alarms that are costly since each alarm may trigger an inspection and also can undermine the confidence in the monitoring system. Reducing the level of false alarms to 1% and 0.1% is desirable but also decreases the probability of detection of low levels of damage. The safety can be used as a structural performance measure to define the most appropriate detection protocol but also to compare the relative performance of competing SHM procedures. For example, SHM procedures can be evaluated on the basis of level of damage that can be detected with a high degree of certainty. Tables 1, 2 indicates the level of damage and safety index corresponding to given probabilities of detection and false alarms. The results indicate that damage can be more easily detected for damage located at 0.65L in comparison to 0.17L since in the latter case damage is located closer to one of the supports. In this case, the maximum probability of detection and minimal probability of false alarms can be achieved for incremental damage of approximately 10% corresponding to a safety index of 3.0 (Figure 6).
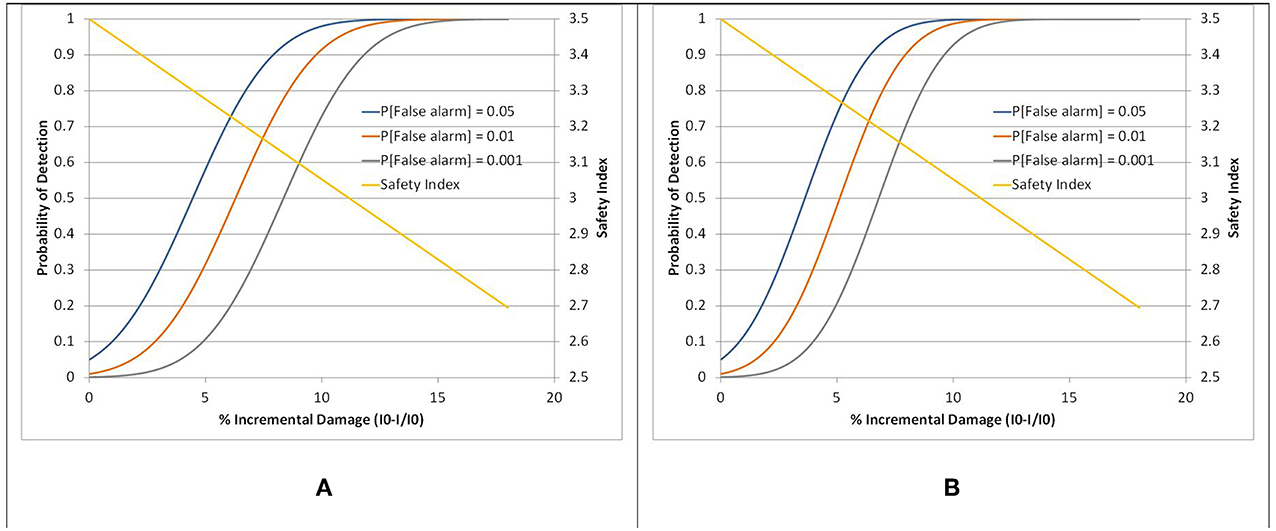
Figure 6. Probability of detection and safety index as a function of damage level and probability of false alarms for damage located at (A) 0.17L and (B) 0.65L (using frequency).
Damage Detection With the CWT
The procedure of Shahsavari et al. (2015, 2017) is used to obtain wavelet coefficients along the length of the beam. Figure 7 illustrates the wavelet coefficients along the beam (nodes 1 through 316) for increasing levels of damage at locations 0.17L and 0.65L and clearly indicates the location of damage for high levels of damage (E3 and E4). The wavelet coefficients at lower levels of incremental damage (E0, E1, and E2) are not as pronounced and detection criteria based on a threshold produces a large number of false detections along the beam. Shahsavari et al. (2017) use PCA on wavelets coefficients to filter noise and decrease the noise to signal ratio (Figure 8). The first component is found to be well-correlated to incremental damage through the associated scores, which are also used to locate damage along the length of the beam.
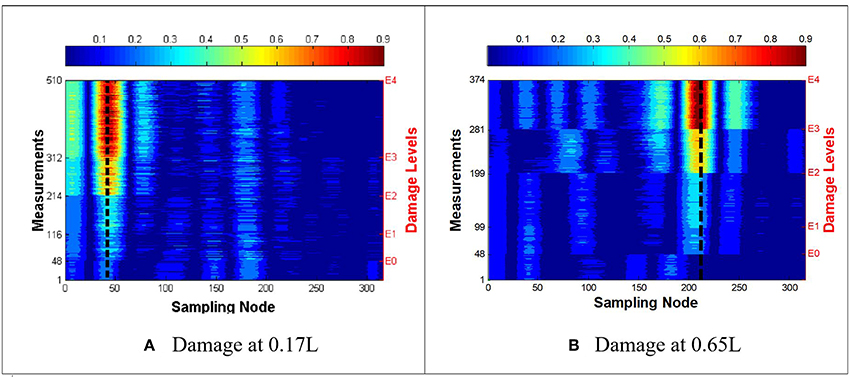
Figure 7. Wavelet coefficients as a function of damage levels E0 through E4 for damage at (A) 0.17L and (B) 0.65L (Shahsavari, 2017).
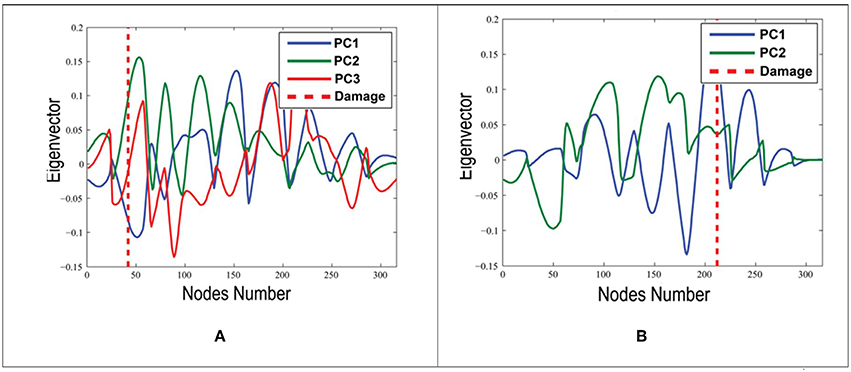
Figure 8. First Components from PCA for incremental damage at (A) 0.17L and (B) 0.65L (Shahsavari et al., 2017).
The whisker-and-box plot shows significant differences between the distribution of scores as a function of damage level with a linear trend for scores as a function of damage levels for the lower levels (Figures 9A, 10A). Figures 9B, 10B show the linear regressions for the scores of wavelet coefficients as a function of damage level between the three lower states (E0 to E2). The regressions are used to develop the relation between the probability of detection and of false alarms as a function of damage level (Figure 11). The results for the two damage locations are very similar and indicate that wavelet scores can detect reliably damage at much lower levels that changes in the natural frequency. In this case, the maximum probability of detection and minimal probability of false alarms can be achieved for incremental damage of approximately 4% corresponding to a safety index of 3.3.
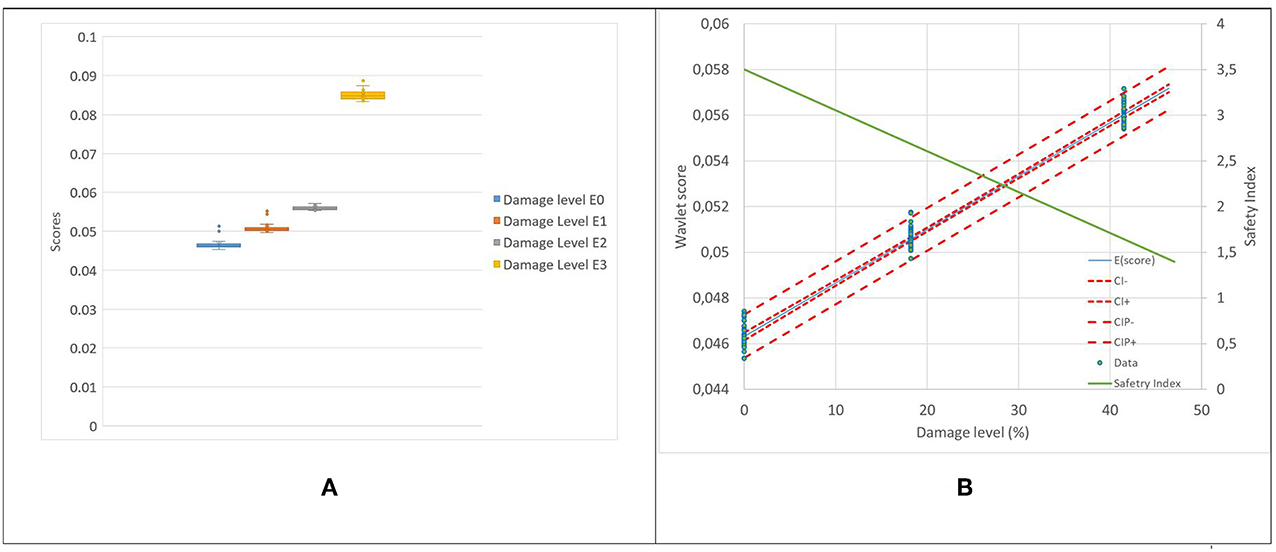
Figure 9. Damage located at 0.17L. (A) Whisker plot of the scores of first component of wavelet coefficients at 4 damage levels, (B) Linear regression of scores as a function of damage level (Damage levels E0, E1, and E2).
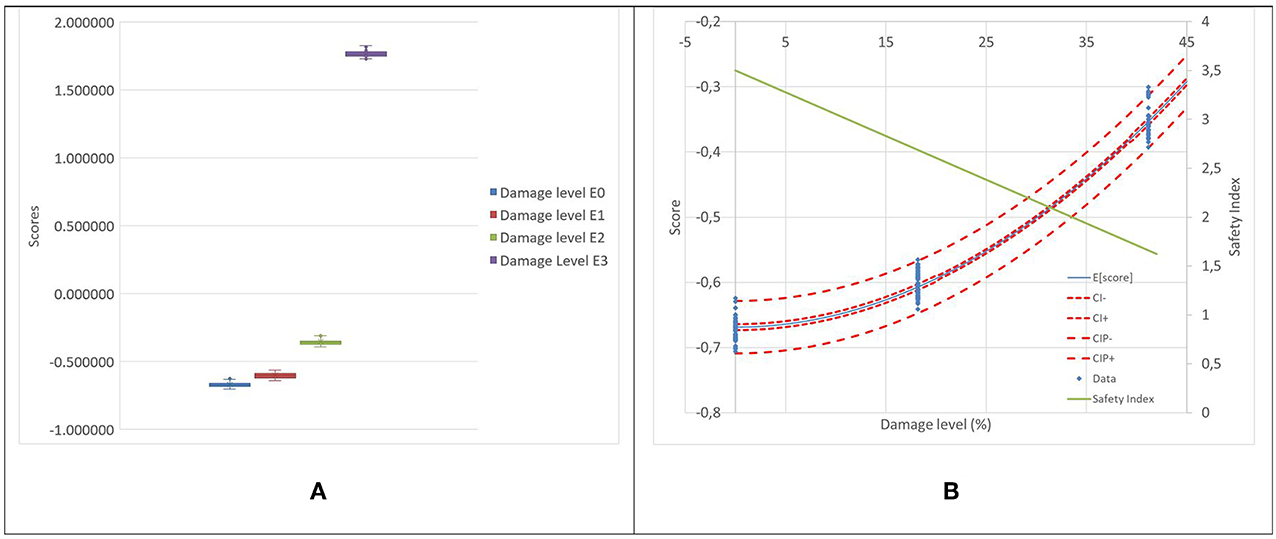
Figure 10. Damage located at 0.65L (A) Whisker plot of the scores of first component of wavelet coefficients at 4 damage levels, (B) Linear regression of scores as a function of damage level (Damage levels E0, E1, and E2).
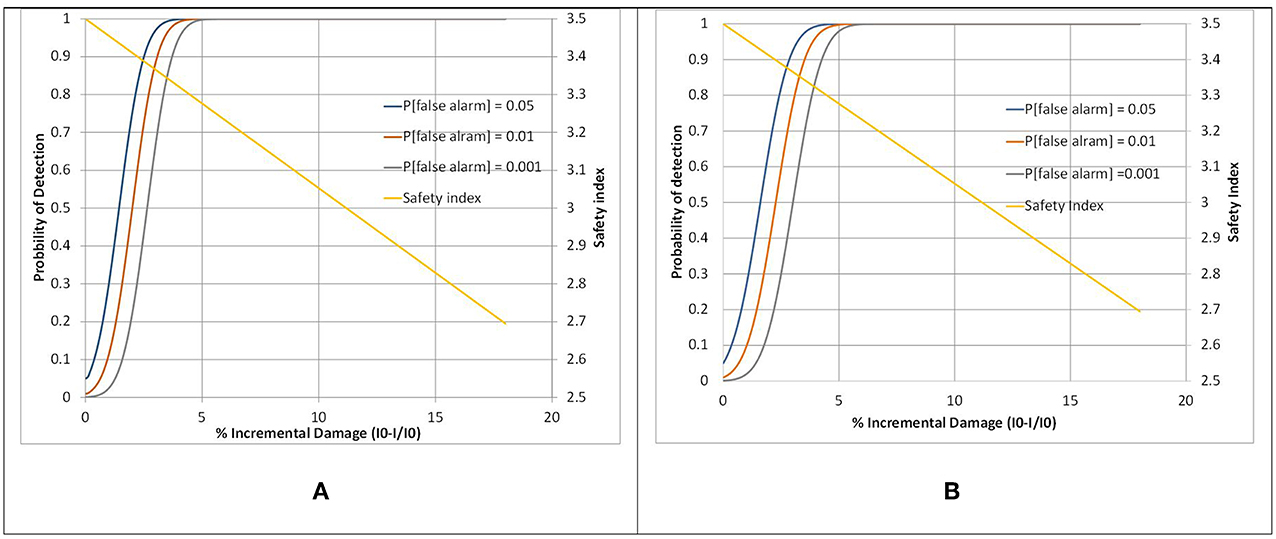
Figure 11. Probability of detection and safety index as a function of damage level and probability of false alarms for damage located at (A) 0.17L and (B) 0.65L (using wavelets).
As previously stated, the initial states of damage are the main focus of this study since these are the levels for which the owner may have multiple options for maintenance and repair. The analyses for levels E0-E2 are therefore the most pertinent for this study. However, the procedure can also be applied between higher levels or damage for the detection of incremental damage given an initial damaged state. Results indicate that small incremental damages become more easily detectable as damage levels increase. However, in some of these cases, safety levels may already be undesirably low.
Various procedures have been proposed to evaluate benefits of structural health monitoring (Straub, 2014; Thöns et al., 2015). These are based on a life cycle cost analysis that accounts for the consequences of the various monitoring outcomes and the costs for the instrumentation. A simplified version of these procedures is adapted to the results of the current analysis to illustrate the benefits of structural monitoring in improving the reliability of a structure. For this purpose, a simplified event tree is used for comparing the effects of two monitoring strategies; one based on changes in natural frequency and the other based on wavelet coefficients. The structure is either undamaged (state E0) or damaged (damage level dl) and the two monitoring strategies can detect or not the presence or absence of damage. It is assumed that if damage is detected, the structure is repaired and restored to its initial condition, while if it is undetected, the structure remains in the damaged state. It is also assumed that the structure is continuously monitored. The results are evaluated for monitoring strategies that allow probabilities of false alarms of 5, 1, and 0.1% as well as for a no monitoring strategy. The safety index (β) for a monitored structure is evaluated as a function of the damage level dl as,
Figure 12 shows the results for the monitoring strategy based on changes in the natural frequency and indicate that with continuous monitoring the structure can be maintained at a level of reliability above 3.2 for damage at either location 0.17 or 0.65L as compared to a non-monitored structure. Smaller significance levels of the test (i.e., reducing the probability of false alarms) reduce the safety index of the structure for low damage levels but have negligible effects for damage levels exceeding 10%. More importantly, results indicate that the rate of false alarms can be reduced significantly without compromising the structural safety.
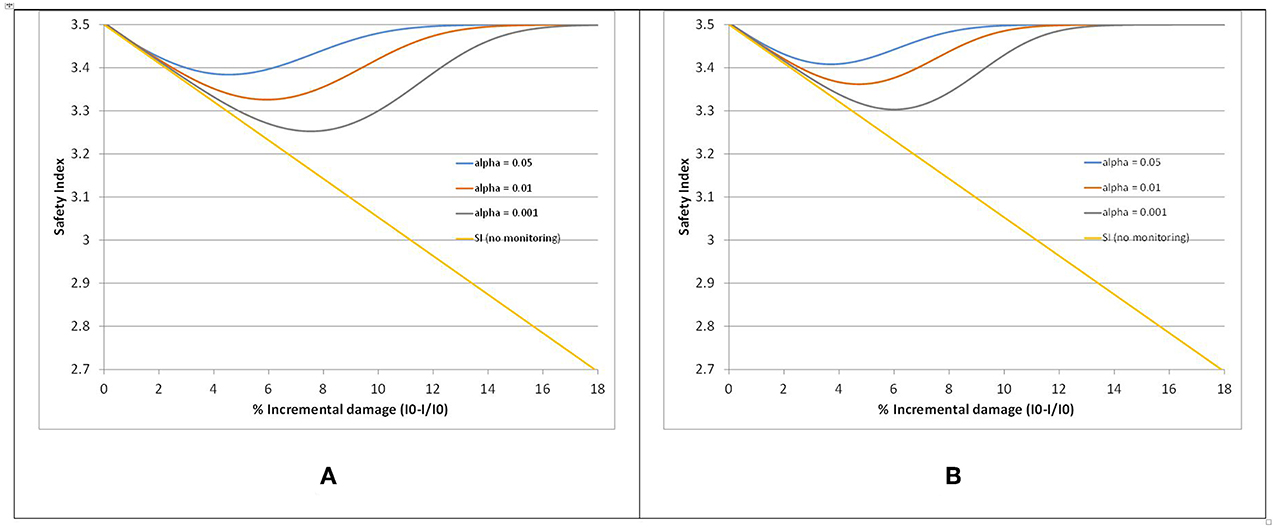
Figure 12. Safety Index as a function of damage level and monitoring based on changes in the natural frequency for damage located at (A) 0.17L and (B) at 0.65L.
Figure 13 shows similar results for a monitoring strategy based on changes in wavelet coefficients and indicate that the latter is superior to monitoring based in changes in the natural frequency and can be used to maintain a higher degree of reliability (>3.4) for the structure. In this case, the effect of the significance level of the test on safety levels is much lower than for the other monitoring procedure. Maximum damage levels for the monitored structure can be maintained below 2%. The wavelet procedure proposed by Shahsavari et al. (2017) can also be used to locate damage along the beam; however, this aspect is not addressed in the current paper, which focusses on damage detection.
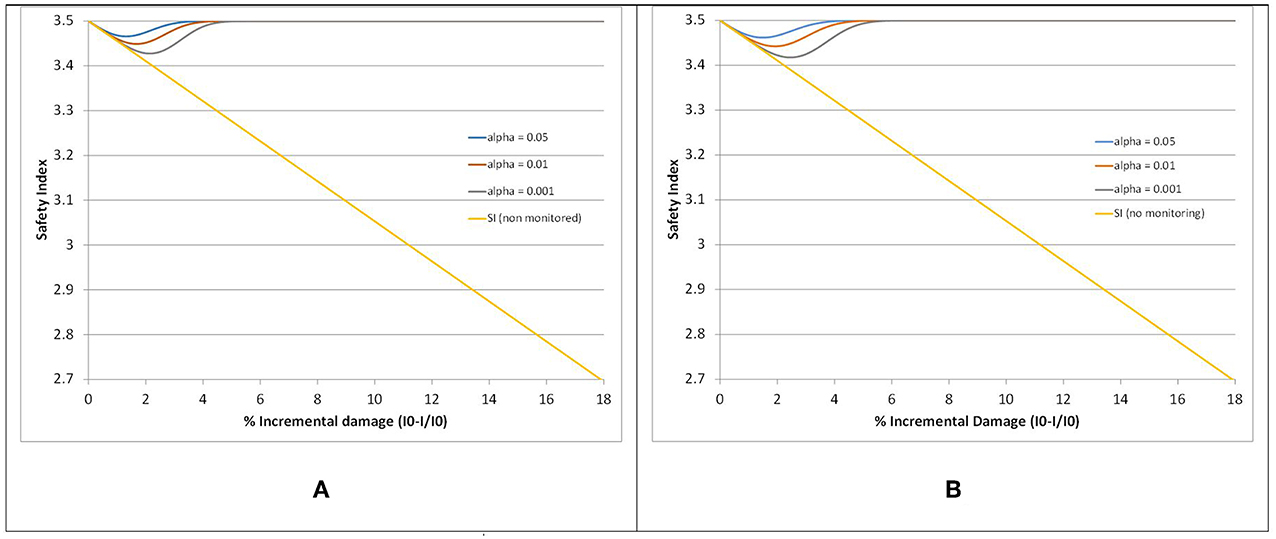
Figure 13. Safety Index as a function of damage level and monitoring based on changes in wavelet coefficients for damage located at (A) 0.17L and (B) at 0.65L.
Conclusion
The safety index and the probabilities of detection and of false alarm are proposed as criteria for evaluating the performance of structural health monitoring procedures using vibration data. The probabilities of detection and of false alarms are, respectively, defined as the power and the significance level of a test of hypothesis on the mean of dynamic properties between two sets of measurements. Under the null hypothesis the dynamic properties, given similar operational and environmental conditions, are similar between two inspection cycles, while the one-sided alternative hypothesis assumes that the dynamic properties are significantly different (increase or decrease depending on the dynamic characteristics).
The procedure is demonstrated with data obtained on an instrumented beam under laboratory controlled conditions for increasing levels of damage at two locations along the beam. Damage detection procedures based on changes in the fundamental frequency and wavelet coefficients are evaluated and compared. Results demonstrate that changes in the wavelet coefficients are more effective than changes in the fundamental frequency in detecting low levels of incremental damage between inspections and that low levels of damage can be simultaneously detected with a high level of certainty and few false alarms before the safety of the structure is significantly compromised. The performance of the monitoring procedures can be compared by considering the probability of detection as a function of the damage level and the significance level of the test (i.e., the probability of false alarms) and by comparing the safety index of a continuously monitored structure as a function of the damage level. In this case, the safety index is defined for a reference limit state based on pure bending of the beam, which provides a uniform reference for any damage location along the beam. The results indicate that changes in wavelet coefficients are very effective in detecting low levels of damage even for high thresholds that minimize probabilities of false alarms. For a monitored structure, the monitoring strategy is effective in maintaining the safety level above 3.4 given an initial safety level of 3.5 for the intact structure.
Data Availability
The datasets for this manuscript are not publicly available because Files are with the student and require post-processing. Requests to access the datasets should be directed to Vahid Shahsavari, Vahid.Shahsavari.1@ulaval.ca.
Author Contributions
All authors listed have made a substantial, direct and intellectual contribution to the work, and approved it for publication.
Conflict of Interest Statement
The authors declare that the research was conducted in the absence of any commercial or financial relationships that could be construed as a potential conflict of interest.
Acknowledgments
This study is supported through a CREATE grant from the Natural Sciences and Engineering Research Council of Canada (NSERC) and the CRIB Research Center (Université Laval). The authors would also like to acknowledge the many useful comments from the reviewers. Part of the work presented is from the PhD thesis of Shahsavari (2017).
References
Alvandi, A., Bastien, J., Gregoire, E., and Jolin, M. (2009). Bridge integrity assessment by continuous wavelet transforms. Int. J. Struct. Stab. Dynam. 9, 11–43. doi: 10.1142/S0219455409002874
Alvandi, A., and Cremona, C. (2006). Assessment of vibration-based damage identification techniques. J. Sound Vib. 292, 179–202. doi: 10.1016/j.jsv.2005.07.036
Antoine, J. P., Murenzi, R., Vandergheynst, P., and Ali, S. T. (2008). Two-dimensional Wavelets and Their Relatives. Cambridge: Cambridge University Press.
Bakry, A., Mourad, S., and Selmy, S. (2018). Detection of damage location in beams using discrete wavelet analysis. Egypt. Int. J. Eng. Sci. Technol. 26, 29–37.
Cao, M., and Qiao, P. (2008). Integrated wavelet transform and its application to vibration mode shapes for the damage detection of beam-type structures. J. Smart Mater. Struct. 17:055014. doi: 10.1088/0964-1726/17/5/055014
Catbas, F., Gul, M., and Burkett, J. (2007). Damage assessment using flexibility and flexibility-based curvature for structural health monitoring. J. Smart Mater. Struct. 17:015024. doi: 10.1088/0964-1726/17/01/015024
Chance, J., Tomlinson, G., and Worden, K. A. (1994). “Simplified approach to the numerical and experimental modelling of the dynamics of a cracked beam,” in Proceedings-SPIE the International Society for Optical Engineering (Citeseer), 778–778.
Chen, H., Spyrakos, C., and Venkatesh, G. (1995). Evaluating structural deterioration by dynamic response. J. Struct. Eng. 121, 1197–1204. doi: 10.1061/(ASCE)0733-9445(1995)121:8(1197)
Doebling, S.W., Farrar, C., and Prime, M.B. (1998). A summary review of vibration-based damage identification methods. Shock Vib. Digest 30, 91–105. doi: 10.1177/058310249803000201
Fan, W., and Qiao, P. (2009). A 2-D continuous wavelet transform of mode shape data for damage detection of plate structures. Int. J. Solids Struct. 46, 4379–4395. doi: 10.1016/j.ijsolstr.2009.08.022
Farrar, C. R., Baker, W., Bell, T., Cone, K., Darling, T., Duffey, T., et al. (1994). Dynamic characterization and damage detection in the I-40 bridge over the Rio Grande. J. Shock Vib. Digest. 30, 91–105. doi: 10.2172/10158042
Gentile, A., and Messina, A. (2003). On the continuous wavelet transforms applied to discrete vibrational data for detecting open cracks in damaged beams. Int. J. Solids Struct. 40, 295–315. doi: 10.1016/S0020-7683(02)00548-6
He, W. Y., Zhu, S., and Ren, W. X. (2019). Two-phase damage detection of beam structures under moving load using multi-scale wavelet signal processing and wavelet finite element model. Appl. Math. Model. 66, 728–744. doi: 10.1016/j.apm.2018.10.005
Jaiswal, N., and Pande, D. (2015). Sensitizing the mode shapes of beam towards damage detection using curvature and wavelet transform. Int. J. Sci. Technol. Res. 4, 266–272.
Janeliukstis, R., Rucevskis, S., Wesolowski, M., and Chate, A. (2017a). Multiple damage identification in beam structure based on wavelet transform. Procedia Eng. 172, 426–432. doi: 10.1016/j.proeng.2017.02.023
Janeliukstis, R., Rucevskis, S., Wesolowski, M., and Chate, A. (2017b). Experimental structural damage localization in beam structure using spatial continuous wavelet transform and mode shape curvature methods. Measurement 102, 253–270. doi: 10.1016/j.measurement.2017.02.005
Kim, J. T., Ryu, Y. S., Cho, H. M., and Stubbs, N. (2003). Damage identification in beam-type structures: frequency-based method vs mode-shape-based method. J. Eng. Struct. 25, 57–67. doi: 10.1016/S0141-0296(02)00118-9
Kim, J. T., and Stubbs, N. (2002). Improved damage identification method based on modal information. J. Sound Vib. 252, 2, 223–238. doi: 10.1006/jsvi.2001.3749
Kim, J. T., and Stubbs, N. (2003). Crack detection in beam-type structures using frequency data. J. Sound Vib. 259, 145–160. doi: 10.1006/jsvi.2002.5132
Lee, J. J., Lee, J. W., Yi, J. H., Yun, C. B., and Jung, H. Y. (2005). Neural networks-based damage detection for bridges considering errors in baseline finite element models. J. Sound Vib. 280, 555–578. doi: 10.1016/j.jsv.2004.01.003
Liew, K., and Wang, Q. (1998). Application of wavelet theory for crack identification in structures. J. Eng. Mech. 124, 152–157. doi: 10.1061/(ASCE)0733-9399(1998)124:2(152)
Maeck, J., Abdel Wahab, M., Peeters, B., De Roeck, G., De Visscher, J., De Wilde, W., et al. (2000). Damage identification in reinforced concrete structures by dynamic stiffness determination. J. Eng. Struct. 22, 1339–1349. doi: 10.1016/S0141-0296(99)00074-7
Mardasi, A. G., Wu, N., and Wu, C. (2018). Experimental study on the crack detection with optimized spatial wavelet analysis and windowing. Mech. Syst. Signal Process. 104, 619–630. doi: 10.1016/j.ymssp.2017.11.039
Montgomery, D. C., and Runger, G. C. (2014). Applied Statistics and Probability for Engineers, 6th Edn. John Wiley and Sons.
Ndambi, J.-M., Vantomme, J., and Harri, K. (2002). Damage assessment in reinforced concrete beams using eigenfrequencies and mode shape derivatives. J. Eng. Struct. 24, 501–515. doi: 10.1016/S0141-0296(01)00117-1
Ovanesova, A., and Suarez, L. (2004). Applications of wavelet transforms to damage detection in frame structures. J. Eng. Struct. 26, 39–49. doi: 10.1016/j.engstruct.2003.08.009
Pandey, A., Biswas, M., and Samman, M. (1991). Damage detection from changes in curvature mode shapes. J. Sound Vib. 145, 321–332. doi: 10.1016/0022-460X(91)90595-B
Patel, S. S., Chourasia, A. P., Panigrahi, S. K., Parashar, J., Parvez, N., and Kumar, M. (2016). Damage identification of RC structures using wavelet transformation. Procedia Eng. 144, 336–342. doi: 10.1016/j.proeng.2016.05.141
Perera, R., and Huerta, C. (2008). Identification of damage in RC beams using indexes based on local modal stiffness. J. Constr. Build. Mater. 22, 1656–1667. doi: 10.1016/j.conbuildmat.2007.06.012
Ramesh, L., and Rao, P. S. (2018). Damage detection in structural beams using model strain energy method and wavelet transform approach. Mater. Today Proc. 5, 19565–19575. doi: 10.1016/j.matpr.2018.06.318
Reu, P. L., Rohe, D. P., and Jacobs, L. D. (2017). Comparison of DIC and LDV for practical vibration and modal measurements. Mech. Syst. Signal Process. 86, 2–16. doi: 10.1016/j.ymssp.2016.02.006
Rucka, M., and Wilde, K. (2006). Application of continuous wavelet transform in vibration based damage detection method for beams and plates. J. Sound Vib. 297, 536–550. doi: 10.1016/j.jsv.2006.04.015
Salawu, O. S. (1997). Detection of structural damage through changes in frequency: a review. Eng. Struct. 19, 718–723. doi: 10.1016/S0141-0296(96)00149-6
Shahsavari, V. (2017). Condition Assessment of Bridge Structures Using Statistical Analysis of Wavelets. Ph.D. Dissertation, Laval University.
Shahsavari, V., Bastien, J., Chouinard, L., and Clément, A. (2015). “A novel response-based approach to localize low intensity damage of beam-like structures,” in Proceedings of the 5th International Conference on Smart Materials and Nanotechnology in Engineering (Vancouver, BC).
Shahsavari, V., Chouinard, L., and Bastien, J. (2017). Wavelet-based analysis of mode shapes for statistical detection and localization of damage in beams using likelihood ratio test. J. Eng. Struct. 132, 494–507. doi: 10.1016/j.engstruct.2016.11.056
Sohn, H., Farrar, C. R., Hemez, F. M., Shunk, D. D., Stinemates, D. W., Nadler, B. R., et al. (2004). A Review of Structural Health Monitoring Literature: 1996–2001. Los Alamos: Los Alamos National Laboratory.
Solís, M., Algaba, M., and Galvín, P. (2013). Continuous wavelet analysis of mode shapes differences for damage detection. J. Mech. Syst. Signal. Process. 40, 645–666. doi: 10.1016/j.ymssp.2013.06.006
Straub, D. (2014). Value of information analysis with structural reliability methods. Struct. Saf. 49, 75–85. doi: 10.1016/j.strusafe.2013.08.006
Sun, Z., and Chang, C. (2004). Statistical wavelet-based method for structural health monitoring. J. Struct. Eng. 130, 1055–1062. doi: 10.1061/(ASCE)0733-9445(2004)130:7(1055)
Taha, M., Noureldin, A., Lucero, J., and Baca, T. (2006). Wavelet transform for structural health monitoring: a compendium of uses and features. J. Struct. Health Monit. 5, 267–295. doi: 10.1177/1475921706067741
Thöns, S., Schneider, R., and Faber, M. H. (2015). “Quantification of the value of structural health monitoring information for fatigue deteriorating structural systems,” in 12th International Conference on Applications of Statistics and Probability in Civil Engineering (Vancouver, BC).
Vafaei, M., Alih, S. C., Rahman, A. B. A., and Adnan, A. B. (2015). A wavelet-based technique for damage quantification via mode shape decomposition. J. Struct. Infrastruct. Eng. 11, 869–883. doi: 10.1080/15732479.2014.917114
Wang, Q., and Deng, X. (1999). Damage detection with spatial wavelets. Int. J. Solids Struct. 36, 3443–3468. doi: 10.1016/S0020-7683(98)00152-8
Worden, K., Farrar, C. R., Manson, G., and Park, G. (2007). The fundamental axioms of structural health monitoring. Proc. Math. Phys. Eng. Sci. 463, 1639–1664. doi: 10.1098/rspa.2007.1834
Zhong, S., and Oyadiji, S. O. (2007). Crack detection in simply supported beams without baseline modal parameters by stationary wavelet transform. J. Mech. Syst. Signal. Process. 21, 1853–1884. doi: 10.1016/j.ymssp.2006.07.007
Zhong, S., and Oyadiji, S. O. (2011). Crack detection in simply supported beams using stationary wavelet transform of modal data. Struct. Control Health Monitor. 18, 169–190. doi: 10.1002/stc.366
Keywords: damage, detection, wavelets, vibrations, reliability, hypothesis testing
Citation: Chouinard L, Shahsavari V and Bastien J (2019) Reliability of Wavelet Analysis of Mode Shapes for the Early Detection of Damage in Beams. Front. Built Environ. 5:91. doi: 10.3389/fbuil.2019.00091
Received: 31 March 2019; Accepted: 21 June 2019;
Published: 05 July 2019.
Edited by:
Ersin Aydin, Niğde Ömer Halisdemir University, TurkeyReviewed by:
Mohammad Noori, California Polytechnic State University, United StatesAlexandre Cury, Universidade Federal de Juiz de Fora, Brazil
Copyright © 2019 Chouinard, Shahsavari and Bastien. This is an open-access article distributed under the terms of the Creative Commons Attribution License (CC BY). The use, distribution or reproduction in other forums is permitted, provided the original author(s) and the copyright owner(s) are credited and that the original publication in this journal is cited, in accordance with accepted academic practice. No use, distribution or reproduction is permitted which does not comply with these terms.
*Correspondence: Luc Chouinard, luc.chouinard@mcgill.ca