Deep Learning-Based Imbalanced Classification With Fuzzy Support Vector Machine
 Ke-Fan Wang
 Jing An1
  Han-Qiu Bao
- 1School of Electrical and Electronic Engineering, Shanghai Institute of Technology, Shanghai, China
- 2School of Design, East China Normal University, Shanghai, China
- 3College of Electronic and Information Engineering, Tongji University, Shanghai, China
Imbalanced classification is widespread in the fields of medical diagnosis, biomedicine, smart city and Internet of Things. The imbalance of data distribution makes traditional classification methods more biased towards majority classes and ignores the importance of minority class. It makes the traditional classification methods ineffective in imbalanced classification. In this paper, a novel imbalance classification method based on deep learning and fuzzy support vector machine is proposed and named as DFSVM. DFSVM first uses a deep neural network to obtain an embedding representation of the data. This deep neural network is trained by using triplet loss to enhance similarities within classes and differences between classes. To alleviate the effects of imbalanced data distribution, oversampling is performed in the embedding space of the data. In this paper, we use an oversampling method based on feature and center distance, which can obtain more diverse new samples and prevent overfitting. To enhance the impact of minority class, we use a fuzzy support vector machine (FSVM) based on cost-sensitive learning as the final classifier. FSVM assigns a higher misclassification cost to minority class samples to improve the classification quality. Experiments were performed on multiple biological datasets and real-world datasets. The experimental results show that DFSVM has achieved promising classification performance.
Introduction
In many fields, the distribution of data is imbalanced and the problem of imbalanced datasets occurs when one class is much larger than the other. For example, in disease diagnosis (Bhattacharya et al., 2017; Loey et al., 2020), most of the data are healthy, and it is difficult to obtain data on diseases. Moreover, with the deployment of various monitoring systems, more and more data are collected in smart cities and the Internet of Things, but there are a lot of data on the normal operation and abnormal data is rare (Du et al., 2019; Fathy et al., 2020). More specifically, this problem occurs when one class outnumbers the other class, which are usually referred to as majority and minority class, respectively (Tao et al., 2020). The majority class samples are more easily available, while the minority class samples are more difficult to obtain data due to natural frequency of occurrence or data collection. The imbalanced data distribution also exists in the fields of fraud detection (Li and Wong, 2015; Jiang et al., 2018), computer security (Wang and Yao, 2013), intrusion detection (Yao et al., 2018), drift detection (Wang et al., 2021), image recognition (Romani et al., 2018) and defect detection (Li et al., 2020). In machine learning, there are many well-established classification methods, such as decision tree, logistic regression, support vector machine and extreme learning machine (Shi et al., 2022), but they are based on the assumption of uniform data distribution and have over-all accuracy as the optimization goal. When traditional classification methods are used to deal with imbalanced classification, the result are more in favor of the majority class and ignore the importance of the minority class. Although the overall accuracy is relatively high, the minority class data with important information cannot be accurately identified.
Many imbalance classification algorithms have been proposed in recent decades. These algorithms can be generally divided into two main types: data-level and algorithm-level (Tao et al., 2020). The data-level approaches first bring the original imbalanced dataset to balanced distribution by some sampling processing, and then classify it by using a traditional classifier. The algorithm-level approaches attempt to improve existing classification algorithms by reducing their bias for the majority class data, and thus adapt to imbalanced data distribution.
In this paper, a novel imbalance classification method based on deep feature representation is proposed, named DFSVM. First, from the perspective of data features, a deep neural network is used to obtain the embedding space features. Appropriate feature representation can improve the classification performance of models, and it also enhances the differentiation of features of different classes and the similarity of feature areas of the same class. In addition, it will provide a basis for the effective recognition of samples. The deep neural network has a complex nonlinear network structure, which can effectively extract the deep features of samples. When training the network, a triplet loss function (Schroff et al., 2015) is used to enable the network to separate the features of minority class and majority class. Additionally, Gumbel distribution function (Cooray, 2010) is applied as an activation function in the activation layer. This function is continuously differentiable, and it can be easily used as an activation function in stochastic gradient descent optimization neural networks. The original input samples are mapped to the same embedding space after feature extraction. In the embedding space, a new minority class sample is randomly generated based on the distance between the sample and the center of the class, which makes the data distribution balanced. After obtaining the embedding features of samples, a fuzzy support vector machine (FSVM) (Lin and Wang, 2002) is used to classify. FSVM introduces membership values (MVs) in the objective function of traditional support vector machine, and it sets different misclassification costs for different classes samples. The misclassification cost of the minority class is higher than that of the majority class. FSVM is a cost-sensitive learning strategy that can effectively improve the recognition rate of the minority class samples. In addition, traditional classification methods use accuracy as classifier evaluation metrics, but classifiers with accuracy as evaluation metrics tend to reduce the classification effectiveness of the minority class. Moreover, accuracy limits the effect of minority class samples on classification performance. Therefore, this paper uses G-mean, F-measure and AUC values to evaluate the classification results more comprehensively.
The rest of this paper is organized as follows. In Related Work Section, the related work on imbalance classification is presented. Proposed Method Section describes DFSVM. In Experiments and Results and Conclusion Sections, the experimental results and conclusions are introduced.
Related Work
The imbalance of data distribution and the limitation of traditional classification algorithms are the main problems that imbalanced classification faces, therefore, researches on imbalanced classification can be divided into two levels: data-level and algorithm-level.
Data-Level
Data resampling is the most representative method of data-level, which reduces the imbalanced ratio (IR) by changing the data distribution. The undersampling algorithm reduces the bias of model to the majority class by reducing the number of samples in the majority class. Random undersampling is the simplest approach, it randomly selects and removes part of the majority class samples. However, random undersampling easily leads to the deletion of potentially useful information, so some heuristic methods are proposed.
Neighborhood cleanup rule (NCL) (Laurikkala, 2001) uses an instance-based approach to reduce larger classes and considers carefully the quality of the data to be removed. To reduce the impact of some noisy minority examples on the performance of classifiers, Kang et al. (2016) proposed a new undersampling algorithm by introducing a noise filter. The weighted under-sampling of SVM (WU-SVM) groups majority samples into some subregions and assigns different weights based on their Euclidean distance to the hyper plane to retain the data distribution information of original dataset (Kang et al., 2017). The other popular sampling method is oversampling, which is used to balance the data distribution by increasing the number of minority class samples. Random oversampling can cause overfitting, so heuristic methods are also mostly used. The most representative one is the synthetic minority oversampling technique (SMOTE, Chawla et al., 2002). SMOTE generates a new minority sample by interpolating between k nearest minority neighbors. However, due to the irregular data distribution, new samples generated by SMOTE may become noise, which may increase the overlap between classes and lead to misclassification. In order to generate more reasonable samples, some variants of SMOTE have been proposed, such as Bordeline-SMOTE (B-SMOTE) (Han et al., 2005) and adaptive synthetic sampling approach (ADASYN) (He et al., 2008). The kernel-based SMOTE (KSMOTE) algorithm synthesizes minority data points directly in the feature space of SVM classifier and adds new data points by augmenting the original Gram matrix based on neighborhood information in the feature space (Mathew et al., 2015). Weighted kernel-based SMOTE (WK-SMOTE) overcomes the limitations of SMOTE for nonlinear problems by oversampling in the feature space and cost-sensitive support vector machine (Mathew et al., 2018).
Algorithm-Level
Traditional classification methods tend to favor majority class and ignore minority class samples when dealing with imbalanced data. To overcome the shortcomings of traditional classification, researchers have made improvements to the algorithms themselves. Typical improvements are cost-sensitive and ensemble learning methods. Fuzzy support vector machine (FSVM) (Lin and Wang, 2002) is a cost-sensitive algorithm. It introduces the fuzzy membership values (MVs) of each sample into the objective function of the support vector machine (SVM) to distinguish the importance of different samples. FSVM-CIL is an improved FSVMs for class imbalance learning that can be used to deal with class imbalances in the presence of outliers and noise, and its membership calculation is based on the distance in the original data space (Batuwita and Palade, 2010). Yu et al. (2019) proposed two relative density-based FSVM, namely, FSVM-WD based on within-class relative density and FSVM-BD based on between-class relative density, which use a similar strategy to calculate the relative density of each training sample based on K-nearest neighbor probability density estimation (KNN-PDE). ACFSVM is a FSVM method based on affinity and class probability, which calculates the affinity of majority class samples based on the support vector description domain (SVDD) model, and then identifies possible outliers and some border samples existing in the majority class (Tao et al., 2020). The basic idea of ensemble learning is to combine standard ensemble learning algorithms with existing imbalanced data classification methods, such as SMOTEBagging (Wang and Yao, 2009) and SMOTEBoost (Chawla et al., 2003). However, the training process of ensemble learning for base classifiers is more complicated and has limitations in handling high-dimensional data, and there are difficulties in choosing the type and number of base classifiers.
Proposed Method
The DFSVM method proposed in this paper uses a fuzzy support vector machine as the base classifier and uses data sampling method to obtain balanced data distribution. The new samples generated after oversampling still belong to the minority class, and the use of FSVM can further improve the model’s focus on the minority class. In addition, deep neural networks are used to obtain more discriminative feature information, which make subsequent classification convenient.
Feature Extraction With Deep Learning
With the significant increase in computer computing power and the explosive growth of data amount, deep learning has attracted a lot of attention in academia and industry in recent years. Deep neural networks (DNNs) have succeeded in significantly improving the best recognition rate of each previous problem by increasing the network depth or changing the structure of the model (Krizhevsky et al., 2012; He et al., 2016). Deep learning implementations rely on deep neural networks, which involves a cascade of multiple layers of nonlinear processing units for feature extraction and transformation. For example, convolutional neural networks (CNNs) are one such deep learning architecture that has achieved breakthrough performance gains in image classification (Kang et al., 2021). Feature representation is critical to the classification performance, so this paper applies the classification method to the embedding space after feature extraction.
In this paper, a deep neural network (DNN) is used as feature extractors because it can learn advanced feature representations from samples (Ng et al., 2016). Once training is complete, the hidden feature representations can be used as embedding features to reveal interesting structures in the data. To enhance the differentiation of features from different classes and reduce the differentiation of features from samples in the same class, a triplet loss (Schroff et al., 2015) is used to train the network model, bring samples in the same class closer, and further separate samples in different classes. Each sample can be converted into a differentiated feature space based on the trained model. The triplet loss uses anchor points, which allows the embedding space feature to be arbitrarily distorted. It is defined as:
where m is the margin and set to 0.2 in experiments, D is the distance function, a is the anchor point belonging to the minority class, min is the minority class samples, and maj is the majority class samples.
Figure 1 shows the results and geometric significance of optimization using triple loss. Triplet loss tries to learn an embedding space in which anchor is closer to the minority class samples, and the anchor is further away from the majority class samples. The deep neural network model with the triplet loss as the training criterion not only takes the simplicity of metric learning into account, but also has excellent nonlinear modeling capabilities of neural networks, which can greatly simplify and control the training process. When the two inputs are similar, the triplet loss can learn a better representation for the two input vectors with smaller differences, and thus perform well in the classification task.
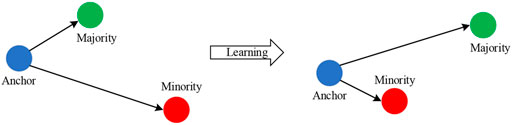
FIGURE 1. Optimization result using triple loss function.
Gumbel distribution (Cooray, 2010) is used as the activation function in DNN. The Gumbel distribution, also known as Generalized Extreme Value (GEV) distribution type I, is widely used to design the distribution of extreme value samples of various distributions. The cumulative distribution function (CDF) is defined as:
When compared to the Gumbel distribution, the ReLU activation function shows some drawbacks for the class imbalance problem: it tends to underestimate the probability of minority nodes when dealing with the issue of class imbalance. Relative to the ReLU activation function, the Gumbel distribution function is not affected by the dying ReLU problem. Moreover, the Gumbel distribution is asymmetric, so that different penalties can be applied to the misclassification of both classes. In addition, the Gumbel distribution function is continuously differentiable, so it can be easily used as an activation function with optimization in a neural network. Finally, the whole DNN framework used for feature extraction is shown in Figure 2. The network used for feature extraction consists of three hidden layers, and we set the number of neurons in each layer to have the following relationship: the number of neurons in the next layer is half of the number of neurons in the previous layer. In the later experiments, we only set the number of neurons in the third layer, i.e., the dimension of the final embedding space, and the first two layers will make the corresponding changes according to the above rules. Figure 3 shows two t-SNE plots of the original Glass1 dataset and the dataset after the network training. It can be seen that after training, the different classes become easier to distinguish.
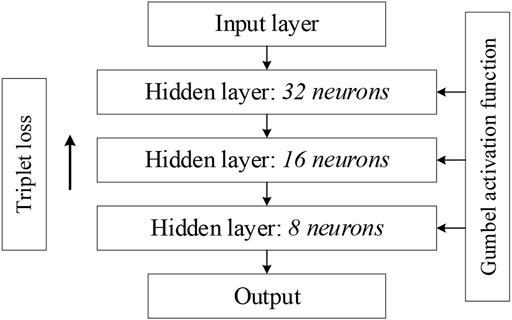
FIGURE 2. Deep neural network framework for feature extraction.
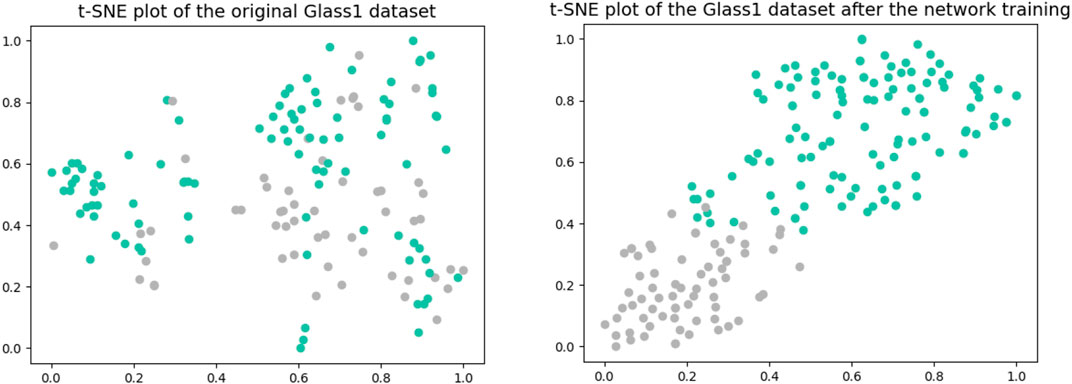
FIGURE 3. t-SNE plots of the original Glass1 dataset and after the network training.
Random Feature Oversampling Based on Center Distance
After obtaining the embedding space representation of samples, the data distribution is still imbalanced. The dataset in the embedding space is
This method of randomly generated features can increase the diversity of the minority class samples and avoid overfitting. However, the method generates some outliers and noise, so a constraint based on class center distance is used to filter the synthetic samples. As shown in Figure 4, in the embedding space, the center of the majority class is
where
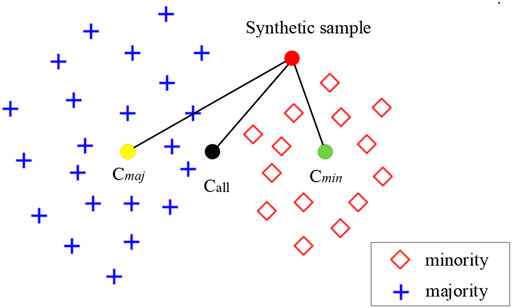
FIGURE 4. Validation of the new synthetic feature vector.
Fuzzy Support Vector Machine
In many real-life applications, each sample has a different level of importance. For imbalanced data problems, the minority class samples are often more important than the majority class samples. In order to improve the classification performance, each sample needs to be assigned to a corresponding weight according to its importance. In this paper, a fuzzy support vector machine (FSVM) (Lin and Wang, 2002) is used as the classifier to achieve the assignment of different weights.
The data after sampling as
where
The above formula satisfies the following conditions:
Introduce Equation 6 into Equation 5. The optimization problem is transformed into the following formula:
where
In this way, the value of
After that, the value of
Experiments and Results
Evaluation Metrics and Datasets
In this paper, G-mean, F-measure and AUC values are used to comprehensively evaluate the classification quality of the model. In imbalanced classification, the overall accuracy is not effective in evaluating the classification results. To evaluate the imbalanced classification effect by accuracy may cause the model to be biased towards the majority class, because a high overall accuracy can be obtained by ensuring only the correct classification of the majority class. The overall accuracy ignores the important influence of the minority class.
F-measure is defined based on the metrics of Precision (Pre) and Sensitivity (Sen), which are defined as:
where TP (True Positives) denotes the number of positive observations (minority class) correctly classified as positive, FP (False Positives) denotes the number of negative observations (majority class) incorrectly classified as positive, FN (False Negatives) denotes the number of positive observations incorrectly classified as negative, and TN denotes the number of negative observations correctly classified as negative (Ye et al., 2020). The definition of F-measure is as
G-mean is defined based on the metrics of Sensitivity (Sen) and Specificity (Spe), which are defined as:
AUC (Area Under Curve) is defined as the area under the ROC curve and the coordinate axis. The value of this area will not be greater than 1. Among them, the ROC curve is called the receiver operating characteristic curve. It is based on a series of different binary classification methods (cutoff value or decision threshold), with the true positive rate (Sen) as the ordinate, and the false positive rate (1-Spe) is the curve drawn on the abscissa. The closer the AUC is to 1.0, the higher the authenticity of the detection method; when it is equal to 0.5, the authenticity is the lowest and it has no application value. The algorithm was tested on twelve binary classification datasets from the Keel database, as shown in Table 1.
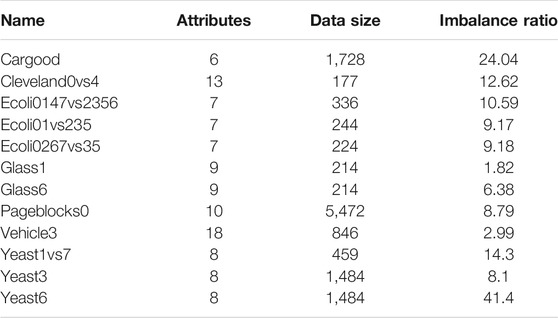
TABLE 1. Description of the datasets.
Experiment Settings
In data feature processing, a deep neural network with four fully connected layers is used. When using fuzzy support vector machine for classification operation, the kernel function is Gaussian kernel function. For FSVM classifier, penalty constant C and the width of Gaussian kernel σ are selected by gird search method from the set
where
In order to compare the classification performance of the proposed model, nine methods are used. B-SMOTE (Han et al., 2005) uses SMOTE (Chawla et al., 2002) to synthesize new samples for the minority-class samples lying around the boundary line. SOMO (Douzas and Bacao, 2017) produces a two-dimensional representation. Then it generates within-cluster and between-cluster synthetic samples. KmeansSMOTE (Douzas et al., 2018) uses k-means clustering algorithm and SMOTE to balance datasets, and only oversampling in safe areas to avoid noise. FSVM-CEN and FSVM-HYP (Batuwita and Palade, 2010) use a linear decay function to calculate the MVs based on the distance from the own class center or from the actual hyperplane, and finally use FSVM for classification. FSVM-WD and FSVM-BD (Yu et al., 2019) adopt a k-nearest neighbors-based probability density estimation to design a membership function based on the within-class and between-class relative density, and then assign weights to different samples. ACFSVM (Tao et al., 2020) first gives the corresponding formulation of affinity to calculate different affinities for each sample in the majority class. Then the class probability of each majority-class sample is determined using the kernel KNN technique and combined with its corresponding affinity as MVs. In addition, note that the parameters that existed in each algorithm adopt the default ones in each corresponding reference. For DFSVM, the margin m and the number of neurons in the third hidden layer of the deep neural network are selected by gird search method from the set {0.1, 0.2, 0.3, 0.4, 0.5, 0.6, 0.7, 0.8, 0.9} and {2,4,6,8,10,12}.
Comparison of Imbalanced Classification Performance
To verify the effectiveness of the model on imbalance classification tasks, DFSVM is compared with nine representative and state-of-the-art class imbalance algorithms. Table 2 summarizes the experimental results on part of the datasets in terms of G-mean, F-measure and AUC, and highlights the best performing models in boldface. It can be observed that DFSVM achieves better performance in most cases. For the Cleveland0vs4 dataset, DFSVM improves 0.123 relative to ACFSVM under the G-mean metric. Although DFSVM does not achieve the best results on the AUC metric on the Cargood dataset, it achieves the best classification results on the G-mean and F-measure, which indicates that DFSVM has good recognition for the minority class. On the Pageblocks0 dataset, the classification performance of DFSVM did not achieve the best results on all three different evaluation metrics. However, its classification performance does not differ much from the best result. For example, for G-mean, it differs from the best by only 0.2%, and F-measure differs by 1%, which indicates that DFSVM still has a better classification effect. Yeast6 dataset has the highest imbalance ratio with IR = 41.4 and Glass1 dataset has the lowest imbalance ratio with IR = 1.82. The proposed method in this paper achieves better classification results on both Yeast6 and Glass1datasets. The best results were obtained for all evaluation metrics on the Yeast6 dataset, and two evaluation metrics for Glass1 dataset. This shows that DFSVM has good classification results for datasets with different imbalance ratios and it is robust.
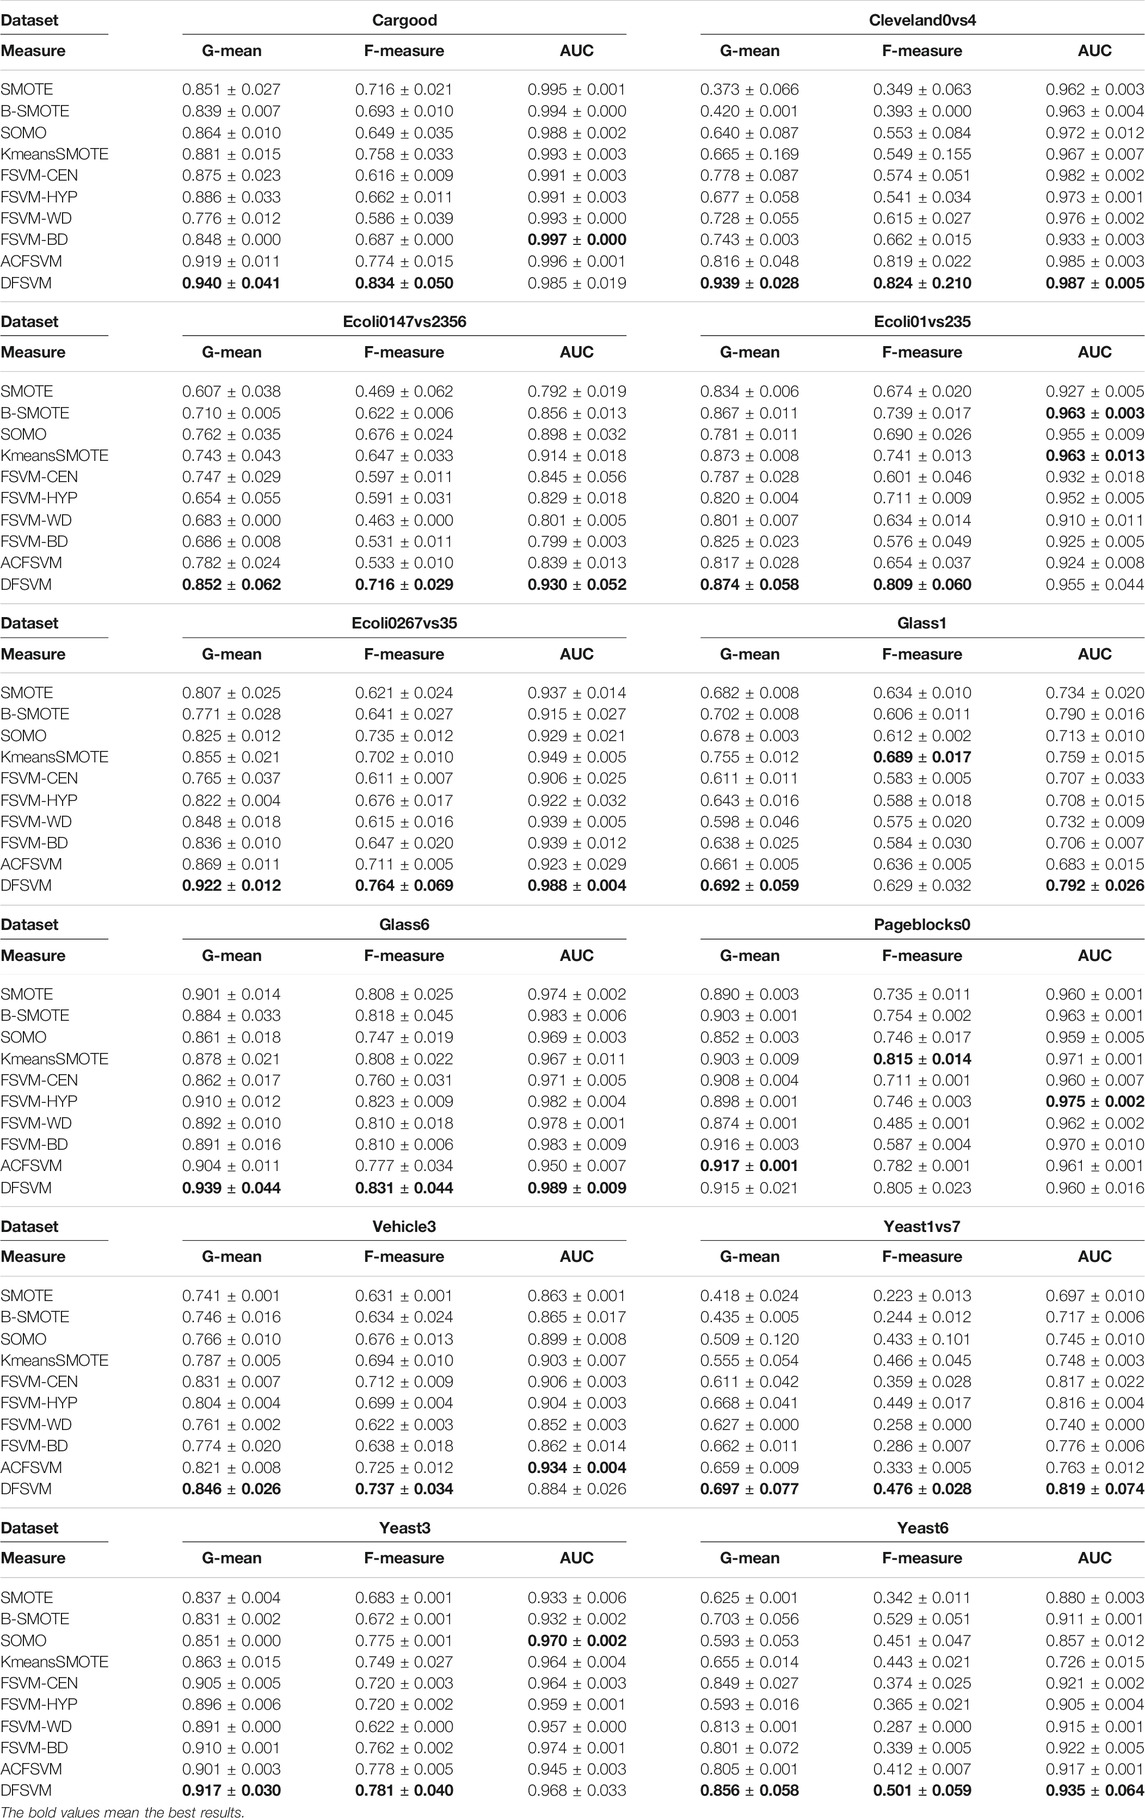
TABLE 2. Results of different imbalanced classification methods on datasets.
In addition, statistical tests were performed in this paper to verify the validity and significance of the proposed method. Under the null hypothesis, all algorithms are equivalent (i.e., any difference between their mean ranks is only random). The Friedman statistic
is distributed according to the
which is distributed according to the F-distribution with
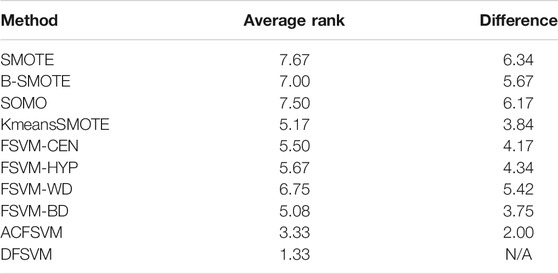
TABLE 3. Average ranking of different methods on G-mean and its ranking difference with DFSVM.
Influence of Activation Function on the Performance of the Proposed Method
In this subsection, we compare the effect of the Gumbel activation function and the ReLU activation function on the experimental results. We selected five datasets, three of them are Ecoli datasets. They are different from each other, for example, in the Ecoli0147vs2356 dataset, positive samples belong to classes 0, 1, 4, 7 and negative samples belong to classes 2, 3, 5, 6; in the Ecoli01vs235 dataset, positive class samples belong to classes 0, 1 and negative samples belong to classes 2, 3, 5. In the experiments, the structure of the deep neural network is fixed, the number of neurons in the third hidden layer is set to 8, and the margin of triplet loss is set to 0.2. The experimental results are shown by Figure 5. It can be seen that the classification effect of Gumbel function is better than ReLU function. In the Ecoli0267vs35 dataset, the Gumbel function showed the most significant improvement. With the G-mean and F-measure metrics, the classification effect of the Gumbel function is 6.19 and 7.71% higher than the ReLU function. On the Glass1 dataset, although the classification quality of the Gumbel function is not as good as that of the ReLU function in the G-mean and F-measure metrics, the Gumbel function achieves better results in the AUC metric.
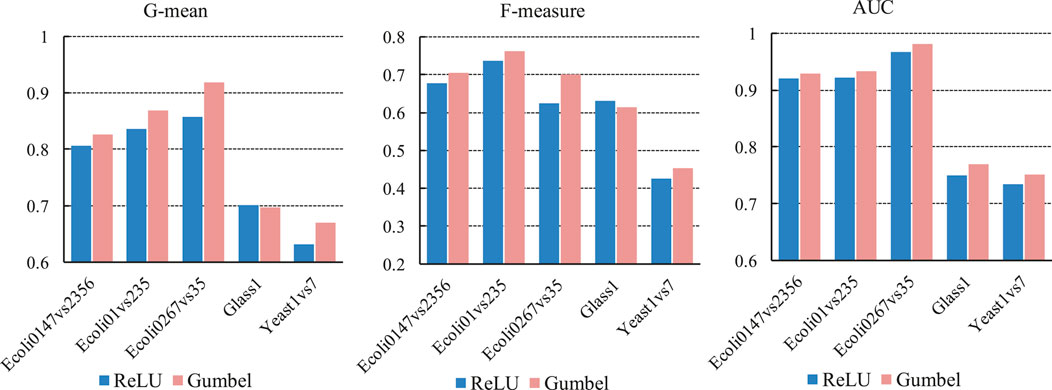
FIGURE 5. Classification effect of DFSVM under two different activation functions.
Influence of Classifier and Sampling Algorithms on Classification Performance
This subsection compares the classification quality of two different classifiers, SVM and FSVM. We also selected 5 datasets. In the experiments, the structure of the deep neural network is fixed, the number of neurons in the third hidden layer is also set to 8, and the margin of triplet loss is set to 0.2. The experimental results are shown in Table 4, and highlights the best performing models in boldface. It can be seen that the classification quality of FSVM is better than that of SVM. On the Ecoli01vs235 dataset, the AUC values of FSVM are slightly lower than those of SVM, but FSVM is 0.0524 and 0.2428 higher than SVM in G-mean and F-measure metrics. FSVM assigns a higher misclassification cost to the minority class in the objective function and therefore has a better imbalance classification effect.
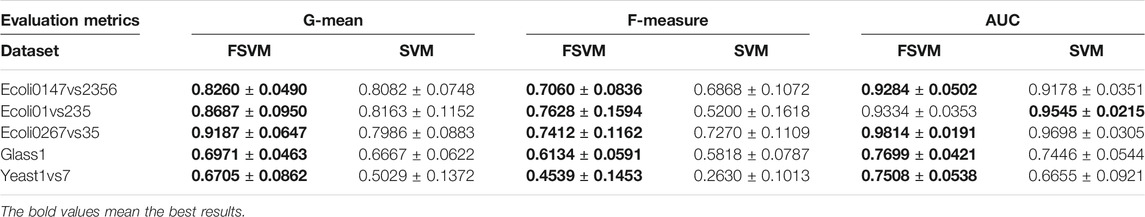
TABLE 4. Classification effect of DFSVM under two different base classifiers.
In addition, we compare the center distance based random feature oversampling method in DFSVM with different sampling methods, such as SMOTE, B-SMOTE, SOMO and KmeansSMOTE. In the experiments, we only replace the different sampling methods and keep the remaining settings the same. The experiments were conducted on four different datasets, and the results are shown in Table 5, which shows that the random feature oversampling method based on the center distance is better than the other sampling methods. The best results under each dataset are bolded. Although DFSVM does not have the best classification results on the G-mean and AUC for the Ecoli01vs235 dataset, it achieves the best classification results on the F-measure.
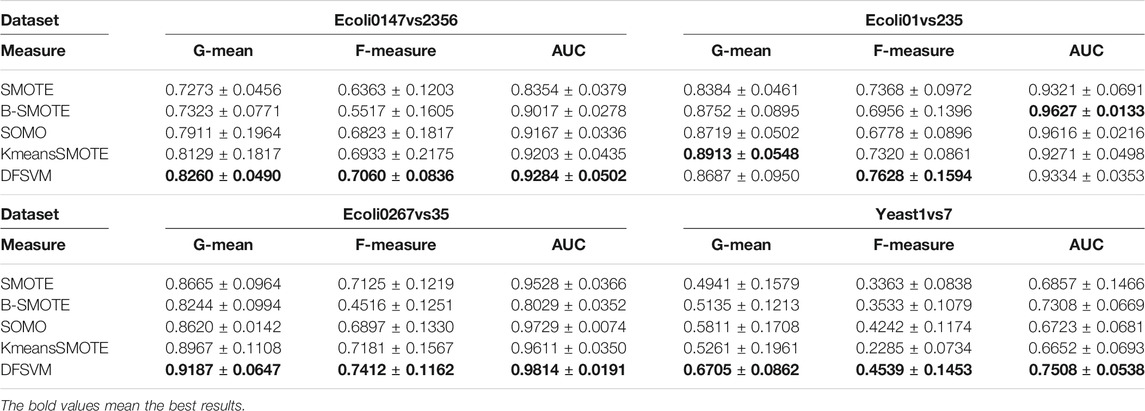
TABLE 5. The experimental results of different sampling methods.
Influence of Network Structure and Margin on the Performance of the Proposed Method
This subsection conducts comparative experiments on different network structures of DFSVM. First, we selected three Ecoli datasets and one Yeast dataset for experiments on different margins. In the experiments, the margin of triplet loss is taken from {0.1, 0.2, 0.3, 0.4, 0.5, 0.6, 0.7, 0.8, 0.9} and the number of neurons of the third hidden layer of the deep neural network is set to 8. The experimental results on the evaluation metrics are shown in Figure 6. The x-axis represents the values taken for different margins, and the y-axis represents the experimental result values for different metrics, such as G-mean, F-measure and AUC. It can be seen that in the same dataset, different metrics have the same trend with margin. However, the tendency of variation is not the same among different datasets. On the Ecoli0267vs35 dataset, the best classification results are obtained when the margin is 0.3. However, on the Ecoli01vs235 dataset, the classification is worse when the margin is 0.3. For all datasets, a smaller margin gives a better imbalanced classification result. Smaller margins make it easier for the triplet loss to converge to zero, but too small margins can make it difficult for the model to distinguish similar features. We also conducted comparison experiments on DFSVM with different hidden layer sizes. The fixed margin size in the experiments is 0.2, and the number of neurons in the third hidden layer of the neural network is taken from {2,4,6,8,10,12}. The experimental results under different evaluation metrics are shown in Tables 6–8. We selected three Ecoli datasets and three Yeast datasets, and the best results are bolded. It can be found that for the Ecoli dataset, the better results are achieved when the number of nodes is 6 and 8. For the Yeast dataset, better classification quality is achieved at node numbers of 8 and 10. In addition, it can be seen from Table 2 that the features extracted by the deep neural network are more beneficial for classification in comparison with other FSVM-based methods.
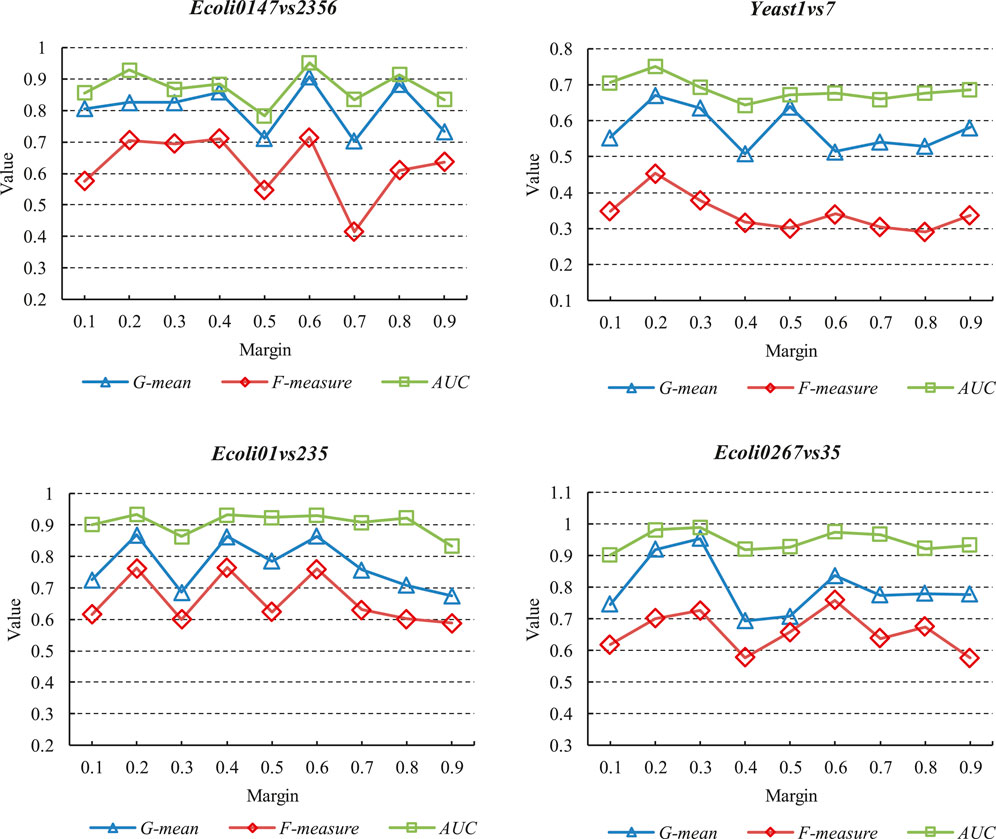
FIGURE 6. Classification results under different margins.
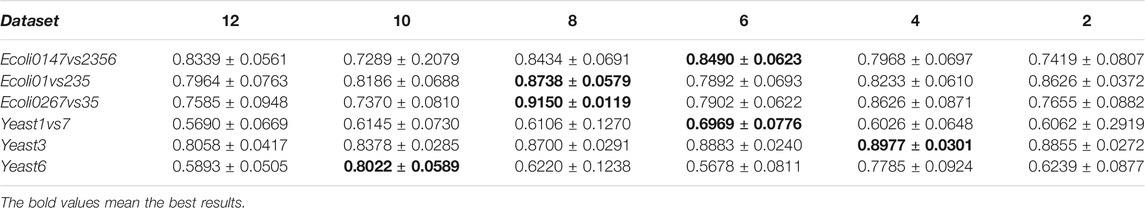
TABLE 6. Classification results of DFSVM with different number of neurons for G-mean.
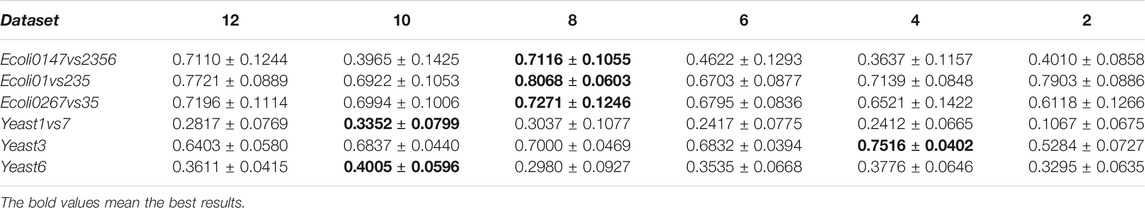
TABLE 7. Classification results of DFSVM with different number of neurons for F-measure.
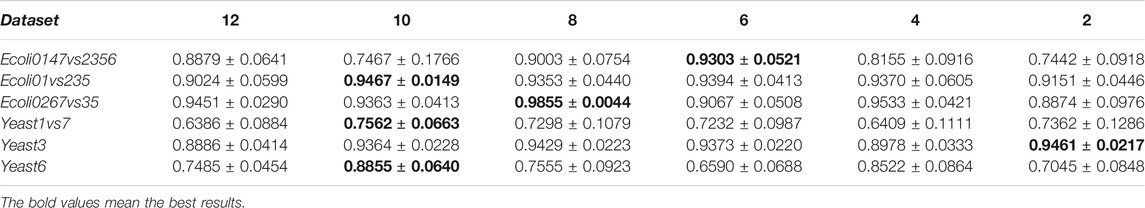
TABLE 8. Classification results of DFSVM with different number of neurons for AUC.
Conclusion
This paper proposes an imbalanced classification method combined with deep neural networks, DFSVM. In order to obtain features with intra-class similarity and inter-class discrimination, a deep neural network is trained using triplet loss function and Gumbel activation function to obtain the deep feature representation. The results of the experiments show that the proposed feature extraction method has good information acquisition ability and can effectively distinguish different classes. To balance the data distribution, a random feature sampling algorithm based on the center of class is used in the minority samples to maintain the diversity of the minority class samples. Compared with other sampling algorithms, it can effectively avoid overfitting and improve the generalization performance of the model. Fuzzy support vector machine has provided a higher misclassification loss for the minority class, and it enhanced the classification performance of the algorithm for the minority class. According to the experimental results, it can be found that the proposed DFSVM has good classification results on evaluation metrics: G-means, F-measure, and AUC. In future work, more efficient network structures and more robust feature extractors can be used to provide valid measures for imbalanced classification.
Data Availability Statement
Publicly available datasets were analyzed in this study. This data can be found here: https://sci2s.ugr.es/keel/imbalanced.php.
Author Contributions
K-FW carried out all the data collection and drafted the manuscript. JA designed the study and revised the manuscript. ZW provided statistical analysis ideas for this work, provided methods for over visualization of the results and revised the manuscript. CC and MC performed the data analysis. X-HM and H-QB critically reviewed the article. All authors approved the final manuscript.
Funding
This work was supported in part by the National Natural Science Foundation of China (61703279, 51775385); in part by the Shanghai Industrial Collaborative Science and Technology Innovation Project (2021-cyxt2-kj10); in part by the Shanghai Municipal Science and Technology Major Project (2021SHZDZX0100) and the Fundamental Research Funds for the Central Universities; and in part by Innovation Program of Shanghai Municipal Education Commission (202101070007E00098). The authors are grateful for the efforts from their colleagues in Sino-German Center of Intelligent Systems, Tongji University.
Conflict of Interest
The authors declare that the research was conducted in the absence of any commercial or financial relationships that could be construed as a potential conflict of interest.
Publisher’s Note
All claims expressed in this article are solely those of the authors and do not necessarily represent those of their affiliated organizations, or those of the publisher, the editors and the reviewers. Any product that may be evaluated in this article, orclaim that may be made by its manufacturer, is not guaranteed or endorsed by the publisher.
References
Batuwita, R., and Palade, V. (2010). FSVM-CIL: Fuzzy Support Vector Machines for Class Imbalance Learning. IEEE Trans. Fuzzy Syst. 18, 558–571. doi:10.1109/TFUZZ.2010.2042721
Bhattacharya, S., Rajan, V., and Shrivastava, H. (2017). “ICU Mortality Prediction: a Classification Algorithm for Imbalanced Datasets,”. Proc. Of AAAI Artif. Intell. (San Francisco, CA, United States, 31, 1288–1294.
Chawla, N. V., Bowyer, K. W., Hall, L. O., and Kegelmeyer, W. P. (2002). SMOTE: Synthetic Minority Over-sampling Technique. J. Artif. Intelligence Res. 16, 321–357. doi:10.1613/jair.953
Chawla, N. V., Lazarevic, A., Hall, L. O., and Bowyer, K. W. (2003). “SMOTEBoost: Improving Prediction of the Minority Class in Boosting,” in Proceeding of the European conf. on PKDD, Berlin, Heidelberg (Springer), 107–119.
Chun-Fu Lin, C. F., and Sheng-De Wang, S. D. (2002). Fuzzy Support Vector Machines. IEEE Trans. Neural Netw. 13, 464–471. doi:10.1109/72.991432
Cooray, K. (2010). Generalized Gumbel Distribution. J. Appl. Stat. 37, 171–179. doi:10.1080/02664760802698995
Douzas, G., Bacao, F., and Last, F. (2018). Improving Imbalanced Learning through a Heuristic Oversampling Method Based on K-Means and SMOTE. Inf. Sci. 465, 1–20. doi:10.1016/j.ins.2018.06.056
Douzas, G., and Bacao, F. (2017). Self-Organizing Map Oversampling (SOMO) for Imbalanced Data Set Learning. Expert Syst. Appl. 82, 40–52. doi:10.1016/j.eswa.2017.03.073
Du, R., Santi, P., Xiao, M., Vasilakos, A.V., and Fischione, C. (2019). The Sensable City: A Survey on the Deployment and Management for Smart City Monitoring. IEEE Commun. Surv. Tut. 21, 1533–1560. doi:10.1109/COMST.2018.2881008
Fathy, Y., Jaber, M., and Brintrup, A. (2020). Learning with Imbalanced Data in Smart Manufacturing: a Comparative Analysis. IEEE Access 9, 2734–2757.
Haibo He, H., Yang Bai, Y., Garcia, E. A., and Shutao Li, S. (2008). ADASYN: Adaptive Synthetic Sampling Approach for Imbalanced Learning. Int. Jt. Conf. Neural Netw. 1322–1328. doi:10.1109/IJCNN.2008.4633969
Han, H., Wang, W.-Y., and Mao, B.-H. (2005). “Borderline-SMOTE: a New Over-sampling Method in Imbalanced Data Sets Learning,” in Proceeding of the Int. conf. on intelligent computing, Heidelberg (Springer), 878–887. doi:10.1007/11538059_91
He, K., Zhang, X., Ren, S., and Sun, J. (2016). “Deep Residual Learning for Image Recognition,” in Proceeding of the IEEE Conf. on CVPR., Las Vegas, NV, United States, June 2016 (IEEE), 770–778. doi:10.1109/CVPR.2016.90
Jiang, C., Song, J., Liu, G., Zheng, L., and Luan, W. (2018). Credit Card Fraud Detection: A Novel Approach Using Aggregation Strategy and Feedback Mechanism. IEEE Internet Things J. 5, 3637–3647. doi:10.1109/jiot.2018.2816007
Kang, Q., Chen, X., Li, S., and Zhou, M. (2017). A Noise-Filtered Under-sampling Scheme for Imbalanced Classification. IEEE Trans. Cybern. 47, 4263–4274. doi:10.1109/TCYB.2016.2606104
Kang, Q., Shi, L., Zhou, M., Wang, X., Wu, Q., and Wei, Z. (2018). A Distance-Based Weighted Undersampling Scheme for Support Vector Machines and its Application to Imbalanced Classification. IEEE Trans. Neural Netw. Learn. Syst. 29, 4152–4165. doi:10.1109/TNNLS.2017.2755595
Kang, Q., Yao, S., Zhou, M., Zhang, K., and Abusorrah, A. (2021). Effective Visual Domain Adaptation via Generative Adversarial Distribution Matching. IEEE Trans. Neural Netw. Learn. Syst. 32, 3919–3929. doi:10.1109/TNNLS.2020.3016180
Krizhevsky, A., Sutskever, I., and Hinton, G. E. (2012). Imagenet Classification with Deep Convolutional Neural Networks. Adv. Neural Inf. Process. Syst. 25, 1097–1105.
Laurikkala, J. (2001). “Improving Identification of Difficult Small Classes by Balancing Class Distribution,” in Conf. Artificial Intelligence in Medicine in Europe, Heidelberg, June 2001 (Springer), 63–66. doi:10.1007/3-540-48229-6_9
Li, H., and Wong, M.-L. (2015). “Financial Fraud Detection by Using Grammar-Based Multi-Objective Genetic Programming with Ensemble Learning,” in Proceeding of the 2015 IEEE Congress on Evolutionary Computation, Sendai, Japan, May 2015 (IEEE), 1113–1120. doi:10.1109/CEC.2015.7257014
Li, X., Li, W., Yang, Q., Yan, W., and Zomaya, A. Y. (2020). Edge-Computing-Enabled Unmanned Module Defect Detection and Diagnosis System for Large-Scale Photovoltaic Plants. IEEE Internet Things J. 7, 9651–9663. doi:10.1109/jiot.2020.2983723
Loey, M., Smarandache, F., and M. Khalifa, N. E. (2020). Within the Lack of Chest COVID-19 X-ray Dataset: a Novel Detection Model Based on GAN and Deep Transfer Learning. Symmetry 12, 651. doi:10.3390/sym12040651
Mathew, J., Luo, M., Pang, C. K., and Chan, H. L. (2015). Kernel-based SMOTE for SVM Classification of Imbalanced Datasets. IECON 2015-41st Annual Conference of the IEEE Industrial Electronics Society, Nov. 2015, Yokohama, Japan, IEEE, 1127–1132. doi:10.1109/IECON.2015.7392251
Mathew, J., Pang, C. K., Luo, M., and Leong, W. H. (2018). Classification of Imbalanced Data by Oversampling in Kernel Space of Support Vector Machines. IEEE Trans. Neural Netw. Learn. Syst. 29, 4065–4076. doi:10.1109/TNNLS.2017.2751612
Ng, W. W. Y., Zeng, G., Zhang, J., Yeung, D. S., and Pedrycz, W. (2016). Dual Autoencoders Features for Imbalance Classification Problem. Pattern Recognition 60, 875–889. doi:10.1016/j.patcog.2016.06.013
Romani, M., Vigliante, M., Faedda, N., Rossetti, S., Pezzuti, L., Guidetti, V., et al. (2018). Face Memory and Face Recognition in Children and Adolescents with Attention Deficit Hyperactivity Disorder: A Systematic Review. Neurosci. Biobehavioral Rev. 89, 1–12. doi:10.1016/j.neubiorev.2018.03.026
Schroff, F., Kalenichenko, D., and Philbin, J. (2015). “Facenet: A Unified Embedding for Face Recognition and Clustering,” in Proceeding of the 2015 IEEE Conference on Computer Vision and Pattern Recognition (CVPR), Boston, MA, United States, June 2015 (IEEE), 815–823. doi:10.1109/CVPR.2015.7298682
Shi, X., Kang, Q., An, J., and Zhou, M. (2022). Novel L1 Regularized Extreme Learning Machine for Soft-Sensing of an Industrial Process. IEEE Trans. Industr. Inform. 18, 1009–1017. doi:10.1109/TII.2021.3065377
Shuo Wang, S., and Xin Yao, X. (2013). Using Class Imbalance Learning for Software Defect Prediction. IEEE Trans. Rel. 62, 434–443. doi:10.1109/TR.2013.2259203
Tao, X., Li, Q., Ren, C., Guo, W., He, Q., Liu, R., et al. (2020). Affinity and Class Probability-Based Fuzzy Support Vector Machine for Imbalanced Data Sets. Neural Networks 122, 289–307. doi:10.1016/j.neunet.2019.10.016
Wang, S., and Yao, X. (2009). “Diversity Analysis on Imbalanced Data Sets by Using Ensemble Models,” in Proceeding of the 2015 2009 IEEE Symposium on Computational Intelligence and Data Mining, Nashville, TN, USA, April 2009 (IEEE), 324–331. doi:10.1109/CIDM.2009.4938667
Wang, X., Kang, Q., Zhou, M., Pan, L., and Abusorrah, A. (2021). Multiscale Drift Detection Test to Enable Fast Learning in Nonstationary Environments. IEEE Trans. Cybern. 51, 3483–3495. doi:10.1109/TCYB.2020.2989213
Yao, H., Fu, D., Zhang, P., Li, M., and Liu, Y. (2018). MSML: A Novel Multilevel Semi-supervised Machine Learning Framework for Intrusion Detection System. IEEE Internet Things J. 6, 1949–1959. doi:10.1109/JIOT.2018.2873125
Ye, X., Li, H., Imakura, A., and Sakurai, T. (2020). An Oversampling Framework for Imbalanced Classification Based on Laplacian Eigenmaps. Neurocomputing 399, 107–116. doi:10.1016/j.neucom.2020.02.081
Keywords: imbalance classification, deep neural network, fuzzy support vector machine, machine learning, oversampling
Citation: Wang K-F, An J, Wei Z, Cui C, Ma X-H, Ma C and Bao H-Q (2022) Deep Learning-Based Imbalanced Classification With Fuzzy Support Vector Machine. Front. Bioeng. Biotechnol. 9:802712. doi: 10.3389/fbioe.2021.802712
Received: 27 October 2021; Accepted: 20 December 2021;
Published: 21 January 2022.
Edited by:
Zhihua Cui, Taiyuan University of Science and Technology, ChinaReviewed by:
Sitanshu Sekhar Sahu, Birla Institute of Technology, Mesra, IndiaJun Meng, Dalian University of Technology, China
Lingpeng Meng, Shanghai Maritime University, China
Huakang Li, Xi’an Jiaotong-Liverpool University, China
Copyright © 2022 Wang, An, Wei, Cui, Ma, Ma and Bao. This is an open-access article distributed under the terms of the Creative Commons Attribution License (CC BY). The use, distribution or reproduction in other forums is permitted, provided the original author(s) and the copyright owner(s) are credited and that the original publication in this journal is cited, in accordance with accepted academic practice. No use, distribution or reproduction is permitted which does not comply with these terms.
*Correspondence: Zhen Wei, 815617087@qq.com