The effects of positive visualization with and without sound on sleep actigraphy measures in a small sample of tinnitus patients
 Jackie Spittal1
  Guy Warman
 Mithila Durai
 Grant D. Searchfield
- 1Department of Audiology, The University of Auckland, Auckland, New Zealand
- 2Department of Anaesthesiology, The University of Auckland, Auckland, New Zealand
- 3Eisdell Moore Centre, The University of Auckland, Auckland, New Zealand
Background: Tinnitus is a common oto-neurological disorder associated with sleep disturbances. This research explored visualization and visualization reinforced with nature sounds as an acute therapy for sleep disturbance in people with tinnitus.
Methods: Twelve adults with bothersome tinnitus and sleep disturbances participated in a randomized cross-over design in which measurements of tinnitus perception (rating scales), anxiety/depression (Hospital Anxiety and Depression Scale), attention (Attention and Performance Self-Assessment), and sleep quality (sleep diary and actigraphy—automated estimates of total sleep time, sleep onset latency, sleep fragmentation, and wake after sleep onset) were undertaken at baseline and repeated with therapy. The visualization task was 30 min in duration and was performed every night before sleep. The visualization with sound reinforcement task added nature sounds played overnight.
Results: Sleep onset latency analyzed using the sleep diary normalized actigraphy was significantly reduced with both interventions (visualization reduced by 60 min and visualization with sound reinforcement reduced by 70 min). None of the other sleep quality markers demonstrated a statistically significant change. Self-reported attention ability significantly improved with visualization. Of the participants, 90% were able to consistently complete actigraphy measures over the 3 weeks of the study, and 75% kept sleep diaries.
Conclusion: Sleep onset time was reduced with visualization.
1 Introduction
Sleep disturbances are experienced by 50%−77% of individuals with tinnitus (ear and head noise; Folmer and Griest, 2000). There is no cure for tinnitus; instead, therapies seek to reduce its effects, perceptions, or comorbidities. If sleep were to improve, so might tinnitus, and vice versa. A recent large cross-sectional study indicated that tinnitus is associated with self-reported delayed sleep onset (de Feijter et al., 2023).
Sound and positive visualization have been used as components of different therapies. Visualization, or “mental imagery” is a cognitive technique whereby the individual visualizes a mental image to achieve specific therapeutic outcomes (Sodergren, 1992). Visualization aims to reduce the significance of tinnitus and change negative associations by incorporating tinnitus into a more acceptable visuo-acoustic image (Andersson, 2002). Sound therapy may mask tinnitus, induce relaxation, or reduce attention to tinnitus, particularly in the absence of other sensory competition (e.g., when seeking sleep in the dark and near silence). There is some evidence that applying sound during sleep decreases tinnitus intensity and improves sleep quality (Handscomb, 2006). However, there is a need for further evidence of therapy effectiveness and modes of action.
The absence of tinnitus biomarkers means objective neurophysiological evidence for tinnitus treatment benefit is limited. The current gold-standard measures for assessing treatment efficacy are questionnaires, for example, the Tinnitus Functional Index (TFI; Meikle et al., 2012). Rating scales can be used for this purpose but have not been standardized. Psychoacoustic outcome measurements of tinnitus loudness are not strongly related to subjective improvements (Rabau et al., 2015). The TFI includes three questions about sleep, but direct measures of sleep may be useful adjuncts to ascertain the effects of tinnitus therapy. Sleep questionnaires and sleep diaries are widely used to measure subjective sleep quality and document outcomes in insomnia treatment studies (Morin, 2003). Questionnaires may measure the perceived severity of insomnia, interference with daily functioning, distress due to sleep disturbances, and/or etiological factors (Morin, 2003), for example, the Pittsburgh Sleep Quality Index (PSQI; Buysse et al., 1989). A typical sleep diary comprises entries for bedtime, sleep quality, sleep onset latency (SOL), and total sleep time (TST; Morin, 2003).
The recognized gold standard for objective sleep monitoring is polysomnography (PSG) (Blackwell et al., 2008). PSG involves the overnight monitoring of biophysical changes during sleep using EEG, electromyography, electro-oculography, electrocardiography, pulse oximetry, and numerous other measures. PSG is usually performed in a sleep laboratory and requires a multidisciplinary team. Consequently, it is expensive, labor-intensive, and intrusive and may not be reflective of sleep in the domestic environment.
Actigraphy has become a popular, cost-effective tool in sleep research (Fekedulegn et al., 2020). Actigraphy estimates periods of wakefulness and sleep based on the timing, intensity, and duration of movements. Movement is detected by a piezoelectric accelerometer, typically worn on the wrist. Actigraphic analysis provides an output of several sleep parameters, including SOL, TST, sleep fragmentation (the amount of movement or restlessness in a sleep period), and wake after sleep onset (the number of times awake in the night). A number of studies have proven the validity of actigraphy for diagnosing sleep disorders and determining the impact of particular interventions; a fulsome review of actigraphy is limited in this brief report, and readers are referred to a review of this method (Fekedulegn et al., 2020).
The current study was undertaken to explore if the sleep onset delays reported with tinnitus could be improved by the use of visualization and/or visualization with sound reinforcement. An additional goal was to inform method selection for future tinnitus therapy and sleep trials.
2 Methods and materials
The research was approved by the University of Auckland Human Participants Ethics Committee (Approval no. 19629). Written, informed consent was obtained according to the Declaration of Helsinki.
2.1 Participants
Research candidates were recruited from a tinnitus research volunteer database. Inclusion criteria were self-reported bothersome tinnitus resulting in sleep disturbance, no diagnosed sleep disorder, fluency in English, age 18 years or older, and hearing better than severe loss. Twenty potential participants were excluded based on these criteria; there were 14 eligible participants. Two participants withdrew from the study. Twelve participants, seven women and five men (mean age 64.5 years, SD = 14.1), completed the study.
2.2 Study design
This was an unblinded, randomized crossover design. Participants each received a sequence of a baseline and two treatment conditions. Following audiometry and baseline questionnaires, baseline actigraphy measurements were taken over 2 weeks before the interventions. Participants were randomly assigned into two groups, and the order in which they received the interventions differed. Each treatment condition was 1 week in duration, during which actigraphy was undertaken throughout, and outcome questionnaires were administered weekly.
2.3 Audiometry
Pure-tone air conduction audiometry (250–16000 Hz) was conducted using a Grason Stadler (GSI-61) or a MedRx® (AVANT A2D+). Tympanometry was performed on all participants using a Grason-Stadler TympStar immittance meter.
2.4 Questionnaires
The TFI (Meikle et al., 2012) was completed by participants before the first session (Meikle et al., 2012). The Tinnitus Sample Case History Questionnaire (TSCHQ) (Langguth et al., 2007) was completed at the first session to obtain the baseline tinnitus profiles of each participant. The PSQI (Buysse et al., 1989) was used to measure the patterns and quality of sleep. Before and after each intervention period, participants completed the Tinnitus Severity Numeric Scales (TSNS; The Tinnitus Severity, 2009), a series of six rating scales provided to participants at the first session and readministered after each of the two treatment conditions.
The Sleep and Tinnitus Numeric Scales (STNS; Appendix 1) is an 11-item (10-point Likert scale) questionnaire designed to assess how loud and annoying tinnitus is before going to sleep, during sleep, when first waking up, and during the day. The Attention and Performance Self-Assessment (APSA; Bankstahl and Görtelmeyer, 2013) and the Hospital Anxiety and Depression Scale (HADS; Zigmond and Snaith, 1983) were completed by participants at the first session and readministered after each of the two treatment conditions.
2.5 Sleep diary
Each participant was provided with a sleep diary to record their sleep patterns each day of the 28-day study period. The sleep diary recorded what time the participant went to bed, what time they went to sleep (“lights out” with the intention of going to sleep), and what time they woke up each day. Participants were asked to estimate these times and complete the diary first thing in the morning for the preceding night's sleep.
2.6 Actigraphy
Wrist actigraphy was used to objectively measure various markers of sleep quality. Each participant was provided with an Actiwatch 2® (Mini-Mitter Co., Inc./Respironics Inc., Bend, Oregon, USA) actigraphy device. These devices were worn continuously for 28 days, except during periods of water immersion, such as bathing. A 60-s epoch length was chosen to preserve battery life as well as provide activity data with adequate resolution for circadian rhythm assessment. The accelerometer sampling frequency was 32 Hz, with a sensitivity of 0.025 g-force and a bandwidth of 0.35–7.5 Hz. Respironics Actiware version 6.0.9® software (Mini-Mitter Co., Inc., Bend, Oregon, USA) was used to process the data. Two methods were used for analyzing actigraphy: (1) automatic analysis and (2) rest intervals from the accompanying sleep diaries were manually entered to normalize the data, as the automatic analysis may incorrectly identify inactivity as sleep (for details, see Respironics Actiware® and Actiware® CT software manual).
2.7 Sound therapy equipment
Participants were provided with a Transcend® MP330 digital music player (8GB capacity). Six sound files (source: tinnitustunes.com) were uploaded onto each device: Forest by the Sea, Gentle Rain, Roaring Fire, Roaring Surf, Ocean Roar, and Yangtze Delta. Participants were provided with a Pudney or JHDS (JH30C16C) Pillow Speaker with a 3.5-mm Mono Plug. The pillow speakers were small and flat, allowing placement underneath a pillow. Participants were provided with an orientation on the use of the MP3 players and speakers.
2.8 Interventions
The visualization intervention involved finding a quiet and comfortable place to visualize for 30 min every night before sleep. The procedure started with a deep breathing exercise. Participants were then instructed to create an imaginary scene in their minds and engage as many senses as they could, such as sound, sight, touch, taste, and smell. Participants were instructed not to visualize anything negative or requiring problem-solving, work, or effort. For visualization with sound, participants were instructed to incorporate their choice of a nature sound while carrying out visualization as described earlier. The nature sounds were then presented continuously throughout subsequent sleep via the pillow speaker. Participants were instructed to use the nature sounds they found most calming or enjoyable. Written instructions were provided for both interventions.
2.9 Data analysis
The data were analyzed using GraphPad Prism 8 software. The Shapiro–Wilk test of normality determined that the data were normally distributed. Repeated measures of ANOVA and Tukey's multiple comparisons tests were undertaken as appropriate. Epsilon (ε), as calculated according to Greenhouse and Geisser, was used. Sample sizes for future research were calculated using the mean and the standard deviation for total sleep time (actigraphy and actigraphy normalized to sleep diary results) between baseline and visualization with sound reinforcement obtained using actigraphy. The effect size was calculated using an online calculator (https://lbecker.uccs.edu). Cohen's d was converted to Cohen's f , d = 2f , and the sample size was determined using G*Power (version 3.1.9.6, repeated measures ANOVA 1 group, 2 measurements, error = 0.05, power = 0.95, correlation between measures = 0.5, and non-sphericity correction = 1).
3 Results
3.1 Participant characteristics
Individual participant characteristics are presented in Table 1. The average tinnitus duration was 16.3 years (SD = 23.1). The mean TFI score was 54 (SD = 25.6). The mean global PSQI score of the participant sample was 7.6 (SD = 4.1). The average audiogram was a symmetrical mild sloping to moderate sensorineural hearing loss.
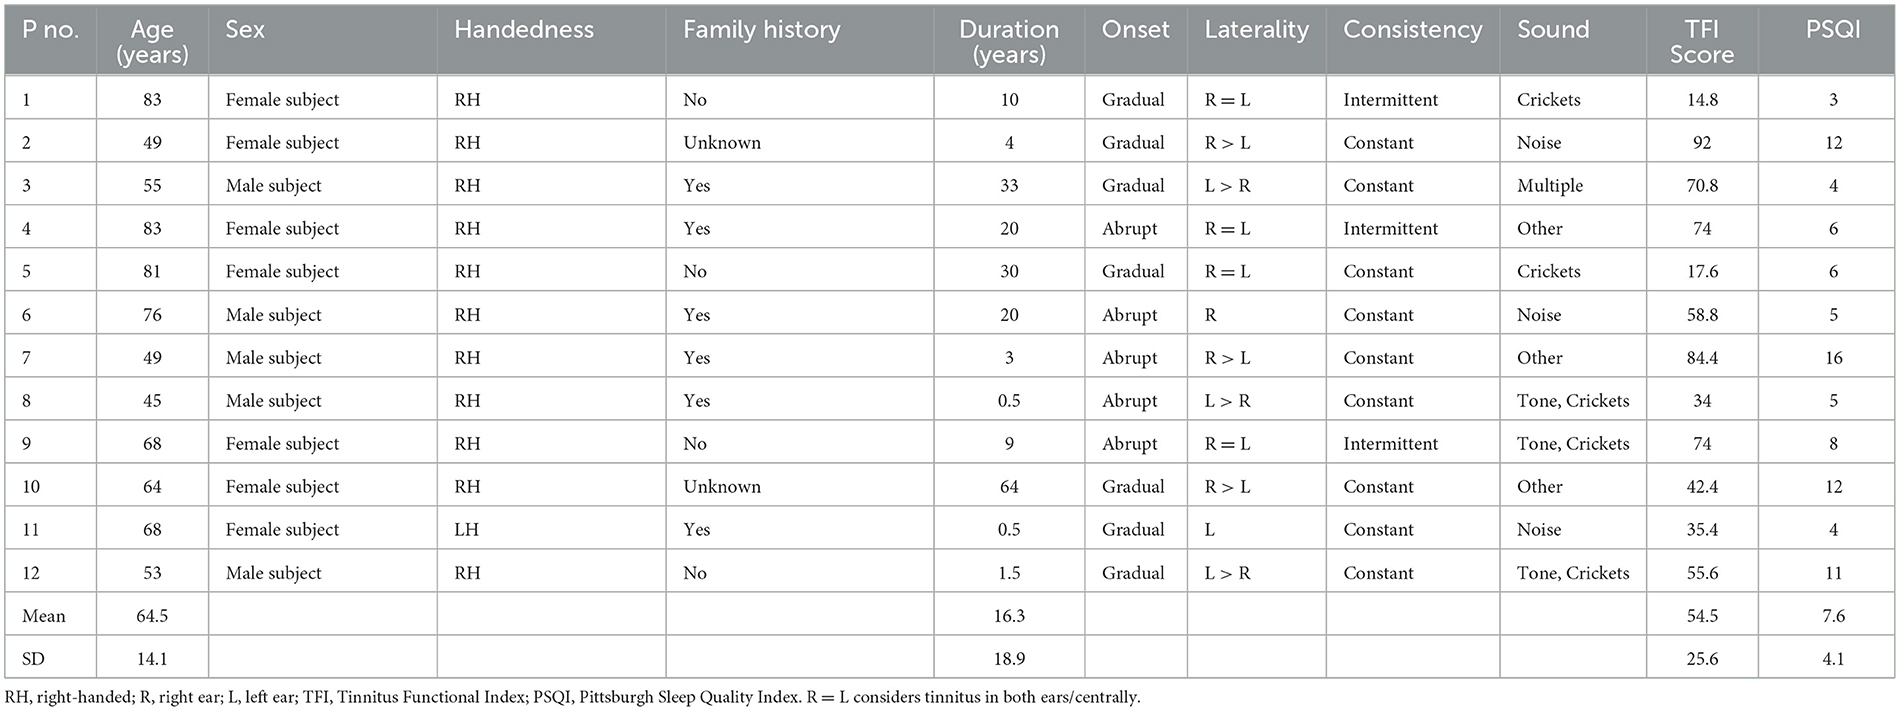
Table 1. Profile of study participants.
3.2 Outcomes with interventions
The change in all outcome measures with interventions is shown in Table 2. Data from two participants was removed for the APSA analysis due to having 10% or more missing questionnaire items. One participant's actigraphy data were not usable. Two participants' sleep diaries contained insufficient usable data to be analyzed.
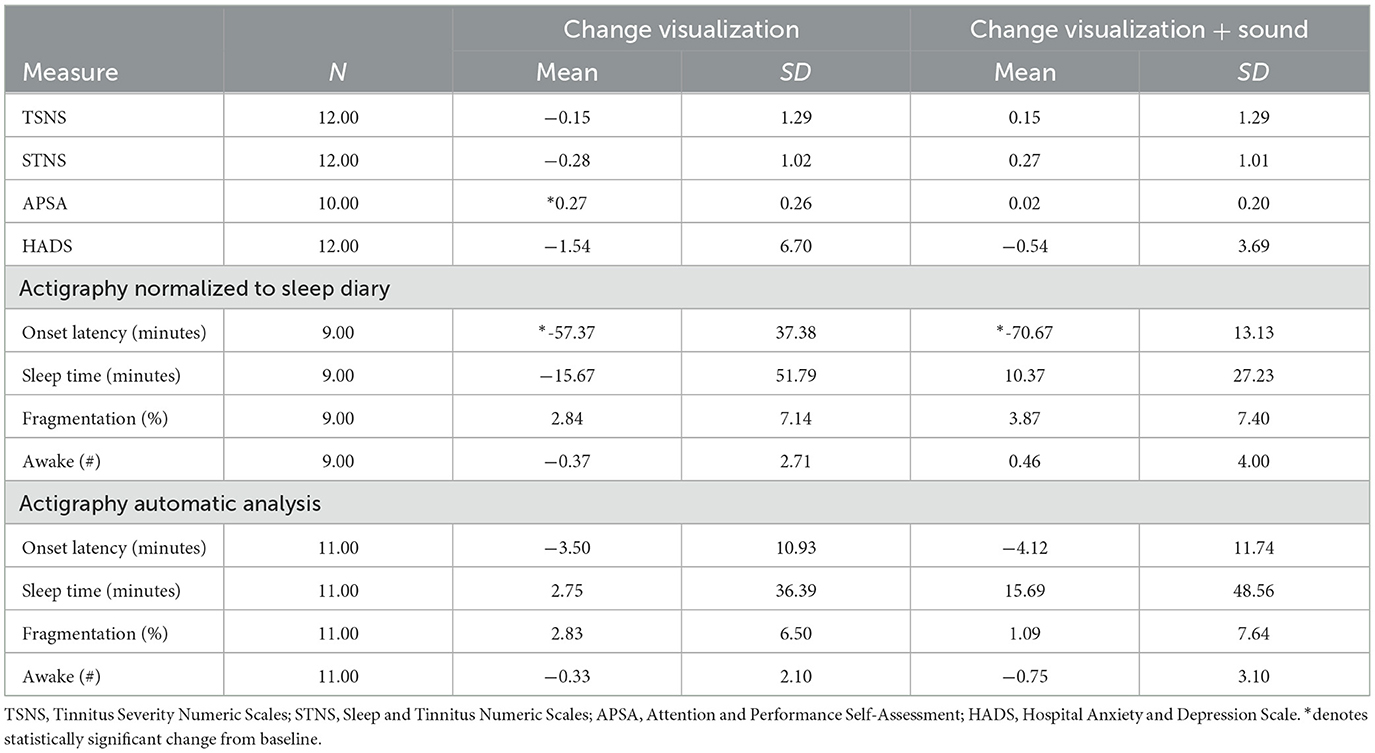
Table 2. Study outcome measures with interventions.
A repeated measures ANOVA found no statistically significant difference between baseline, post-visualization, and visualization with sound for the TSNS, STNS, and HADS. A significant treatment effect on the APSA was found [F(1.76, 15.84) = 8.75, p = 0.004]. Tukey's test of pairwise comparisons showed a significant decrease in APSA score from baseline (M = 1.71, SD = 0.52) and after visualization (M = 1.44, SD = 0.49), p = 0.025, but not for visualization with sound (M = 1.68, SD = 0.45). There was a significant difference between the treatment conditions, p = 0.012 (Figure 1).
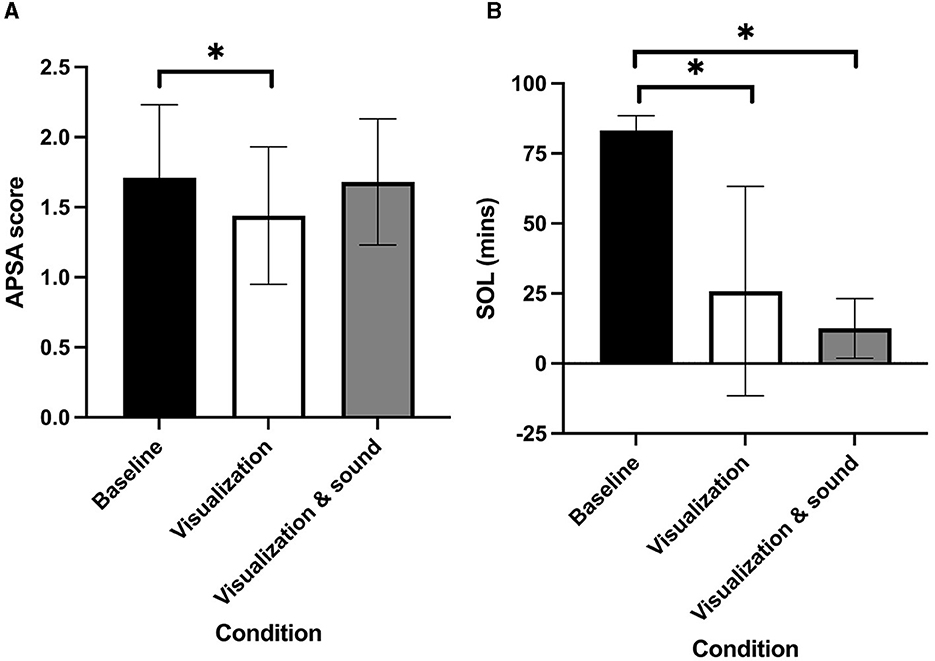
Figure 1. (A) Attention and Performance Self-Assessment score. (B) Sleep onset latency for each condition (error bars are +/– 1 SD; *denotes statistically significant change from baseline).
For sleep diary normalized actigraphy results, a repeated measures ANOVA found a significant main effect of condition, F(1.36, 43.50) = 7.97, p = 0.004, and a condition by measure interaction [F(6, 64) = 9.49, p < 0.001]. Tukey's test of pairwise comparisons showed a significant decrease in onset latency from baseline (M = 83.21, SD = 5.27) after visualization (M = 25.84, SD = 37.42), p = 0.004, and visualization with sound (M = 12.54, SD = 10.66), p < 0.001, but not between interventions (Figure 1). There were no other differences between baseline, post-visualization, and visualization with sound for the actigraphy measures. There was a difference between the sleep diary normalized actigraphy and automatic total sleep time and a large difference in the onset latency results. After excluding the two participants from the automatic SOL who were excluded from the normalized data set, the mean SOL difference with baseline remained similar (visualization n = 11, −3.50; n = 9, −4.73; visualization with sound n = 11, −4.12; n = 9, −3.02), indicating that the difference with sleep diary normalized values is not due to the sample.
To estimate sample size for future research, a power analysis was undertaken using the sleep duration difference between baseline and visualization with sound. For sleep diary normalized actigraphy (10.31 min), Cohen's d = 0.19, a small effect, was calculated. This change would require a sample of 362 participants for statistical significance. For automatic actigraphy, the effect (15.69 min) was very slightly larger, Cohen's d = 0.23, requiring a sample size of 248 participants for a predicted difference in sleep duration.
4 Discussion
This exploratory study investigated sleep patterns in a small group of tinnitus sufferers with two interventions: (1) visualization and (2) visualization paired with self-selected nature sounds. Actigraphy was used to objectively measure patterns of sleep. Repeated measures of ANOVA revealed that visualization and visualization with sound significantly reduced SOL from baseline in actigraphy (corrected for self-report from sleep diaries). This result indicates that the interventions aided in falling asleep in the short term within the participant sample. This finding was expected as mental imagery techniques have been shown to reduce SOL via mechanisms of attention diversion and reducing pre-sleep cognitive activity, such as negative intrusive thoughts (Harvey and Payne, 2002). A reduction in SOL is corroborative with reports of participants falling asleep prior to completing 30 min of the visualization exercises. The result is also relevant for the target population, as having tinnitus is associated with a longer self-reported SOL (de Feijter et al., 2023).
None of the other markers of sleep quality showed any statistically significant changes after visualization, indicating that visualization therapy was ineffective at improving total sleep and sleep fragmentation in the short term. This was unexpected, as imagery has also been shown to promote these markers of sleep quality through similar mechanisms (Loft and Cameron, 2013). However, this finding is consistent with the Standards of Practice Committee of the American Academy of Sleep Medicine (Morgenthaler et al., 2006), which reports that there is insufficient evidence for imagery training to be an option as a single therapy for insomnia. Sound with visualization had limited additional benefit above visualization alone, although the mean time to sleep onset was 10 min shorter with sound. Visualization did not significantly reduce tinnitus perception, as measured by the TSNS and STNS. This finding was unexpected due to previous studies reporting reductions in tinnitus perception following visualization therapy (Henry and Wilson, 1998). It was hypothesized that the interventions would elicit improvements in various markers of sleep quality in comparison to baseline.
Actigrahy use in this population was demonstrated to be plausible. Over 4 weeks, 90% of participants completed regular use and provided data that could be analyzed. This rate was higher than the 75% completing a sleep diary; however, the sleep diary does appear to be an important component of the sleep analysis. The large difference in SOL between the two actigraphy analysis methods probably reflects the automatic method's failure to differentiate between being motionless (but awake) and being asleep. This weakness of actigraphy will also likely be present in the other measures, but it is less obvious in this data set. Using questionnaires and sleep diaries alone is limited by memory and psychological factors (Morin, 2003).
Other methodological learnings from this study surround the use of sound. A few participants reported that they were unable to hear the nature sounds sufficiently through the music player pillow speaker combination or that the player's battery ran out overnight. Feelings of stress and frustration due to the study equipment may have inhibited any potential changes in attention. Environmental sounds may enable participants to direct their auditory attention to exogenous/environmental auditory objects more easily, reducing tinnitus awareness and improving attention, but a few participants reported that nature sounds were too arousing.
The short duration, small sample, and crossover nature of the study may also explain the modest findings. The current study used a crossover design in which each participant received both treatments, the participants served as their own control. However, as there was no “wash-out” period between treatments, there was a possibility of “carryover” in the current study. The use of actigraphy and sleep diaries over 4 weeks is possible, as demonstrated in this study, but is demanding of participants. The crossover design was useful for determining feasibility because it required fewer participants and devices than a parallel group's design; however, more time was required by each participant to complete both interventions. If resources allowed, a parallel arm study with a longer intervention time would be preferable. The estimated sample size for a single-arm study to find a statistical difference in total sleep time, comparing baseline to intervention, would be over 250 participants.
5 Conclusion
Actigraphy and sleep diaries appear to be feasible methods to employ as part of trials evaluating tinnitus interventions. These are most likely best suited for short-term evaluations. Visualization and visualization were reinforced with a sound-reduced SOL, meaning that subjects with tinnitus fell asleep quicker than they had done at baseline. However, the effects of these interventions on other measures of sleep will require larger sample sizes. Additionally, improved methods of delivering sound during sleep are needed.
Data availability statement
The original contributions presented in the study are included in the article/Supplementary material, further inquiries can be directed to the corresponding author.
Ethics statement
The studies involving humans were approved by the University of Auckland Human Participants Ethics Committee. The studies were conducted in accordance with the local legislation and institutional requirements. The participants provided their written informed consent to participate in this study.
Author contributions
JS: Data curation, Formal analysis, Funding acquisition, Investigation, Methodology, Writing – original draft, Writing – review & editing. GW: Formal analysis, Methodology, Resources, Software, Supervision, Writing – original draft, Writing – review & editing. MD: Methodology, Supervision, Writing – original draft, Writing – review & editing. GS: Conceptualization, Formal analysis, Methodology, Resources, Supervision, Writing – original draft, Writing – review & editing.
Funding
The author(s) declare financial support was received for the research, authorship, and/or publication of this article. JS received the Auckland University School of Population Health Student Research Funding.
Acknowledgments
The authors are grateful to the Anesthesiology Department, School of Medicine, University of Auckland, for the loan of actigraphy devices.
Conflict of interest
GS is a founder and has financial interest in Tinnitus Tunes and TrueSilence Therapeutics.
The remaining authors declare that the research was conducted in the absence of any commercial or financial relationships that could be construed as a potential conflict of interest.
The author(s) declared that they were an editorial board member of Frontiers, at the time of submission. This had no impact on the peer review process and the final decision.
Publisher's note
All claims expressed in this article are solely those of the authors and do not necessarily represent those of their affiliated organizations, or those of the publisher, the editors and the reviewers. Any product that may be evaluated in this article, or claim that may be made by its manufacturer, is not guaranteed or endorsed by the publisher.
Supplementary material
The Supplementary Material for this article can be found online at: https://www.frontiersin.org/articles/10.3389/fauot.2024.1358493/full#supplementary-material
References
Andersson, G. (2002). Psychological aspects of tinnitus and the application of cognitive–behavioral therapy. Clin. Psychol. Rev. 22, 977–990. doi: 10.1016/S0272-7358(01)00124-6
Bankstahl, U. S., and Görtelmeyer, R. (2013). Measuring subjective complaints of attention and performance failures-development and psychometric validation in tinnitus of the self-assessment scale APSA. Health Q. Life Outcomes 11, 1–12. doi: 10.1186/1477-7525-11-86
Blackwell, T., Redline, S., Ancoli-Israel, S., Schneider, J. L., Surovec, S., Johnson, N. L., et al. (2008). Comparison of sleep parameters from actigraphy and polysomnography in older women: the SOF study. Sleep 31, 283–291. doi: 10.1093/sleep/31.2.283
Buysse, D. J., Reynolds, I. I. I. C. F., Monk, T. H., Berman, S. R., and Kupfer, D. J. (1989). The pittsburgh sleep quality index: a new instrument for psychiatric practice and research. Psychiatr. Res. 28, 193–213. doi: 10.1016/0165-1781(89)90047-4
de Feijter, M., Oosterloo, B. C., Goedegebure, A., and Luik, A. I. (2023). The cross-sectional association between tinnitus and actigraphy-estimated sleep in a population-based cohort of middle-aged and elderly persons. Ear Hearing 44, 732. doi: 10.1097/AUD.0000000000001320
Fekedulegn, D., Andrew, M. E., Shi, M., Violanti, J. M., Knox, S., Innes, K. E., et al. (2020). Actigraphy-based assessment of sleep parameters. Annal. Work Exp. Health 64, 350–367. doi: 10.1093/annweh/wxaa007
Folmer, R. L., and Griest, S. E. (2000). Tinnitus and insomnia. Am. J. Otolaryngol. 21, 287–293. doi: 10.1053/ajot.2000.9871
Handscomb, L. (2006). Use of bedside sound generators by patients with tinnitus-related sleeping difficulty: Which sounds are preferred and why? Acta Oto-Laryngol. 126, 59–63. doi: 10.1080/03655230600895275
Harvey, A. G., and Payne, S. (2002). The management of unwanted pre-sleep thoughts in insomnia: distraction with imagery versus general distraction. Behav. Res. Ther. 40, 267–277. doi: 10.1016/S0005-7967(01)00012-2
Henry, J. L., and Wilson, P. H. (1998). An evaluation of two types of cognitive intervention in the management of chronic tinnitus. Behav. Ther. 27, 156–166. doi: 10.1080/02845719808408510
Langguth, B., Goodey, R., Azevedo, A., Bjorne, A., Cacace, A., Crocetti, A., et al. (2007). Consensus for tinnitus patient assessment and treatment outcome measurement: Tinnitus Research Initiative meeting, Regensburg, July, 2006. Prog. Brain Res. 166, 525–536. doi: 10.1016/S0079-6123(07)66050-6
Loft, M. H., and Cameron, L. D. (2013). Using mental imagery to deliver self-regulation techniques to improve sleep behaviors. Annal. Behav. Med. 46, 260–272. doi: 10.1007/s12160-013-9503-9
Meikle, M., Henry, J., Griest, S., Stewart, B., Abrams, H., McArdle, R., et al. (2012). The tinnitus functional index: development of a new clinical measure for chronic, intrusive tinnitus. Ear Hear. 33, 153–176. doi: 10.1097/AUD.0b013e31822f67c0
Morgenthaler, T., Kramer, M., Alessi, C., Friedman, L., Boehlecke, B., Brown, T., et al. (2006). Practice parameters for the psychological and behavioral treatment of insomnia: an update. An American academy of sleep medicine report. Sleep 29, 1415–1419. doi: 10.1093/sleep/29.11.1415
Morin, C. M. (2003). Measuring outcomes in randomized clinical trials of insomnia treatments. Sleep Med. Rev. 7, 263–279. doi: 10.1053/smrv.2002.0274
Rabau, S., Cox, T., Punte, A. K., Waelkens, B., Gilles, A., Wouters, K., et al. (2015). Changes over time of psychoacoustic outcome measurements are not a substitute for subjective outcome measurements in acute tinnitus. Eur. Arch. Oto-Rhino-Laryngol. 272, 573–581. doi: 10.1007/s00405-013-2876-3
Sodergren, K. M. (1992). “Guided imagery,” in Independent Nursing Interventions, ed M. Snyder (New York, NY: Wiley), 103–124.
Keywords: tinnitus, sleep, therapy, actigraphy, visualization, sound therapy
Citation: Spittal J, Warman G, Durai M and Searchfield GD (2024) The effects of positive visualization with and without sound on sleep actigraphy measures in a small sample of tinnitus patients. Front. Audiol. Otol. 2:1358493. doi: 10.3389/fauot.2024.1358493
Received: 19 December 2023; Accepted: 08 February 2024;
Published: 08 March 2024.
Edited by:
Katrin Reimann, Phillips Universität Marburg, GermanyReviewed by:
Antonio Vasco Oliveira, Polytechnic Institute of Porto, PortugalKurt Steinmetzger, Charité University Medicine Berlin, Germany
Copyright © 2024 Spittal, Warman, Durai and Searchfield. This is an open-access article distributed under the terms of the Creative Commons Attribution License (CC BY). The use, distribution or reproduction in other forums is permitted, provided the original author(s) and the copyright owner(s) are credited and that the original publication in this journal is cited, in accordance with accepted academic practice. No use, distribution or reproduction is permitted which does not comply with these terms.
*Correspondence: Grant D. Searchfield, g.searchfield@auckland.ac.nz