Characterization of Particle Size Distribution of Plasma Lipoproteins in Dairy Cattle Using High-Resolution Polyacrylamide Electrophoresis
 Marcos Jofree Duran
 Jasmine Kannampuzha-Francis
 Daryl Nydam
 Erica Behling-Kelly
- 1College of Agriculture and Life Sciences, Cornell University, Ithaca, NY, United States
- 2Department of Population Medicine and Diagnostic Sciences, Cornell University College of Veterinary Medicine, Ithaca, NY, United States
Plasma lipoproteins play critical roles in energy metabolism and inflammation. Concentrations of high-density lipoproteins (HDL) are linked to reproductive outcomes and milk yields in dairy cattle. Low-density lipoproteins (LDL), which are enzymatically formed in the blood from very low-density lipoproteins (VLDL) following secretion by the liver, have been used as a surrogate marker of liver function due to the rapid influx of circulating VLDL into the lactating mammary gland. In humans, the composition of plasma lipoproteins is reflected in lipoprotein particle size distribution, and both of these parameters are highly predictive of disease development and related health outcomes. Bovine HDL are overall larger, less dense particles compared to human HDL. Lipoprotein particle size distribution in both health and disease is understudied in the bovine. We hypothesize that a more detailed analysis of lipoproteins could hold diagnostic and/or prognostic value in the study of dairy cattle health and production. In this study, we took the first steps in this characterization and used a high-resolution polyacrylamide gel electrophoretic assay to better define LDL and HDL at the subfraction level in Holstein cows at different stages of lactation. We extensively characterized the lipoprotein particle size distribution in healthy lactating dairy cattle. We identified subfractions of LDL that were prominent only in the dry period and subfractions of HDL that were highest in cows during mid-lactation. Use of this method could be informative in the study of multiple herds and management strategies, including longitudinal evaluation of animals and production parameters.
Introduction
The links between intermediary metabolism, lipoprotein biology, and inflammation are evident across mammalian species. Serum lipoproteins have emerged as both biomarkers and modulators of the systemic inflammatory response in a number of species (Marik, 2006; Yilmaz and Senturk, 2007; Ilcol et al., 2009). In humans, a low plasma concentration of high-density lipoproteins (HDL) is a well-recognized risk factor for cardiovascular disease and predictive of poor outcomes in pneumonia and sepsis, whereas an increase in HDL affords a protective benefit in sepsis (Gruber et al., 2009; Otera et al., 2009; Constantinou et al., 2016). This functional relationship is due in part to HDL-mediated neutralization of bacterial lipopolysaccharide (LPS) (Eggesbø et al., 1996; Murch et al., 2007). Recent studies have shown that the sepsis-induced decline in HDL is countered by simultaneous increases in phospholipids in both low density lipoproteins (LDL) and very low density lipoproteins (VLDL) (Kitchens et al., 2003). This change in lipoprotein composition increases the binding of LPS to these lower density particles and is considered an adaptive attempt to maintain total serum LPS-neutralization capacity in the face of declining HDL concentration (Baumberger et al., 1991; Eggesbø et al., 1996; Levels et al., 2001; Kitchens et al., 2003). This example underscores the burgeoning interest in the study of lipoprotein composition. As many as 10 subfractions of HDL and 7 subfractions of LDL exist in humans (Hoefner et al., 2001; Garcia-Rios et al., 2014). Small and dense LDL particles are more susceptible to oxidation and are associated with an increased risk of cardiovascular disease and insulin resistance (Campos et al., 1992; Pichler et al., 2018). Quantification of these particles is incorporated into diagnostic algorithms for these diseases (Gardner et al., 1996; Vekic et al., 2007). Studies support the distribution of lipoprotein particle size across the major fractions as better predictors of disease risk than total concentrations (Movva and Rader, 2008; Garcia-Rios et al., 2014; Urbina et al., 2017). Subfractionation of the major lipoprotein classes and particle size distribution in veterinary species is understudied.
In the cow, the majority of cholesterol is transported on HDL, which depends on the production of apolipoprotein A1 by the liver. Cows carry a small amount of total cholesterol in LDL, which are the end product of VLDL metabolism (van Dijk and Wensing, 1989; Gurr et al., 2002). Similar to what has been reported in humans with inflammatory diseases, a decline in HDL is an early event in disease progression when calves are inoculated with Pasteurella haemolytica and bovine herpes virus-1 (Yamamoto and Katoh, 2000). Additionally, as cows near parturition and enter the period of greatest disease risk, serum HDL levels decrease (Turk et al., 2013; Kessler et al., 2014; Newman et al., 2016; Crociati et al., 2017). The cow's ability to rebound HDL levels to pre-partum values is associated with a decreased risk of disease development and higher milk production yields (Turk et al., 2008, 2013). Cows with HDL values above 89% at dry-off have improved reproductive performance (Crociati et al., 2017). In addition to being markers of metabolic status and health, lipoproteins can be modified by the diet. Feeding cows polyunsaturated lipids increases the proportion of larger-diameter HDL and these larger particles carry more beta carotene (Ashes et al., 1984). The impact the changes in size and composition have on bovine HDL immunomodulatory function is unknown.
In an earlier study, we identified an electronegative shift in HDL in a subset of cows nearing parturition, which may reflect a change in the composition and potentially the biological function of HDL (Newman et al., 2016). In that study, lipoproteins were separated by agarose gel electrophoresis, which does not resolve bovine HDL into multiple subfractions. Bovine HDL can be fractionated into 10 subspecies by isopycnic separation (Puppione et al., 1982). The separated denser particles are characterized by increased protein, phospholipids and higher ratio of esterified to unesterified cholesterol (Puppione et al., 1982). While this type of ultracentrifugation method is not practical for routine use or in studies evaluating a large number of animals, the presence of multiple HDL species in this method highlights the need for more detailed investigations of HDL and LDL particle size distribution and function in dairy cows.
The Lipoprint® assay is a high resolution polyacrylamide gel electrophoretic assay developed by Quantimetrix to facilitate rapid evaluation of human LDL and HDL at the subfraction level (Hoefner et al., 2001). We hypothesize that a more detailed analysis of lipoproteins could hold diagnostic and/or prognostic value in the study of dairy cattle health and production. In this study, we used the Lipoprint® method to extensively characterize the major plasma lipoprotein fractions and LDL and HDL subfractions in dairy cattle in different stages of lactation.
Methods
Animals
Holstein cows (n = 73) from a single privately-owned herd in upstate New York were used for this study Cows were in their first (n = 4), second (n = 10), third (n = 43), fourth (n = 15), or sixth lactation (n = 1). Samples were collected under an Institutional Animal Care and Use Committee protocol (2007-0146) for diagnostic laboratory test validation and maintenance. Days in milk (DIM) and pregnancy status were recorded for all cows. Samples were collected either before or after pregnancy determination. In addition, blood samples were collected from four first-lactation Holstein cows from the Cornell University herd in Ithaca NY that were confirmed to have clinical ketosis based on a plasma beta-hydroxybutyrate (BHB) concentration >10 mg/dL as determined by the Cornell Clinical Pathology Laboratory.
Blood Samples
Blood samples were collected by routine coccygeal vessel puncture into EDTA tubes, placed on ice, and transported to the laboratory within 6 h after collection. Plasma was separated by centrifugation (1500 × g) for 20 min at 4°C. The plasma samples were aliquoted and stored at −80°C until time of electrophoresis. With the exception of samples used to document the impact of prolonged storage, all samples were analyzed within 4 months of sample acquisition.
Lipoprint® Analysis
LDL and HDL Subfraction Electrophoresis
The plasma samples were analyzed using the Lipoprint® LDL and HDL Subfraction Kits (cat 48-7002 and 48-9002, respectively) by the Quantimetrix Corporation, according to the manufacturer's instructions. Each individual cow's sample or aliquot (for stability and precision studies) was briefly thawed at room temperature. After removal of storage buffer, 25 μL of plasma was loaded onto the provided pre-cast linear polyacrylamide gels. Loading gel (200 μl for the LDL gel, 300 μl for the HDL gel) was then added to the top of the gel tube. The tubes were covered, and inverted gently to mix the sample with the loading gel solution. The gels were photopolymerized using the provided lamp for 30 min. Samples were electrophoresed for 1 h at 3 milliamps per tube in the provided buffers (Tris hydroxymethyl aminomethane and boric acid). Samples were run in random sets of 10 singletons along with a human plasma control sample provided by the manufacturer (LipoSep®) for quality assurance purposes.
Densitometry
The tubes containing the electrophoresed and dyed lipoproteins were scanned in an ArtixScan M1 scanner that is provided with the Lipoprint® system (Microtek International Inc.). The scanner is equipped with a cold-cathode fluorescent lamp. The scanned files were analyzed using the Lipoprint® Software (LipowareTM) and the Image SXM program developed by Dr. Steve Barrett of the University of Liverpool (LDL Clinical: LW01-v.16-134). The intensity of each band was mathematically converted to a relative percentage value by the software. It should be noted that the software is automated for use with human samples and a known concentration of both LDL and HDL, which allows reporting of each subfraction in mg/dL. Routine biochemical tests to quantify human HDL and LDL do not transfer directly to bovine species. Therefore, a default value of 100 mg/dL was used as the total in the LDL and HDL electrophoretogram analyses. This allowed us to express each subfraction as a percentage of the total area under curve (AUC) as a raw value, rather than a converted concentration. If bands were too faint or run errors were detected by the software, band cut-offs were delineated using the manual measurement tool provided in the software package. This entailed visual inspection of the scanned gel image and corresponding software-generated plot to ensure the demarcation of both the beginning and end of each individual peak aligned with the stained band on the gel image. In the LDL electrophoresis; VLDL, intermediate density lipoprotein (IDL), LDL subfractions 1–7, and total HDL were demarcated and assigned a numerical AUC value. The HDL band is the reference point for band enumeration in the LDL fractionation. In the HDL electrophoresis; subfractions 1–9 were demarcated and assigned a numerical AUC value. Albumin is the reference point for band enumeration in the HDL fractionation.
Determination of Assay Precision and Sample Stability
Intra-assay coefficient of variation (%CV) was estimated from analysis of 10 replicates of a single representative sample (HDL >80%) evaluated in a single run of the assay. Inter-assay %CV was determined by analysis of the LipoSep® control material across 10 separate runs of the assay. The impact of sample storage was determined by analysis of sets of identical aliquots stored at −80°C for 1, 4, 12, 24, and 52 weeks from 5 randomly-selected animals. Both evaluations were done for LDL and HDL subfractionations.
Data Analysis
For evaluation of intra and inter-assay precision, the CVwas calculated for VLDL, IDL, total LDL, total HDL, and all detectable LDL and HDL subfractions in the representative bovine sample and LipoSep® control, respectively. A repeated measures ANOVA was performed to evaluate the impact of time of sample storage on the electrophoretograms in the bovine plasma samples; all factors aside from time were fixed. For analysis of individual cow samples, the cows were stratified by lactational stage as follows: fresh cows DIM 0–10 (n = 11); early lactation DIM 11–100 (n = 20), mid-lactation DIM 101–200 (n = 16), late lactation DIM 201–300 (n = 19), and dry cows (n = 7). All lipoprotein subfraction data sets were tested for normality using the Bartlett Variance test. This was followed by ANOVA if that subfraction's data fit normality, or the Kruskal-Wallis test if the Bartlett test indicated that the data did not show normality. P-values < 0.05 were considered to be of statistical significance for all tests. Cows were re-grouped as pregnant or not pregnant and a T-test applied for each subfraction. HDL fractions from ketotic cows (n = 4) were compared to the fractions from 4 cows within the fresh cow group, selected by the lowest DIM (2, 3, 3, and 4), using a T-test for each fraction. The fresh cows without ketosis had plasma BHB concentrations ≤ 10 mg/dL as determined by the Cornell Clinical Pathology Laboratory. All statistical analyses were performed using GraphPad Prism software v8.
Results
Assay Precision and Sample Stability
The intra-assay CVs (standard deviation/mean of 10 replicates derived from the AUCs) for HDL, LDL 1, and VLDL in the bovine plasma sample were 3.1, 20.6, and 7.6%, respectively. One of the internal replicates had an LDL 2 value of 1%.The remaining replicates did not show detectable levels of LDL 2. In 10 replicate runs of a single bovine sample in the HDL fractionation, intra-assay CVs were as follows; HDL large particles 3.3%, intermediate-sized HDL 9.9%. Small HDL particles were not detected. Inter-assay variability for the LDL electrophoresis in analysis of the LipoSep® control was similar across the fractions, with a mean CV across all fractions of 12.7%. The lowest variability was in the HDL fraction (CV 2.8%) and highest in the LDL 3 fraction (27.2%). Samples were stable (P > 0.99) at −80°C for up to 52 weeks statistically, but subjective changes are evident between 24 and 52 weeks (Figure 1). Manufacturer provided guidelines recommend cryostorage, therefore warmer storage temperatures were not evaluated.
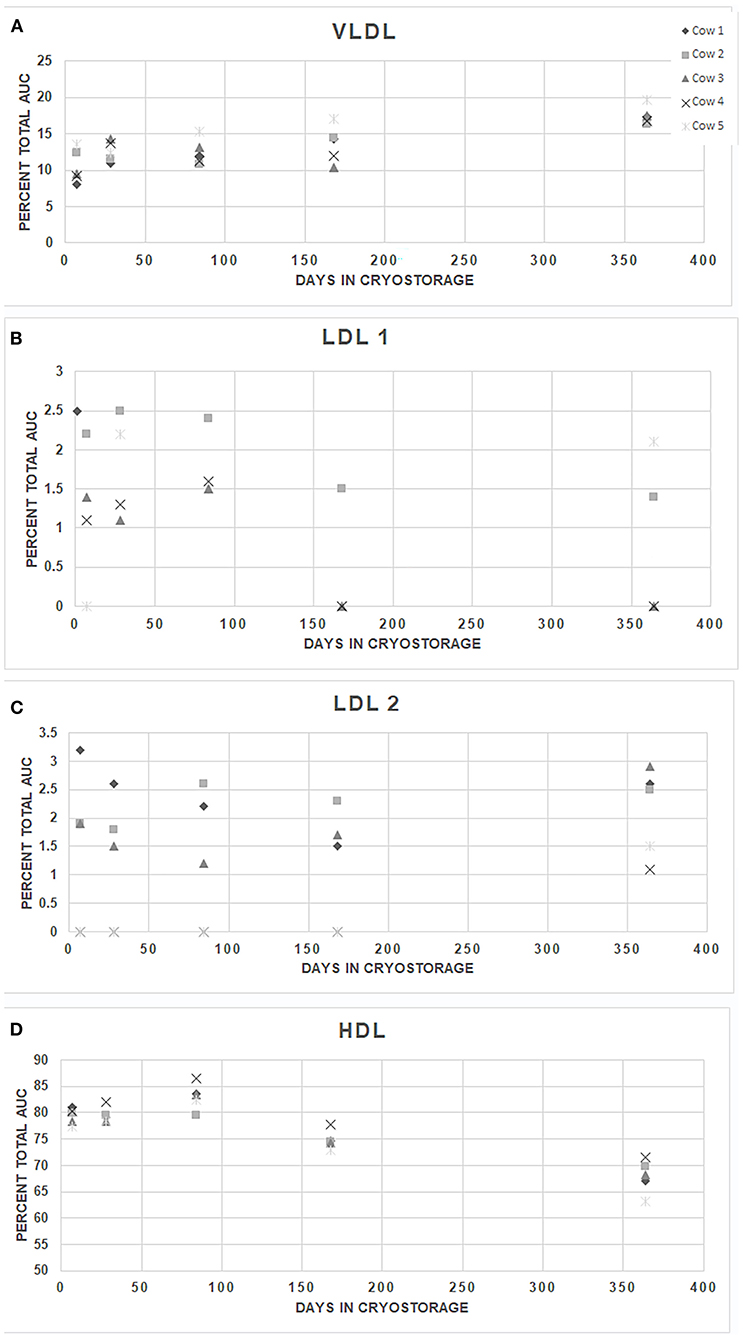
Figure 1. Stability of major fractions lipoproteins in bovine plasma samples stored at −80°C. Plasma samples collected from 5 randomly selected individual cows (1–5) were separated into multiple aliquots on the day of collection, stored for up to 52 weeks at −80°C, electrophoresed, and analyzed after a single thawing.VLDL (Panel A), LDL 1 (Panel B), LDL 2 (Panel C), and HDL (Panel D) are shown. AUC, area under the curve. Differences between the individual animals' replicates were not significant across time for any fraction (repeated measures ANOVA, P = 0.9995).
Lipoprotein Fractions and Subfractions
The Lipoprint® method consistently separated bovine HDL from beta lipoproteins (VLDL, LDL, and IDL) in the LDL fractionation step (Figure 2). LDL 1 and HDL 3 had a normal distribution whereas HDL 1, HDL 2, HDL 4, HDL 5, HDL 6, IDL, LDL 2, and subfractions were not normally distributed. Thirty-two of the 73 cows (44%) had no quantifiable LDL and a minimal amount (values all <2.5%) of LDL 1 and/or LDL 2 was evident in cows distributed across the groups (Figure 3). A subset of dry cows (3/7) had prominent LDL 1 and LDL 2 peaks (LDL 1 mean 3.0%, SD 2.9; LDL 2 average 3.3%, SD 1.4; see Figure 2 for an example plot). LDL 3 was detected in two late lactation cows (1.7 and 2.1%) and two dry cows (1.2 and 1.7%). One late-lactation cow (359 DIM) had detectable LDL 3 and LDL 4 peaks (1.7 and 1%, respectively). A separate late lactation cow had a measurable LDL 4 peak (1.0%). LDL subfractions 5, 6, and 7, and HDL subfractions 7–9 were consistently not detected, and no further analysis of these subfractions was performed.
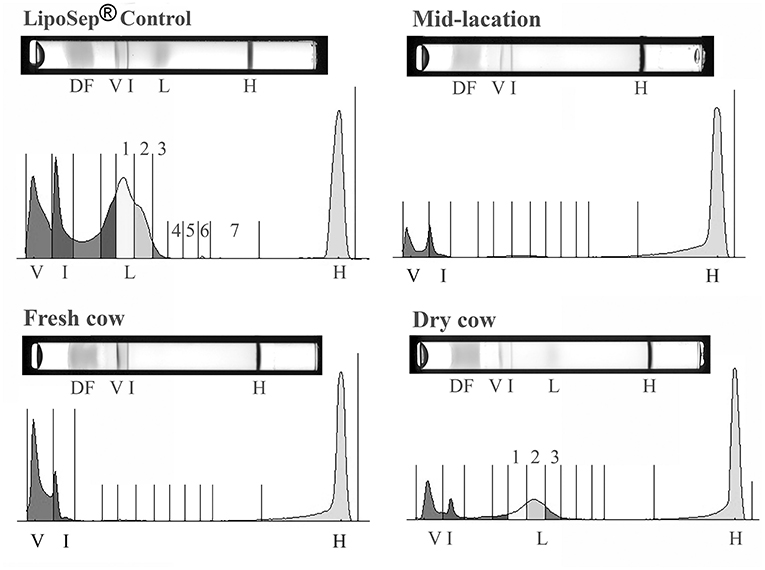
Figure 2. Representative gels and their respective densitometry plots of individual samples run in the LDL Lipoprint® fractionation for demonstrative purposes: Dye front (DF), VLDL (V), Intermediate fraction (I), LDL (L), HDL (H). LDL peaks noted in the human control sample (LipoSep®) are lacking in the majority of bovine samples, but evident in dry cows (labeled 1–3). LDL subfractions 5, 6, and 7 were not detected in any bovine sample.
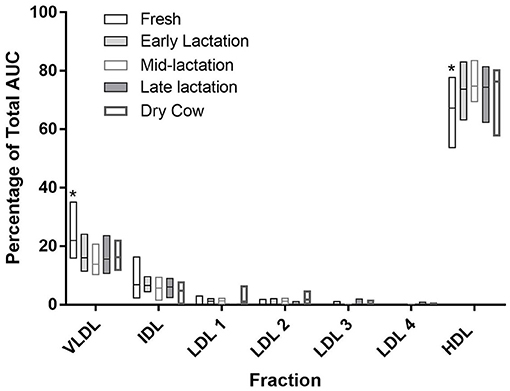
Figure 3. Summative data of the LDL Lipoprint® fractionation displaying the median (line) and range (box) of the 7 fractions. AUC, area under the curve. *Different from all other groups of cows P < 0.05 ANOVA. Fresh cows n = 11, Early lactation n = 20, Mid-lactation n = 16, Late lactation n = 19, Dry cow n =7. LDL subfractions 5, 6, and 7 were not detected in any bovine sample.
The relative concentrations of the major fractions and subfractions were largely similar across all comparisons when cows were grouped by DIM (Figure 3). HDL accounted for the majority of lipoproteins in all cows. Values ranged from a mean of 66.3% (SD 8.3) in fresh cows up to 75.7% (SD 3.5) in mid-lactation cows, with values in the fresh cows being significantly lower than all other groups (P < 0.0001 for all comparisons; Figure 3). VLDL values were higher in fresh cows, compared to all other groups (P < 0.0001 for all comparisons).
The HDL fractionation revealed 6 subfractions from bovine plasma, in the range of large and intermediate-sized particles relative to the distribution of human HDL (Figure 4). HDL subfraction 4 was higher in fresh cows compared to all other groups (fresh vs. early lactation P = 0.001; fresh vs. mid-lactation P = 0.001; fresh vs. late lactation P = 0.002; fresh vs. dry cow P = 0.0097; Figure 5, Panel A). HDL subfraction 6 peaked in mid-lactation cows, and was statistically different from the percentage in fresh and early lactation cows (mid-lactation vs. early lactation P = 0.04; mid-lactation vs. fresh P = 0.0021). This subfraction did not change over the later stages of lactation (Figure 5, Panel B).
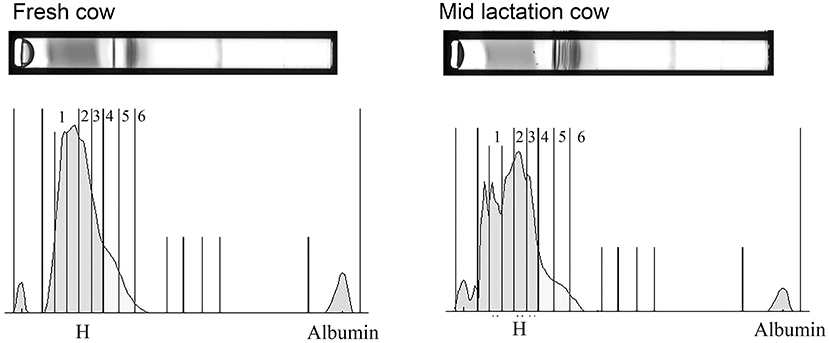
Figure 4. Representative gels and their respective densitometry plots of samples run in the HDL Lipoprint® fractionation. Note the banding pattern in the sample from the fresh cow is visibly divergent from that of the mid-lactation cow due to a more pronounced separation of numerous fractions. A prominent separation of the first HDL bands into multiple sub-bands also emerges in the mid-lactation sample.
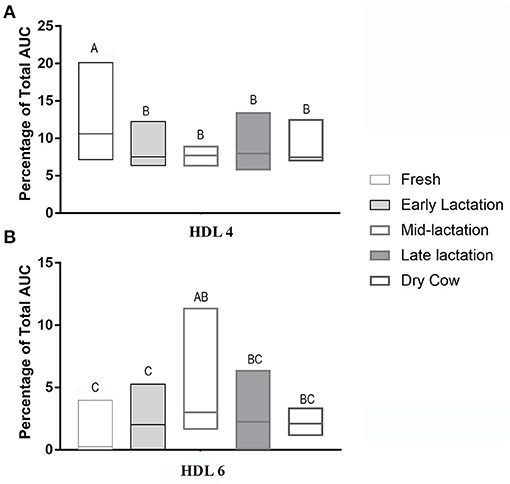
Figure 5. Summative data of the HDL Lipoprint® fractionation displaying the median (line) and range (box) of HDL 4 (Panel A) and HDL 6 (Panel B) subfractions in the 5 stages of lactation. AUC, area under the curve. Data without a common superscript differ P < 0.05. Fresh cows n = 11, Early lactation n = 20, Mid-lactation n = 16, Late lactation n = 19, Dry cow n = 7.
There were no differences in any subfraction in the LDL electrophoresis when pregnant cows were compared to non-pregnant cows (VLDL P = 0.35; IDL P = 0.43; LDL 1 P = 0.25; LDL 2 P = 0.47; HDL P = 0.67; Figure 6). The same was true in the HDL subfractionation (data not shown; HDL 1 P = 0.42, HDL 2 P = 0.69, HDL P = 0.37, HDL4 P = 0.88, HDL5 P = 0.22, HDL6 P = 0.05). Ketotic cows displayed a differential migration of HDL subfractions (Figure 7). The pattern in ketotic cows was characterized by a prominent dip, or shoulder, in the HDL subfraction plot compared to fresh cows without ketosis. This redistribution of particle sizes resulted in two differences between fresh and ketotic cows. Relative to fresh cows without ketosis, HDL 1 was higher (P = 0.003) and HDL 3 was lower (P < 0.001) on average in ketotic cows (Figure 7).
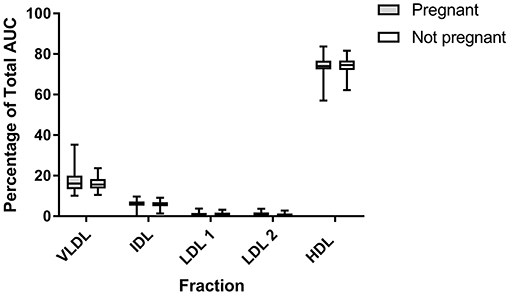
Figure 6. Summative data (LDL Lipoprint® fractionation) displaying the median (line) and range (box) of major subfractions when cows are stratified by pregnancy status. AUC, area under the curve. No statistically significant difference were found between groups. LDL 3 and LDL 4 are not depicted due to paucity. Pregnant n = 41; Not Pregnant n = 32.
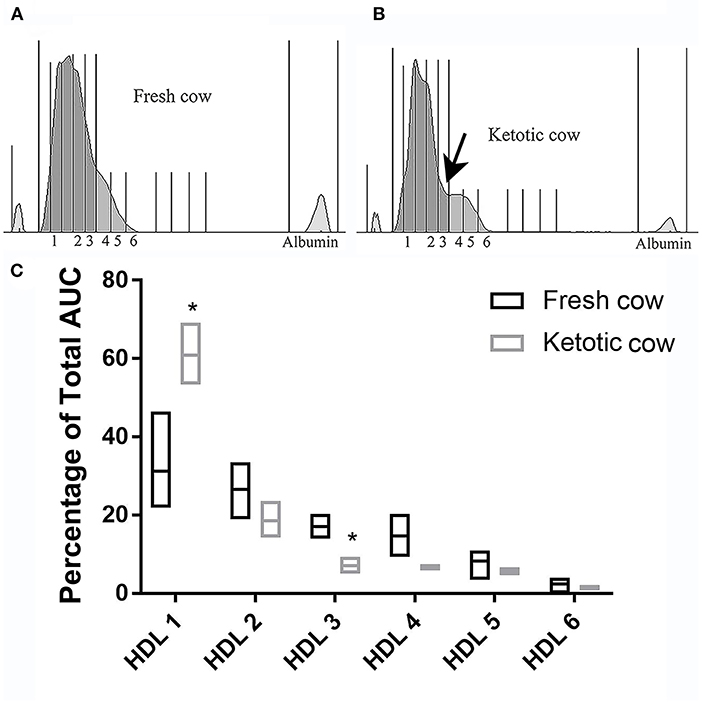
Figure 7. Example densitometric plot comparing HDL subfractionation in a fresh cow (Panel A) and ketotic cow (Panel B). Note the prominent shoulder indicated by the arrow, resulting in a higher proportion of HDL in fraction 1 and a lower proportion of DL in fraction 3 in the ketotic cow. This trend was present in all ketotic cows evaluated. Summative data displaying the median (line) and range (box) are presented in Panel C: Median (line) and range (box) HDL subfractionations in ketotic (n = 4) vs. fresh (n = 4) cows. Fresh cows were selected on the basis of DIM (2, 3, 3, and 4). Mean (±SD) plasma beta-hydroxybutryate = 13.2 (±1.5) mg/dL [ketotic cows] and 7.2 (±1.0) mg/dL [fresh cows; n = 3]. AUC, area under the curve. *P < 0.001.
Discussion
The Lipoprint® method was used to electrophoretically separate the major classes of lipoproteins, and further subfractionate LDL and HDL, in bovine plasma samples. The method provided an additional level of detail and facilitated identification of differences in specific subfractions across lactational stages. This assay took <4 h to complete, which is far more rapid than any ultracentrifugation based method. Electrophorectic assays separate and allow relative quantification of all lipoprotein subspecies present at concentrations above the detection limit of the stain and imaging equipment without reliance on potentially species-specific chemical reactions. Assays developed for the detection of human lipoproteins often rely on detergents, antibodies, enzymes, or masking reagents that can impact results in a manner that is dependent on particle composition; a property that varies across species (Jonas, 1972; Stead and Welch, 1975; Chapman, 1980, 1986; Ueda et al., 2003). Our laboratory has reported a lack of transference between one widely-used enzymatic assay and agarose electrophoresis in the quantification of canine lipoproteins (Behling-Kelly, 2016). Immunoinhibition methods targeting apoplipoproteins depend on reactivity of the antibody used in the assay. The major apolipoprotein used to accomplish this targeted approach is apolipoprotein B, which is one of the largest proteins in the proteome (4,536 amino acids in man) and is heavily modified post-transcriptionally (Al-Ali and Khachfe, 2007). To the authors' knowledge, there are no published data validating the use of commercially-available wet chemistry methods developed for human lipoproteins for use on bovine samples. Therefore, our data are best compared to existing reports using electrophoretic methods.
In this study, method performance characteristics are within acceptable limits for electrophoretic methods (Hoefner et al., 2001; Ferlizza et al., 2017; Oikonomidis et al., 2018). The intra-assay CVs for VLDL, LDL, and HDL were 0.4, 19.5, and 1.7% higher in the bovine plasma sample, compared to the manufacturer's provided data for the control material with the highest proportion of HDL. This comparison is most relevant because a high HDL concentration best reflects the general composition of a bovine sample. In the salient method development paper, the reported intra-assay imprecision for two human plasma samples with slightly divergent LDL patterns gave CVs of 8.1 and 8.4% (Hoefner et al., 2001). We attribute the much higher CV for bovine LDL in the current study predominantly to the relative paucity of this lipoprotein in the cow as compared to that in human plasma. Subjectively, changes in HDL and VLDL proportions after 52 weeks of storage warrant consideration in planning future studies.
The predominance of HDL in cows is consistent across studies, including the current work (Palmquist, 1976; Chapman, 1986; Newman et al., 2016; Crociati et al., 2017). In the current study, 66–76% of total lipoproteins were attributed to the HDL fraction. In one of our previous studies, HDL accounted for 83% of the total lipoproteins in transitioning dairy cattle (Newman et al., 2016). In a study performed by Crociati et al. (2017), the HDL percentage in dry cows ranged from ~82 to 87% of the total lipoproteins, and LDL accounted for 9.6–14%. Giordano et al. (2017) reported HDL accounted for 89% of all lipoproteins in adult cattle. The lactational stage and herd management practice may account for some of the reported divergence. Method differences are also likely contributors. All three of the described studies used electrophoretic methods, but the gel matrix and dye used varied. The method we used in the current study employs a polyacrylamide gel matrix and cholesterol-avid dye, whereas our previous study and the studies by Giordano et al. (2017) and Crociati et al. (2017) both used an agarose gel matrix and sudan black or blue dyes. The sudan dyes are fat soluble with a high affinity for neutral fats (Bayliss, 1981; Frederiks et al., 1981). The dye used and its affinity for subspecies of lipids within the lipoprotein particles would be expected to impact the staining intensity and thus relative quantification of any gel-based method and could confound cross study comparisons.
Development of a stringent LDL scoring system for use in the cow is not likely to be worthwhile for two reasons. First, there is an overall paucity of LDL in this species. Secondly, the cow lacks the unique small dense LDL that are predictive of atherosclerotic risk in humans (Pichler et al., 2018). However, the sporadic emergence of prominent LDL peaks 3 and 4 in dry cows does warrant further investigation. Specifically, longitudinal monitoring is needed to determine if either the timing of the emergence of this LDL subtype, or concentration of the lipoprotein, are predictive of lactation or reproductive performance.
In the current study, we detected an appreciable proportion of total lipoprotein in the VLDL fraction. This is not consistently noted in the literature, and methodology is likely a key contributor to the discrepancies. In size-exclusion chromatography, chylomicrons are reported to merge with VLDL, which likely results in an overestimation of this fraction (Phipps et al., 2017). The metabolism of the bovine, presumptively ruminal hydrogenation, results in lipids that are significantly more saturated than in the human (Nichols, 1967). The very high saturation of the FA within the core of ruminant VLDL limits the efficiency of their recovery from plasma by ultracentrifugation at temperatures below 20°C (Palmquist, 1976; Grummer et al., 1986). Thus, VLDL may be under-quantified in studies that use this method. VLDL peaks were not evident in our previous study evaluating cows over the transition period using agarose electrophoresis and Sudan black b staining (Newman et al., 2016). The VLDL fraction was also not evident in an agarose based electrophoresis until samples were concentrated 8-fold in an earlier study (Raphael et al., 1973). Using the Sebia electrophoretic system, studies have detected 2–3% VLDL in bovine plasma (Crociati et al., 2017). In the Lipoprint® system, manufacturer guidelines stipulate that chylomicrons are trapped in the loading gel, allowing for separation from the VLDL. We did not detect chylomicrons using the system, but did not perform any spiking studies to validate the manufacturer's claim.
The slight increase in VLDL in fresh cows we detected is not unanticipated, given the mobilization of fatty acids associated with very early lactation and hepatic production of VLDL (Imhasly et al., 2015). In a study using lactating cows administered radiolabeled palmitic acid via the rumen and ultracentrifugal isolation of lipoproteins, a high flux of fatty acids from LDL and VLDL into milk was demonstrated (Glascock and Welch, 1974). Determining if accumulation of plasma VLDL is indicative of adequate liver exportation and thus an indicator of cow health, or potentially decreased milk production, would require further evaluation pairing this electrophoretic method with additional approaches.
Our study demonstrated a relatively high degree of homogeneity and predominance of large HDL in the bovine. This is not surprising, given the minimal similarity in composition between human and bovine HDL (Jonas, 1972). Bovine HDL are rich in cholesterol esters and overall larger, less dense particles compared to human HDL (Jonas, 1972; Stead and Welch, 1975; Ashes et al., 1984; Vedhachalam et al., 2010). The small dense HDL particles that comprise the major fraction in humans are found in the electrophoretic subfractions 7–10, and were not detected in any bovine sample we analyzed (Constantinou et al., 2016). We did detect a general shift toward smaller HDL size as lactation progressed. In humans, smaller HDL particles are documented to have less free cholesterol (Niisuke et al., 2020). The hydroxyl group (-OH) on cholesterol carries a negative charge, thus relative proportions of free vs. esterified cholesterol might be impacting the proportions of large and small HDL. Particle size of the HDL has been correlated with susceptibility to copper-sulfate-induced oxidation (Shuhei et al., 2010). We did not address particle composition in the current study, but given the potential impact this may have on HDL function, these studies are planned. Studies report a mild degree of breed variation in the flotation pattern of bovine HDL (Dryden et al., 1971; Jonas, 1972; Stead and Welch, 1976). Thus, inclusion of additional breeds in future studies is also prudent.
Studies in cows have not evaluated the particles size distribution relative to health measures, but have documented declines in HDL concentration with disease. In calves with respiratory disease, the HDL value decreases by more than 10% on average, compared to healthy calves (Giordano et al., 2017). In that study, HDL accounted for 77.6% and LDL for 19.7% of the lipoproteins in healthy calves, which is a substantially altered ratio compared to reported values in adult cattle. While characterizing metabolic shifts in disease states was not the primary goal of the current study, we did observe HDL size-shifts in cows with ketosis. We were only able to include a low number of ketotic cows, given how rare this condition is in well-managed herds. However, the shift toward a more homogeneous population of HDL particle size in ketotic cows may represent an important pathological change with potential diagnostic and interventional implications and warrants further investigation. The ketotic cows were all in their first lactation, which may have also contributed to their shifted HDL profile.
Limitations of the study include a narrow population, low sample numbers in specific subsets of animals, and logistical limitations in evaluating precision. This study targeted adult, healthy animals to validate the methodology and establish a baseline for future studies. A small sampling of ketotic cows was included as a secondary evaluation. The majority of the cows in the current study were in their third lactation. We acknowledge our results may selectively represent high producing, well-adapted animals in a well-managed herd. The number of dry cows was also small. Sampling was not standardized relative to time of day. Previous studies have documented that unlike NEFA and BHB concentrations, cholesterol does not display diurnal variation and is stable throughout the day (Hussein et al., 2020). However, we acknowledge this stability may not transfer to a more in depth evaluation of particle sizes and future work should include temporal sampling across both day and lactation cycle in individual cows. The electrophoretic chamber holds 12 of the class pre-manufactured tubes. Therefore, the number of replicates in the evaluation of intra-assay variability was also limited.
In conclusion, application of the Lipoprint® system and subfractionation of both LDL and HDL would be of interest in ill animals, animals across all ages, breeds, and consuming a variety of diets. Ideally, future studies will pair this approach with analysis of the particle composition and changes in function.
Data Availability Statement
The original contributions presented in the study are included in the article/supplementary material, further inquiries can be directed to the corresponding author/s.
Ethics Statement
The animal study was reviewed and approved by the Institutional Animal Care and Use and Committee-Cornell University.
Author Contributions
EB-K was responsible for study design, data analysis, and final manuscript preparation. MD was responsible for completion of experimental assays, data analysis, drafting the initial manuscript, and reviewing the final version. JK-F assisted with completion of experiments and reviewed the final version of the manuscript. DN was responsible for sample collection and manuscript preparation and review. All authors contributed to the article and approved the submitted version.
Funding
This work is supported by Hatch under 2019-20-139 from the USDA National Institute of Food and Agriculture.
Conflict of Interest
The authors declare that the research was conducted in the absence of any commercial or financial relationships that could be construed as a potential conflict of interest.
Acknowledgments
The authors would like to thank Kelly Yumi Eaton for her technical assistance.
References
Al-Ali, H., and Khachfe, H. M. (2007). The N-terminal domain of apolipoprotein B-100: structural characterization by homology modeling. BMC Biochem. 8:12. doi: 10.1186/1471-2091-8-12
Ashes, J. R., Burley, R. W., Sidhu, G. S., and Sleigh, R. W. (1984). Effect of particle size and lipid composition of bovine blood high density lipoprotein on its function as a carrier of beta-carotene. Biochim. Biophys. Acta 797, 171–177. doi: 10.1016/0304-4165(84)90119-3
Baumberger, C., Ulevitch, R. J., and Dayer, J. M. (1991). Modulation of endotoxic activity of lipopolysaccharide by high-density lipoprotein. Pathobiology 59, 378–383. doi: 10.1159/000163681
Bayliss, O. B. (1981). The histochemical versatility of sudan black B. Acta Histochem. Suppl. 24, 247–255.
Behling-Kelly, E. (2016). Comparison of 2 electrophoretic methods and a wet-chemistry method in the analysis of canine lipoproteins. Vet. Clin. Pathol. 45:12318. doi: 10.1111/vcp.12318
Campos, H., Genest, J. J., Blijleven, E. S., McNamara, J. L., Jenner, J. M., Ordovas, P. W., et al. (1992). Low density lipoprotein particle size and coronary artery disease. Arteriosc. Thromb. 12, 187–195. doi: 10.1161/01.ATV.12.2.187
Chapman, M. J. (1980). Animal lipoproteins : chemistry, structure, and comparative aspects. J. Lipid Res. 21, 789–853. doi: 10.1016/S0022-2275(20)34780-5
Chapman, M. J. (1986). Comparative analysis of mammalian plasma lipoproteins. Meth. Enzymol. 128, 70–143. doi: 10.1016/0076-6879(86)28063-5
Constantinou, C., Karavia, E., Xepapadaki, E., Peristera-Ioanna, P., Papakosta, E., Marilena Karavyraki, M., et al. (2016). Advances in high-density lipoprotein physiology : surprises, overturns, and promises. Am. J. Physiol. Endocrinol. Metab. 310, E1–E14. doi: 10.1152/ajpendo.00429.2015
Crociati, M., Lakamy, S., Floridi, C., Comin, A., Fruganti, G., Monaci, M., et al. (2017). Influence of lipoproteins at dry-off on metabolism of dairy cows during transition period and on postpartum reproductive outcomes. Theriogenology 94, 31–36. doi: 10.1016/j.theriogenology.2017.02.007
Dryden, F. D., Marchello, J. A., Adams, G. H., and Hale, W. H. (1971). Bovine serum lipids. II. Lipoprotein quantitative and qualitative composition as influenced by added animal fat diets. J. Anim. Sci. 32, 1016–1029. doi: 10.2527/jas1971.3251016x
Eggesbø, J. B., Lyberg, T., Aspelin, T., Hjermann, I., and Kierulf, P. (1996). Different binding of 125I-LPS to plasma proteins from persons with high or low HDL. Scand. J. Clin. Lab. Invest. 56, 533–543. doi: 10.3109/00365519609088809
Ferlizza, E., Dondi, F., Andreani, G., Bucci, D., Archer, J., and Isani, G. (2017). Validation of an electrophoretic method to detect albuminuria in cats. J. Feline Med. Surg. 19, 860–868. doi: 10.1177/1098612X16664112
Frederiks, W. M., Slob, A., Frank, J. J., and Tas, J. (1981). (Histo)Chemical aspects of sudan black B in various solvents. Acta Histochem. Suppl. 24, 259–265.
Garcia-Rios, A., Nikolic, D., Perez-Martinez, P., Lopez-Miranda, J., Rizzo, M., and Hoogeveen, R. C. (2014). LDL and HDL subfractions, dysfunctional HDL: treatment options. Curr. Pharm. Des. 20, 6249–6255. doi: 10.2174/1381612820666140620154014
Gardner, C. D., Fortmann, S. P., and Krauss, R. M. (1996). Association of small low-density lipoprotein particles with the incidence of coronary artery disease in men and women. JAMA 276, 875–881. doi: 10.1001/jama.1996.03540110029028
Giordano, A., Rossi, G., Probo, M., Moretti, P., and Paltrinieri, S. (2017). Colorimetric and electrophoretic evaluation of lipoprotein fractions in healthy neonatal calves: comparison with results from adult cows and from calves with inflammatory conditions. Res. Vet. Sci. 111, 108–112. doi: 10.1016/j.rvsc.2017.02.007
Glascock, R. F., and Welch, V. A. (1974). Contribution of the fatty acids of three low density serum lipoproteins to bovine milk fat. J. Dairy Sci. 57, 1364–1370. doi: 10.3168/jds.S0022-0302(74)85068-X
Gruber, M., Christ-Crain, M., Stolz, D., Keller, U., Müller, C., Bingisser, R., et al. (2009). Prognostic impact of plasma lipids in patients with lower respiratory tract infections - an observational study. Swiss Med. Weekly 139, 166–72.
Grummer, R. R., Hurley, W. L., Davis, C. L., and Meacham, C. A. (1986). Effect of isolation temperature on the determination of bovine plasma very low density lipoprotein concentrations. J. Dairy Sci. 69, 2083–2090. doi: 10.3168/jds.S0022-0302(86)80640-3
Gurr, M. I., Frayn, K. N., and Harwood, J. L. (2002). Lipid Biochemistry. 5th Edn. Ames, IA: Iowa State Press. doi: 10.1002/9780470774366
Hoefner, D. M., Hodel, S. D., O'Brien, J. F., Branum, E. L., Sun, D., Meissner, I., et al. (2001). Development of a rapid, quantitative method for ldl subfractionation with use of the quantimetrix lipoprint LDL system. Clin. Chem. 47, 266–274. doi: 10.1093/clinchem/47.2.266
Hussein, H. A., Thurmann, J. P., and Staufenbiel, R. (2020). 24-h variations of blood serum metabolites in high yielding dairy cows and calves. BMC Vet Res. 16:327–338. doi: 10.1186/s12917-020-02551-9
Ilcol, Y. O., Yilmaz, Z., Cansev, M., and Ulus, I. H. (2009). Choline or CDP-choline alters serum lipid responses to endotoxin in dogs and rats: involvement of the peripheral nicotinic acetylcholine receptors. Shock 32, 286–294. doi: 10.1097/SHK.0b013e3181971b02
Imhasly, S., Bieli, C., Naegeli, H., Nyström, L., Ruetten, M., and Gerspach, C. (2015). Blood plasma lipidome profile of dairy cows during the transition period. BMC Vet. Res. 11:252. doi: 10.1186/s12917-015-0565-8
Jonas, A. (1972). Physicochemical properties of bovine serum high density lipoprotein. J. Biol. Chem. 247, 7767–7772. doi: 10.1016/S0021-9258(19)44589-4
Kessler, E. C., Gross, J. J., Bruckmaier, R. M., and Albrecht, C. (2014). Cholesterol metabolism, transport, and hepatic regulation in dairy cows during transition and early lactation. J. Dairy Sci. 97, 5481–5490. doi: 10.3168/jds.2014-7926
Kitchens, R. L., Thompson, P. A., Munford, R. S., and O'Keefe, G. E. (2003). Acute inflammation and infection maintain circulating phospholipid levels and enhance lipopolysaccharide binding to plasma lipoproteins. J. Lipid Res. 44, 2339–2348. doi: 10.1194/jlr.M300228-JLR200
Levels, J. H., Abraham, P. R., Van den Ende, A., and Van Deventer, S. J. (2001). Distribution and kinetics of lipoprotein-bound endotoxin. Infect. Immun. 69, 2821–2828. doi: 10.1128/IAI.69.5.2821-2828.2001
Marik, P. E. (2006). Dyslipidemia in the critically Ill. Crit. Care Clin. 22, 151–59. doi: 10.1016/j.ccc.2005.08.008
Movva, R., and Rader, D. J. (2008). Laboratory assessment of HDL heterogeneity and function. Clin. Chem. 54, 788–800. doi: 10.1373/clinchem.2007.101923
Murch, O., Collin, M., Hinds, C. J., and Thiemermann, C. (2007). Lipoproteins in inflammation and sepsis. I. Basic science. Intens. Care Med. 33, 13–24. doi: 10.1007/s00134-006-0432-y
Newman, A., Mann, S, Nydam, D., Overton, T. R., and Behling-Kelly, E. (2016). Impact of dietary plane of energy during the dry period on lipoprotein parameters in the transition period in dairy cattle. J. Anim. Physiol. Anim. Nutr. 100, 118–126. doi: 10.1111/jpn.12343
Nichols, A. V. (1967). Human serum lipoproteins and their interrelationships. Adv. Biol. Med. Phys. 11, 109–158. doi: 10.1016/B978-1-4832-3107-5.50008-X
Niisuke, K., Kuklenyik, Z., Horvath, K. V., Gardner, M. S., Toth, C. A., and Asztalos, B. F. (2020). Composition-function analysis of HDL subpopulations: influence of lipid composition on particle functionality. J. Lipid Res. 61, 306–315. doi: 10.1194/jlr.RA119000258
Oikonomidis, I. L., Tsouloufi, T. K., Soubasis, N., and Kritsepi-Konstantinou, M. (2018). Validation, reference intervals and overlap performance of a new commercially available automated capillary electrophoresis assay for the determination of the major fraction of glycated haemoglobin (HbA1c) in dogs. Vet. J. 234, 48–54. doi: 10.1016/j.tvjl.2018.02.005
Otera, H., Ishida, T., Nishiuma, T., Kobayashi, K., Kotani, Y., Yasuda, T., et al. (2009). Targeted inactivation of endothelial lipase attenuates lung allergic inflammation through raising plasma HDL level and inhibiting eosinophil infiltration. Am. J. Physiol. Lung Cell. Mol. Physiol. 296, L594–602. doi: 10.1152/ajplung.90530.2008
Palmquist, D. L. (1976). A kinetic concepto of lipid transport in ruminants. J. Dairy Sci. 59, 355–363. doi: 10.3168/jds.S0022-0302(76)84212-9
Phipps, Z. C., Seck, F., Davis, A. N, Rico, J. E, and McFadden, J.W. (2017). Technical note: characterization of ceramide in bovine lipoproteins. J. Dairy Sci. 100, 8602–8608. doi: 10.3168/jds.2016-12538
Pichler, G., Amigo, N., Tellez-Plaza, M.A, Pardo-Cea, M. A., Dominguez-Lucas, V. G., et al. (2018). LDL particle size and composition and incident cardiovascular disease in a South-European population: the Hortega-Liposcale follow-up study. Int. J. Cardiol. 264, 172–178. doi: 10.1016/j.ijcard.2018.03.128
Puppione, D. L., Kunitake, S. T., Toomey, M. L., Loh, E., and Schumaker, V. N. (1982). Physicochemical characterization of ten fractions of bovine alpha lipoproteins. J. Lipid Res. 23, 371–379. doi: 10.1016/S0022-2275(20)38133-5
Raphael, B. C., Dimick, P. S., and Puppione, D. L. (1973). Electrophoretic characterization of bovine serum lipoproteins throughout gestation and lactation. J. Dairy Sci. 56, 1411–1414. doi: 10.3168/jds.S0022-0302(73)85374-3
Shuhei, N., Söderlund, S., Jauhiainen, M., and Taskinen, M. R. (2010). Effect of HDL composition and particle size on the resistance of HDL to the oxidation. Lipids Health Dis. 9, 1–10. doi: 10.1186/1476-511X-9-104
Stead, D., and Welch, V. A. (1975). Lipid composition of bovine serum lipoproteins. J. Dairy Sci. 58, 122–127. doi: 10.3168/jds.S0022-0302(75)84528-0
Stead, D., and Welch, V. A. (1976). Determination of physical properties of bovine serum lipoproteins by analytical ultracentrifugation. J. Dairy Sci. 59, 9–13. doi: 10.3168/jds.S0022-0302(76)84147-1
Turk, R., Juretic, D., Geres, D., Svetina, A., Turk, N., and Flegar-Mestric, Z. (2008). Influence of oxidative stress and metabolic adaptation on PON1 activity and MDA level in transition dairy cows. Anim. Reprod. Sci. 108, 98–106. doi: 10.1016/j.anireprosci.2007.07.012
Turk, R., Podpecan, O., Mrkun, J., Kosec, M., Flegar-Mestric, Z., Perkov, S., et al. (2013). Lipid mobilisation and oxidative stress as metabolic adaptation processes in dairy heifers during transition period. Anim. Reprod. Sci. 141, 109-115. doi: 10.1016/j.anireprosci.2013.07.014
Ueda, Y., Matsui, M., Hayashi, S., Yamaguchi, Y., and Kanakura, Y. (2003). New homogeneous HDL-cholesterol assay without the influence of high tg sample using the selective detergent to lipoproteins. J. Clin. Lab. Anal. 17, 201–208. doi: 10.1002/jcla.10101
Urbina, E. M., McCoy, C. E., Gao, Z., Khoury, P. R., Shah, A. S., Dolan, L. M., et al. (2017). Lipoprotein particle number and size predict vascular structure and function better than traditional lipids in adolescents and young adults. J. Clin. Lipidol. 11, 1023–1031. doi: 10.1016/j.jacl.2017.05.011
van Dijk, S., and Wensing, T. (1989). Comparison of the lipoprotein pattern of the Horse, the Pony and the lactating and non-lactating cow obtained by a combination of an ultracentrifugation and a precipitation technique. Comp. Biochem. Physiol. B 94, 735–738. doi: 10.1016/0305-0491(89)90158-2
Vedhachalam, C., Palaniappan, S. C., Nickel, M., Dhanasekaran, P., Lund-Katz, S., Rothblat, G. H., et al. (2010). Influence of apolipoprotein (Apo) A-I structure on nascent high density lipoprotein (HDL) particle size distribution. J. Biol. Chem. 285, 31965–31973. doi: 10.1074/jbc.M110.126292
Vekic, J., Kotur-Stevuljevic, J., Jelic-Ivanovic, Z., Spasic, S., Spasojevic-Kalimanovska, V., Topic, A., et al. (2007). Association of oxidative stress and PON1 with LDL and HDL particle size in middle-aged subjects. Eur. J. Clin. Invest. 37, 715–723. doi: 10.1111/j.1365-2362.2007.01849.x
Yamamoto, M., and Katoh, M. (2000). Decreased apolipoprotein C-III concentration in the high-density lipoprotein fraction from calves inoculated with pasteurella haemolytica and bovine herpes virus-1. J. Vet. Med. Sci. 62, 49–52. doi: 10.1292/jvms.62.49
Keywords: Lipoprint LDL system, particle size, lipid, metabolism, lactation
Citation: Duran MJ, Kannampuzha-Francis J, Nydam D and Behling-Kelly E (2021) Characterization of Particle Size Distribution of Plasma Lipoproteins in Dairy Cattle Using High-Resolution Polyacrylamide Electrophoresis. Front. Anim. Sci. 2:678085. doi: 10.3389/fanim.2021.678085
Received: 08 March 2021; Accepted: 18 June 2021;
Published: 13 July 2021.
Edited by:
Erin E. Connor, University of Delaware, United StatesReviewed by:
Melissa Duplessis, Agriculture and Agri-Food Canada (AAFC), CanadaJuan J. Loor, University of Illinois at Urbana-Champaign, United States
Copyright © 2021 Duran, Kannampuzha-Francis, Nydam and Behling-Kelly. This is an open-access article distributed under the terms of the Creative Commons Attribution License (CC BY). The use, distribution or reproduction in other forums is permitted, provided the original author(s) and the copyright owner(s) are credited and that the original publication in this journal is cited, in accordance with accepted academic practice. No use, distribution or reproduction is permitted which does not comply with these terms.
*Correspondence: Erica Behling-Kelly, eb58@cornell.edu