A mathematical model for Chagas disease transmission with neighboring villages
- 1Department of Mathematics, University of Michigan-Flint, Flint, MI, United States
- 2Department of Mathematics and Statistics, Oakland University, Rochester, MI, United States
- 3Computer Science Department, Courant Institute of Mathematical Sciences, New York University, New York, NY, United States
- 4Department of Biological Sciences, Central Washington University, Ellensburg, WA, United States
Chagas disease has been the target of widespread control programs, primarily through residual insecticide treatments. However, in some regions like the Gran Chaco, these efforts have failed to sufficiently curb the disease. Vector reinfestation into homes and vector resistance to insecticides are possible causes of the control failure. This work proposes a mathematical model for the dynamics of Chagas disease in neighboring rural villages of the Gran Chaco region, incorporating human travel between the villages, passive vector migration, and insecticide resistance. Computational simulations across a wide variety of scenarios are presented. The simulations reveal that the effects of human travel and passive vector migration are secondary and unlikely to play a significant role in the overall dynamics, including the number of human infections. The numerical results also show that insecticide resistance causes a notable increase in infections and is an especially important source of reinfestation when spraying stops. The results suggest that control strategies related to migration and travel between the villages are unlikely to yield meaningful benefit and should instead focus on other reinfestation sources like domestic foci that survive insecticide spraying or sylvatic foci.
1. Introduction
Trypanosoma cruzi is a parasitic hemoflagellate that infects mammals, including humans, wherever the Triatominae vectors are found, between approximately 40° N and S of the equator in the Americas [1]. Chagas disease (American trypanosomiasis), caused by T. cruzi infection in humans, is responsible for disability and early death in approximately one-third of those infected [2]. The WHO reports that approximately 8 million individuals are currently infected with Chagas disease, an estimated 25 million people are potentially at risk of infection, and more than 10,000 people die annually from the disease [3]. Chagas disease is increasingly being detected in the US, Canada, and many European and Asian countries due to human migration between Latin America and the rest of the world [4]. Therefore, it is becoming a global threat to public health.
Chagas disease has been the target of widespread and largely successful control programs over the past few decades [5]. Such efforts–prominently including the Southern Cone Initiative, which was begun in 1991–have had a tremendous impact, more than halving the number of infected individuals. However, the disease remains a baleful threat due to large number of sylvatic reservoir hosts found throughout Latin America and the possibility of resurgence in places where incidence has been reduced. In particular, the Gran Chaco, a region over 600,000 km2 in size located in southcentral South America, is of notable concern. There, the major disease control strategies have failed, and Chagas disease remains endemic, threatening the approximately five million inhabitants [6–8]. For example, one rural village in the region was recently surveyed, and over 80% of the adults were found to be infected [9].
Chagas disease has historically been a problem associated with rural regions of Latin America, largely due to the tendency of its insect vectors to live in the crevices of homes made from inexpensive and easily accessible materials such as mud, adobe, straw, and palm thatch. The disease has spread in recent years as people have moved from rural areas to urban locations within Latin America and throughout the world [3, 10]. The estimated burden of Chagas disease in the United States is greater than 300,000 individuals, with 30,000–45,000 cardiomyopathy cases and 63–315 congenital infections annually [11]. Los Angeles blood banks have an estimated seroprevalence among all blood donors as high as 1 in 3,800 [12]. The enduring presence and recent diffusion of Chagas disease is quite concerning as it is a chronic and potentially life-threatening infection [13]. At present, there is no vaccine for Chagas disease, and treatments with drugs such as benznidazole and nifurtimox are long, have serious potential side effects, and diminish in effectiveness with time since infection. As a result, the primary method of disease control is prevention [3].
Trypanosoma cruzi infection can be due to exposure to infected Triatominae feces, blood transfusion, organ donation, or congenital transmission [10]. The subfamily Triatominae or kissing bugs are large bloodsucking insects that predominately hide in the homes of their host during the day and feed on blood at night [3]. Should the Triatominae bite a mammal infected with T. cruzi, it may become infected and spread the disease. The parasites are present in the feces of the vectors and infection only occurs if the parasites come in contact with the mucosa through the eyes, the mouth, or enter through the nearby bite site [3, 10]. For this reason the most important reservoirs for T. cruzi are insectivorous mammals which can serve as hosts for T. cruzi [14]. Many methods of inhibiting transmission to humans, such as blood screening, home improvements, and bednets, are currently in use, with the primary means of vector control being residual insecticide spraying [3].
Residual insecticide treatment of endemic areas has shown tremendous success in most regions, but in some like the Gran Chaco, they have failed to sufficiently curb the disease, and the uneven success of current prevention methods in these regions warrants further study. Of particular interest are vector reinfestation into homes and vector resistance to insecticides, both of which are important possible causes of control failure. Reinfestation of vectors into homes is a major concern, because even a small lingering population of vectors in a village that has been treated with insecticides can quickly return to pre-spraying levels of infestation; therefore, migration could contribute to rapid population recovery and thus account for control failure in regions like the Gran Chaco [6, 7]. Reinfestation is a particularly prominent concern in the Gran Chaco due to a combination of political instability causing unpredictable changes in control strategies and economic instability causing widespread human migration [6, 7]. Along with these concerns, field work supports the idea that vector movement is playing an important role in control failure; recent research suggests that Triatoma infestans, the primary vector in the Grand Chaco, from sylvatic populations and neighboring townships are re-infesting villages in the Gran Chaco and that prevention tactics are needed for effective vector control [15–18].
In addition, despite an initial assumption of the Southern Cone Initiative that the vectors do not have sufficient genetic variability to develop resistance, various sources have shown that populations of T. infestans in the Gran Chaco and other areas are resistant to the insecticides currently in use [6, 7, 19]. For example, in 2002, vectors in four separate villages in Argentina were found to have high resistance to the pyrethroid insecticides deltamethrin and, β-cypermethrin [20]. Additionally, insecticide resistance has been observed within the Gran Chaco region, which suggests that it may be playing a role in the failure of control efforts there [19]. The possibility of insecticide resistance is especially problematic because vector control plays such a key role in current disease prevention efforts.
The purpose of this study is to analyze these potential sources of reinfestation using a differential equations model. This work is the latest in a series of works that have used Chagas disease models to analyze the effectiveness of various control strategies [21–26]. The previous works have assumed that reinfestation occurs due to a small population of vectors that avoid insecticide spraying. In this study, we compare this cause of control failure with vector reinfestation through migration by expanding the model to simulate the spread of Chagas disease in a system of villages rather than a single town. We then use this updated model to analyze the impact of different control strategies with a focus on how they interact with vector migration. We also consider the impact of larger populations of residual vectors that survive insecticide use due to resistance.
2. Materials and methods
The model in this work expands upon the one used in “A Mathematical Model of Chagas Disease Dynamics in the Gran Chaco Region” [26], which we update to more accurately reflect the available research on T. infestans and T. cruzi. As in [26], the model is specifically designed to analyze villages in the Gran Chaco, and these villages are assumed to have sufficiently large populations so that differential equations are appropriate for modeling them. This assumption is consistent with field data, see [9], where the average village size is 462 people. For each village, we model the total domestic vectors, infected domestic vectors, total peridomestic vectors, infected peridomestic vectors, infected humans, susceptible humans, infected domestic animals that we will refer to as dogs, and infected peridomestic mammals (goats and pigs). We also consider chickens as a potential blood meal source, but do not model their population since they are not susceptible to T. cruzi infection. Furthermore, as this model considers a system of villages, multiple sets of these eight equations coupled by migration terms are used rather than a single set. Throughout, parameters that may vary between villages are denoted with a j subscript, and those that are assumed to be uniform across villages are not.
Let Vj = Vj(t) represent the total number of domestic vectors in village j at time t, Vij = Vij(t) the number of infected domestic vectors, Wj = Wj(t) the total number of peridomestic vectors, Wij = Wij(t) the number of infected peridomestic vectors, Nij = Nij(t) the number of infected humans, Nsj = Nsj(t) the number of susceptible humans, Dij = Dij(t) the number of infected dogs, Mij = Mij(t) the number of infected peridomestic mammals, Nj(t) = Nsj(t)+Nij(t) the total number of humans, Dj(t) the total number of dogs, Mj(t) the total number of mammals, and Cj(t) the number of chickens. In this work, the total dog, mammal, and chicken populations are not modeled, but rather obtained from [27] and [28] and defined explicitly. However, infected dogs and mammals are modeled as sub-populations of the known total populations. We use the notation f+ = max(f, 0) and f− = min(f, 0) throughout.
2.1. Total domestic vectors
First, we model the growth of domestic vectors by the using a delayed logistic term:
where the delay τ is the gestation time of the vectors, KVj is the carrying capacity of the vectors in village j, and dhj(t−τ) is the egg hatching rate in village j at time t−τ. Since adult female vectors lay eggs after having a complete blood-meal, the egg hatching rate is dependent on the biting rate Bj(t−τ), which is the average number of bites each vector makes per day. In addition to the biting rate, the egg hatching rate is naturally assumed to be dependent on the number of eggs a female vector lays after a blood-meal ϕl, the proportion of adult females in the population v, and the proportion of eggs that hatch ϕh. Thus, the egg hatching rate is given by
Since a larger blood supply results in more biting (up to a maximum per day), the biting rate Bj(t) is dependent on the domestic blood supply bsupj(t) of village j at the time when the female lays eggs, and it is also dependent on the season [29]. In order to accurately capture the seasonal dependence, we construct a seasonal biting rate b(t) (defined in Table 3) based on data from [28]. However, this function b(t) is obtained from data in a setting with a particular known blood supply bsupknown(t) [defined in equation (43)] and does not capture the blood meal dependence, so we also use a Holling Type II response to obtain the final biting rate
where bsupj(t) is the domestic blood supply in village j, β is the maximum possible daily feedings of a vector, and bmax is the maximum value of b(t). Ab is chosen such that
This is done so that if the blood supply in village j matches the conditions in [28] (that is, bsupj = bsupknown), then B(t) = b(t) and the biting rate agrees with the empirical results.
We now consider the domestic blood supply bsupj(t), which is composed of total humans, dogs, and chickens. Since the vectors prefer certain blood sources over others, each one is translated into a number of humans, so that the unit of measurement is human factors [28, 30]. More specifically, the human factors for a dog and a chicken are represented by df and cf, respectively. Also, the blood supply is dependent on the availability of humans, dogs, and chickens in the domestic region in village j at time t, given by aNj(t), aDhj(t), and aChj(t), respectively. These time-dependent values represent the proportion of the respective populations available for biting in the domestic region, which may vary due to various factors, such as dogs sleeping outside or people being unavailable for biting because of their protection (at night) when they are using bednets [28]. Therefore, the total blood supply is given by
which can be thought of as the equivalent number of human factors available for biting.
We now consider the deaths of vectors. Natural death is modeled by
where dm is the natural death rate. We also assume that the vectors die due to overpopulation, which is modeled by
where dk is the death rate due to the population being over the carrying capacity. In addition, death can be caused by insecticide spraying. We assume there is a sub-population of vectors Vresj that does not die from spraying, being protected in cracks in the walls or by insecticide resistance. Recent field surveys confirm that domestic vectors that survive spraying continue to be a source of reinfestation [18]. For simplicity, we assume that Vresj is constant for a given village. Therefore, the term that models death due to spraying is given by
where rj(t) is the mortality rate due to spraying of non-resistant vectors.
As was done in [26], we assume the net movement into (or out of) the domestic region from (or to) the peridomestic region of a village is given by
Here, ρ is a constant parameter with units vectors per day, and the term inside the parentheses captures the density dependence by comparing the ratios of the vector population to the carrying capacity in the respective regions. We note that the movement of vectors between the domestic and peridomestic region is still poorly understood, and a more thorough analysis of this term can be found in [26].
A novel aspect of our model is the migration of vectors between villages. Vectors move between villages primarily in two ways: passively via human movement and actively via flight [15]. However, even with villages within approximately 500 m of each other there is sometimes no flight of vectors between them [15], so we consider active transport negligible in our village system. For passive migration, which occurs when vectors and their eggs are carried by traveling individuals, we assume that the rate is dependent on the number of vectors and humans present in the domestic region of each village in the following way. We let αNj,k be the daily rate of people traveling from village j to village k, and use η to denote the average ratio of vectors that live in the luggage or other travel items in the domicile. Then the number of people traveling daily from village j to village k is given by αNj,kNj(t), and on average, each person is carrying ηVj(t)/Nj(t) vectors. Thus, the number of vectors per day passively transporting into (and out of) village j, and from (and into) village k, is
where, pVj,k = ηαNj,k.
Finally, the complete equation used to model domestic vectors is
2.2. Infected domestic vectors
A domestic vector becomes infected by biting infected humans and infected dogs [31]. Thus, the term that models the growth of the infected domestic vector population is
where PNV and PMV are the proportion of vectors that become infected after taking a blood meal from infected humans and mammals (including dogs). Note that Bj(t)(Vj(t)−Vij(t)) is the daily number of bites by non-infected vectors and that the latter half of (12) is the fraction of bites that cause infection. The vectors do not pass T. cruzi to their young, so this is the only term for the growth of the infected vector population [32].
The death rates for infected vectors are assumed to be the same as those for all vectors with no preference for the infected or susceptible populations, so the terms accounting for mortality are the same as those for total domestic vectors but multiplied appropriately by Vij/Vj. The transport rates between populations of vectors are subject to the same assumption, and they are correspondingly multiplied by the appropriate ratios of infected vectors.
Thus, the complete equation is
2.3. Total peridomestic vectors
Naturally, the dynamics of the peridomestic vectors are similar to those of the domestic vectors; however, there are some minor differences due to the different setting. First, the egg hatching rate is updated to depend on the peridomestic blood supply, , which is given by
Here, aDpj(t) is the peridomestic availability of dogs, aCpj(t) is the peridomestic availability of chickens, aMj(t) is the availability of mammals, and mf is the mammal factor analagous to df and cf [28]. Thus, the peridomestic biting rate is given by
and the peridomestic egg hatching rate is given by
Second, we assume that luggage containing items such as clothing is what harbors vectors for passive transport [15], so as there is no luggage in the peridomestic region there is correspondingly no term for passive transport (We relax this assumption in Simulation 4 and consider a case with transport of peridomestic vectors). Therefore, we have
2.4. Infected peridomestic vectors
The dynamics of infected peridomestic vectors are derived from those of the total peridomestic vectors just as for the domestic vectors, so the equation is given by
2.5. Susceptible humans
We now consider susceptible humans. We note that all children of susceptible humans are born susceptible, and a certain fraction PNN of children born to infected mothers are also born infected due to congenital transmission with the rest being born susceptible [33–35]. Also, due to the relatively long time it takes for Chagas disease to cause death, the birth rate of infected mothers is assumed to be the same as that of susceptible ones. Thus, using a logistic model, the growth term is given by
where GN is the daily growth rate of humans with unlimited resources. For the death term, we use
where γNs is the per day death rate of susceptible humans.
Along with death, we consider the loss of susceptible humans due to infection. The rate of infection is taken to be the product of the number of bites per day by infected vectors and the fraction of those bites that cause human infection, which yields the following term:
Finally, as we consider multiple villages, we include terms for the movement of people between them. We assume this movement depends on a per-person travel rate, so that the rate of people entering and leaving village j (from and to village k) is given by
where αNj,k is the daily rate of movement of people from village j to k.
Thus, the complete equation is
2.6. Infected humans
The model for infected humans is similar to that of susceptible ones. However, the birth term reflects that only infected mothers can give birth to infected children and that only a certain percentage of their children are born infected. Also, the susceptible humans that become infected join the infected population, and the death rate of infected humans is assumed to be higher. However, the travel rates are assumed to be the same. Thus, the equation is
2.7. Infected dogs
We first consider the birth rate of infected dogs. To do this, we consider the total population of dogs in village j, Dj(t), which we assume is known. Then, assuming a growth rate of αj(t) for the total dogs and that susceptible and infected dogs die at the same rate of γD, we have . Finally, since Dj(t) is known, and hence, is also known, we also have αj(t) in terms of known quantities:
Therefore, as infected dogs are only born to infected mothers, the birth term for infected dogs is given by
where PMM is the proportion of dogs infected by vertical transmission.
In addition, the infected dog population could grow due to infected vector bites on susceptible dogs. Therefore, the term we use is similar to that used to model infection of humans. However, since dogs inhabit both domestic and peridomestic regions, there are two separate terms to model infection using appropriate respective biting terms, blood supplies, populations, and availability values. Thus, the terms used are
and
for the domestic and peridomestic regions, respectively.
Then, including the death term, the complete equation is given by
2.8. Infected mammals
Finally, we consider infected mammals. This equation is similar to that for dogs, but it differs slightly in that mammals do not enter the domestic region and thus there are no terms for infection from domestic vectors. Therefore, we have
2.9. The full model
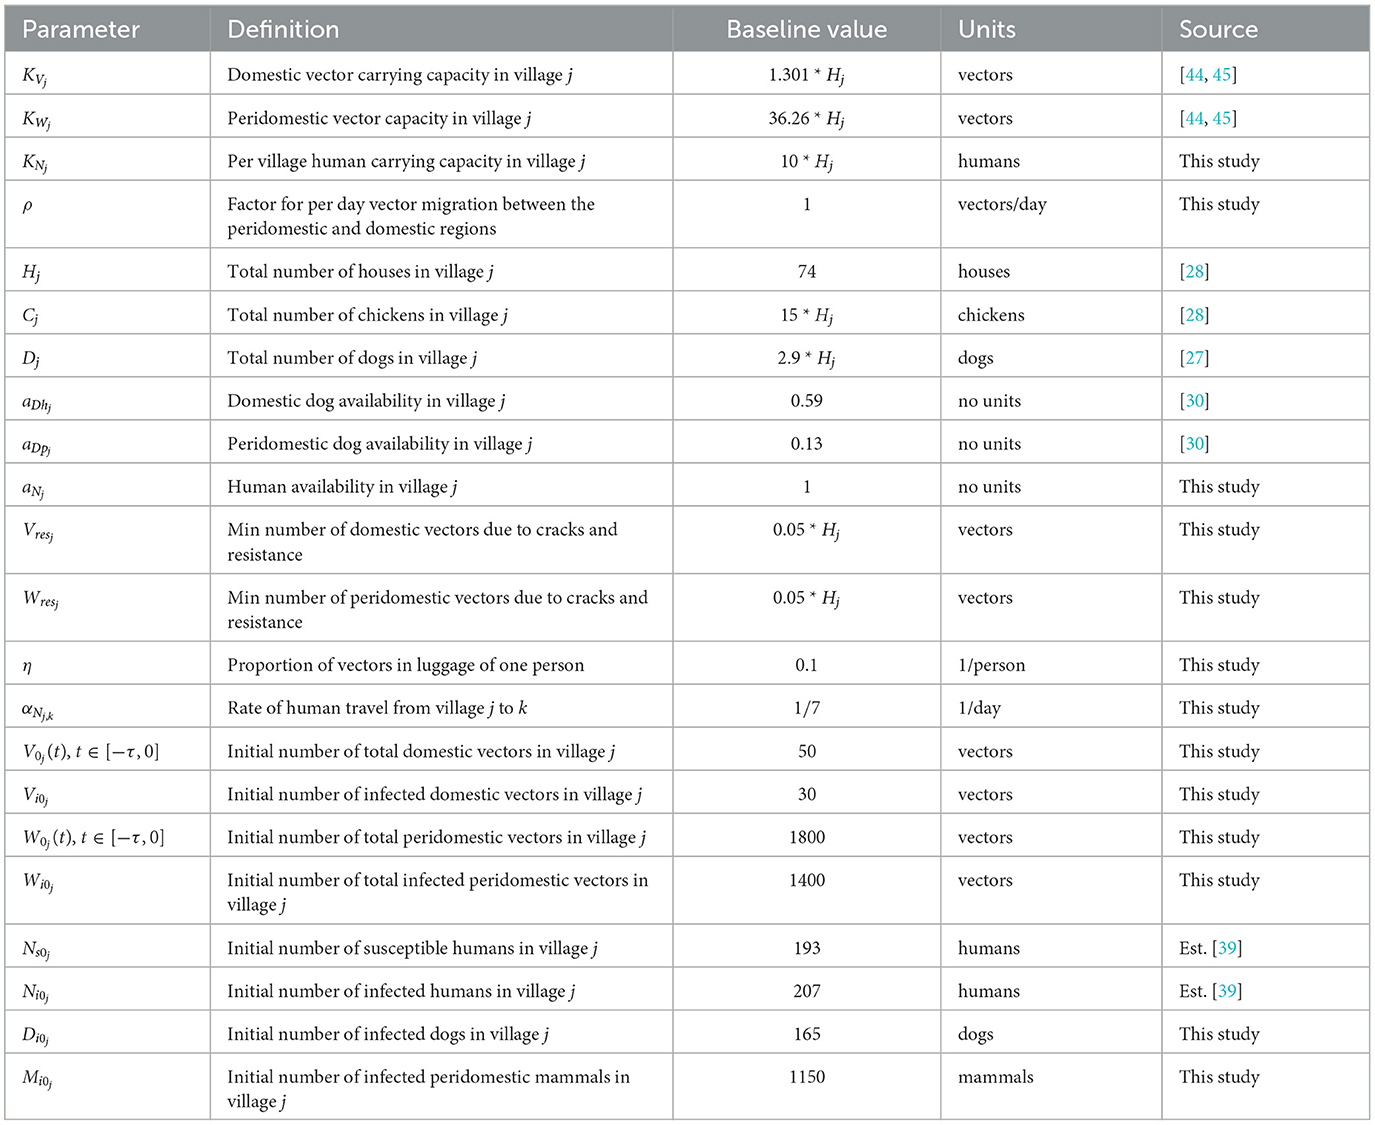
Thus, the full model for village j is given by the following eight differential equations and the initial conditions found in Table 2:
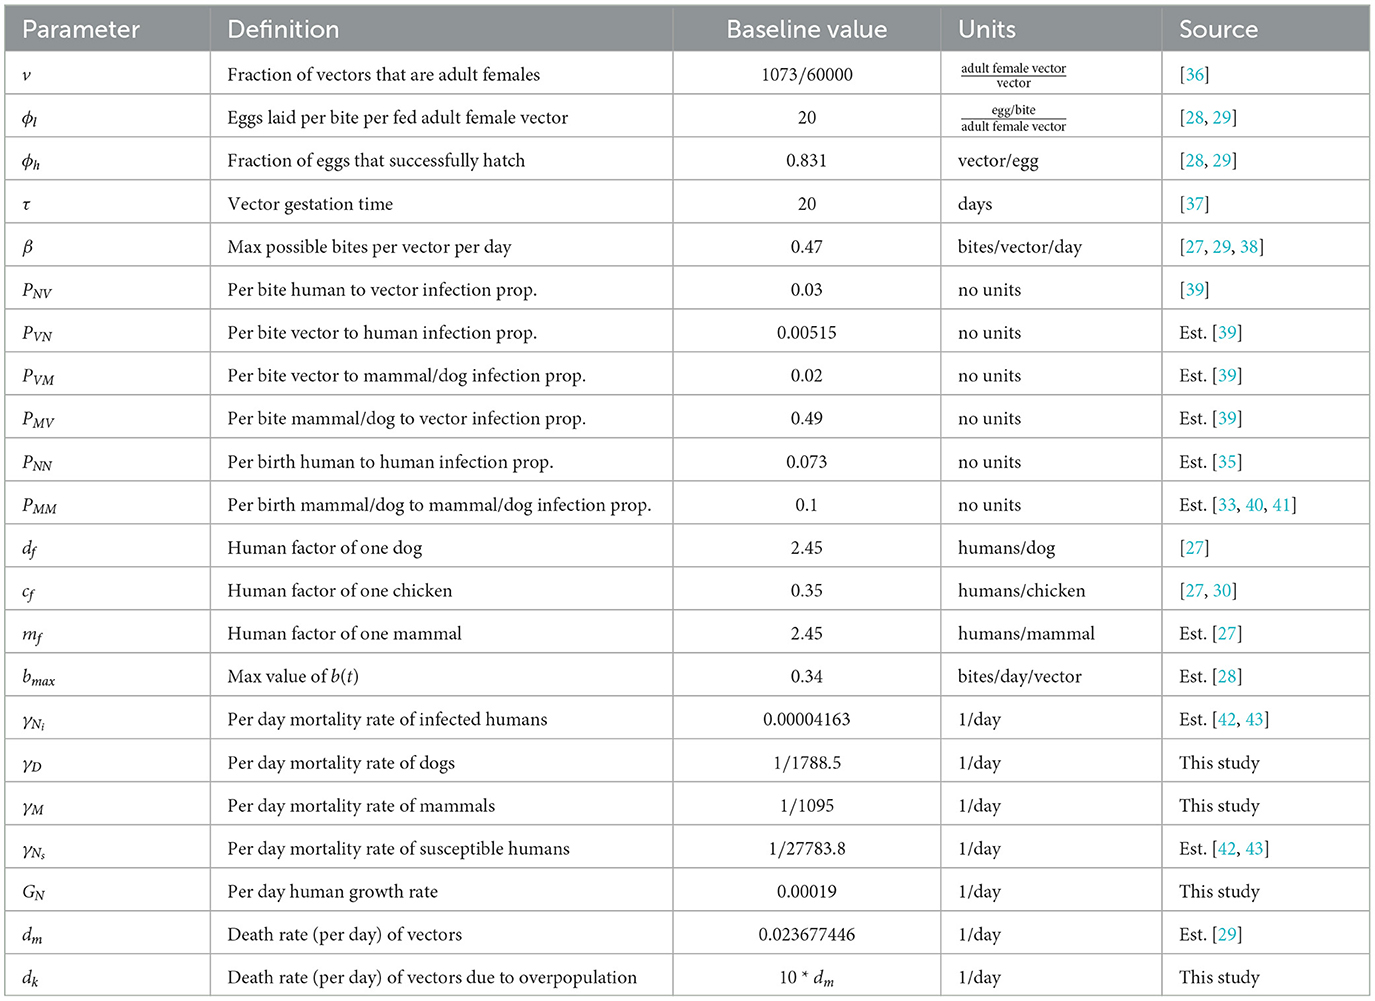
We now establish the baseline parameter values. We separate these values into two categories: those considered to be biological in nature and generally consistent in all villages and those that depend on the structure of the particular collection of villages being modeled. For example, we consider the vector gestation time and the proportion of vector bites that result in a human being affected to be the same in any village, whereas values such as the number of houses in a village and the availability of dogs in the domestic region clearly depend on the particular village in question. The parameter values used are based upon existing data of Chagas disease and the Gran Chaco region when available, but we note that these values have a high degree of aleatory variability and epistemic uncertainty. The constant biological parameters are found in Table 1. We note that the human growth rate GN was chosen so that the total human population grows at an approximate annual rate of 1.0% over the 30 years of simulation. This is consistent with recent population data for Bolivia, Paraguay, and Argentina, the three countries that contain the vast majority of the Gran Chaco region [46–48]. In addition, the infection proportion PVN is unknown, so we choose a value that agrees with the T. cruzi seroprevalence in humans of 51.7% found in surveys in the Bolivian Chaco [9]. The village dependent values are found in Table 2 with citations where the value was chosen based on empirical data.
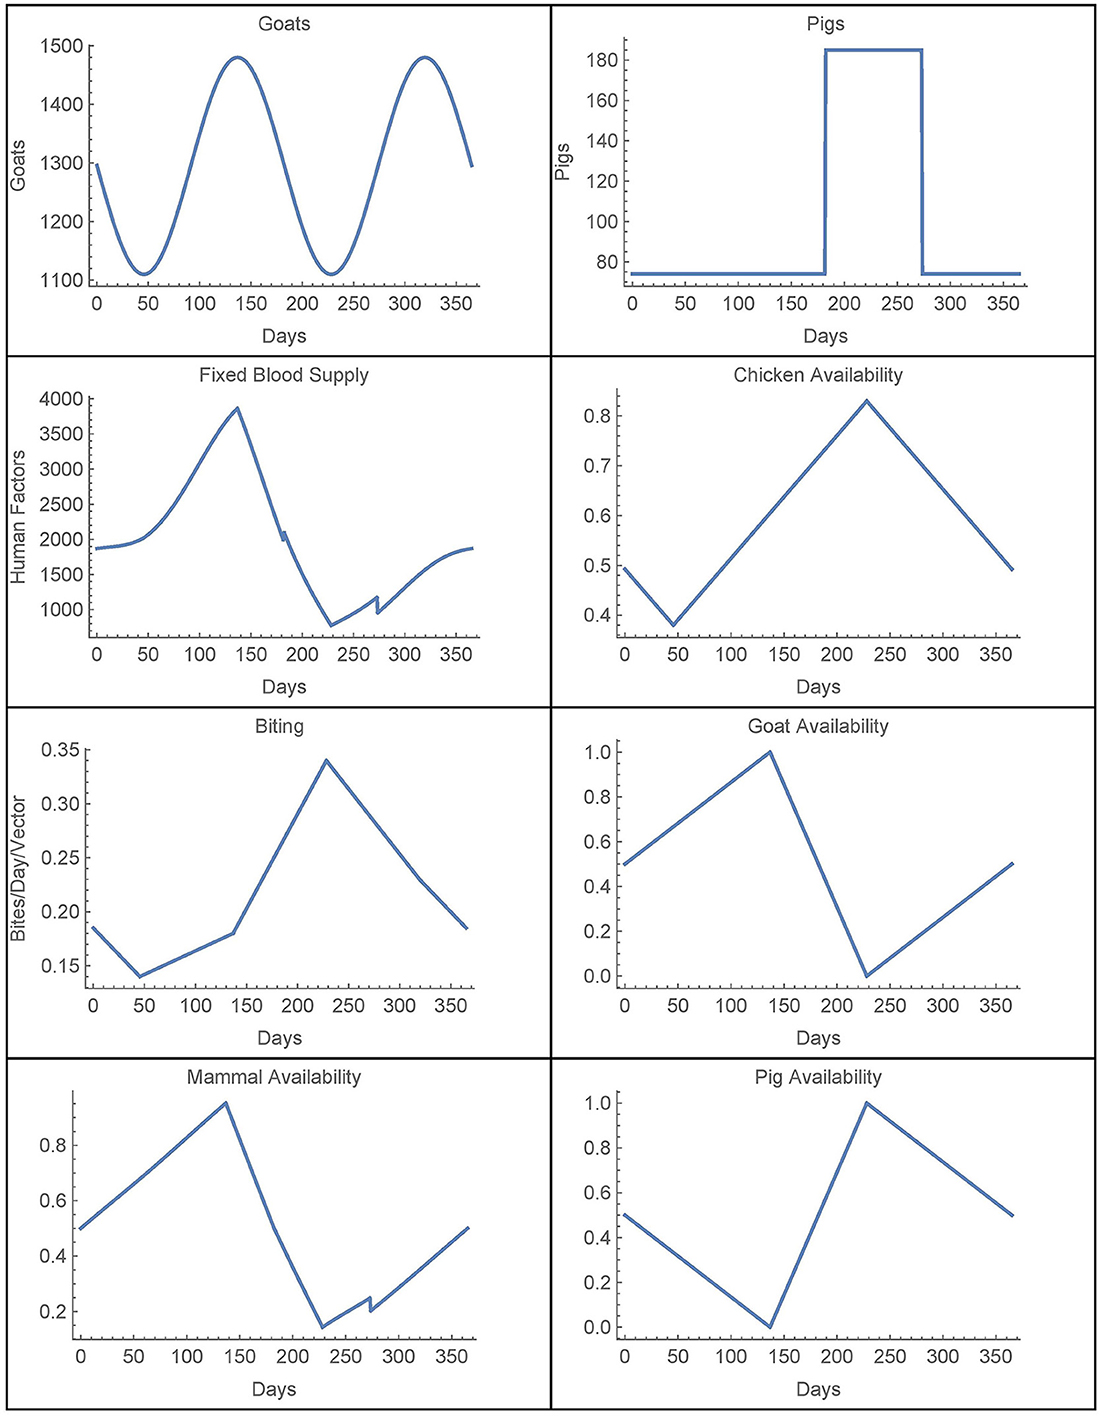
We now consider the time-dependent parameters. Based on data from [28], the number of goats in village j is given by
where Hj is the number of houses in village j, which yields a (smooth) function with a period of half a year. This function is extended periodically. Similarly, the number of pigs is also derived from [28] and it is taken to be yearly periodic. The (smooth) function for the first year is given by
Combining these two functions, we have that
For availability, we first define the total chicken availability aCj(t), goat availability aGj(t), and pig availability aPj(t), all of which are obtained from data in [28]. We use continuous, yearly-periodic, piecewise-linear functions defined by the values listed in Table 3 and shown in Figure 1. We assume that there are an equal number of chickens in the peridomestic region and the domestic region, so we take aCpj(t) = 0.5*aCj(t) for the peridomestic chicken availability and aChj(t) = 0.5*aCj(t) for the domestic availability. We then take aMj(t) to be the weighted average of aPj(t) and aGj(t), yielding
For the biting term, we again use a yearly-periodic piecewise-linear function as defined in Table 3. For the known blood supply, we use
where aC(t) and aM are defined the same as aCj(t) and aMj, and Cknown(t) and Mknown(t) are given by Hknown = 74. Both of these functions are also derived from [28]. Finally, we define a yearly periodic active spraying mortality function, r(t), with the first year given by
with t1 = 212.5, t2 = 303.75, and
as defined in [25]. This corresponds to spraying at t1 with residual effects that diminish until disappearing at t2. We take rj(t) = r(t) in spraying years for village j and rj(t) = 0 otherwise. The time-dependent parameters, with the exception of the active spraying mortality function, are shown over the course of 1 year in Figure 1.
3. Results
We first establish a baseline simulation of two identical villages with the default parameter values. Insecticide spraying occurs in village 1 once per year for 10 consecutive years, there is no insecticide spraying in village 2, and there is no travel or interaction between the two villages. We then compare this simulation to several studies where village 1 is connected through travel with village 2, which can serve as a source of reinfestation. All numerical solutions were obtained using the NDSOLVE numerical differential equations solver in Wolfram Mathematica. Graphs were also produced in Wolfram Mathematica.
3.1. Simulation 0: baseline
For the baseline case with resistant vectors, the simulation is run for 30 years, during which insecticide spraying in village 1 occurs from year 11 to year 20. This is done so that the populations can reach steady oscillations before spraying begins and so that the behavior of the populations before, during, and after insecticide use can be analyzed. The results of this baseline simulation may be seen in Figure 2.
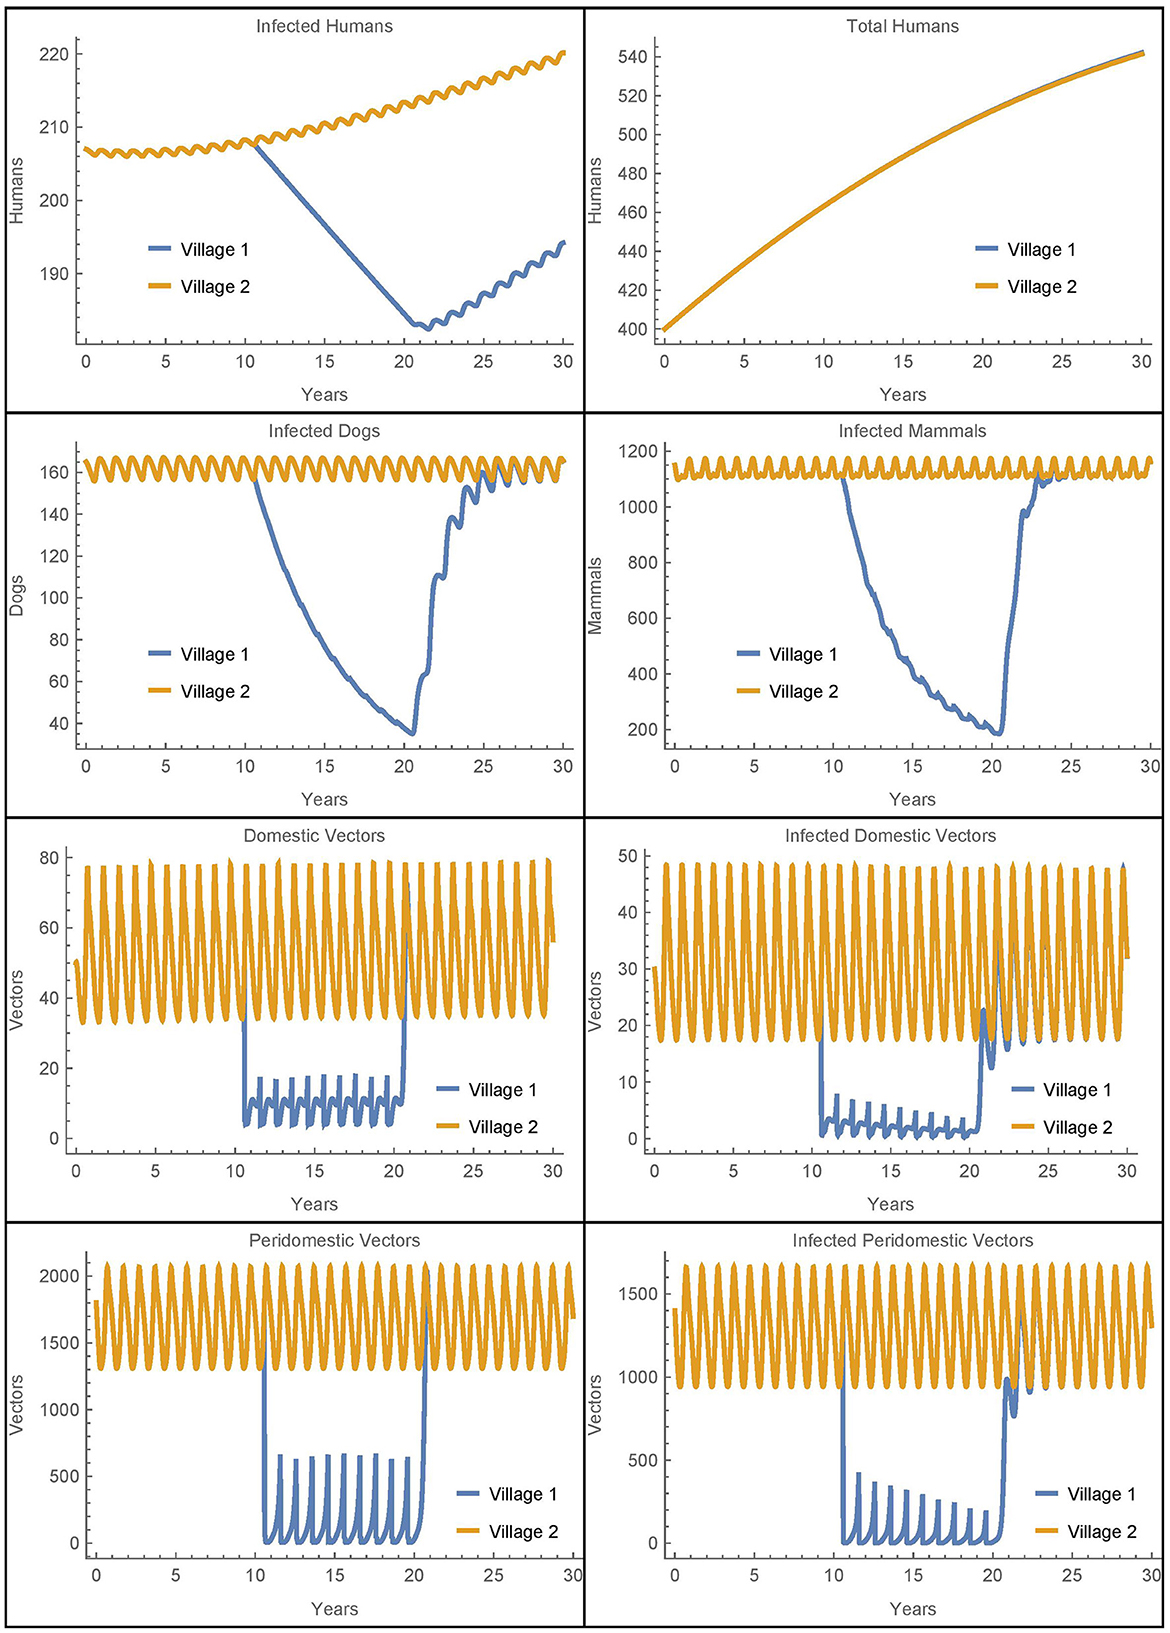
Figure 2. Baseline simulation: the populations of two identical villages with baseline parameters, insecticide spraying only in village 1, and no travel between them.
Before spraying begins, all the non-human populations demonstrate almost steady oscillations. These oscillations continue for the full 30 years in village 2. In village 1, after spraying starts, the vector populations quickly reach new smaller steady oscillations while the infected populations decrease. Once insecticide use stops, the non-human populations rapidly return to the same oscillating patterns that they demonstrated before it began, and the number of infected humans begins to increase again. This is largely in line with the qualitative results found in the baseline simulations in [26], although there is a more noticeable decrease in the infected populations in the current work as a result of the updated parameters.
3.2. Simulation 1: two neighboring villages with travel and vector migration
In this section, we simulate the populations of two villages that are connected by human travel, including the passive transport of vectors. We use the baseline parameters in both villages and include insecticide spraying from year 11 to year 20 only in village 1. This scenario investigates how isolated rural villages with different control measures might affect each other, and in particular, the role village 2 might play as a reinfestation source for village 1. Here we simulate the case where travel between the villages is common, with the average person traveling to the other village once per week (αN1,2 = αN2,1 = 1/7). Additionally, we specify that 10% of the vectors live in luggage or other travel items in the homes. The results are shown in Figure 3.
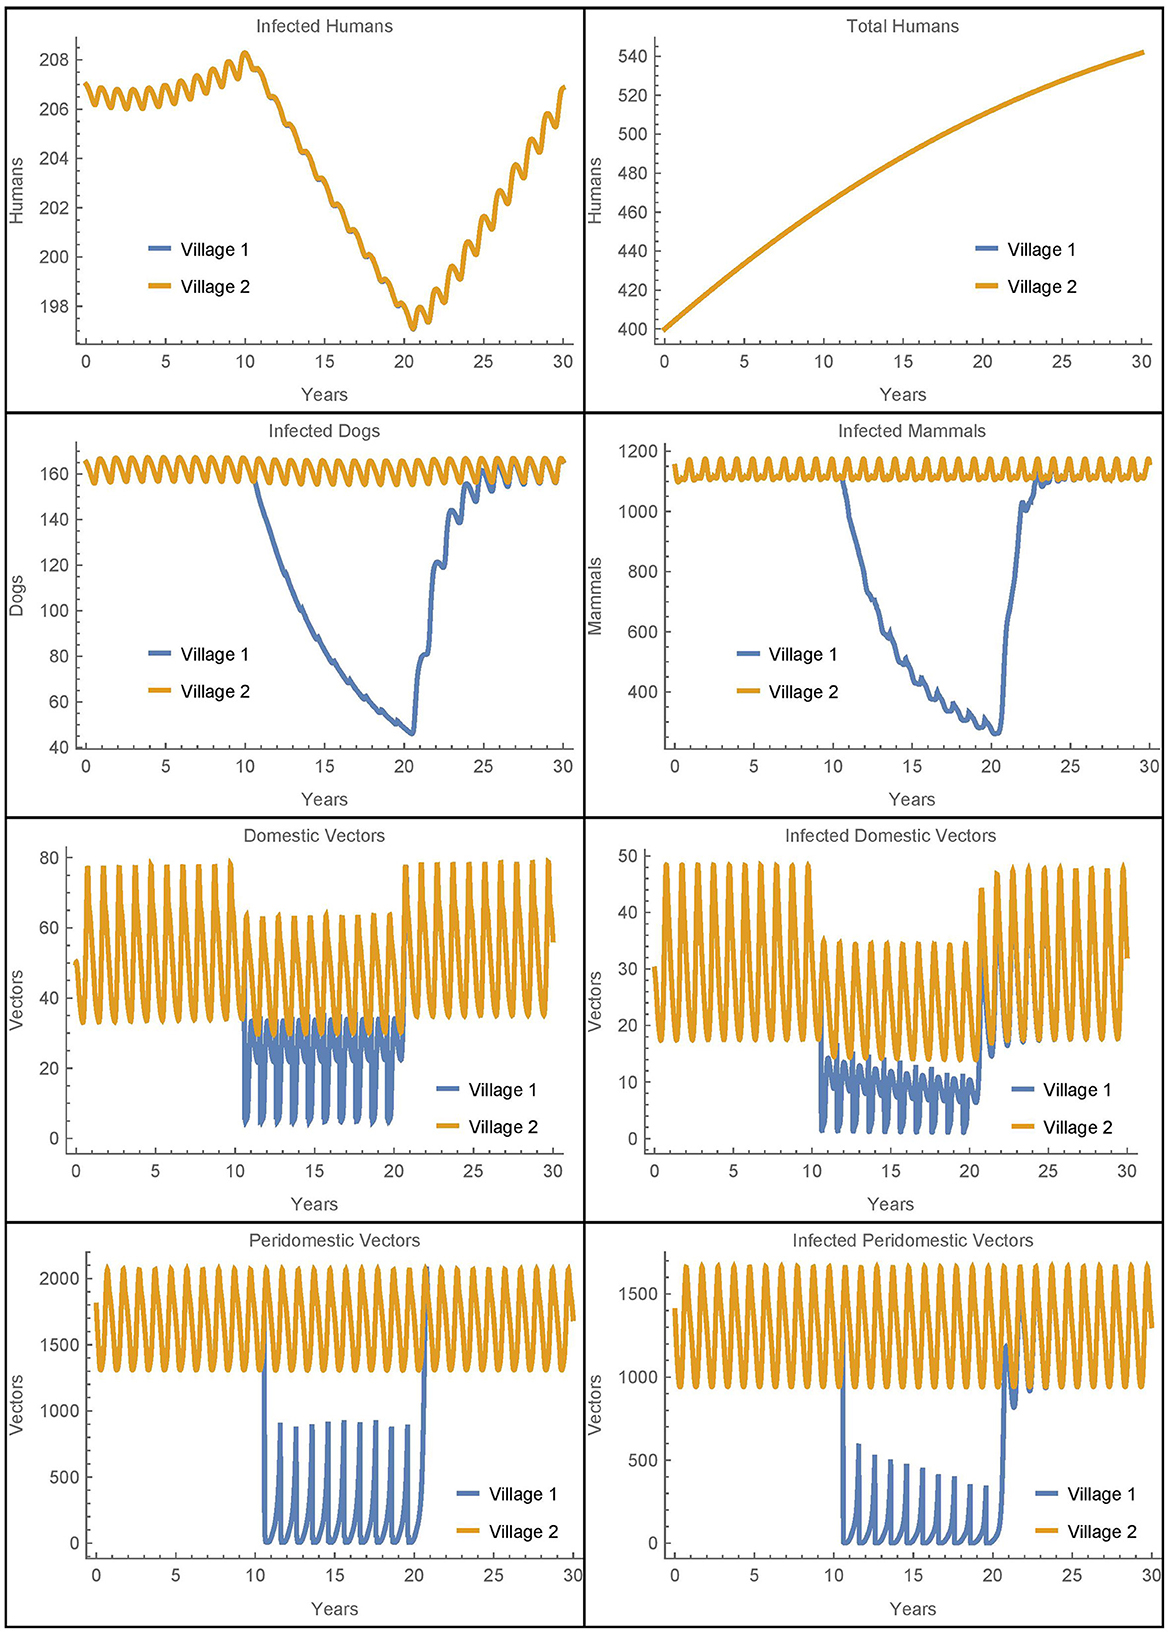
Figure 3. Neighboring villages with human travel and vector migration: the populations of two neighboring villages with human travel and vector transport between them and insecticide spraying only in village 1.
We see that during the spraying years, the domestic vector populations in village 1 and village 2 are higher and lower, respectively, as compared to the baseline case. These changes reflect the mixing of the vector populations in the two villages due to the passive transport of vectors. More strikingly, there is a complete mixing of the human populations between the villages so that they have the same number of infected humans despite the difference in control measures. While the travel between the villages does increase the number of human infections in village 1, it is important to note that the total number of human infections in the two villages after 30 years is identical to the baseline case. That is, the additional infections in village 1 are offset by fewer infections in village 2. Thus, the movement of infected humans and vectors from village 2 to village 1 spreads the disease burden between the villages but does not increase the total number of infected humans.
It is not clear from this simulation to what extent the change in the infected human populations is a result of the humans traveling vs. the vectors being transported. To isolate the effects, we ran a similar simulation with the same level of human travel but with no vector transport. The results for the human populations were identical to those seen in Figure 3 while the rest of the populations had dynamics similar to the baseline case. We see that the transport of vectors has little effect on the number of infected humans when the human populations are mixing at such a high rate. These results were further confirmed in scenarios with much lower rates of human travel. For example, when humans travel once per year between the villages, it takes about 22 years for the two human populations to fully mix, but the overall number of infections remains the same. And, removing vector transport in this case also has no effect on the total number of human infections in either village.
Overall, we see that vector migration is not a significant source of reinfestation in this scenario and that travel redistributes the number of human infections, but does not increase them. The human travel in this scenario is similar to migration as people travel to and stay in the other village. As such, the eventual complete mixing of the populations is likely unrealistic, potentially obscures the differences between the two villages, and does not increase the total number of human infections. Thus, to further investigate the potential effects of vector migration, we will consider in Simulations 2–7 human travel that passively transports the vectors while the humans themselves do not move to the new village. These simulations represent scenarios where humans transport objects containing vectors but do not stay in the other village.
3.3. Simulation 2: two neighboring villages with vector migration
In this section, we simulate the populations of two villages with the same parameters and insecticide spraying as in Simulation 1, but with the travel terms removed from the human equations. That is, we consider the baseline simulation with the addition of passive vector migration but not human travel. The results are shown in Figure 4 where we see that, except for infected humans, all the population dynamics are similar to those in Simulation 1 (Figure 3).
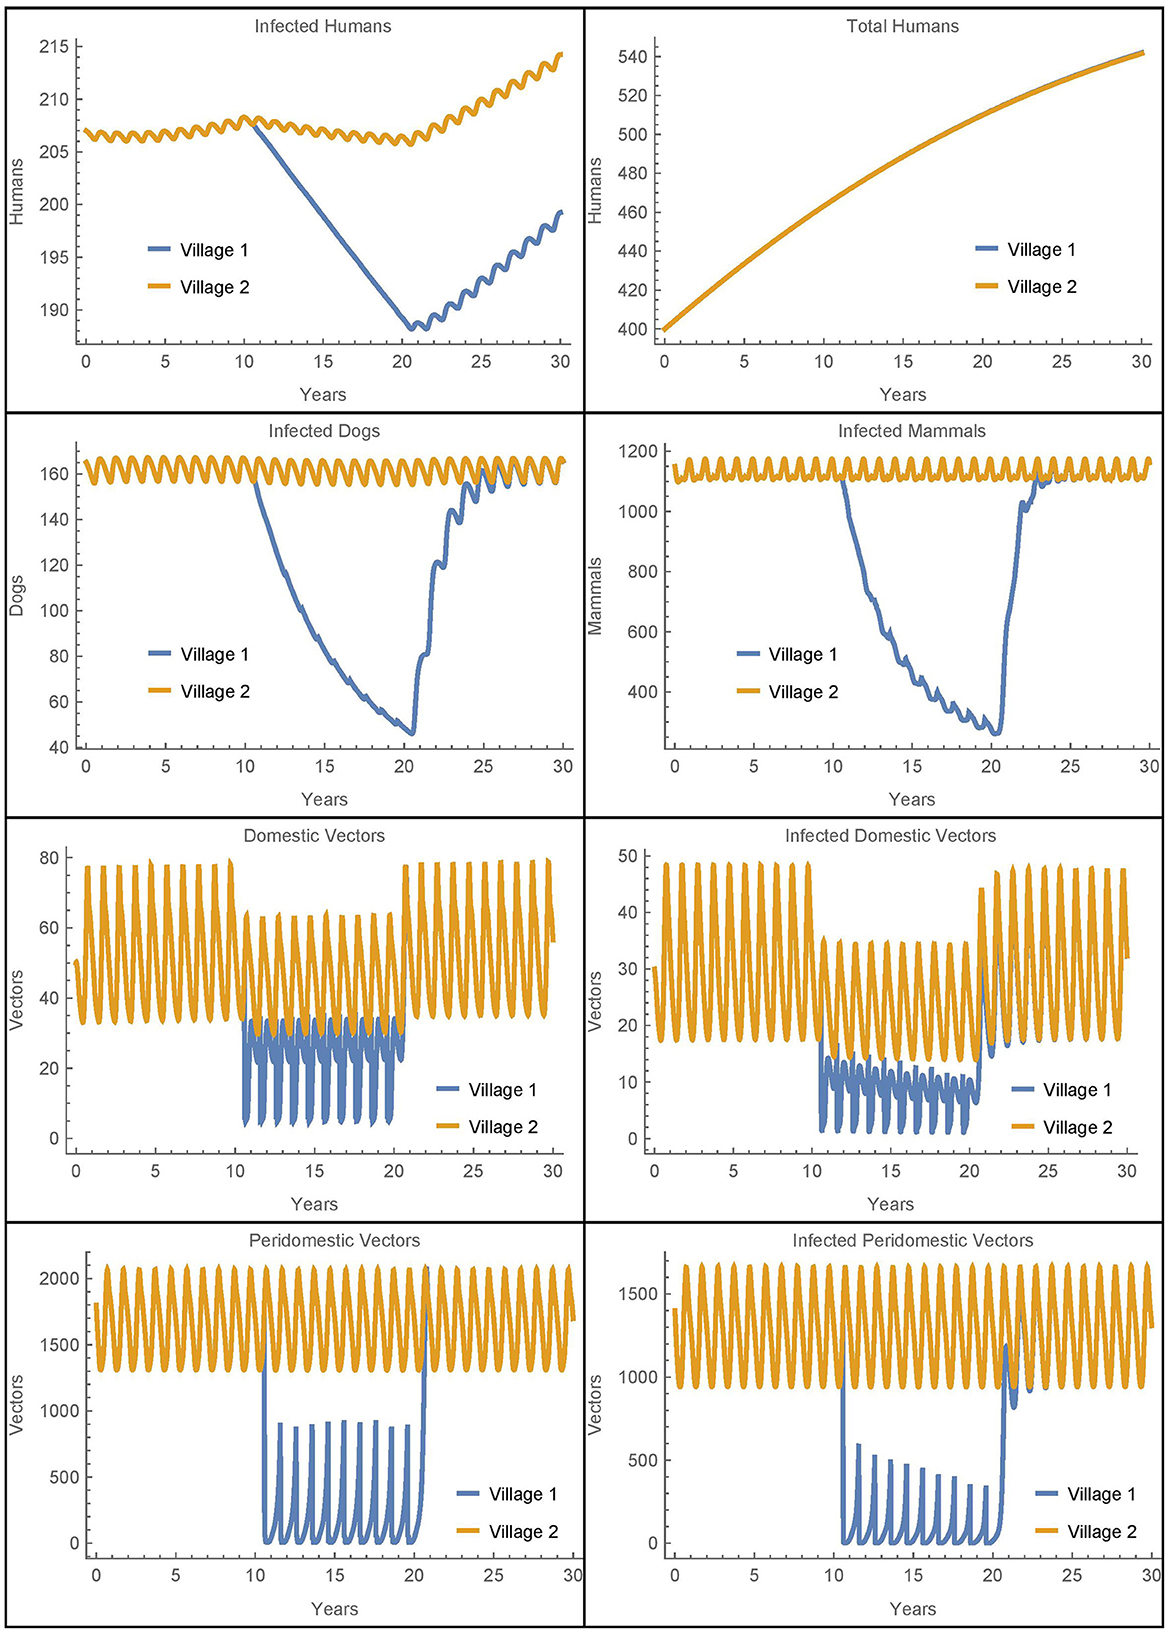
Figure 4. Neighboring villages with passive vector migration: the populations of two neighboring villages with vector transport between them and insecticide spraying only in village 1.
Because we have removed human population mixing, the differences in the number of human infections are attributable solely to the passive transport of vectors. As in Simulation 1, we see more vectors in village 1 during spraying years as compared to the baseline case. These additional vectors in village 1 that come from village 2 do result in five more infected humans in village 1 after 30 years as compared to the baseline. However, there are six fewer infected humans in village 2 in this scenario. So while the disease burden has slightly shifted from village 2 to village 1, the overall effect is small and the number of human infections across both villages remains nearly constant. We see that the transport of vectors does not have a significant impact on human infections in this scenario.
3.4. Simulation 3: two neighboring villages with variable travel parameters
We further investigate the effect of the travel parameters in this section by considering the number of infected humans in both villages after 30 years as a function of PV1,2 = PV2,1 = ηαN1,2. We recall that αNj,k is the daily travel rate of humans from village j to village k and η is the average ratio of vectors that live in the luggage or other travel items. As in Simulation 2, to isolate the effect of vector migration, the humans transport the vectors between villages but do not stay in the other village. All other parameters are held at the baseline values in both villages, with insecticide spraying in village 1, but not in village 2. The results are shown in Figure 5.
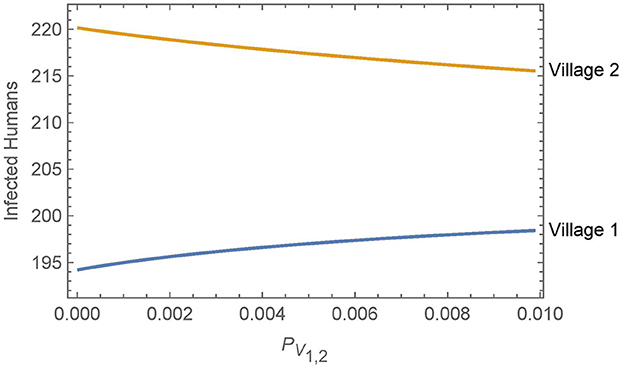
Figure 5. Neighboring villages with variable levels of vector migration: the numbers of infected humans after 30 years in two neighboring villages as a function of the travel parameters. The value of PV1,2 = PV2,1 = ηαN1,2 varies from η = 1% and αN1,2 = 1/year on the low end to η = 10% and αN1,2 = 1/(10 days) on the high end.
Overall, we see that vector migration has a relatively small effect on the infected human populations across a broad range of travel scenarios. Small changes in the travel parameters have negligible effects on the infected human populations and even a change from no travel to high levels of travel and vector transport results in only a handful of additional infections in village 1 after 30 years. Furthermore, any increase in human infections in village 1 is offset by a similar decrease in infections in village 2.
3.5. Simulations 4–5: peridomestic vector migration and other travel scenarios
Next we consider a simulation where vectors may be passively transported from the peridomestic regions of a village in addition to being transported from the homes. In this scenario, vectors may be hiding in materials (e.g., straw, hay, or animal feed) that are transported from the peridomestic region in one village to the peridomestic region in another during agricultural activities. To accomplish this in the model, we modify the equations for the peridomestic vector equations to include transport terms that are analogous to the transport terms in the domestic vector equations. The travel parameters are set to the same level as those in Simulation 2, while all other parameters are at their baseline values and insecticide spraying occurs only in village 1. As in Simulations 2–3, the humans transfer terms are removed from the equations, though the humans still transport the vectors. The results are shown in Figure 6.
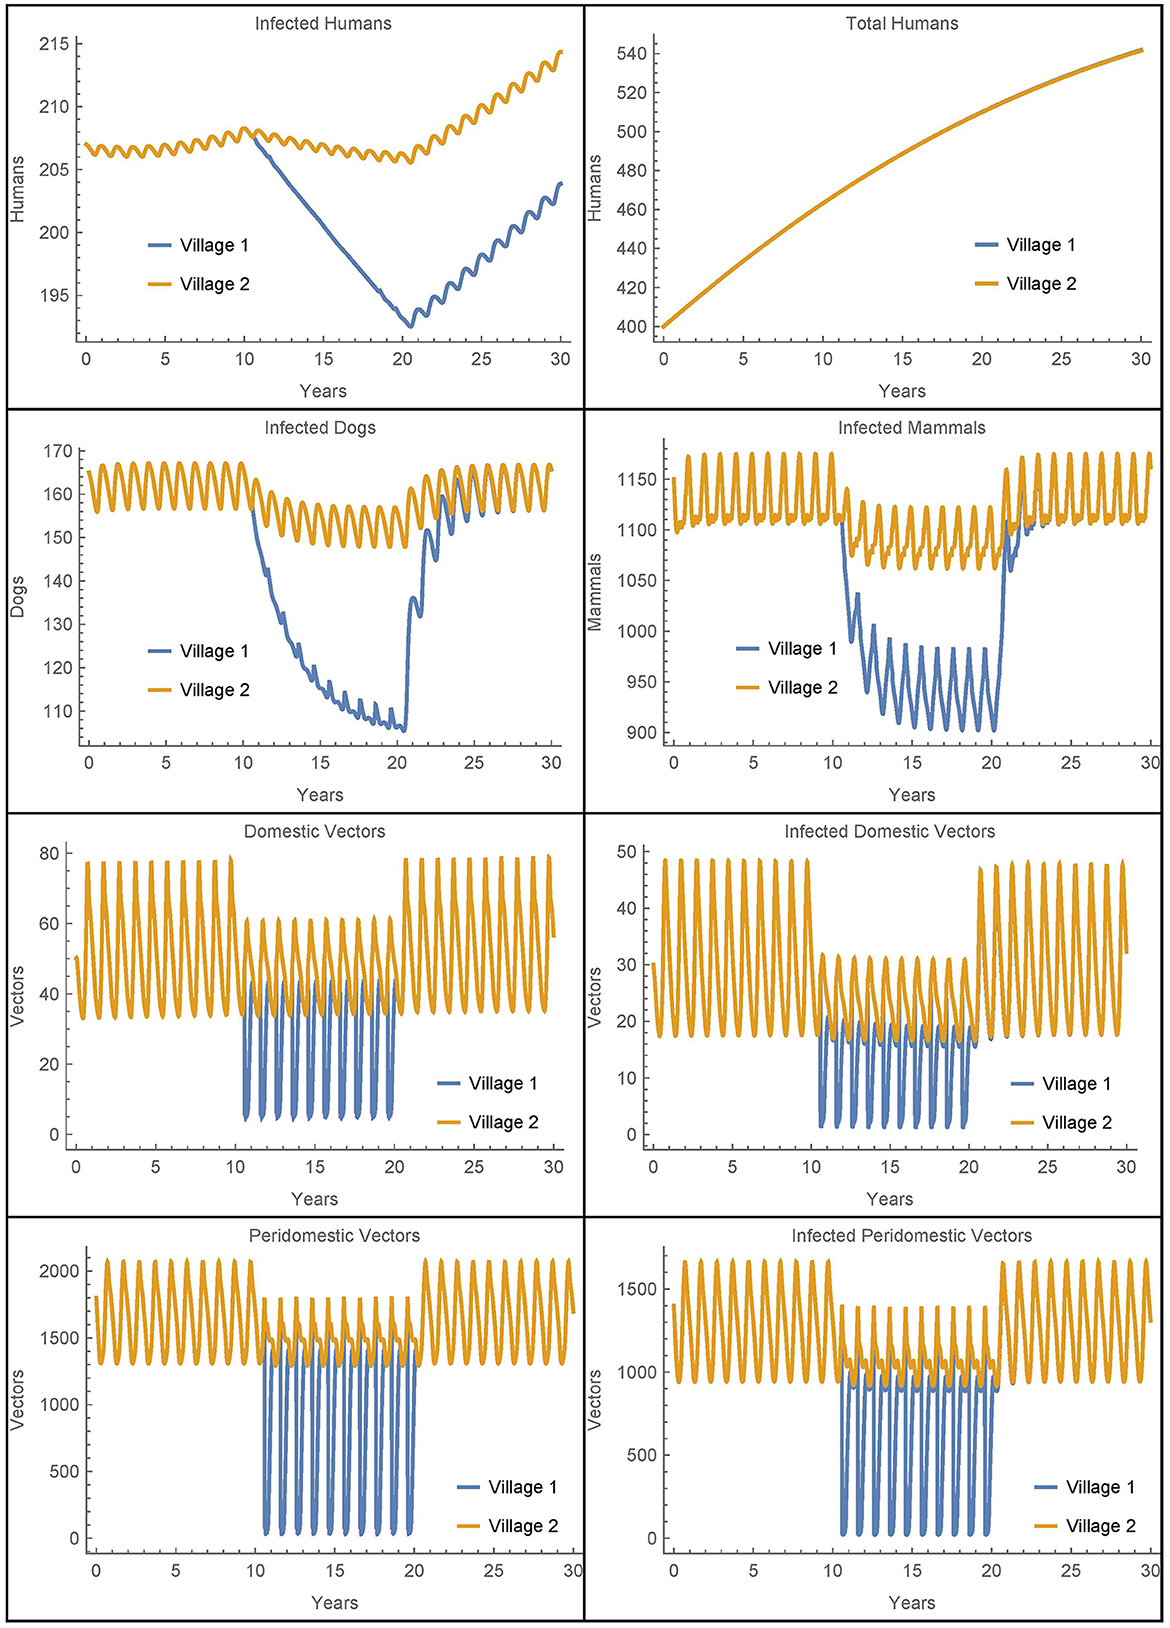
Figure 6. Neighboring villages with domestic and peridomestic vector migration: the populations of two neighboring villages with domestic and peridomestic vector transport between them and insecticide spraying only in village 1.
As expected, we now see a mixing of the peridomestic vectors, just as we saw with the domestic vectors in Figures 3, 4. Additionally, we see differences in the infected dog and infected mammals populations as compared to those in Figures 3, 4, where there was no peridomestic vector transport. The decline and rebound of the infected human population is qualitatively similar to those in Figure 4, though the rebound after spraying ceases is more pronounced. After 30 years, the number of people infected in village 1 is about nine higher than the baseline case and four higher than Simulation 2, the case with only domestic vector transport. Notably, the number of infected humans in village 2 does not decline to offset the increase in village 1, but rather stays about the same as in Simulation 2. Nevertheless, the total infected humans across both villages is only four higher than the baseline case.
We ran additional simulations to see if other differences between the villages might affect the role that vector migration plays. We first considered the size of village 2, allowing village 1 to be connected to a smaller or larger village by varying the number of houses in village 2 from 40 to 145. We then considered the number of infected humans after 30 years using different rates of domestic vector migration. We did not include peridomestic vector migration or the transfer of humans between the populations. All other parameters are held at the baseline values in both villages, with insecticide spraying only in village 1.
When vector migration is low (αN1,2 = αN2,1 = 1/365 and η = 0.01), the number of infected humans in village 1 is essentially independent of the number of houses in village 2, varying by less than a single person over the whole range of house values in village 2. We then increased the travel parameters to their values from Simulation 2, see Figure 7. In this case, the number of humans infected after 30 years increases by about thirty people over the whole range of house values in village 2. This suggests that the size of the neighboring village with no insecticide spraying may be a significant factor in determining the effects of vector migration in spreading the disease.
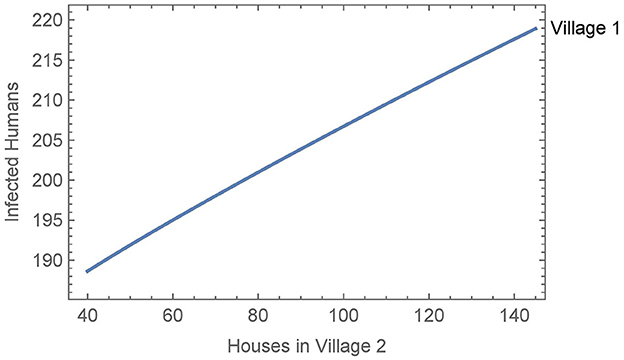
Figure 7. Neighboring villages with variable number of houses in village 2: the number of infected humans after 30 years in village 1 as a function of the number of houses in village 2 with vector migration between them.
Finally, we ran a similar simulation where we allowed the use of bed nets in village 2 to vary from 0% to 100% effectiveness. In both high and low vector migration scenarios, the use of bed nets in village 2 had no meaningful effect on the number of infected people in village 1. Overall, we see under a variety of circumstances that vector migration plays only a minor role in the spread of infection, except when there is substantial travel to a nearby larger village.
3.6. Simulations 6–7: low infection scenarios
In the preceding scenarios where infected populations are already established, travel and vector migration has had only a secondary or marginal effect on the dynamics. Accordingly, in this section we consider scenarios where infections in village 1 are very low so that travel can play a potentially larger role in reintroducing infected vectors.
First, we modify Simulation 2 so that initially in village 1, there are no infected animals or vectors, only infected humans. We modify the corresponding susceptible populations so that the total populations are initially the same and leave the initial human populations, infected and susceptible, as in the baseline case. All other parameters are set to their baseline values, the travel parameters are as in Simulation 2, and insecticide spraying occurs only village 1. The results are shown in Figure 8 where they are contrasted with an otherwise identical scenario that involves no travel between the two villages.
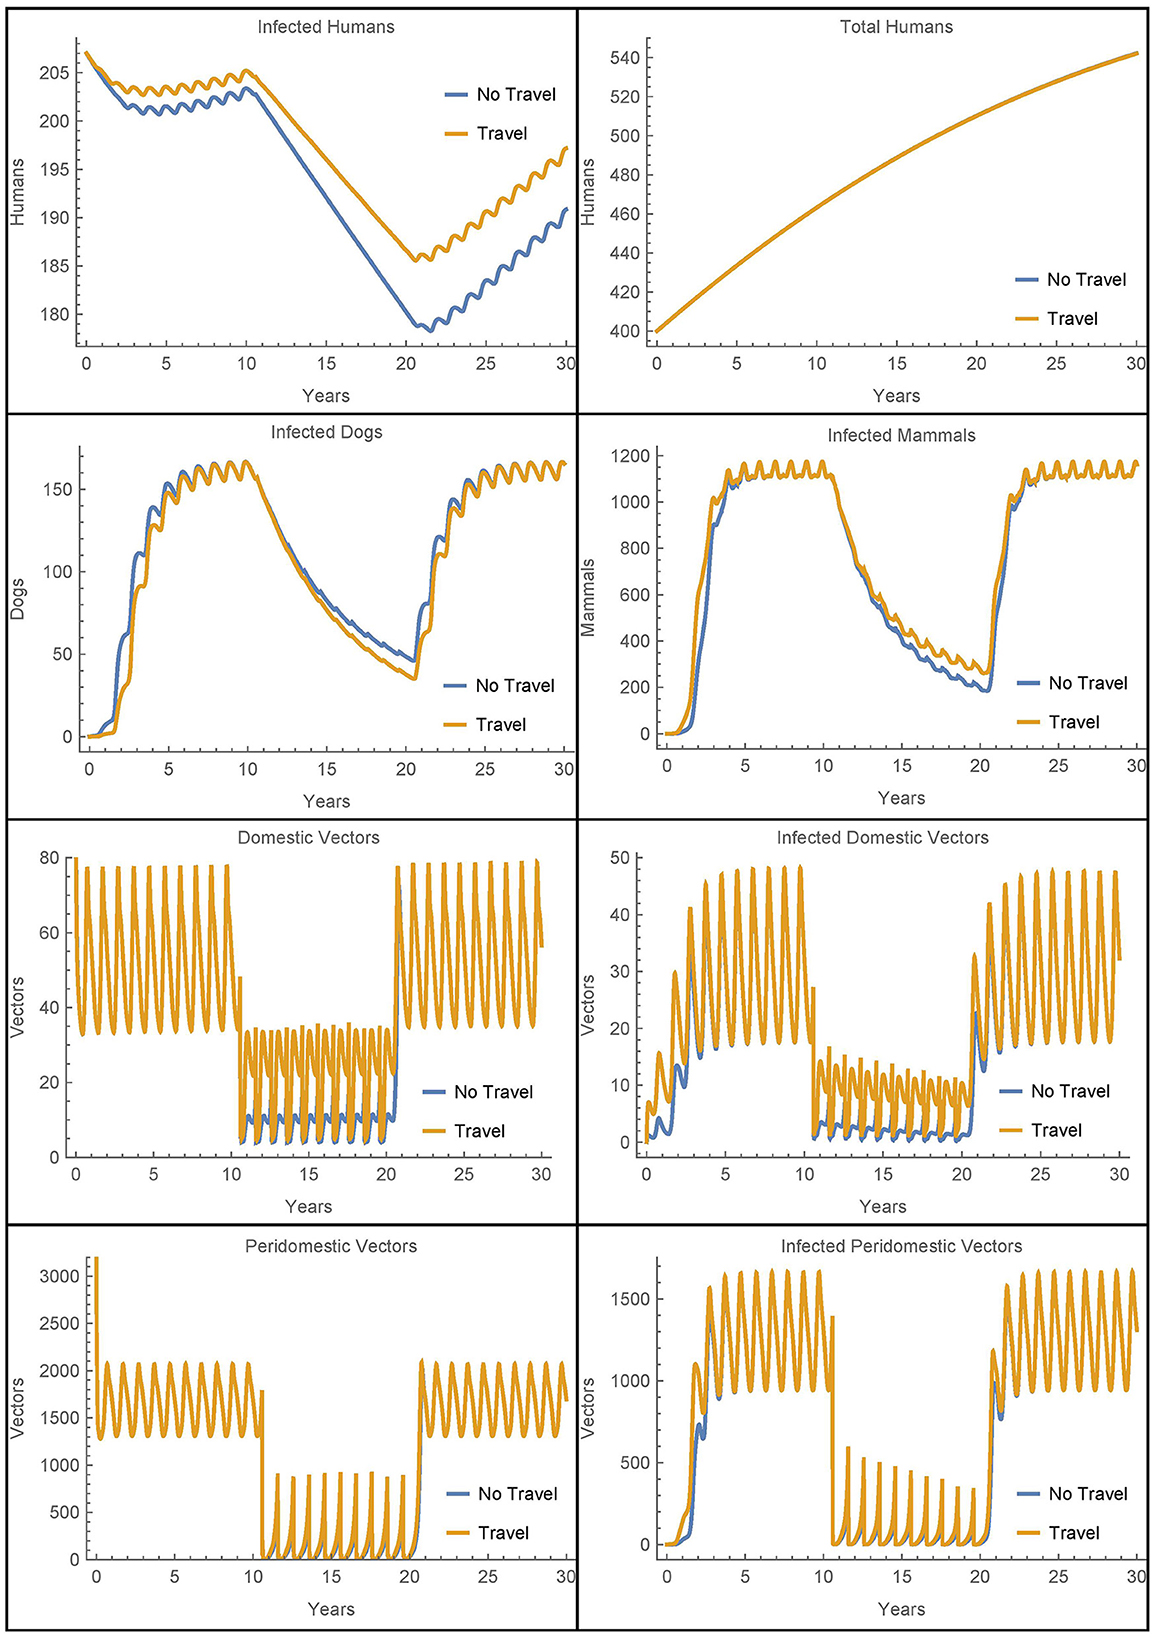
Figure 8. Village 1 with no infected animals or vectors: the populations of village 1, with and without travel to village 2, when only humans are initially infected.
We see that in this extreme scenario, the reinfestation of village 1 caused by the transport of vectors from village 2 does increase the number of infected humans above the level of infection that would occur without the travel between the villages. However, we see that in both cases the other infected populations rebound within a few years and the vector migration from village 2 results in fewer than seven additional human infections at the 30 year mark.
Next, we modify the above scenario so that there are no infected animals or humans initially in village 1 and adjust the susceptible populations accordingly to maintain the same total values at time 0. The travel parameters are set much lower to αN1,2 = αN2,1 = 1/365 and η = 0.01. Also, notably we do not include insecticide spraying in either village. The results are shown in Figure 9.
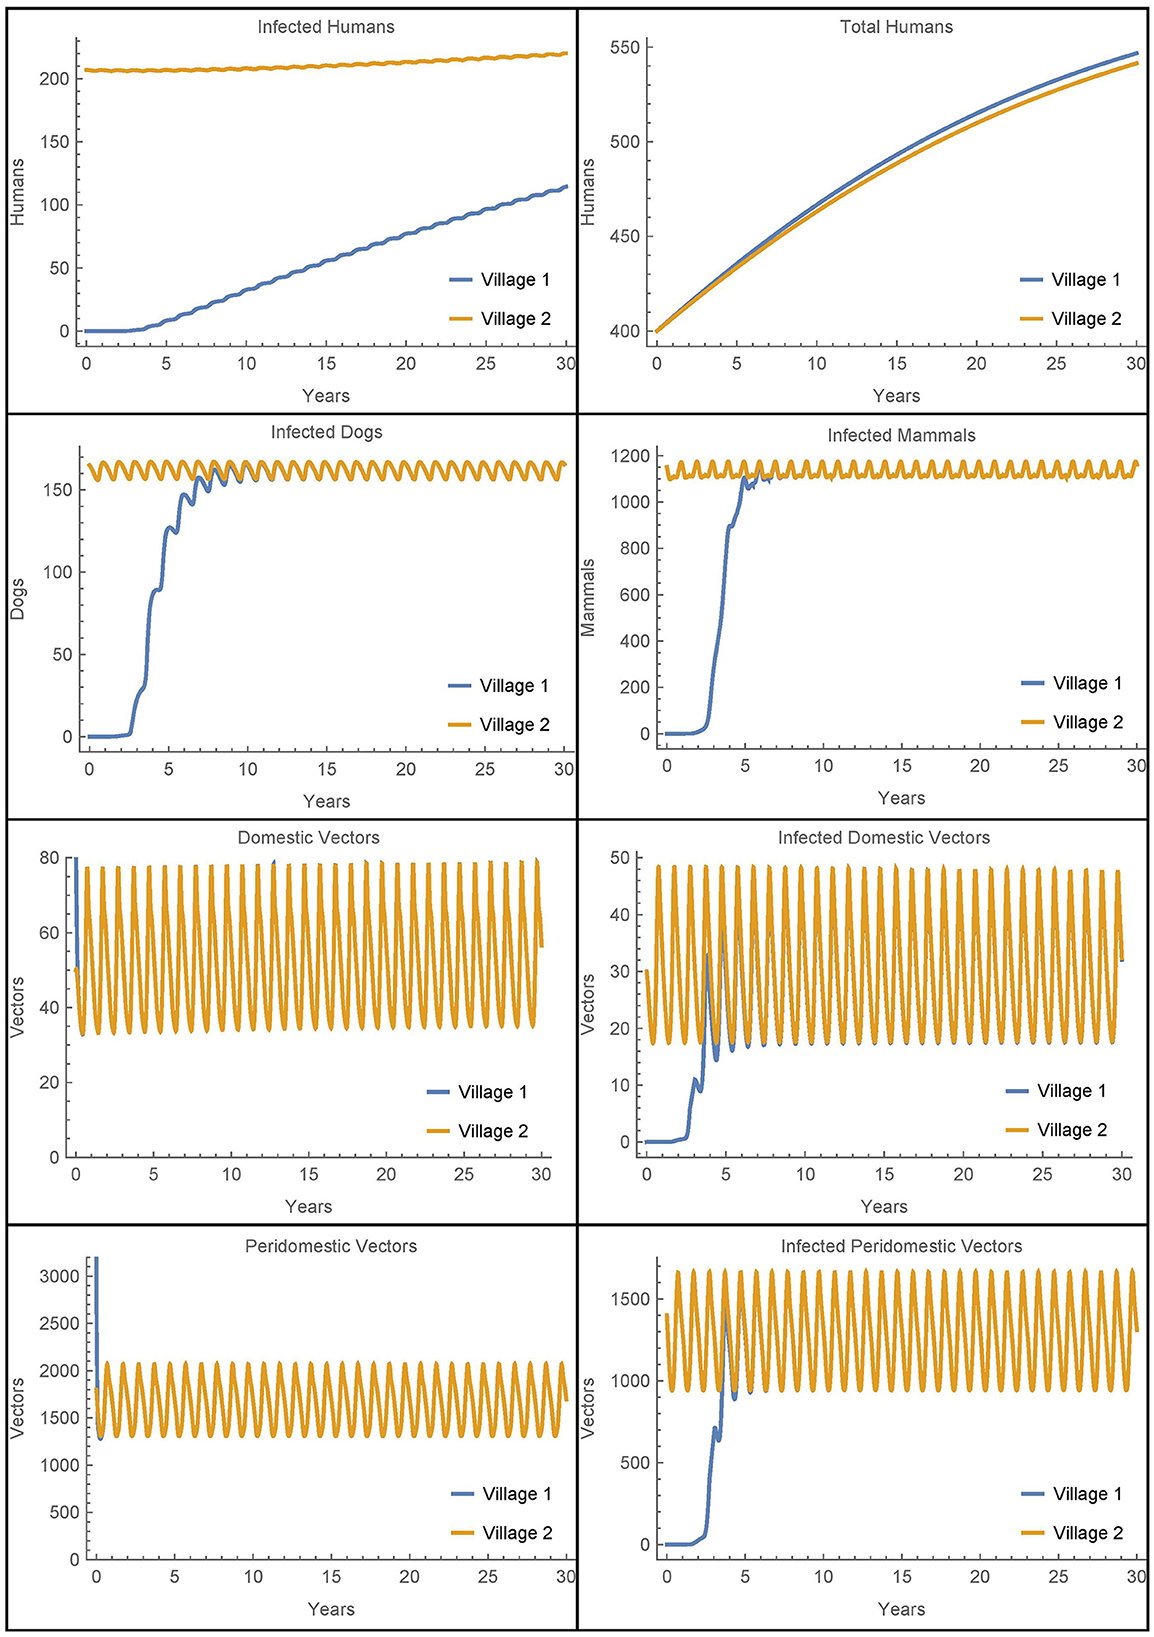
Figure 9. Vector migration to a disease-free village: the populations of two neighboring villages, one which is initially infection-free, with low levels of vector migration between them and no insecticide spraying.
As expected, the introduction of infected vectors from village 2 leads to an eventual explosion of infection throughout all populations in village 1. The infected vector populations reach steady levels within about 5 years and the dogs and mammals reach steady levels soon thereafter. Even though the travel between the villages is very low, within 30 years, around 20% of the humans in village 1 are infected. However, we note that if travel with village 2 is entirely removed from this last scenario and instead we introduce a single infected vector in the domicile at time 0, we get nearly identical dynamics and a slightly higher number of infected humans after 30 years. It is clear that once the infection is introduced from any source, it is the local dynamics in the village that drive the further infection in the village and not the ongoing reinfestation of vectors through transport.
3.7. Simulations 8–9: resistance
Finally, we look at the sensitivity of the baseline simulation to the number of resistant vectors in the village. Figure 10 depicts the number of infected humans after 30 years in a single, unconnected village as a function of the number of resistant vectors Vres = Wres. All other parameters are set to their baseline values and insecticide spraying occurs from year 11 to year 20, as in the baseline simulation.
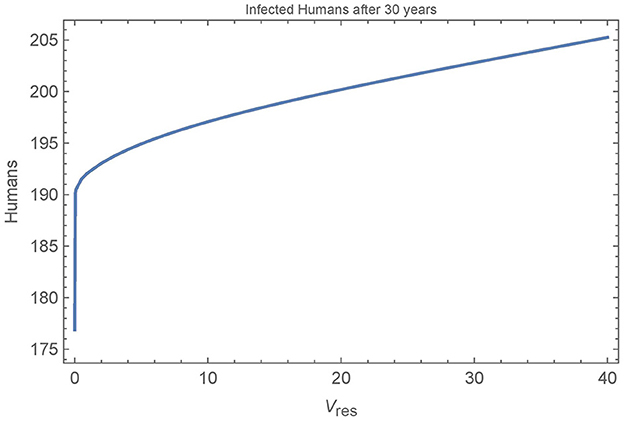
Figure 10. Resistant vectors in a single village: the number of infected humans in a single village after 30 years as a function of the number of resistant vectors Vres = Wres. All other parameters are set to their baseline values.
We see that the first resistant vector has a substantial impact on human infections, leading to 16 more infections after 30 years. And, as expected, more resistant vectors leads to more infected humans, though at a decreasing rate. Figure 11 shows all the populations in the village in the extreme cases of 0, 1, and 40 resistant vectors. When there are no resistant vectors, the total number of vectors approaches zero during spraying years and does not recover for at least 5 years after spraying. However, with only a single resistant vector, the vector populations are able to rebound quickly to pre-spraying levels with 1–2 years. Additional resistant vectors lead to a quicker rebound of vector populations, but not significantly. Indeed, the presence of any resistant vectors allows the vector populations to rebound quickly.
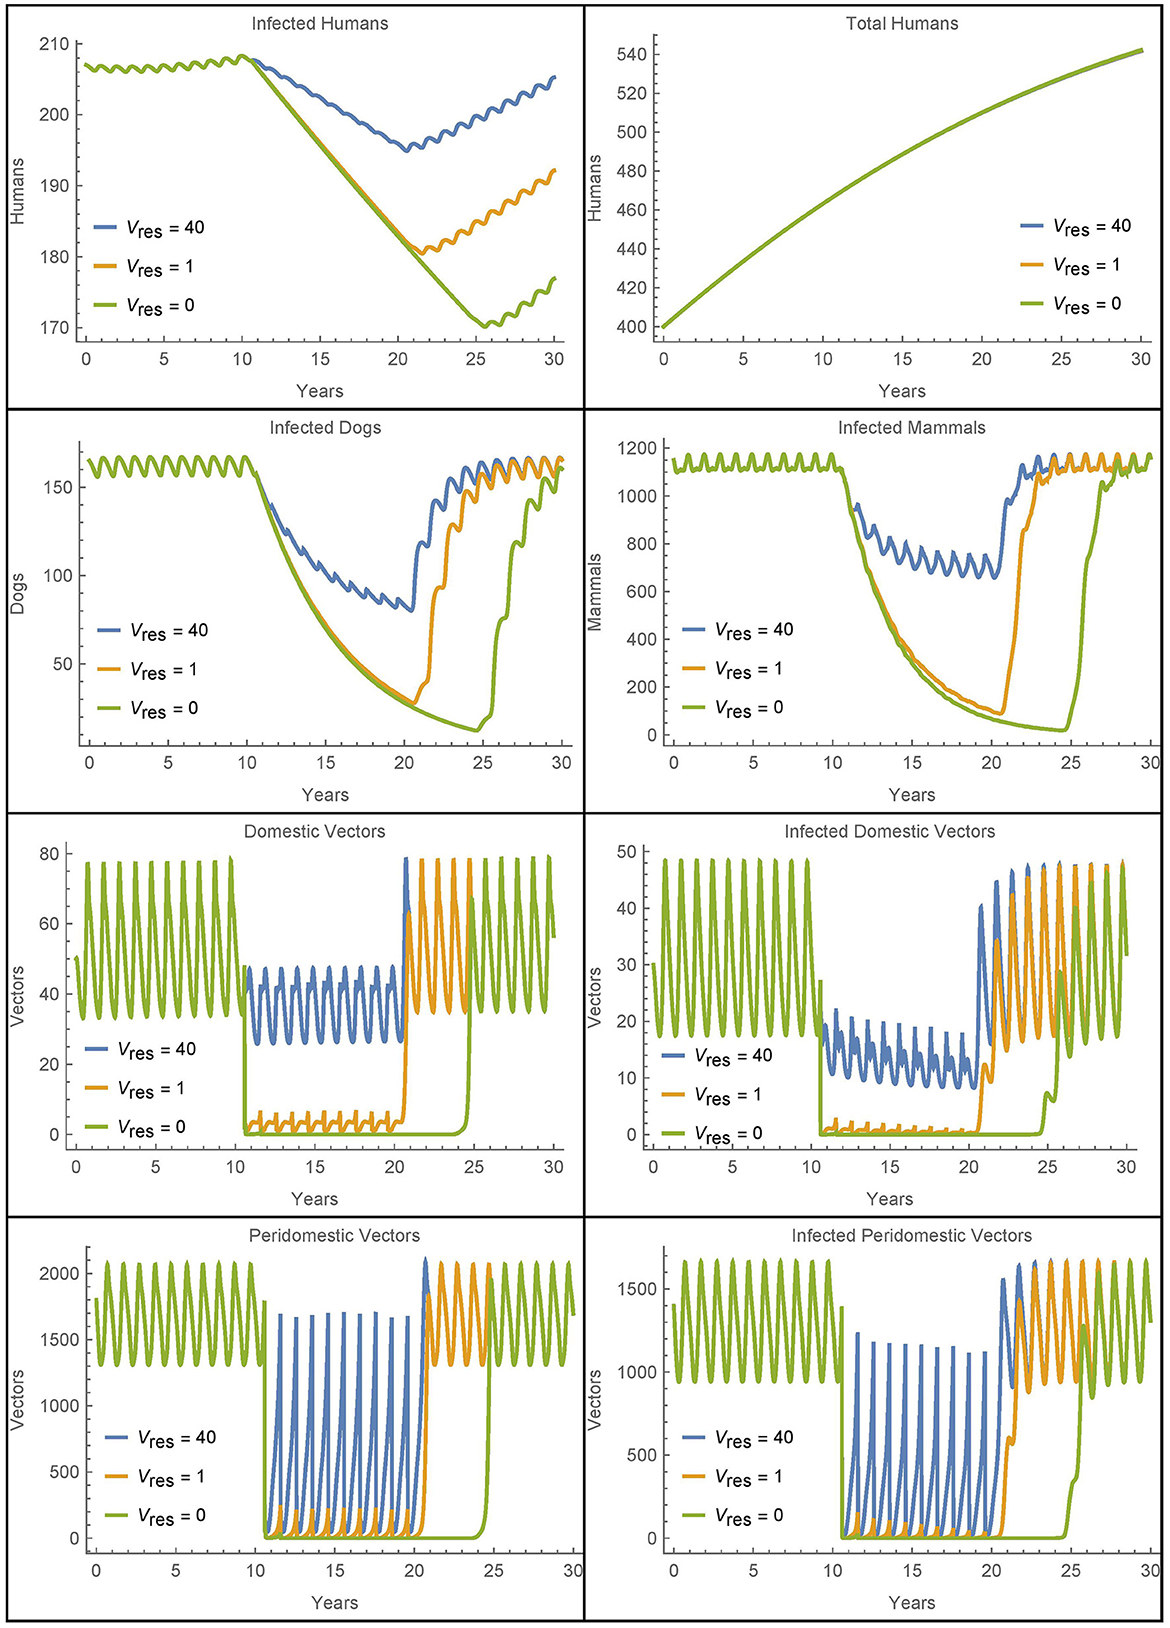
Figure 11. Resistant vectors in a single village: the populations in a village in different cases for the number of resistant vectors Vres = Wres.
Figure 11 also shows increased human infections with Vres = 40 as compared to Vres = 1, but this is due almost entirely to the sustained higher level of vectors during the spraying years, and not due to a quicker rebound of vector populations.
4. Discussion
In this work, we expand existing Chagas disease models by including novel travel and transport terms, allowing for the investigation of potentially significant infection dynamics due to travel and the exploration of relevant control strategies. In particular, the simulations seek to analyze the effects of travel and vector migration between two rural villages, one with insecticide spraying and the other with lax control methods and corresponding higher infection levels. However, these simulations suggest that human travel and the passive transport of vectors is unlikely to play a significant role in Chagas disease dynamics in rural villages.
Simulations 1 and 2 demonstrate that travel has only marginal effects on the total number of infected humans even when there is weekly travel between the villages. Simulation 3 further shows that the total number of human infections changes very little over a wide range of travel and vector migration parameters. Additionally, allowing for peridomestic vector migration does further increase the number of infected humans after 30 years in the village with spraying, but the increase remains below 3% and the net increase in both villages is under 2%. If, however, the village with no insecticide spraying is much larger than the one with spraying, and there is substantial travel between the two, then the village with spraying can see a marked increase in humans infections after 30 years as compared to the case with no travel. Otherwise, we see that the effects on human infections of travel and vector migration between villages are likely secondary across a wide range of scenarios.
Simulation 6 shows that travel and vector transport could play a role in reintroducing infected vectors into a village with no infected animals or vectors, though this scenario is unlikely. Nevertheless, and most importantly, it is not the ongoing travel that causes an eventual spike in infections. Rather, it is the introduction of any infection, in a vector or otherwise, that eventually leads to elevated infection levels in all populations, as seen in Simulation 7. Ultimately, the most significant role of travel is in introducing T. cruzi into an infection-free village. But once introduced, travel becomes relatively insignificant and local dynamics dominate. Given the nature of travel between villages and the endemic nature of Chagas disease, it is unlikely that control strategies related to travel will yield meaningful benefit.
We also considered the effects of insecticide resistance on the disease dynamics. Simulations 8 and 9 show that any insecticide resistance, even a single vector, can notably increase the number of human infections over 30 years by allowing the vector population to quickly rebound to pre-spraying levels once insecticide spraying ceases. Additionally, a large number of resistant vectors can further increase human infections by keeping vector numbers relatively high even during times of insecticide spraying.
Overall, these simulations suggest that human travel and passive vector migration between rural villages are not significant sources of reinfestation in the Gran Chaco. Control measures should instead focus on other reinfestation sources like sylvatic foci or domestic foci that survive insecticide spraying. A possible, unlikely exception would be the case when travel or migration is from areas where Chagas disease is endemic to areas where it is not, for example, from rural communities to urban ones [49]. Such a scenario could be considered in future work but would require significant modeling changes as the model here specifically considers travel between rural villages, which have quite different transmission dynamics than urban settings.
Data availability statement
The original contributions presented in the study are included in the article/supplementary material, further inquiries can be directed to the corresponding author.
Author contributions
DC, AS, RC, and GS contributed to the conception and design of the study. RC performed preliminary simulations and wrote the first draft of the manuscript. DC performed the final simulations and substantially revised the draft to incorporate changes in the model and results. All authors contributed to the article and approved the submitted version.
Conflict of interest
The authors declare that the research was conducted in the absence of any commercial or financial relationships that could be construed as a potential conflict of interest.
Publisher's note
All claims expressed in this article are solely those of the authors and do not necessarily represent those of their affiliated organizations, or those of the publisher, the editors and the reviewers. Any product that may be evaluated in this article, or claim that may be made by its manufacturer, is not guaranteed or endorsed by the publisher.
References
2. Bilate AM, Cunha-Neto E. Chagas disease cardiomyopathy: current concepts of an old disease. Rev Inst Med Trop São Paulo. (2008) 50:67–74. doi: 10.1590/S0036-46652008000200001
3. WHO. Chagas Disease (American trypanosomiasis). WHO. Available online at: https://www.who.int/news-room/questions-and-answers/item/chagas-disease
4. Bonney KM. Chagas disease in the 21st century: a public health success or an emerging threat? Parasite. (2014) 21:11. doi: 10.1051/parasite/2014012
5. Dias JC, Silveira AC, Schofield CJ. The impact of Chagas disease control in Latin America: a review. Mem Inst Oswaldo Cruz. (2002) 97:603–12. doi: 10.1590/S0074-02762002000500002
6. Gurtler RE. Sustainability of vector control strategies in the Gran Chaco Region: current challenges and possible approaches. Mem Inst Oswaldo Cruz. (2009) 104(Suppl 1):52–9. doi: 10.1590/S0074-02762009000900009
7. Gurtler RE, Kitron U, Cecere MC, Segura EL, Cohen JE. Sustainable vector control and management of Chagas disease in the Gran Chaco, Argentina. Proc Natl Acad Sci USA. (2007) 104:16194–9. doi: 10.1073/pnas.0700863104
8. Lucero RH, Bruses BL, Cura CI, Formichelli LB, Juiz N, Fernandez GJ, et al. Chagas' disease in Aboriginal and Creole communities from the Gran Chaco Region of Argentina: Seroprevalence and molecular parasitological characterization. Infect Genet Evol. (2016) 41:84–92. doi: 10.1016/j.meegid.2016.03.028
9. Samuels AM, Clark EH, Galdos-Cardenas G, Wiegand RE, Ferrufino L, Menacho S, et al. Epidemiology of and impact of insecticide spraying on Chagas disease in communities in the Bolivian Chaco. PLoS Negl Trop Dis. (2013) 7:e2358. doi: 10.1371/journal.pntd.0002358
10. CDC. Parasites - American Trypanosomiasis (also known as Chagas Disease). CDC. Available online at: https://www.cdc.gov/parasites/chagas/index.html
11. Bern C, Montgomery SP. An estimate of the burden of Chagas disease in the United States. Clin Infect Dis. (2009) 49:e52–4. doi: 10.1086/605091
12. Bern C, Montgomery SP, Katz L, Caglioti S, Stramer SL. Chagas disease and the US blood supply. Curr Opin Infect Dis. (2008) 21:476–82. doi: 10.1097/QCO.0b013e32830ef5b6
13. Cucunuba ZM, Okuwoga O, Basanez MG, Nouvellet P. Increased mortality attributed to Chagas disease: a systematic review and meta-analysis. Parasit Vec. (2016) 9:42. doi: 10.1186/s13071-016-1315-x
14. Roellig DM, Ellis AE, Yabsley MJ. Oral transmission of Trypanosoma cruzi with opposing evidence for the theory of carnivory. J Parasitol. (2009) 95:360–4. doi: 10.1645/GE-1740.1
15. Cecere MC, Vasquez-Prokopec GM, Gurtler RE, Kitron U. Reinfestation sources for Chagas disease vector, Triatoma infestans, Argentina. Emerg Infect Dis. (2006) 12:1096–102. doi: 10.3201/eid1207.051445
16. Ceballos LA, Piccinali RV, Marcet PL, Vazquez-Prokopec GM, Cardinal MV, Schachter-Broide J, et al. Hidden sylvatic foci of the main vector of Chagas disease Triatoma infestans: threats to the vector elimination campaign? PLoS Negl Trop Dis. (2011) 5:e1365. doi: 10.1371/journal.pntd.0001365
17. Cecere MC, Vazquez-Prokopec GM, Gurtler RE, Kitron U. Spatio-temporal analysis of reinfestation by Triatoma infestans (Hemiptera: Reduviidae) following insecticide spraying in a rural community in northwestern Argentina. Am J Trop Med Hyg. (2004) 71:803–10. doi: 10.4269/ajtmh.2004.71.803
18. Rojas de Arias A, Messenger LA, Rolon M, Vega MC, Acosta N, Villalba C, et al. (2022) Dynamics of Triatoma infestans populations in the Paraguayan Chaco: population genetic analysis of household reinfestation following vector control. PLoS ONE 17: e0263465. doi: 10.1371/journal.pone.0263465
19. Bustamante Gomez M, Goncalves Diotaiuti L, Gorla DE. Distribution of pyrethroid resistant populations of Triatoma infestans in the southern cone of South America. PLoS Negl Trop Dis. (2016) 10:e0004561. doi: 10.1371/journal.pntd.0004561
20. Picollo MI, Vassena C, Santo Orihuela P, Barrios S, Zaidemberg M, Zerba E. High resistance to pyrethroid insecticides associated with ineffective field treatments in Triatoma infestans (Hemiptera: Reduviidae) from Northern Argentina. J Med Entomol. (2005) 42:637–42. doi: 10.1093/jmedent/42.4.637
21. Coffield DJ, Kuttler K, Qu X, Rabinovich J, Shillor M, Spagnuolo A, et al. Model for the transmission of Chagas disease with random inputs. Biomath. (2014) 3:1–16. doi: 10.11145/j.biomath.2014.11.071
22. Coffield DJ, Spagnuolo A. Steady state stability analysis of a Chagas disease model. Int J Math Models Biosci. (2014) 3:1–13. doi: 10.11145/j.biomath.2014.05.261
23. Coffield DJ, Spagnuolo AM, Shillor M, Mema E, Pell B, Pruzinsky A, et al. A model for Chagas disease with oral and congenital transmission. PLoS ONE. (2013) 8:e67267. doi: 10.1371/journal.pone.0067267
24. Spagnuolo AM, Shillor M, Kingsland L, Thatcher A, Toeniskoetter M, Wood B. A logistic delay differential equation model for Chagas disease with interrupted spraying schedules. J Biol Dyn. (2012) 6:377–94. doi: 10.1080/17513758.2011.587896
25. Spagnuolo AM, Shillor M, GA S. A model for Chagas disease with controlled spraying. J Biol Dyn. (2011) 5:299–317. doi: 10.1080/17513758.2010.505985
26. Spagnuolo AM, Coffield DJ, Carigan A, Hee-Jin Corcoran A, Van Loo B, Shillor M, et al. Carignan AM, et al. A mathematical model of Chagas disease dynamics in the Gran Chaco Region. J Coupled Syst Multiscale Dyn. (2015) 3:177–99. doi: 10.1166/jcsmd.2015.1078
27. Gurtler RE, Cecere MC, Lauricella MA, Cardinal MV, Kitron U, Cohen JE. Domestic dogs and cats as sources of Trypanosoma cruzi infection in rural northwestern Argentina. Parasitology. (2007) 134(Pt 1):69–82. doi: 10.1017/S0031182006001259
28. Ceballos LA, Vazquez-Prokopec GM, Cecere MC, Marcet PL, Gurtler RE. Feeding rates, nutritional status and flight dispersal potential of peridomestic populations of Triatoma infestans in rural northwestern Argentina. Acta Trop. (2005) 95:149–59. doi: 10.1016/j.actatropica.2005.05.010
29. Castanera M, Gurtler RE. A stage-structured stochastic model of the population dynamics of Triatoma infestans, the main vector of Chagas disease. Ecol Modell. (2003) 162:33–53. doi: 10.1016/S0304-3800(02)00388-5
30. Gurtler RE, Ceballos LA, Ordonez-Krasnowski P, Lanati LA, Stariolo R, Kitron U. Strong host-feeding preferences of the vector Triatoma infestans modified by vector density: implications for the epidemiology of Chagas disease. PLoS Negl Trop Dis. (2009) 3:e447. doi: 10.1371/journal.pntd.0000447
31. Gurtler RE, Cohen JE, Cecere MC, Chuit R. Shifting host choices of the vector of Chagas disease, Triatoma infestans, in relation to the availability of host in houses in North-West Argentina. J Appl Ecol. (1997) 34:699–715.
32. Stevens L, Dorn PL, Schmidt JO, Klotz JH, Lucero D, Klotz SA. Kissing bugs. The vectors of Chagas. Adv Parasitol. (2011) 75:169–92. doi: 10.1016/B978-0-12-385863-4.00008-3
33. Gurtler RE, Segura EL, Cohen JE. Congenital transmission of Trypanosoma cruzi infection in Argentina. Emerg Infect Dis. (2003) 9:29–32. doi: 10.3201/eid0901.020274
34. Kirchhoff LV. Chagas disease (American Trypanosomiasis). Infect Dis Clin North Am. (1999) 7:487–502.
35. Munoz J, Coll O, Juncosa T, Verges M, del Pino M, Fumado V, et al. Prevalence and vertical transmission of Trypanosoma cruzi infection among pregnant Latin American women attending 2 maternity clinics in Barcelona, Spain. Clin Infect Dis. (2009) 48:1736–40. doi: 10.1086/599223
36. Gurtler RE, Cecere MC, Fernandez MdelP, Vazquez-Prokopec GM, Ceballos LA, Gurevitz JM, et al. Key source habitats and potential dispersal of Triatoma infestans populations in Northwestern Argentina: implications for vector control. PLoS Negl Trop Dis. (2014) 8:e3238. doi: 10.1371/journal.pntd.0003238
37. Dias JC. Southern Cone Initiative for the elimination of domestic populations of Triatoma infestans and the interruption of transfusional Chagas disease. Historical aspects, present situation, and perspectives. Mem Inst Oswaldo Cruz. (2007) 102(Suppl 1):11–8. doi: 10.1590/S0074-02762007005000092
39. Cohen JE, Gurtler RE. Modeling household transmission of American trypanosomiasis. Science. (2001) 293:694–8. doi: 10.1126/science.1060638
40. Kribs-Zaleta C. Estimating contact process saturation in sylvatic transmission of Trypanosoma cruzi in the United States. PLoS Negl Trop Dis. (2010) 4:e656. doi: 10.1371/journal.pntd.0000656
41. Kribs-Zaleta CM. Alternative transmission modes for Trypanosoma cruzi. Math Biosci Eng. (2010) 7:657–73. doi: 10.3934/mbe.2010.7.657
42. Rassi A, Rassi A, Marin-Neto JA. Chagas heart disease: pathophysiologic mechanisms, prognostic factors and risk stratification. Mem Inst Oswaldo Cruz. (2009) 104(Suppl 1):152–8. doi: 10.1590/S0074-02762009000900021
43. Agency CIA. CIA World Factbook. (2009). Available online at: https://www.cia.gov/the-world-factbook/countries/argentina/
44. Cerece MC, Canale DM, Gurlter RE. Effects of refuge availability on the population dynamics of Triatoma infestans in central Argentina. J Appl Ecol. (2003) 40:742–56. doi: 10.1046/j.1365-2664.2003.00825.x
45. Cavallo MJ, Amelotti I, Abrahan L, Cueto G, Gorla DE. Rural houses infestation by Triatoma infestans in northwestern Argentina: vector control in a high spatial heterogeneous infestation area. PLoS ONE. (2018) 13:e0201391. doi: 10.1371/journal.pone.0201391
46. Worldometers (2022). Available online at: https://www.worldometers.info/world-population/bolivia-population/
47. Worldometers (2022). Available online at: https://www.worldometers.info/world-population/paraguay-population/
48. Worldometers (2022). Available online at: https://www.worldometers.info/world-population/argentina-population/
Keywords: Chagas disease, delay differential equations, mathematical model, insecticide resistance, vector migration
Citation: Coffield DJ Jr, Spagnuolo AM, Capouellez R and Stryker GA (2023) A mathematical model for Chagas disease transmission with neighboring villages. Front. Appl. Math. Stat. 9:1225137. doi: 10.3389/fams.2023.1225137
Received: 18 May 2023; Accepted: 27 July 2023;
Published: 16 August 2023.
Edited by:
Alain Miranville, University of Poitiers, FranceReviewed by:
María Fabiana Laguna, Bariloche Atomic Centre (CNEA), ArgentinaPankaj Tiwari, University of Kalyani, India
Eric Okyere, University of Energy and Natural Resources, Ghana
Copyright © 2023 Coffield, Spagnuolo, Capouellez and Stryker. This is an open-access article distributed under the terms of the Creative Commons Attribution License (CC BY). The use, distribution or reproduction in other forums is permitted, provided the original author(s) and the copyright owner(s) are credited and that the original publication in this journal is cited, in accordance with accepted academic practice. No use, distribution or reproduction is permitted which does not comply with these terms.
*Correspondence: Daniel J. Coffield Jr., dcoffiel@umich.edu
 Daniel J. Coffield Jr.
 Anna Maria Spagnuolo2
  Gabrielle A. Stryker