Optimal vaccination control for COVID-19 in a metapopulation model: a case of the Philippines
 Randy L. Caga-anan1,2*
  Jead M. Macalisang1,2
  John Lemuel M. Dalisay3
  Michelle N. Raza4
  Joey Genevieve T. Martinez2,5
  Jayrold P. Arcede6
- 1Department of Mathematics and Statistics, MSU-Iligan Institute of Technology, Iligan City, Philippines
- 2Mathematical Biology and Nematology Research Cluster, Complex Systems Group, PRISM, MSU-Iligan Institute of Technology, Iligan City, Philippines
- 3Integrated Provincial Health Office of South Cotabato, South Cotabato, Philippines
- 4Division of Natural Sciences and Mathematics, University of the Philippines Visayas Tacloban College, Tacloban City, Philippines
- 5Department of Biology, MSU-Iligan Institute of Technology, Iligan City, Philippines
- 6Department of Mathematics, Caraga State University, Butuan City, Philippines
We investigate a contextual problem of how to distribute a limited supply of vaccines over a period of time in a country where different regions have its own vaccination capacities. Considering that daily vaccination will affect future disease progression, we aim to find a distribution strategy over time that can minimize the total infection and implementation costs. Lagrangian and Eulerian migrations connect our multi-patch COVID-19 model, and vaccination is added as a control measure. An optimal control problem with an isoperimetric constraint is formulated and solved using the Adapted Forward–Backward Sweep Method. In distributing 5 million vaccines in 50 days, simulations showed that the optimal control strategy could lead to a difference of reducing two hundred thousand infections in just one region.
1. Introduction
The rapid development of COVID-19 vaccines, which began less than a year after the emergence of the SARS-CoV-2 virus, has made vaccination arguably the most effective method for preventing the spread of COVID-19 [1–3]. Despite the numerous problems with the COVID-19 vaccine, global communities applauded its introduction and accelerated mass vaccination. The Philippines have administered 166,138,040 vaccinations as of 8 December 2022 since vaccinations began in March 2021. It includes the first and second doses (71 million and 73 million, respectively) and more than 21 million booster doses administered to frontline workers, senior citizens, and the immunocompromised 1. In the second quarter of 2020–2021, the government's gross domestic product (GDP) increased by 12.1% due to the expansion of economic activities made possible by vaccination mandates and the strengthening of minimum health protocols. This is in stark contrast to the −16.6% GDP recorded at the height of the pandemic [4]. In addition, the unemployment rate decreased from 8.8 percent in 2021 to 6.4 percent in 2022.
By the end of 2022, however, approximately 36 percent of the country's population still remained not fully vaccinated. In some areas of the region, vaccination participation is low. Vaccine hesitancy is endemic in every nation. In the Philippines, the decision to vaccinate can be influenced by differing factors, including individuals (i.e., perceptions of vaccine effectiveness and also inefficiency and inflexibility of the system), the community (i.e., vaccine hesitancy for religious reasons and social networks), and the health system (politics and policy) [5]. On a global level, countries with large vaccine industries reserve their own supplies for their own populations. Moreover, global manufacturing capabilities remain far below what is required, which leads to vaccine politics or global competition over a limited supply. The longer the vaccinations are delayed, the greater the likelihood that new virus strains will emerge and undermine the efficiency of vaccines.
Since the early stages of the pandemic, mathematical modeling has assisted the Philippines in its response, and a number of studies [6–8], including regional ones [9, 10], have been published. In addition, it has been used extensively in many countries to evaluate pandemic control strategies such as lockdown, social distancing, testing, face mask use, and public awareness [11–21].
With the introduction of COVID-19 vaccines, numerous modeling studies on vaccine allocation are available worldwide, based on age or risk group [22–25], space [26], and dose timing [27, 28]. However, there are few mathematical modeling studies on the optimal control of vaccine prioritization against COVID-19 at the regional level. Molla et al. [29] introduced an SEIR-type compartmental model with vaccination that accounts for heterogeneity across age groups and mobility across geographic regions. To optimize the allocation of vaccines in Italy, Lemaitre et al. [30] evaluated a second spatially explicit COVID-19 epidemiological model of the SEIR type, which proposes prioritizing precise targeting over delivery speed to increase the number of doses distributed in provinces where the impact of vaccines is anticipated to be greater.
In light of the fact that the Philippines is an archipelagic nation with vaccine supply and distribution issues, an effective spatial vaccination prioritization strategy must be developed to optimize the use of the limited vaccine supply. Thus, the objective of this paper is to use optimal control theory to determine time-dependent optimal vaccine allocation strategies that could minimize infections with associated intervention costs under various epidemiological scenarios, including mobility, supply level, infected individuals, and vaccination capacity. See our problem setup below.
In support of the “last mile” program of the Philippines, [31], we hope that the findings of this paper will help improve COVID-19 vaccine uptake and reach.
2. Problem setup
There are 17 regions in the Philippines. The nation's vaccine supply arrived in large quantities, and it should be distributed to the regions over a period of time. Since there is definitely a very limited supply, a methodical approach to distributing it over time to the various regions is required. The distribution of the vaccines should minimize both the implementation expenditure and the country's overall risk of infection. Each region has a daily cap on the number of people it can immunize, which restricts the distribution. Additionally, it is conceivable that each day that vaccines are administered will impact the disease's progression in the following days. One may consider using a linear program right at the beginning of the distribution. This, however, will not be able to take the effects of vaccination over time into account. One option is to use a dynamic linear program to solve it every day while also resolving how the disease develops in relation to the impact of vaccinations from the day before. This is technically feasible but very computationally demanding. Here, we demonstrate how to use optimal control theory to address these constraints and resolve the distribution problem, with an emphasis on the Philippines.
We do not intend to evaluate the vaccination policy choices made by the Philippine government in this article. With the constraints and goal discussed above, this study aims to demonstrate the viability of using mathematical optimization, more specifically optimal control theory, to resolve the distribution problem.
3. Mathematical model
In [32], a modeling concept of the progression of COVID-19 disease was presented. This modeling concept serves as the basis for the base model, which represents a single region. The structure of the model makes it possible to estimate the hidden untested infection figure, which is also sometimes referred to as the dark figure of the pandemic. This estimate can be obtained by using the model. Instead of having a separate compartment for the vaccinated people in this study, we incorporate the effect of vaccination by the flow from the susceptible to the removed compartment. This allows us to account for the full scope of the phenomenon. During the process of applying the base model to every region of the country, we take into account the possibility that some infected individuals may travel between regions, which has the effect of influencing the transmission rate of the regions.
The population in region i is divided into four compartments: Susceptible (Si), Infected (Ii), Tested positive (Ti), and Removed (Ri). The natural birth and death rates, as well as the effect of reinfection, are not accounted for in the model because the simulations used in this study are conducted over a relatively short period of time. We denote by N0i the total population in region i. The flowchart of the model is given in Figure 1.
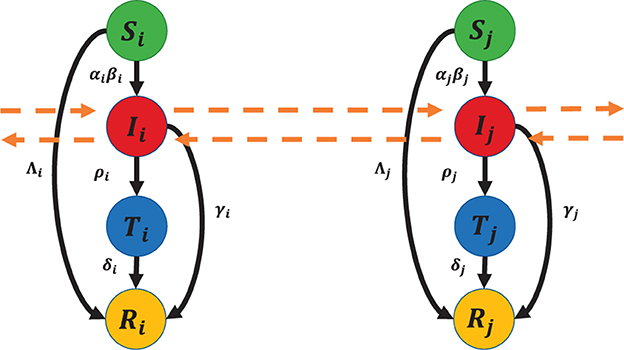
Figure 1. Dynamics within and between patches.
The model is governed by the following system of 4n ordinary differential equations:
For i = 1, 2, ..., n,
where j ∈ {1, 2, ..., n}, β0i = βi/N0i, and . The time domain is only up to time tf, where Λi < Si(tf), for all i = 1, 2, ..., n. The description of the parameters is given in Table 1.
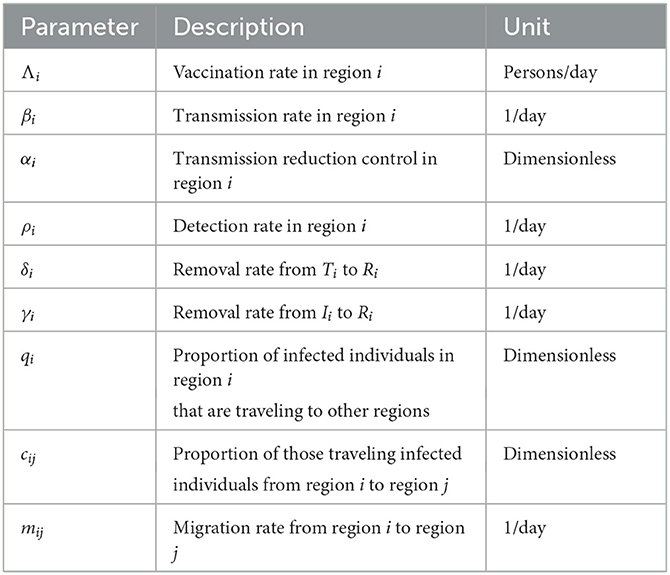
Table 1. Parameters of the model.
4. Parameter values
The Philippines' Department of Health (DOH) has made data on confirmed cases available to the public2, so ethical approval is unnecessary. The parameter calibration was set up with the help of such information. The data spans the period of 1 June 2021 to 31 October 2021. We chose this time frame for our simulations since it represents the Philippines' first notable peak, the vaccination campaign has just recently started to gain traction, and there is a dearth of vaccines. To determine the fitted values for the parameters β, α, ρ, and I0, we minimized a non-linear least squares function that is given by the sum of the squares of the differences between the output of the model and the data. To solve the optimization problem, the Levenberg-Marquardt algorithm and approximate Bayesian computation are used [33–35]. This was done for every region. The results are presented in Table 2, where the last column displays the relative error of the fitting technique for each region.
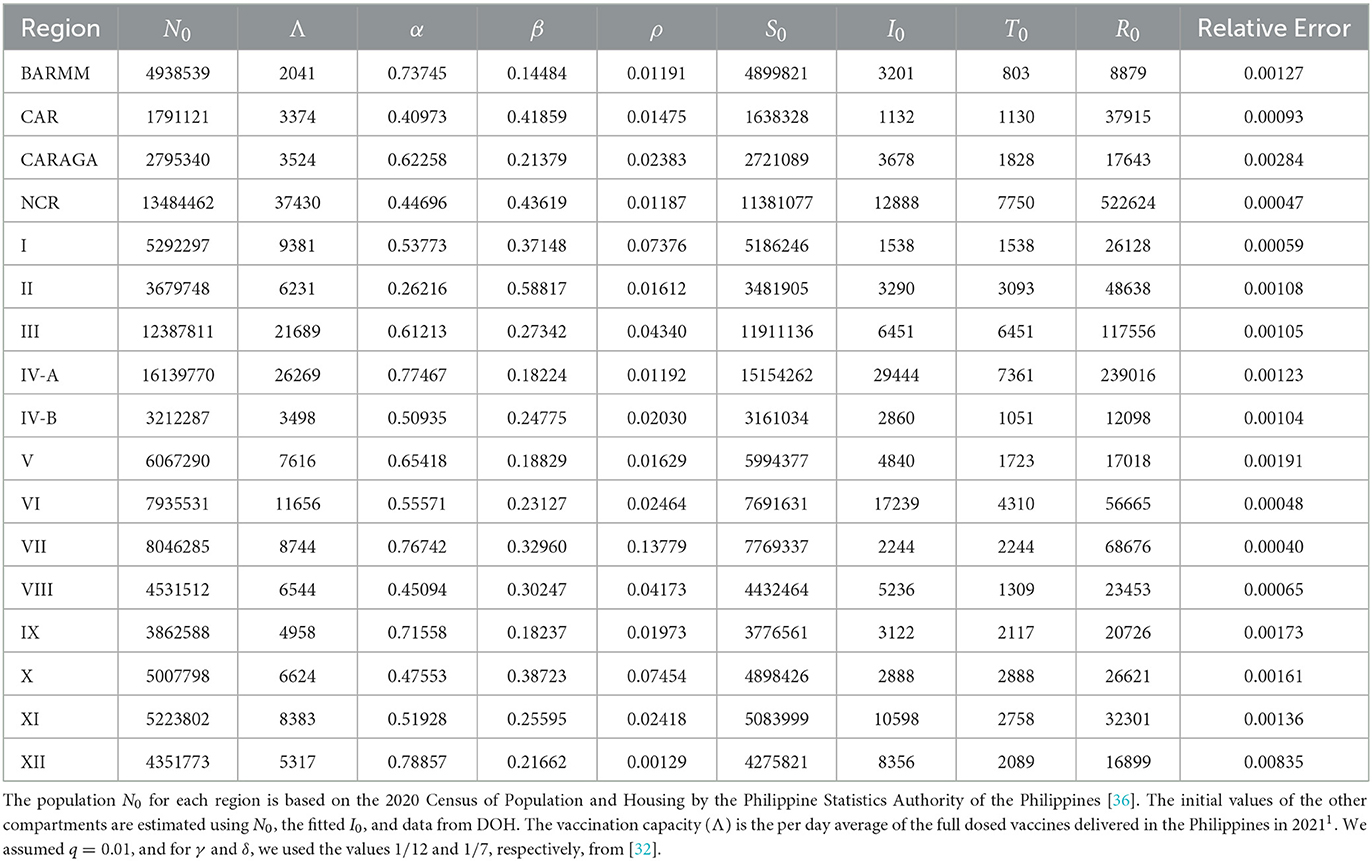
Table 2. Parameter values.
5. Optimal control problem
In this study, we consider the vaccination controls νi for each region i, where 0 ≤ νi ≤ 1. The system with the regions' vaccination controls is given by:
For i = 1, 2, ..., n,
where j ∈ {1, 2, ..., n}, β0i = βi/N0i, and . Our time domain is only up to time tf such that Λi < Si(tf), for all i = 1, 2, ..., n.
Our objective is to determine the vaccine distribution to the regions over time so that the total number of infections for a given period and the associated cost are minimized. We take note of the fact that our options are constrained by the vaccines that are on hand and the daily vaccination capacity of each region.
Letting B be the total number of available vaccines, the objective functional to be minimized is given by
such that
Equation (10) is an isoperimetric constraint, and we will do the trick discussed in [37]. We let Z(t) be an additional state variable such that
where Z(t0) = 0 and Z(tf) = B. Note that then we will have satisfied (10).
The Hamiltonian H is then given by
where GSi, GIi, GTi, GRi, and GZ are the right hand sides of Equations (5), (6), (7), (8), and (11), respectively, for i = 1, 2, ..., n. Applying Pontryagin's maximum principle, there exist adjoint variables λSi, λIi, λTi, λRi, λZ, i = 1, 2, ..., n, which satisfy the following system of ordinary differential equations: for i = 1, …, n,
with transversality conditions λSi(tf) = λIi(tf) = λTi(tf) = λRi(tf) = 0, for i = 1, 2, ..., n.
For i = 1, …, n, optimal controls νi(t) are derived by the following optimality conditions:
We thus have the following theorem.
Theorem 5.1. Problem (9)-(10) has a solution and the optimal control variables are given by, for i = 1, …, n
6. Simulations
Using the adapted forward-backward sweep method, which is used to solve isoperimetric problems [37], we numerically solved the optimization problem. This is a combination of the forward-backward sweep method and the shooting method, which is a variation of Newton's method for finding zeros. In the simulations, we consider distributing 5 million vaccines over a period of 50 days, subject to the limitations described in Section 2. Thus, we anticipated the arrival of the next batch of vaccines in 50 days.
6.1. Intuition vs. optimal control
Table 2 lists the daily vaccination capacity for each region. Our intuition would lead us to recommend administering each region's full daily allotment of vaccines until they are all consumed. This suggests that all 5 million vaccine doses will be consumed in just 28 days. Figures 2A, B show this strategy. Figure 2A displays the control values for all regions, which are 100% for 28 days, and Figure 2B displays the number of vaccines each region uses based on their daily vaccination capacity.
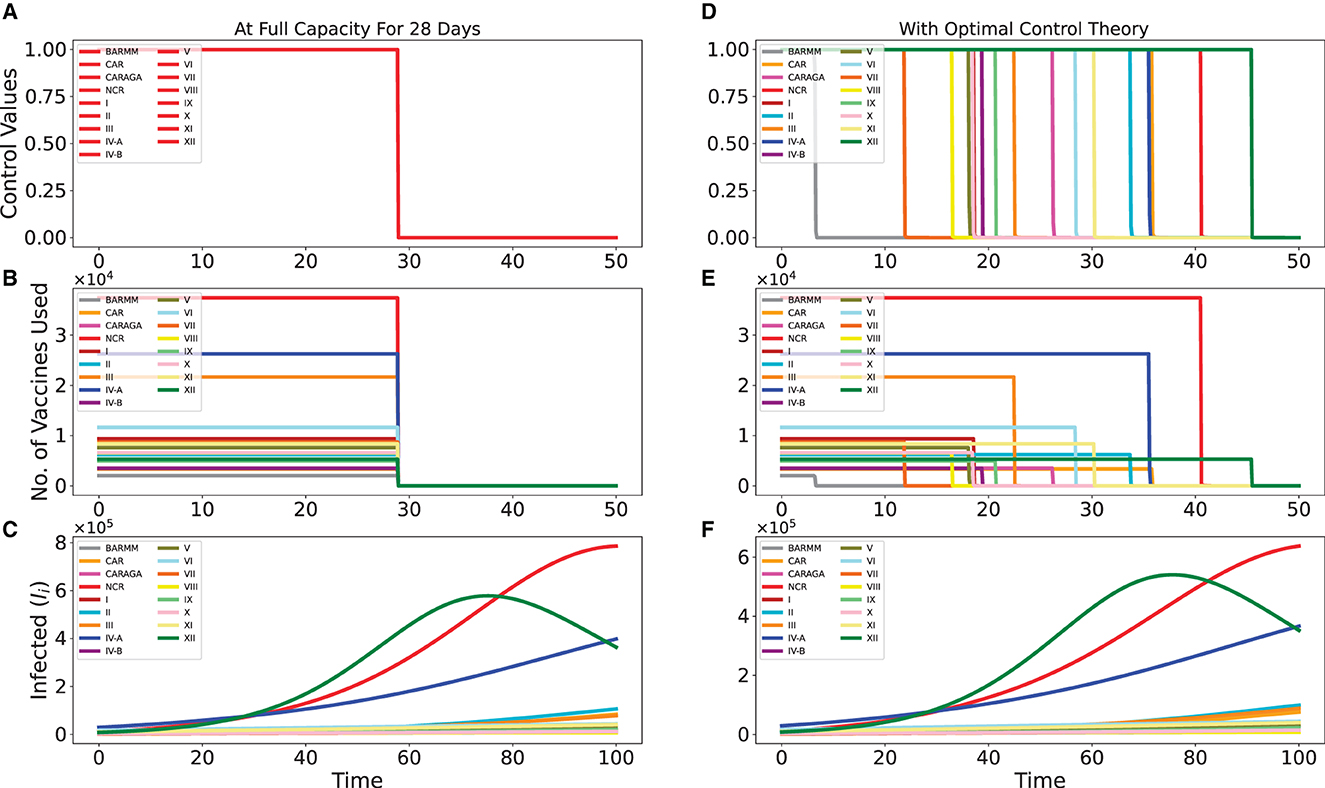
Figure 2. Intuitive vaccination strategy of distributing the vaccines by the full capacity of each region for 28 days vs. distribution strategy via optimal control theory. Here, we only have 5 million vaccines to be distributed in 50 days. In (A, D), we have the control values, while in (B, E) we have the no. of vaccines used, for both strategies. In (C, F), we extend the simulation time up to 100 to better see the effect of the vaccination strategies.
The Philippines has implemented lockdowns and border control between regions during the simulation's time frame (1 June 2021 to 31 October 2021). We assume these precautions are sufficient to prevent infected people from traveling between different regions. The impact of infected people moving between regions is not included in this simulation. During this time, every region urgently needs vaccination; therefore, implementation costs are not a concern. Therefore, the implementation cost for each region in this simulation is set at the same value. However, these values can be modified easily if necessary.
Figure 2C illustrates how this intuitive strategy affected the disease progression in each region. This is compared to the distribution strategy derived from optimal control theory shown in Figures 2D, E, with the effect on disease progression given in Figure 2F. One can observe that it did not advocate using all of each region's resources for 28 days. The NCR, III, and IV-A regions received higher priority under the strategy. Since infection rates were much higher in these areas, especially in the three regions XII, NCR, and IV-A, which could be seen clearly in Figures 2C, F, this strategy can be explained by the need to control the progression of the disease there.
Even though the progression of the disease looks the same for both strategies, the optimal control strategy is better at stopping infections than the other one. This is evident when comparing the y-axes of Figures 2C, F, which compare the two strategies. As an illustration, for NCR, the infected reached approximately 8 × 10⁵ using the intuitive strategy but only approximately 6 × 10⁵ using the optimal control strategy.
Information about the overall infection can be found in Figure 3. According to the intuitive strategy shown in the left figure, all 5 million vaccines were used up by Day 28, compared to that to the non-linear, more gradual approach of the optimal control strategy. The total number of infected people over time in each of the 17 regions is shown in the right figure. The simulation is carried out through Day 100 to clearly demonstrate how the sums vary (with no additional vaccination after Day 50).
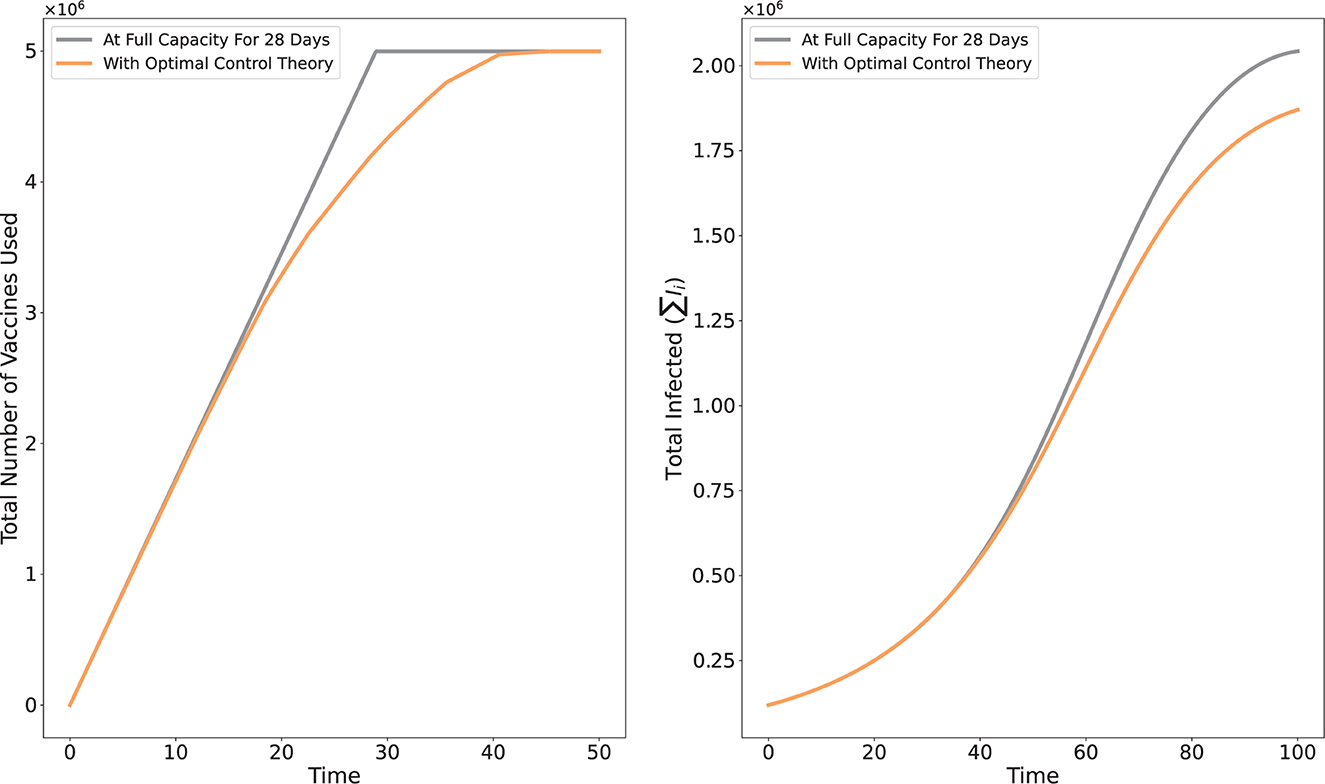
Figure 3. Comparison of the intuitive vaccination strategy of distributing the vaccines by the full capacity of each region for 28 days vs. distribution strategy via optimal control theory.
6.2. Limited vs. unlimited vaccines
In this simulation, we assume that lockdowns and border controls are not working that well, and so there is mobility of infected individuals between regions. There are no publicly available statistics on interregional movement, particularly for infected people. Based on our knowledge of the regions of the Philippines and their relationships with one another, we estimate the values of the mobility parameters qi, cij, and mij for the purpose of demonstration. The used values are listed in Table 3.
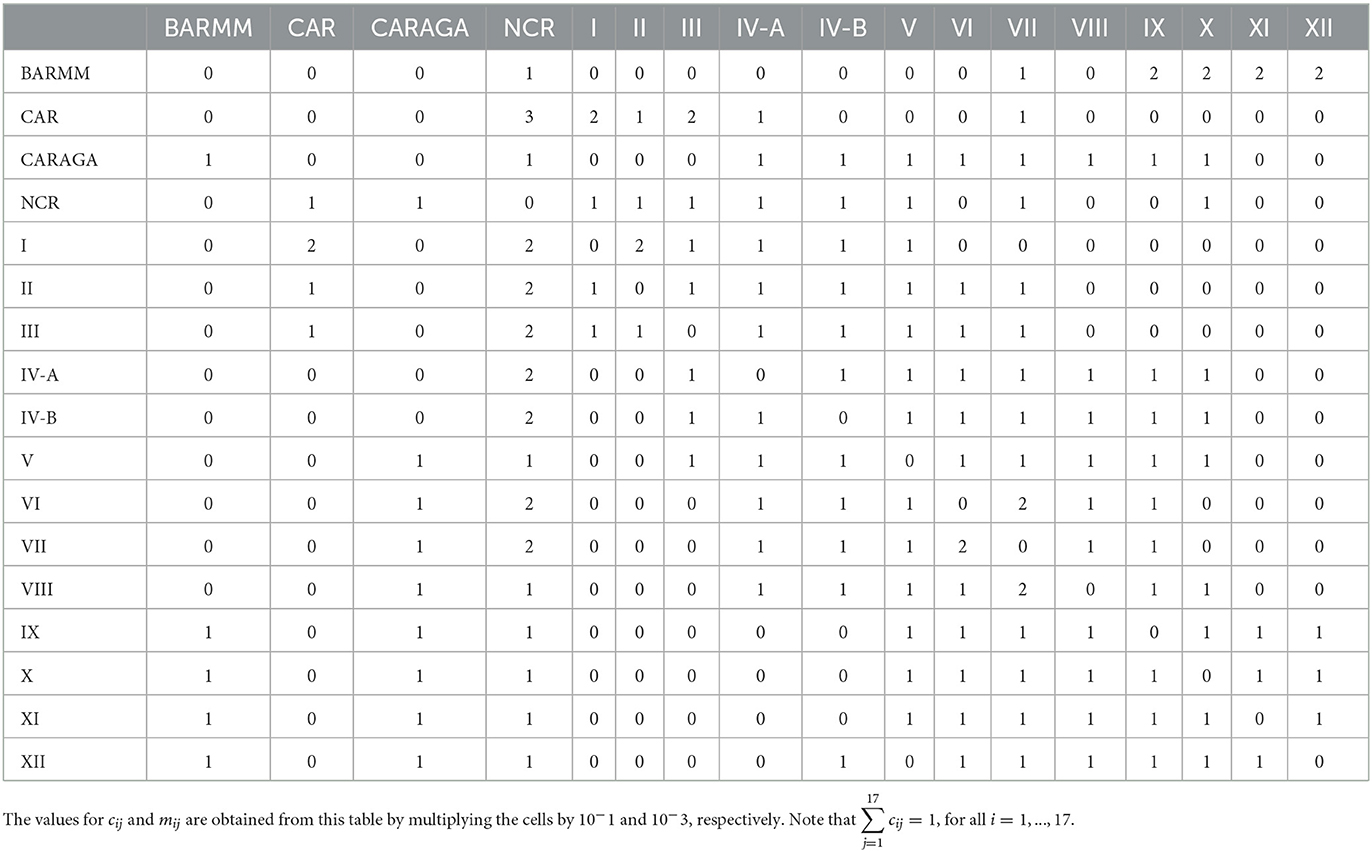
Table 3. Mobility values used.
This situation is comparable to the later stages of the pandemic when lockdowns are not used, and only lax border controls are in place. We contrast the scenario where vaccine supply is limited, just like in the preceding simulation (Section 6.1), and the scenario where vaccine supply is seemingly unlimited, or where there is always enough vaccine to meet each region's vaccination capacity over the course of the simulation.
Figures 4A, B depict the simulation for the scenario where vaccine supply is limited. In contrast, Figures 4C, D depict the simulation for the scenario where vaccine supply is presumptively limitless. In the unlimited case, optimal control theory also recommends providing all the regions with their full vaccination capacity, as is intuitively expected. Figure 4E depicts the variation in the overall number of vaccines used, while Figure 4F depicts the anticipated variation in the overall infections (sum of the infected in the 17 regions), for both cases.
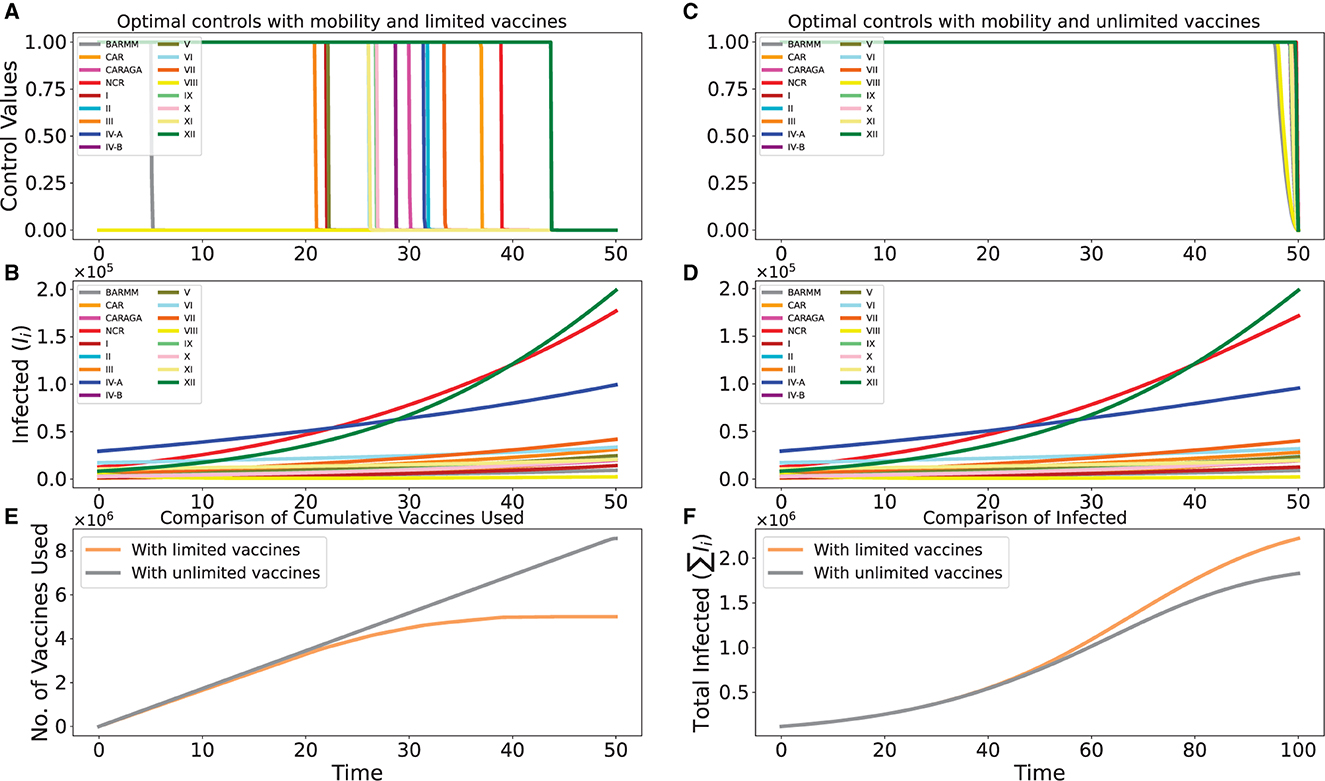
Figure 4. Optimal controls for the cases with limited and unlimited vaccines. In (A, B, E), we have the limited case, while in (C, D, F), we have the unlimited case.
7. Discussion and conclusion
Our simulations showed how important it is to use optimal control theory to figure out how to give out a limited amount of vaccine over a certain amount of time in a country with different regions and a daily vaccination limit for each region. The advantage of this approach is that it seeks to determine the most efficient distribution plan while accounting for the influence that daily vaccination rates have on the progression of the disease in the days that follow in each region. In Section 6.1, we clearly saw that the optimal control formulation's solution minimizes the overall infection in the country better than the intuitive approach of simply distributing the supply to all the regions based on their vaccination capacity. We also demonstrated the effectiveness of our method even when individual mobility between infected regions is considered.
We could also point out some drawbacks though. For instance, we did not take political and social factors into account. Due to lower reported cases or higher infection rates in other regions that needed to be prioritized, an optimal control strategy might, for instance, recommend against administering vaccines to a specific region. Although we can be mathematically confident that the strategy will reduce the overall infection of the country more effectively, it could be easily interpreted as simple discrimination. These things can also be taken into account when developing our formulation. As an illustration, we could stipulate that the lower limit for the controls νi must be 30%.
We note here that the method presented in this study can be easily extended or adapted to consider more divisions of the country. For instance, instead of the 17 regions, we could also consider more than 7,000 islands of the country. However, this would entail a much higher computational cost. Alternatively, we could zoom in on one city and consider the distribution problem for its barangays, which are the smallest administrative divisions in the country.
As stated in Section 2, we do not intend to assess the government's distribution initiative here. Instead, we propose a different strategy for administering the vaccines that we have mathematically demonstrated to be more effective with regard to our goal of reducing the overall infection rate in the country.
Data availability statement
The original contributions presented in the study are included in the article/supplementary material, further inquiries can be directed to the corresponding author.
Author contributions
RC-a and JA contributed to the conception and design of the study and wrote the first draft of the manuscript. JMM and MR provided mathematical analysis and calculation. JD handled data collection and processing. JGM provided biological expertise. RC-a carried out the numerical simulations. All authors discussed the results and implications, and reviewed and approved the final version of the manuscript.
Funding
The authors would like to thank DOST through PCHRD and ASTHRDP, MSU-IIT's OVCRE through PRISM, and CSU's MSCRC for the funding support.
Acknowledgments
The authors would like to thank W. Bock for a fruitful discussion.
Conflict of interest
The authors declare that the research was conducted in the absence of any commercial or financial relationships that could be construed as a potential conflict of interest.
Publisher's note
All claims expressed in this article are solely those of the authors and do not necessarily represent those of their affiliated organizations, or those of the publisher, the editors and the reviewers. Any product that may be evaluated in this article, or claim that may be made by its manufacturer, is not guaranteed or endorsed by the publisher.
Footnotes
1. ^National COVID-19 Vaccination Dashboard | Department of Health Website. Available online at: https://doh.gov.ph/covid19-vaccination-dashboard.
2. ^Department of Health Website (2022). Available online at: https://doh.gov.ph/vaccines.
References
1. Harris RJ, Hall JA, Zaidi A, Andrews NJ, Dunbar JK, Dabrera G. Effect of vaccination on household transmission of SARS-CoV-2 in England. N Engl J Med. (2021) 385:759–60. doi: 10.1056/NEJMc2107717
2. Katella K. Comparing the COVID-19 Vaccines: How Are They Different? (2023). Available online at: https://www.yalemedicine.org/news/covid-19-vaccine-comparison (accessed January 29, 2023).
3. Geddes L. How Effective Are COVID-19 Vaccines in the Real-World? | Gavi, the Vaccine Alliance (2021). Available online at: https://www.gavi.org/vaccineswork/how-effective-are-covid-19-vaccines-real-world (accessed January 29, 2023).
4. PSA. GDP Expands by 7.6 Percent in the Third Quarter of 2022 | Philippine Statistics Authority (2022). Available online at: https://psa.gov.ph/content/gdp-expands-76-percent-third-quarter-2022 (accessed January 29, 2023).
5. Amit AML, Pepito VCF, Sumpaico-Tanchanco L, Dayrit MM. COVID-19 vaccine brand hesitancy and other challenges to vaccination in the Philippines. PLoS Global Public Health. (2022) 2:e0000165. doi: 10.1371/journal.pgph.0000165
6. Arcede JP, Caga-anan RL, Mentuda CQ, Mammeri Y. Accounting for symptomatic and asymptomatic in a SEIR-type model of COVID-19. Math Modell Nat Phenomena. (2020) 15:34. doi: 10.1051/mmnp/2020021
7. Dy LF, Rabajante JF. A COVID-19 infection risk model for frontline health care workers. In: Network Modeling Analysis in Health Informatics and Bioinformatics. Vienna: Springer (2020). p. 1–13.
8. Caldwell JM, Lara-Tuprio ED, Teng TR, Estuar MRJE, Sarmiento RFR, Abayawardana M, et al. Understanding COVID-19 dynamics and the effects of interventions in the Philippines: a mathematical modelling study. Lancet Reg Health West Pac. (2021) 14:100211. doi: 10.1016/j.lanwpc.2021.100211
9. Arcede J, Caga-anan RL, Mammeri Y, Namoco R, Gonzales IC, Lachica ZP, et al. A modeling strategy for novel pandemics using monitoring data: the case of early COVID-19 pandemic in Northern Mindanao, Philippines. SCIENGGJ. (2022) 15:35–46.
10. Bock W, Bornales JB, Burgard JP, Babiera JE, Caga-anan RL, Carmen DJS, et al. Testing, social distancing and age specific quarantine for COVID-19: Case studies in Iligan City and Cagayan de Oro City, Philippines. AIP Conf Proc. (2020) 2286:030002. doi: 10.1063/5.0029818
11. Macalisang JM, Caay ML, Arcede JP, Caga-anan RL. Optimal control for a COVID-19 model accounting for symptomatic and asymptomatic. Comput Math Biophys. (2020) 8:168–79. doi: 10.1515/cmb-2020-0109
12. Lazebnik T, Blumrosen G. Advanced multi-mutation with intervention policies pandemic model. IEEE Access. (2022) 10:22769–81. doi: 10.1109/ACCESS.2022.3149956
13. Lazebnik T, Bunimovich-Mendrazitsky S, Shami L. Pandemic management by a spatio–temporal mathematical model. Int J Nonlinear Sci Num Simul. (2021). doi: 10.1515/ijnsns-2021-0063
14. Di Domenico L, Pullano G, Sabbatini CE, Boëlle PY, Colizza V. Impact of lockdown on COVID-19 epidemic in Île-de-France and possible exit strategies. BMC Med. (2020) 18:240. doi: 10.1186/s12916-020-01698-4
15. Bhadauria AS, Pathak R, Chaudhary M. A SIQ mathematical model on COVID-19 investigating the lockdown effect. Infect Dis Modell. (2021) 6:244–57. doi: 10.1016/j.idm.2020.12.010
16. Agarwal M, Bhadauria AS. Modeling spread of polio with the role of vaccination. Appl Appl Math Int J. (2011) 6:11.
17. Tiwari PK, Rai RK, Khajanchi S, Gupta RK, Misra AK. Dynamics of coronavirus pandemic: effects of community awareness and global information campaigns. Eur Phys J Plus. (2021) 136:994. doi: 10.1140/epjp/s13360-021-01997-6
18. Rai RK, Khajanchi S, Tiwari PK, Venturino E, Misra AK. Impact of social media advertisements on the transmission dynamics of COVID-19 pandemic in India. J Appl Math Comput. (2022) 68:19–44. doi: 10.1007/s12190-021-01507-y
19. Srivastav AK, Tiwari PK, Srivastava PK, Ghosh M, Kang Y. A mathematical model for the impacts of face mask, hospitalization and quarantine on the dynamics of COVID-19 in India: deterministic vs. stochastic. Math Biosci Eng. (2020) 18:182–213. doi: 10.3934/mbe.2021010
20. Majumder M, Tiwari PK, Pal S. Impact of saturated treatments on HIV-TB dual epidemic as a consequence of COVID-19: optimal control with awareness and treatment. Nonlinear Dyn. (2022) 109:143–76. doi: 10.1007/s11071-022-07395-6
21. Naik PA, Zu J, Ghori MB, ud-din Naik M. Modeling the effects of the contaminated environments on COVID-19 transmission in India. Results Phys. (2021) 29:104774. doi: 10.1016/j.rinp.2021.104774
22. Hogan AB, Winskill P, Watson OJ, Walker PGT, Whittaker C, Baguelin M, et al. Within-country age-based prioritisation, global allocation, and public health impact of a vaccine against SARS-CoV-2: a mathematical modelling analysis. Vaccine. (2021) 39:2995–3006. doi: 10.1016/j.vaccine.2021.04.002
23. Fitzpatrick MC, Galvani AP. Optimizing age-specific vaccination. Science. (2021) 371:890–1. doi: 10.1126/science.abg2334
24. Bubar KM, Reinholt K, Kissler SM, Lipsitch M, Cobey S, Grad YH, et al. Model-informed COVID-19 vaccine prioritization strategies by age and serostatus. Science. (2021) 371:916–21. doi: 10.1126/science.abe6959
25. Rasambainarivo F, Ramiadantsoa T, Raherinandrasana A, Randrianarisoa S, Rice BL, Evans MV, et al. Prioritizing COVID-19 vaccination efforts and dose allocation within Madagascar. BMC Public Health. (2022) 22:724. doi: 10.1186/s12889-022-13150-8
26. Zhou S, Zhou S, Zheng Z, Lu J. Optimizing spatial allocation of COVID-19 vaccine by agent-based spatiotemporal simulations. Geohealth. (2021) 5:e2021GH000427. doi: 10.1029/2021GH000427
27. Saad-Roy CM, Morris SE, Metcalf CJE, Mina MJ, Baker RE, Farrar J, et al. Epidemiological and evolutionary considerations of SARS-CoV-2 vaccine dosing regimes. Science. (2021) 372:363–70. doi: 10.1126/science.abg8663
28. Kadire SR, Wachter RM, Lurie N. Delayed second dose versus standard regimen for Covid-19 vaccination. N Engl J Med. (2021) 384:e28. doi: 10.1056/NEJMclde2101987
29. Molla J, Chavez APL, Hiraoka T, Ala-Nissila T, Kivela M, Leskela L. Adaptive and optimized COVID-19 vaccination strategies across geographical regions and age groups. PLoS Comput Biol. (2022) 18:e1009974. doi: 10.1371/journal.pcbi.1009974
30. Lemaitre JC, Pasetto D, Zanon M, Bertuzzo E, Mari L, Miccoli S, et al. Optimal control of the spatial allocation of COVID-19 vaccines: Italy as a case study. PLoS Comput Biol. (2022) 18:e1010237. doi: 10.1371/journal.pcbi.1010237
31. Domingo RW. Japan Gives Philippines' COVID-19 Vax Program ‘Last Mile' Boost (2022). Available online at: https://business.inquirer.net/375094/japan-gives-philippines-covid-19-vax-program-last-mile-boost (accessed January 29, 2023).
32. Caga-anan RL, Raza MN, Labrador GSG, Metillo EB, del Castillo P, Mammeri Y. Effect of vaccination to COVID-19 disease progression and herd immunity. Comput Math Biophys. (2021) 9:262–72. doi: 10.1515/cmb-2020-0127
33. Csilléry BMGGOE K, Francois O. Approximate Bayesian computation (ABC) in practice. Trends Ecol Evol. (2010) 25:410–8. doi: 10.1016/j.tree.2010.04.001
34. Levenberg K. A method for the solution of certain non-linear problems in least squares. Q Appl Math. (1944) 2:164–8. doi: 10.1090/qam/10666
35. Marquardt DW. An algorithm for least-squares estimation of nonlinear parameters. J Soc Indus Appl Math. (1963) 11:431–41.
36. Philippine Statistics Authority. 2020 Census of Population Housing (2020 CPH) Population Counts Declared Official by the President (2021). Available online at: https://psa.gov.ph/content/2020-census-population-and-housing-2020-cph-population-counts-declared-official-president (accessed January 29, 2023).
Keywords: metapopulation, vaccination, optimal, control, COVID-19, Philippines
Citation: Caga-anan RL, Macalisang JM, Dalisay JLM, Raza MN, Martinez JGT and Arcede JP (2023) Optimal vaccination control for COVID-19 in a metapopulation model: a case of the Philippines. Front. Appl. Math. Stat. 9:1154634. doi: 10.3389/fams.2023.1154634
Received: 30 January 2023; Accepted: 14 April 2023;
Published: 18 May 2023.
Edited by:
Faraimunashe Chirove, University of Johannesburg, South AfricaReviewed by:
Teddy Lazebnik, University College London, United KingdomPankaj Tiwari, University of Kalyani, India
Copyright © 2023 Caga-anan, Macalisang, Dalisay, Raza, Martinez and Arcede. This is an open-access article distributed under the terms of the Creative Commons Attribution License (CC BY). The use, distribution or reproduction in other forums is permitted, provided the original author(s) and the copyright owner(s) are credited and that the original publication in this journal is cited, in accordance with accepted academic practice. No use, distribution or reproduction is permitted which does not comply with these terms.
*Correspondence: Randy L. Caga-anan, randy.caga-anan@g.msuiit.edu.ph