An Empirical Evaluation of Asymmetric Synchronous Collaboration Combining Immersive and Non-Immersive Interfaces Within the Context of Immersive Analytics
 Nico Reski
 Aris Alissandrakis
 Andreas Kerren
- 1VRxAR Labs, Department of Computer Science and Media Technology, Linnæus University, Växjö, Sweden
- 2ISOVIS, Department of Computer Science and Media Technology, Linnæus University, Växjö, Sweden
- 3iVis, Department of Science and Technology, Linköping University, Norrköping, Sweden
Collaboration is an essential part of data analysis, allowing multiple users to combine their expertise and to debate about the interpretation of data discoveries using their contextual knowledge. The design of collaborative interfaces within the context of Immersive Analytics remains challenging, particularly due to the various user-centered characteristics of immersive technologies. In this article, we present the use case of a system that enables multiple users to synchronously explore the same data in a collaborative scenario that combines immersive and non-immersive interfaces in an asymmetric role setup. Such a setup allows for bridging the gap when applying heterogeneous display and interaction technologies, enabling each analyst to have an independent and different view of the data, while maintaining important collaborative aspects during the joint data exploration. We developed an immersive VR environment (head-mounted display, 3D gestural input) and a non-immersive desktop terminal (monitor, keyboard and mouse) centered around spatio-temporal data exploration. Supported through a real-time communication interface, synchronous collaborative features are integrated in both interfaces, facilitating the users in their ability to establish a shared context and to make spatio-temporal references. We conducted an empirical evaluation with five participant pairs (within-subject design) to investigate aspects of usability, user engagement, and collaboration during a confirmative analysis task. Synthesis of questionnaire results in combination with additional log file analysis, audio activity analysis, and observations, revealed good usability scores, high user engagement, as well as overall close and balanced collaboration of enthusiastic pairs during the task completion independent of their interface type, validating our system approach in general. Further supported through the self-constructed Spatio-Temporal Collaboration Questionnaire, we are able to contribute with discussion and considerations of the presented scenario and the synchronous collaborative features for the design of similar applications.
1 Introduction
Immersive technologies have been experiencing a renaissance in the recent years. Hardware technologies that support immersive Virtual Reality (VR) and Mixed Reality (MR) experiences, for example head-mounted display (HMD), handheld, and tracking devices, have become increasingly ubiquitous over the past decade. Consequently, more and more developers and researchers are now able to create experiences that aim to strive from these novel display and interaction modalities, resulting in emerging trends as well as interesting application and research directions. Immersive Analytics (IA) is one such emerging research field. IA is concerned with the investigation of immersive display and interaction technologies in order to provide tools that support and facilitate data exploration and analytical reasoning (Dwyer et al., 2018; Skarbez et al., 2019). Within the context of data analysis, collaboration between multiple users is a major component, allowing the analysts to combine their expertise, knowledge, and experience (Isenberg et al., 2011), and together analyse and interpret the data as well as discuss findings and observations along the way, which is in itself an inherently social process (Heer and Agrawala, 2008; Billinghurst et al., 2018). A recent review of research about collaborative MR systems, spanning from 1995 to 2018, reveals an increase in the amount of relevant publications from 2012 onward compared to the rather lower publication numbers in this area in the years prior, confirming the increased interest in this topic in recent years (Ens et al., 2019). Nevertheless, immersive technologies are commonly rather user-centered by default (Hackathorn and Margolis, 2016; Skarbez et al., 2019), putting them in strong contrast with the desired collaborative aspects, as often important visual communication cues, e.g., gestures and mimics as facial expressions, body language, and spatial references, are no longer conventionally available. Especially within the context of collaborative data analysis and shared virtual environments, such nonverbal cues are important and should thus be supported accordingly, which is no trivial task (Churchill and Snowdon, 1998; Nguyen and Duval, 2014; Cruz et al., 2015). Unfortunately, there is a lack of empirical research in regard to collaboration within the context of IA (Fonnet and Prié, 2021), encouraging further investigations in this direction. Collaboration and its various aspects is considered a major topic in the current challenges of IA (Ens et al., 2021). Furthermore, collaboration within this context is not limited to scenarios where each collaborator uses the same display and interaction technologies, nor should it be. In fact, hybrid solutions that combine the use of different technologies in asymmetric scenarios where each collaborator has a distinct role are encouraged and anticipated, each providing different perspectives, insights, and considerations during the data analysis workflow (Isenberg, 2014; Wang et al., 2019). In regard to IA, naturally a closer integration with (non-immersive) analytical tools comes to mind, for instance as covered within research fields such as Information Visualization (InfoVis) and Visual Analytics (VA). After all, InfoVis, VA, and IA are envisioned to synergize and complement each other. The design of systems that allow active collaboration is complex in general due to the demand of supporting two main objectives, i.e., supporting the individual user’s aspects as well as those relevant for the collaborative group efforts (Gutwin and Greenberg, 1998). When users are not using the same system to work together but different ones, that additionally may be based on different technologies, this endeavour arguably becomes more complex, as design objectives need to be met for multiple systems. Furthermore, such asymmetric collaboration scenarios that feature different types of technologies commonly implement a kind of expert–novice relationship between its users (Ens et al., 2019), even though an interplay between equal professionals is desired (Isenberg et al., 2011; Billinghurst et al., 2018; Thomsen et al., 2019).
This article aims to address these research challenges by reporting on the design, implementation, and empirical evaluation of a collaborative data exploration system that consists of an immersive and a non-immersive interface. These interfaces allow two collaborators to explore different aspects of the same multivariate dataset, one using a VR application that is based on an HMD and 3D gestural input and the other using a desktop workstation with keyboard and mouse input, connected in real-time. While arguably each interface could be used as a stand-alone application in isolation in order to gain some insights from the data, we are motivated to bridge these interfaces and allow synchronous collaboration. Therefore, each interface provides features that allow the analyst collaborators to make visual references to each other in regard to the spatial and temporal dimensions in the data, while they are also able to verbally communicate via an audio-link in a remote setup. Within the scope of a representative data analysis task, we conducted a within-subjects user interaction study with pairs of participants in order to empirically evaluate aspects such as usability, user engagement, and collaboration using a combination of qualitative and quantitative data collection methods. This allows us to provide valuable reflections as well as design considerations for future work within the presented context. To summarize, this article advances the emerging field of Collaborative Immersive Analytics (CIA) with the following primary (PC) and secondary (SC) contributions:
• [PC.1] We describe the design and implementation of a hybrid asymmetric data exploration system that allows for synchronous analysis of a multivariate dataset. An integral component of the system is the real-time communication interface that enables spatio-temporal referencing across the interfaces.
• [PC.2] We present and discuss the results in regard to usability, user engagement, and collaboration based on an empirical evaluation with five pairs of participants (n = 10), where each pair completed twice a representative data analysis task with no time limitations; each participant got to use both interfaces (within-subject design).
• [SC.1] To support our empirical evaluation of important collaborative aspects of the developed system, we created a self-constructed questionnaire. The Spatio-Temporal Collaboration Questionnaire aims to systematically assess four important collaboration dimensions as described by Churchill and Snowdon (1998) and Snowdon et al. (2001), in particular Transitions between Shared and Individual Activities, Negotiation and Communication, Sharing Context, and Awareness of Others. We report on the motivation and design for the questionnaire, and present the results of its application in practice.
• [SC.2] We came up with a process to generate multivariate datasets consisting of correlated (according to a model) timelines, so that we could use multiple scenarios of equivalent complexity in our study. The process is flexible and easy to adapt for other studies that require similar datasets.
The article is organized in the following way. It begins by describing relevant related work in Section 2, particularly in regard to CIA and asymmetric VR, providing important considerations and further motivations for our research objective. Section 3 formally defines our scenario and describes in detail all components of the developed collaborative system. The overall methodological approach for the empirical evaluation of the system is described in Section 4. The results, presented throughout Section 5, are discussed in Section 6. Finally, we conclude our work in Section 7, also providing some directions for future work.
2 Related Work
Thematically aligned with the presented research objective, it is important to discuss relevant literature, providing valuable insights and starting points accordingly. This section first presents work related to the emerging topic of Collaborative Immersive Analytics. Thereafter, we summarize some relevant work in regard to asymmetric virtual reality experiences, in particular studies that investigated interaction aspects between immersed and non-immersed users. Finally, we reflect on the literature by stating further considerations and motivations for our research objective.
2.1 Collaborative Immersive Analytics
Billinghurst et al. (2018) recently defined Collaborative Immersive Analytics (CIA) as follows: “The shared use of immersive interaction and display technologies by more than one person for supporting collaborative analytical reasoning and decision making.”. CIA can be considered a multi-disciplinary research area that combines expertise from Immersive Analytics (IA) and Computer-Supported Cooperative Work (CSCW), two inherently multi-disciplinary research areas themselves (Snowdon et al., 2001; Dwyer et al., 2018; Skarbez et al., 2019). Some foundational characteristics and considerations in regard to collaborative virtual environments have already been described by Snowdon et al. back in 2001, for instance stating that these virtual spaces have the possibility to feature data representations and users at the same time. Snowdon et al. (2001) also highlight the importance for such spaces to be purposeful in order to overcome the users’ initial novelty reactions, and to eventually establish themselves as useful tools and places of interaction that can be visited more frequently. According to them, designing virtual spaces that support individual as well as group work, enabling users to collaborate and exchange information, may very well be such a meaningful purpose (Snowdon et al., 2001). Aligned with such collaborative virtual environments, Skarbez et al. (2019) recently described some interesting directions in order to investigate how collaboration can be facilitated through immersive technologies. This is particularly challenging as immersive technologies often tend to be inherently single user-centered (Skarbez et al., 2019). At the same time however, the application of interactive Virtual Reality (VR) technologies holds major potential to remove spatial boundaries and thus bring users closer together (LaValle, 2020, Chapter 10.4). There is a need to further explore aspects such as physical distribution (remote), temporal distribution (asynchronous), as well as collaboration using heterogeneous device types in order to evaluate potential benefits and limitations of using immersive technologies in collaborative scenarios (Skarbez et al., 2019). Billinghurst et al. (2018) expand on these aspects, further describing in detail various scenarios and use cases in regard to the application of CIA in alignment to the collaborators’ location in space (remote vs. co-located) and time (synchronous vs. asynchronous), as famously introduced by Johansen (1988). They reflect on the variety of opportunities for further research, for instance in regard to the appropriate design space and choice of immersive display and interaction technologies to support analytical tasks, the numbers of collaborators involved, and the lack of face-to-face communication in scenarios that involve HMDs (Billinghurst et al., 2018). Nevertheless, the evaluation of such complex immersive systems that involve multiple users remains challenging (Billinghurst et al., 2018; Skarbez et al., 2019; Ens et al., 2021).
Some interesting work in order to address aspects and challenges of CIA has been conducted. Collaboration features for three-dimensional virtual worlds (3DVWs) and their depiction in common CSCW taxonomies have been explored by Cruz et al. (2015). They highlight in particular the relevance of nonverbal communication cues to support collaboration in 3DVWs, while at the same time often only being implicitly included in holistic CSCW taxonomies. While CSCW concepts naturally inform the design of collaboration in virtual environments, it is equally important to not simply adopt these in isolation, but also consider the new perspectives and properties introduced by immersive virtual environments (Cruz et al., 2015). A review of collaborative Mixed Reality (MR) systems recently conducted by Ens et al. (2019) provide insights into the intersection of CSCW and MR research. Based on the categorisation of the research included in the review, namely time and space, symmetry, artificially, focus, and scenario, it becomes apparent that most work related to MR systems that feature synchronous (time), remote (space), and asymmetric (symmetry) collaboration focus on a remote expert scenario (Ens et al., 2019). Such scenarios commonly involve an expert user guiding a (more) novice user to one extent or the other. Asymmetric collaboration in remote synchronous setups using shared workspace scenarios, where the collaborators have rather equal roles, are much less common, more frequently focusing on symmetric collaboration instead (Ens et al., 2019). Besides the communication and information exchange, collaboration between multiple users features also various social aspects and dimensions (Heer and Agrawala, 2008). Efforts towards the support of more natural social interactions in large virtual environments have already been investigated by Benford and Fahlén, (1993) and Benford et al. (1994). In their papers, the authors describe the design and implementation of a spatial model to facilitate mutual awareness between multiple users in virtual environments through concepts such as aura, awareness, focus, nimbus, adapters and boundaries (Benford and Fahlén, 1993; Benford et al., 1994).
Wang et al. (2019) describe their vision of integrating immersive visualizations more closely into realistic scientific workflows. While highlighting some limitations of applying immersive technologies within such a practical day-to-day context, e.g., the still considerably high demand for calibration and maintenance, they also state that hybrid 2D/3D visualization environments that combine non-immersive and immersive visualizations and interactions may be much appreciated in the future (Wang et al., 2019). A similar vision for the complement and interplay of different interactive data exploration environments has been described by Isenberg (2014). Rather than having one visualization approach that satisfies all of an analyst’s needs, it is more likely to have multiple different ones for individual purposes that each strive from their own advantages, ideally allowing for a seamless transition and data analysis workflow along the way (Isenberg, 2014).
Cavallo et al. (2019) explored how analysts work in a co-located collaborative hybrid reality environment within the context of explorative data analysis. Their data visualization system incorporated Augmented Reality (AR), high resolution display, as well as interactive surface projection technologies. A comparative evaluation of their hybrid reality environment with a desktop-based one, where both environments shared an overall similar design and almost equal functionalities, revealed trends towards the collaborative arrival at more insights in a shorter amount of time using the hybrid reality environment (Cavallo et al., 2019). Nevertheless, Cavallo et al. (2019) conclude by encouraging the design and development of immersive data analysis solutions that aim to complement rather than replace non-immersive ones, in line with the vision as described by Wang et al. (2019). A distributed multi-user platform that incorporates different types of immersive technologies within the context of collaborative visualization has been presented by Khadka et al. (2018). They conducted a comparative study where the participants had to collaboratively solve a data visualization task in two different conditions: either all collaborators were using the same immersive technologies, or the collaborators were using different types of immersive technologies (Khadka et al., 2018). The results indicated trends towards increased effectiveness in their collaboration, i.e., better performance and lower task duration, within the scenario where the collaborators used different types of technologies for the analysis, allowing them to explore the data from different perspectives and synchronize their insights accordingly (Khadka et al., 2018). Different design requirements for mixed-presence collaborative visualization have been derived from the literature by Kim et al. (2010), who also present some initial reflections on these based on an evaluation designed around synchronous remote collaboration using different interactive tabletop systems. Among others, their described design requirements include aspects such as mixed presence, role-based collaboration, group awareness, information access, voice communication, and collaboration styles (Kim et al., 2010). These are certainly also relevant outside a scenario that exclusively involves collaborations around shared interactive surfaces, providing intriguing starting points for further exploration in similar directions. Nguyen and Duval (2014) investigated different aspects of communication in collaborative virtual environments, such as audio communication, embodiment and nonverbal communication, visual metaphors, as well as text and 3D annotation. They emphasize the importance of supporting awareness and communication for successful collaborations in virtual environments, concluding that further research in regard to these aspects is required (Nguyen and Duval, 2014). Nguyen et al. (2019) present a collaborative experience that allows multiple analysts in the same VR environment (co-located or remotely) to explore multidimensional data. Different implemented interaction techniques support the collaborators with typical analytical tasks, e.g., the construction of decision trees to divide the dataset into smaller subsets for further analysis. Furthermore, they chose to represent other collaborators as simple avatars that translate their respective movements into the shared VR environment (Nguyen et al., 2019), addressing mutual user awareness similar as Benford and Fahlén (1993).
Several practical toolkits that aim to facilitate the design and implementation of IA applications have been presented in the recent years (Butcher et al., 2019; Cordeil et al., 2019; Sicat et al., 2019). Naturally, there is potential to expand such toolkits through the addition of modules that focus on collaboration, for instance as described by Casarin et al. (2018).
2.2 Asymmetric Virtual Reality
In the past, some insightful research has been reported that aims to explore asymmetric interactions involving at least one type of immersive VR interface. Wideström et al. (2000) conducted a study to compare two different settings, an asymmetric VR (connected Cave-type and desktop system) versus real world setup, in regard to collaboration, leadership, and performance aspects within the scope of a two-person puzzle solving task. Their results show that the participants reported their contribution to the task completion more unequally in the VR setup compared to the real world one, and that they felt a higher degree of collaboration in the real world task due to the lack of face-to-face communication in the VR setup (Wideström et al., 2000). Arguably, the integration of additional information cues to better support mutual awareness helps to overcome such an experienced lower degree of collaboration in the immersive setup (Benford et al., 1994).
A taxonomy for asymmetric immersive interfaces within collaborative educational settings has been described by Thomsen et al. (2019). Within the scope of their work, the authors follow the general concept of one user being immersed in VR, while one or multiple others are not, defining a distinct actor (VR) - assistant (non-immersed) relationship that their taxonomy is designed around (Thomsen et al., 2019). The taxonomy consists of different components (asymmetric mechanics, hardware components, game components, collaboration mechanics) in order to address varying degrees of collaboration asymmetry (low, medium, high) between actor and assistant (Thomsen et al., 2019). Peter et al. (2018) propose a set of features for a non-immersed user in a guiding role to support communication with an immersed VR user, likewise to the actor-assistant relationship as described by Thomsen et al. (2019). Within their system’s setup, they envision the VR user to have a low degree of control but a high level of immersion, while it is the other way around for the VR-Guide, i.e., a high degree of control but a low level of immersion (Peter et al., 2018). The authors describe the design and implementation of a highlighting feature, comparing different variants, with the aim to focus the VR user’s attention to specific points of reference in the virtual environment based on the non-immersed user’s input (Peter et al., 2018). Similarly, Welsford-Ackroyd et al. (2020) evaluated their proposed system design that allows a non-immersed user, typically in a role as an outside spectator, to actively collaborate with a VR user using a large scale immersive display. Camera control and pointing features were provided to the spectator, the later of which clearly facilitated the communication between the two collaborators in a task scenario where the VR user had to place objects at certain locations as indicated by the spectator (Welsford-Ackroyd et al., 2020). Their system shows similarities to the VR-Guide one by Peter et al. (2018) in such that the non-immersed user directs the immersed one to a point-of-interest through visual highlights in the VR environment. In both cases, the VR user had arguably little to no awareness of the non-immersed user other than through the directed visual references, while the non-immersed user could somewhat “monitor” to VR user through the shared (mirrored) point-of-view at all times. This circumstance contributes to a rather unequal interplay between the users out of the gate.
However, there are also some interesting examples that aim to leverage on more equal contributions in asymmetric user role setups. For instance, Sugiura et al. (2018) investigated asymmetric collaboration between a VR user and (potentially) multiple non-immersed users around an interactive tabletop system within the context of interior design. While the VR user got to perceive the living space from an in-situ, real world-like perspective, the tabletop system featured a top-down view that allowed its users to see the position and orientation of the VR user as well as providing an overview of the living space (Sugiura et al., 2018). Immersed and non-immersed users were provided with features to point to targets of interests that were visually indicated in their collaborator’s respective interface (Sugiura et al., 2018). Gugenheimer et al. (2017) describe design guidelines for co-located asymmetric VR experiences based on insights gained from studies using their developed ShareVR prototype. The prototype allowed different types of interaction between an HMD and a non-HMD user based on a combination of VR and floor projection technologies. Among others, they emphasize on the importance to leverage on asymmetrical aspects, carefully considering each user’s roles in order to design meaningful interactions for collaboration accordingly. Insights and experiences of co-located asymmetric interaction between an HMD and a non-HMD user are described by Lee et al. (2020). The authors designed an application where each user assumed distinct roles, designed after their respective level of immersion, assuming a spatial relevant role for the HMD user and a more temporal one for the non-HMD user (Lee et al., 2020). The presented prototype featured a game-like experience that tasked the two collaborators to actively work together in order to navigate successfully through a maze, and was used to evaluate presence, game experience, and different aspects of the users’ roles within the scope of multiple experiments (Lee et al., 2020). The results indicate a higher than usual level of immersion of the non-HMD user due to the more active role and involvement in the overall task setup, as well as similar levels of enjoyment and social interaction among both user roles (Lee et al., 2020).
2.3 Considerations and Motivation
The recent advances in immersive technologies in general, as well as reviewing existing work as described thematically through Section 2.1 and Section 2.2, provide exciting opportunities for further research in these directions. For instance, a recently published literature survey of IA research, covering the years from 1991 to 2018, revealed that out of the identified 127 system papers, i.e., papers that describe and potentially evaluate an IA system, only 15 focused on collaboration (Fonnet and Prié, 2021). Fonnet and Prié (2021) go on to put this lack of research further into perspective, arguing that collaboration is widely considered one of the major aspects for the future success of IA. Their argument is in line with the reports and statements of other IA research (Billinghurst et al., 2018; Skarbez et al., 2019; Wang et al., 2019). In fact, 17 key research challenges in regard to IA have been recently defined by 24 experts, five of which are dedicated towards the topic of Collaborative Analytics, further highlighting the importance of collaborative aspects within this context (Ens et al., 2021). While collaboration in the same immersive environment using similar technologies is certainly one interesting direction for research, there are also exciting possibilities of combining immersive and non-immersive display and interaction technologies. After all, IA aims to provide novel, intuitive, and purposeful 3D data analysis tools that complement and synergize with InfoVis and VA workflows rather than replacing them (Isenberg, 2014; Cavallo et al., 2019; Wang et al., 2019).
In addition to the insights and directions as presented in the current state-of-the-art, we are also motivated to further explore the matter of bridging interactive InfoVis and IA based on some of our initial investigations (Reski et al., 2020b). More specifically, we investigated the mixture of applying immersive and non-immersive interfaces within the scope of a real world case study in the context of the digital humanities, allowing pairs of language students to analyse language variability on social networks (Reski et al., 2020b). Based on a sociolingustic context and an explorative data analysis scenario, i.e., undirected search without hypotheses (Aigner et al., 2011, Chapter 1.1), the immersed student analysed the social network data from a geospatial perspective, while the non-immersed student focused their efforts on aspects of textual analysis (Reski et al., 2020b). Both interfaces provided functionalities that allowed the students to send discrete signals to their peer, i.e., when they discovered something noteworthy in the data that they wanted to share, they could make a visual data annotation (Reski et al., 2020b). Based on the results of the user study, we were able to validate the usability of the presented interaction and collaborative between a pair of users where one was inside VR, while the other remained outside, each for their own dedicated data analysis purpose (Reski et al., 2020b). Based on these prior insights and experiences as well as the various described literature throughout Section 2.1 and Section 2.2, our overall stance in regard to CIA has not changed and involves 1) envisioning a synergy between immersive and non-immersive analytics applications, 2) endorsing the mentality that different visualization and interaction approaches can satisfy different data exploration and analysis needs, and 3) encouraging collaboration between multiple users to support joint analytical reasoning and data understanding, independent of their role and background, i.e., experts and novices are considered similarly (Reski et al., 2020b). For this purpose, we aim to investigate collaborative aspects in a scenario where two analysts explore a multivariate dataset at the same time from different perspectives, immersed and non-immersed, each assuming a distinct role in order to contribute to the joint data exploration activity. While various synchronous asymmetric research assumes the non-immersed user commonly in a more “guiding” or “assisting” role (Peter et al., 2018; Thomsen et al., 2019; Welsford-Ackroyd et al., 2020; Ens et al., 2021), our objective is to provide a use case where the involved analysts may contribute more equally, each based on their application and viewpoint. Furthermore, as IA technologies become more accessible in the future, it is of value to the community to investigate the integration with existing tools and practices that are common in the InfoVis and VA community, as for instance emphasized by Wang et al. (2019) and Cavallo et al. (2019). A fundamental aspect within this context is concerned with providing features that address aspects to support and facilitate the collaborative workflow: While both immersive and non-immersive application have to serve their own purpose and modality, it is important to consider anticipated means of communication and coordination between the collaborators in order to provide meaningful interface extensions that assist them with these endeavours. The design for collaborative information cues is particularly important within the context of immersive technologies, as they are often user-centered in nature, i.e., display and interaction technologies are by default rather tailored to be experienced by a single user (Skarbez et al., 2019). As such, they introduce more remote-like characteristics in regard to potential collaboration, even in co-located scenarios, and important visual information cues (gestures, mimic) are not as easily accessible, if at all. Consequently, nonverbal communication features become particularly important in such a setup (Cruz et al., 2015).
In order to move further in these directions, the objective of our investigation is to explore a representative use case that integrates immersive VR (HMD, 3D gestural input) technologies with non-immersive desktop ones within the context of CIA. Using our designed and implemented system, allowing pairs of participants to explore a spatio-temporal dataset, we aim to conduct an exploratory user interaction study in order to investigate important collaboration dimensions as outlined by Churchill and Snowdon (1998) and Snowdon et al. (2001), in particular Transitions between Shared and Individual Activities, Negotiation and Communication, Sharing Context, and Awareness of Others. Based on our methodology, we also intend to make assessments in regard to usability, user engagement, as well as additional collaborative aspects such as the pairs’ overall verbal communication activity and data exploration strategy, aiming to provide further insights about their collaboration within the presented context. In contrast to our earlier investigation (Reski et al., 2020b), the empirical evaluation presented in this article differs in some key aspects: 1) Both the immersive and the non-immersive interface focus on the analysis of spatio-temporal data under utilization of appropriate visualization approaches (Lundblad et al., 2010; Ward et al., 2015; Reski et al., 2020a); 2) The collaborative features to allow referencing across the interfaces are integrated more seamlessly through continuous signaling without the need to take dedicated actions to send discrete annotations; 3) Pairs of users use the developed system with the aim to complete a confirmative analysis task, i.e., a directed search to extract insights from the data (Aigner et al., 2011, Chapter 1.1); 4) In addition to usability (Brooke, 2013), we also examine aspects of user engagement (O’Brien et al., 2018) and collaboration in virtual environments (Churchill and Snowdon, 1998; Snowdon et al., 2001) including a quantitative audio activity analysis of the user pairs.
3 Scenario and System Overview
Based on our considerations and motivations as described in Section 2.3, we are particularly interested in scenarios that involve a hybrid asymmetric setup, enabling multiple users to explore and analyse a spatio-temporal dataset in synchronous collaboration. These key components are defined as follows:
• hybrid: The use of heterogeneous device types, i.e., a mixture of immersive 3D and non-immersive 2D display and interaction technologies.
• asymmetric: Multiple users assume different roles, naturally influenced by the interface they operate.
• explore and analyse: Explorative and confirmative data analysis according to the definitions by Aigner et al. (2011, Chapter 1.1), i.e., the exploration of a dataset to gain first insights or to confirm/reject hypotheses about the data.
• spatio-temporal dataset: A multivariate dataset, where each data item features data variables in regard to spatial (e.g., geolocation) and temporal (i.e., time) dimensions.
• synchronous: The data exploration and analysis activity is conducted by all users at the same time.
• collaboration: Multiple users work together, supported through means of communication and coordination.
The objective with such a scenario is to satisfy a desired analytical workflow that incorporates different display types and interaction modalities (Wang et al., 2019; Cavallo et al., 2019; Isenberg, 2014), where collaborators are potentially coming from different domains, providing each their own perspectives and data insights, anticipating a rather equal interaction instead of a remote expert scenario (Ens et al., 2019). For this purpose, we set out to develop a system consisting of various components, as illustrated in Figure 1. An immersive VR environment allows for the interaction with spatio-temporal data using a 3D Radar Chart approach, as introduced and validated in our previous work (Reski et al., 2020a). Using a non-immersive desktop terminal, an analyst is able to explore different data variables of the same multivariate dataset in a representative interactive InfoVis interface. A real-time networking interface between the immersive VR environment and the non-immersive desktop terminal, allowing for the transfer of state updates in each interface to the other respectively, is responsible for providing various synchronous collaborative features. Such state updates include features, implemented in both the immersive and non-immersive interface, that allow each analyst to send and retrieve spatio-temporal references in their interface, aiming to facilitate their overall collaboration. Furthermore, we envision that both analysts are able to verbally communicate, i.e., talk to each other, either locally in close physical proximity or remotely via an established audio-link. In anticipation to the designed task as part of our empirical evaluation (later described in Section 4.1.2), we created a multivariate dataset that features spatio-temporal plant and climate data variables, partially inspired by existing use cases and open data sources. Within the scope of our investigation, the immersed analyst assumes the role of the plant expert, while the non-immersed one assumes the role of the climate specialist. It is noteworthy that both interfaces are data-agnostic, thus the developed system is able to support similar other use cases in the future with only minimal programming and data processing efforts.
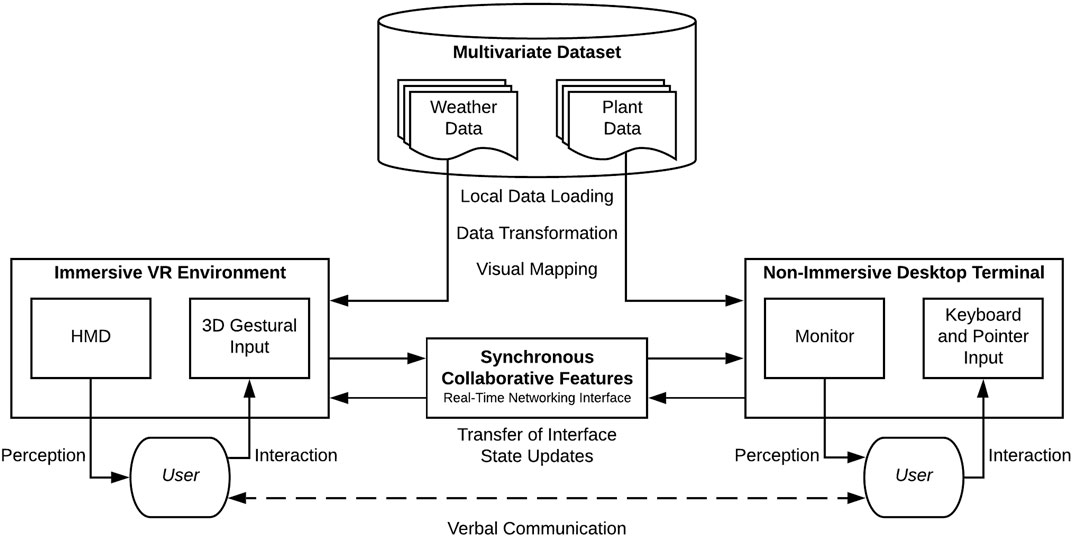
FIGURE 1. Overview of the system architecture, illustrating all major components: (1) Multivariate Dataset, (2) Immersive VR Environment, (3) Non-Immersive Desktop Terminal, and (4) Synchronous Collaborative Features.
The remainder of this section describes each of the system’s components in more detail, including some insights in the implementation. A video demonstrating the developed system in action is available online.1
3.1 Multivariate Dataset
We considered a variety of open data sources for real-world inspiration and potential use.2 With our anticipated empirical evaluation in mind, we wanted to present the collaborators with a task that would allow them to specifically investigate and search for targeted insights, much in line with the task concept of a confirmative analysis as opposed to a more open-ended explorative analysis task as featured in our prior study (Reski et al., 2020b). A confirmative analysis task allows for a more direct task performance comparison among the different study sessions. Therefore, we needed a more “benchmark-like” dataset that would allow us to define a representative real-world data exploration task that could be handed over to the participants in the user interaction study, and used to assess in a comparative way their ability to complete a specific task using the developed interfaces. Unfortunately, to the best of our assessment, none of the existing real world data would have allowed us to easily achieve this.
Consequently, we created our own custom, representative multivariate dataset featuring artificially generated data. The data context is held purposefully simple to understand, allowing us to be as inclusive as possible in respect to the recruitment of participants, as no specialist knowledge is required. With the focus on spatio-temporal data, we generated time-series of plant and climate data variables for 39 countries (locations) in Europe. Each country features five plant data variables (different types of fruits or vegetables depending on the task scenario) as well as two climate data variables (sunlight and humidity). Finally, each of these seven data variables per location feature 150 time events. Thus, there is a total amount of 40,950 data values in the generated dataset.3 The special property of this artificially generated dataset is that each of five plant dimensions features either a positive or negative correlation to each of the two climate variables. While the values for all of the variables are diverse across the different locations, the correlations are consistent with a defined model, i.e., the correlations between the two climate and the five plant variables are the same independent of the location. Using this dataset, we are able to task the collaborators with the objective to analyse the data and identify these correlations by using their respective interfaces and implemented collaborative features (described in more detail in Section 4.1.2). Thus, the dataset of correlated timelines is appropriate for the design of confirmative analysis tasks (Aigner et al., 2011, Chapter 1.1).
For each location, the two humidity and sunlight climate timelines were generated using an R function.4 Each of the five plant5 timelines were generated by adding the humidity and sunlight timelines, multiplied by the weights as dictated by the model (either one or minus one, to indicate a positive or negative correlation respectively). These timeline data were further validated to confirm the compliance to the model used.6 A repository containing the datasets and the R code used to generate them (with examples of usage) is available online.7
3.2 Immersive Virtual Reality Environment
The immersive VR environment features an extended version of some of our earlier work (Reski et al., 2020a), utilizing a 3D Radar Chart approach for the interaction with time-oriented data. Adopted from the original two-dimensional approach, also known as Kiviat figures or star plots, presenting values for different data variables in a radial arrangement (Kolence, 1973; Kolence and Kiviat, 1973), we use the third dimension to visualize the time-series for each of the data variables. The result is a three-dimensional visualization of multiple data variable axes, radially arranged around a central time axis, with the individual data variable axes extending accordingly. Using immersive display technologies, i.e., an HMD, the user can observe and get impressions about all the different time-series data by naturally moving around and inspecting the 3D visualization, recent time events located at the top, while older ones are placed towards the bottom. Additionally, by utilizing 3D gestural input, certain interactive features are provided, allowing the user to interact with the visualization in a natural way by using their hands. The concept and design as well as reflections on the overall validated approach have been reported, indicating that the VR interface can be used for explorative data analysis (Reski et al., 2020a). Compared to the earlier version (Reski et al., 2020a), we made several changes and extensions to the VR interface, for instance 1) removing all graphical hand menus with the aim to focus on more natural hand selection and manipulation techniques instead of system control ones (LaViola et al., 2017, Chapters 7 and 9), and 2) implementing additional features, e.g., to support filter and reconfiguration tasks. Figure 2 and Figure 3 provide some impressions of the functionalities of the developed VR environment as described in detail throughout the remainder of this section.
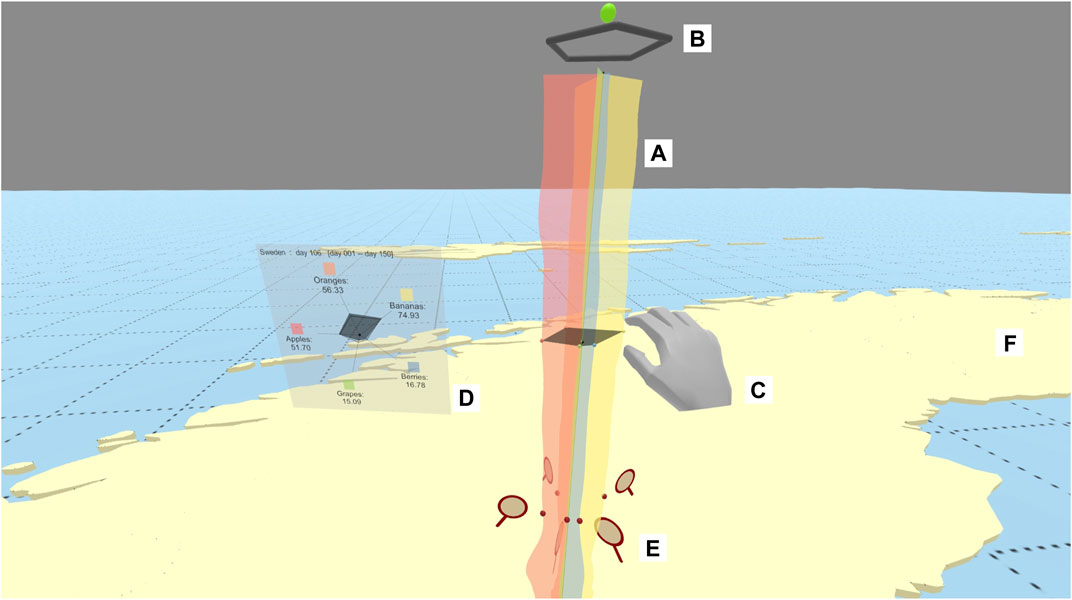
FIGURE 2. Overview of the developed immersive VR environment (see Section 3.2). Annotations: (A) Data Variable Axes with (vertical) Time Axis representing the 3D Radar Chart; (B) Activation Toggle and Rotation Handle; (C) 3D Gestural Input and Time Slice; (D) Information Window; (E) Temporal Reference (time event) created by the non-immersed user (feature described in Section 3.4); (F) Country as 3D extruded polygon on the floor. A link to a video demonstration is available in Footnote 1.
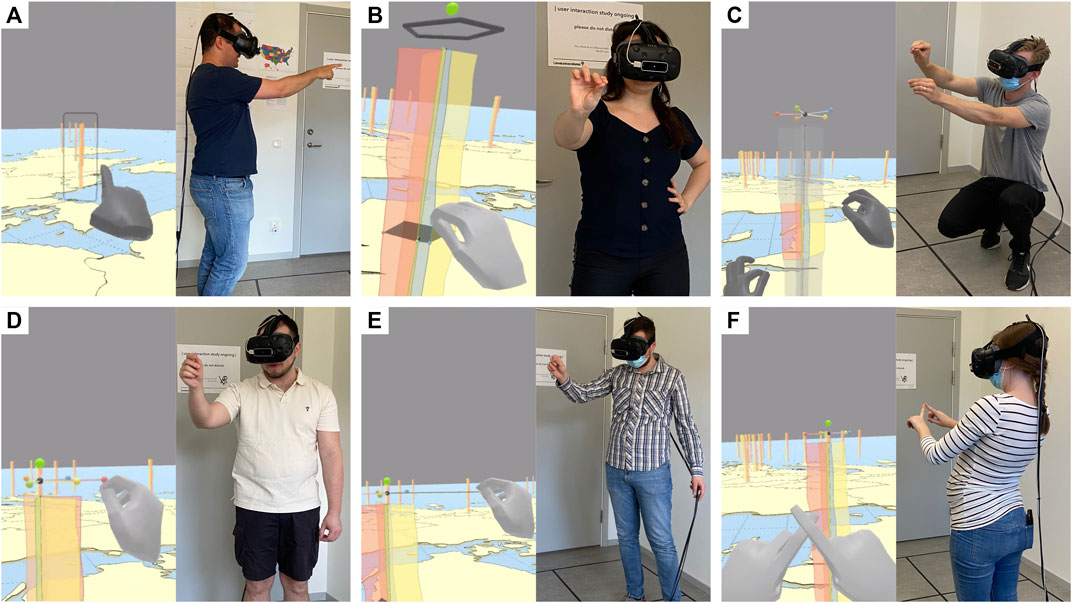
FIGURE 3. Different functionalities of the developed immersive VR environment (see Section 3.2), as operated through various participants during the empirical evaluation. Functionalities: (A) Target-based travel; (B) Time event selection via Time Slice grab; (C) Time range selection via “live sculpting”; (D) Data variable axes reconfiguration (sort); (E) Data variable axes filter; (F) State reset. A link to a video demonstration is available in Footnote 1.
3.2.1 Immersive Environment Setup
The immersive VR environment features on the floor a visual representation of the European countries as 3D extruded polygons (see Figure 2F). Based on the generated data for 39 locations (see Section 3.1), 39 individual 3D Radar Charts are placed in the VR environment, each at the center of its associated country. Each 3D Radar Chart features five color coded, semitransparent data variable axes, one for each plant type, representing the data in that location (see Figure 2A). Thus, a total of 29,250 data values are displayed in the immersive VR environment.8 Based on a room-scale two-by-two meter area, the user, wearing an HMD with a 3D gestural input device attached, can walk around to investigate and interact with those charts in close proximity. The 3D gestural input (see Figures 2C, 3) allows for the implementation of various (hand) interaction techniques in the VR environment, in our case a mixture of hand-based grasping, indirect widget, and bimanual (gestural command) metaphors (LaViola et al., 2017, Chapters 7, 8, and 9).
3.2.2 Spatial Data Exploration
To move closer to charts in the virtual environment that are placed “beyond” the physical real world limitations, a target-based travel mechanism has been implemented using a mixture of gaze-based input and gestural command: By simply looking around, the user can center their gaze on one of the several 3D Radar Charts in the VR environment, which will prompt a visual outline for user feedback, at which point the user can then make a hand posture to point towards the chart (index finger extended, all others not extended) in a “I want to go there”-like motion (see Figure 3A), initiating a translation of the user’s virtual position to the center of the chart. Additionally to this spatial exploration, making general observations to get an overview and potentially identifying interesting visual patterns, the user can also engage into more active contextual interaction with an individual 3D Radar Chart, displaying details-on-demand in regard to the temporal data variables (Shneiderman, 1996). While the user is engaged into such details-on-demand investigation with an individual 3D Radar Chart, the gaze-and-point target-based travel mechanics are inactive. In order to be able to move again to “far away” charts, the user is required to first disengage and deactivate the details-on-demand state of a 3D Radar Chart.
3.2.3 Temporal Data Exploration
Each chart features above it a minimalistic sphere as an Activation Toggle that the user hand simply touch to iterate through three states: Activate/Rotate, Reconfigure/Filter, and Deactivate (see Figure 2B). Once activated, the chart will display its Time Slice, a 2D mesh representing the classical radar chart pattern, integrated to connect the values of the data variable axes in order to represent the currently selected time event (see Figure 2C). Using 3D gestural input, the user can grab the Time Slice to move it up and down in order to make selections forward and backward in time, automatically adjusting the Time Slice’s mesh to represent the values for the updated time event (see Figure 3B). The integrated Time Slice aims to facilitate data interpretation and visual pattern detection when investigating the time-series data in more detail (Reski et al., 2020a). An Information Window is anchored and displayed next to the Time Slice (see Figure 2D), providing additional numerical information about the selected time event, by presenting a traditional radar chart visualization with annotated numerical values, names, and color coding for the selected time event as well as an outlined radar that represents the averages for each data variable across the displayed time-series. By using a two-hand pinch technique (index finger and thumb touching in each hand respectively) close to the chart, the user can select a time range from the time-series to focus on (see Figure 3C). The pinching allows for a “live sculpting” of the desired time range, which is visually highlighted by removing the color from the data variable segments that are not included in the selection. By keeping the colorless semi-transparent segments outside the time range selection visible, the user is still able to perceive a preview of the time-series, maintaining information accordingly – another change compared to our initial version (Reski et al., 2020a). It is noteworthy that the outlined radar chart as part of the Information Window, representing the displayed averages across all data variables, updates to the applied time range selection. The visualization also features a Rotation Handle, allowing for convenient rotation of the 3D Radar Chart in place (see Figure 2B). The Reconfigure/Filter Handle features color coded spheres that are placed above each of the data variable axes and connected to the time axis origin. By grabbing the individual spheres, the user can manipulate the angular position of the linked data variable axis and thus reconfigure (sort) the radial arrangement (see Figure 3D). Additionally, the user can also grab and pull each individual sphere away far enough from the time axis origin until its visual connection “snaps”, effectively removing the linked data variable axis, i.e., filter out undesired data (see Figure 3E). Finally, by making a two-hand index finger cross posture, the user is able to reset the state of the entire 3D Radar Chart, displaying all available data variable axes as well as automatically selecting the entire available time-series range (see Figure 3F).
3.3 Non-Immersive Desktop Terminal
The non-immersive desktop terminal is designed as an interactive InfoVis, enabling its user to explore the climate data variables, i.e., sunlight and humidity, for each of the country locations based on the generated dataset (see Section 3.1). It is operated through a normal desktop monitor using keyboard and pointer (mouse) input. At this stage, the desktop terminal is held purposefully minimalistic but representative given the data context, using typical views and visualization techniques for geospatial and time-oriented data, for instance as described by Ward et al. (2015, Chapters 6 and 7) or as illustrated by Lundblad et al. (2010), who use a similar setup in their application. At this stage of the presented research, our intention with this approach is to focus on the integration of those interactive views that are relevant to within data context and will contain collaborative features (see Section 3.4). Figure 4 provides an overview of the developed desktop terminal.
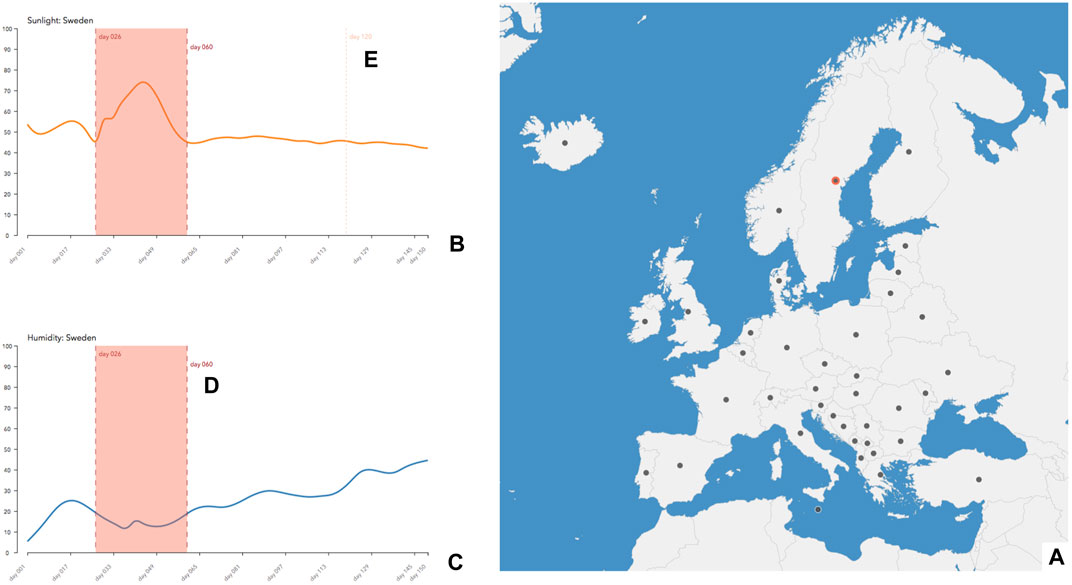
FIGURE 4. Overview of the developed non-immersive desktop terminal (see Section 3.3; without collaborative information cues from VR interface). Annotations: (A) Map View, with Sweden selected; (B) Climate View - Sunlight; (C) Climate View - Humidity; (D) Time Range Selection, synchronized across both Climate Views; (E) Preview Line (through pointer hover). A link to a video demonstration is available in Footnote 1.
3.3.1 View Composition and Interaction
The right part of the interface features a Map View, displaying outlined the individual countries across Europe (see Figure 4A). An interactive node is placed at the center of each country, allowing the user to left-click and select the corresponding location accordingly. It is noteworthy that each node is placed at the exact same position as the individual 3D Radar Charts in the immersive VR environment (see Section 3.2). Once a location has been selected, indicated through a colored node outline in the Map View, it updates the Climate View on the left part of the interface, composed of two line graphs, each representing one of the climate data variables (sunlight and humidity) for that country (see Figures 4B,C). Each line graph’s horizontal axis encodes time, while the vertical one encodes the data value. By hovering over a line graph, a vertical dashed Preview Line provides some additional visual feedback in regard to the hovered time event (see Figure 4E). The user can select the hovered time event via left-click. With a single time event selected, the user can also select a time range through a combination of holding the COMMAND-key and left-click, effectively spanning a continuous interval along the time-series data from the first time event selection to the new one, indicated through a visual overlay (see Figure 4D). Time event and range selections can be updated by simply making new time selections in the interface, replacing the prior ones accordingly. Furthermore, time event and range selections are synchronized across the two line graphs, i.e., making a selection in one line graph will automatically display the same selection in the respective other one.
3.4 Synchronous Collaborative Features
As described throughout Section 2, providing system features to support collaboration within synchronous hybrid asymmetric data analysis is not a trivial task and requires careful design considerations. In order to investigate the various collaboration dimensions as illustrated by Snowdon et al. (2001) within the scope of our investigation (see Section 2.3 and Section 4.2.3), we partially draw from the insights gained in a previous investigation (Reski et al., 2020b). In particular, we intend to facilitate the collaborators’ verbal communication, easing the way they together discuss, interpret, and make meaning of the data, allowing for an overall natural joint data exploration independent of the applied display and interaction technologies. For that purpose, we designed and implemented a set of synchronous collaborative features across the immersive VR environment and the non-immersive desktop terminal with the following objectives in mind:
• Support of the collaborator’s mutual understanding during their joint data exploration, i.e., facilitate Common Ground and Awareness (Heer and Agrawala, 2008).
• Support for sending and retrieving spatio-temporal references in each of the collaborators’ respective interfaces during their joint data exploration, i.e., facilitate Reference and Deixis (Heer and Agrawala, 2008) and nonverbal communication cues in general (Churchill and Snowdon, 1998).
• Integration of any collaborative features in a seamless and ubiquitous manner, aiming to add collaborative information cues to the respective interfaces without unnecessarily increasing the complexity of their operability.
3.4.1 Collaborative Information Cues: VR to Desktop
The following collaborative information cues from the immersive VR environment are displayed in the non-immersive desktop terminal. The Map View features an added node that represents in real-time the position and field-of-view, i.e., orientation, of the VR user, allowing the desktop user to have an understanding of the VR user’s location in space (see Figure 5A, right), The location node, representing the 3D Radar Chart that the VR user is potentially actively interacting with (details-on-demand) is outlined accordingly in the Map View as well, indicating the VR user’s current engagement with it. If both collaborators are interacting with the same location, the Climate View features a vertical dashed line representing the VR user’s current time selection, i.e., the position of the Time Slice (see Figure 5B, right). Similarly, if the VR user applies a time range selection, an overlay in both of the line graphs is visualized in the Climate View accordingly (see Figure 5C, right). All interface elements representing information cues of the VR user are color coded differently to easily discern them from the desktop user.
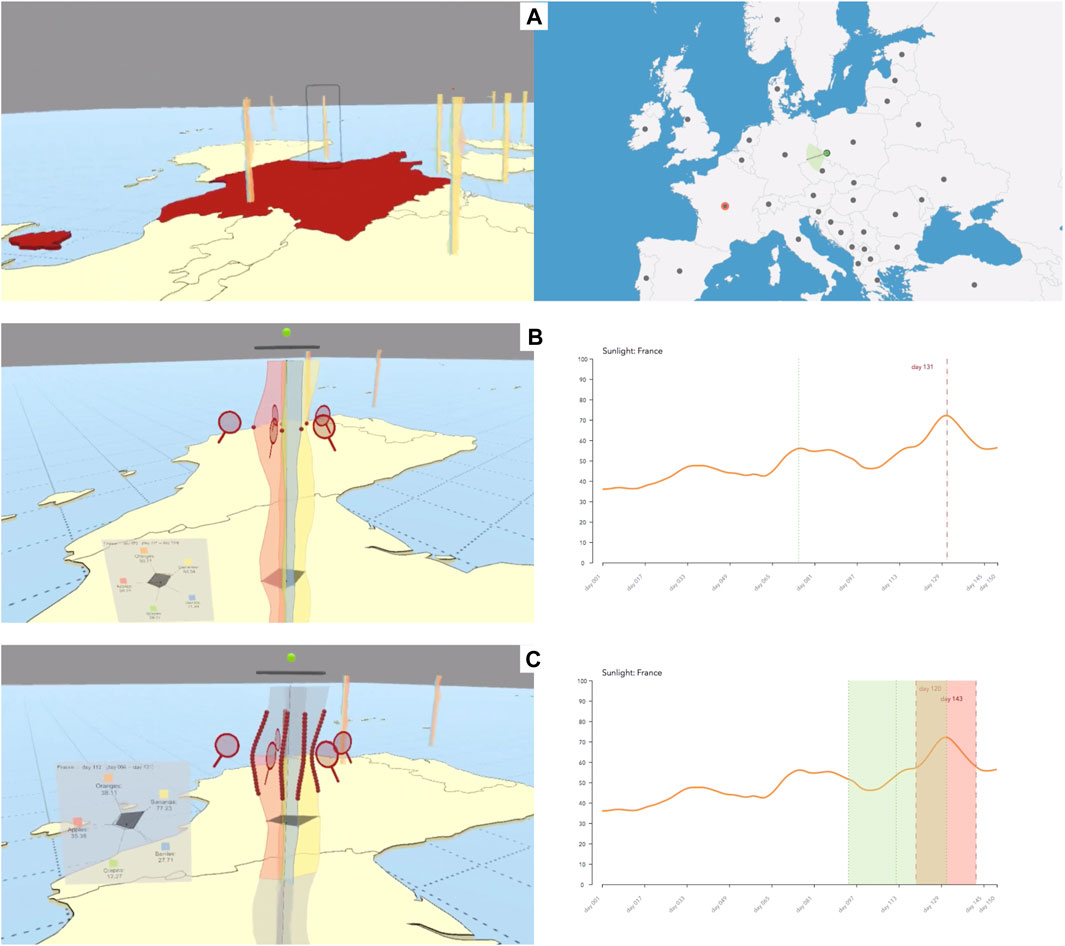
FIGURE 5. Overview of the synchronous collaborative features as integrated across the immersive (left) and the non-immersive (right, excerpt) interface (see Section 3.4). The screenshots of both interfaces were taken at the same time. Annotations: (A) Spatial referencing through sharing the immersed user’s position and orientation in the Map View, with France selected by the non-immersed user and highlighted accordingly in VR; (B) Temporal referencing (time event) across both interfaces; (C) Temporal referencing (time range) across both interfaces. A link to a video demonstration is available in Footnote 1.
3.4.2 Collaborative Information Cues: Desktop to VR
The other way around, the following collaborative information cues from the non-immersive desktop terminal are displayed in the immersive VR environment. Location selections made in the Map View will temporally highlight the corresponding country, extruded in 3D on the floor in the VR environment, in a different color, assuming the VR user is not already actively interacting with the 3D Radar Chart at that location (see Figure 5A, left). Time event and time range selections made in any of the two line graphs of the Climate View will be represented as virtual annotations in the corresponding 3D Radar Chart (see Figures 5B,C, left). More specifically, the selected data values across all data variables in 3D will be highlighted, aiming to catch the VR user’s attention as well as, in case of a time range selection, indirectly providing information about the amount of selected time events (“resolution”). Furthermore, a virtual symbol in the form a magnifying glass, aligned in space with the respective time selection, provides an additional cue to catch the VR user’s attention in the immersive VR environment, figuratively indicating that the desktop user is currently “investigating in this time context”.
3.5 Implementation
The multivariate datasets (see Section 3.1) were created using R. The generated CSV files are loaded and parsed locally by both the immersive and non-immersive interface.
The immersive VR environment (see Section 3.2) utilizes a commercially available HTC Vive HMD (1080x1200 pixel resolution per eye, 90 Hz refresh rate), with a Leap Motion controller for the 3D gestural input attached to it and running the Ultraleap Hand Tracking V4 (Orion) software. The room-scale VR setup is calibrated as a two-by-two meter area for the HMD wearer to freely move in. The VR interface is developed using Unity 2019.3 under utilization of the additional packages SteamVR Plugin for Unity 1.2.3 and Leap Motion Core Assets 4.5.1. The initial version of the 3D Radar Chart implementation is available online,9 serving as the foundation for the applied changes and extensions as described throughout Section 3.2. A custom implementation to create extruded polygons10 was used in order to visualize the European countries on the floor as provided through the R package rworldmap.11 A logging system (see Section 4.2.1) has been integrated into the Unity application as well.12
The non-immersive desktop terminal (see Section 3.3) is running in fullscreen on a 27-inch display with a resolution of 2560x1440 pixels, operated through a standard keyboard and mouse. The interface is implemented using web technologies, i.e., HTML5, CSS, and JavaScript, as well as the D3.js (5.0.0) and TopoJSON (3.0.2) libraries.
The synchronous collaborative features (see Section 3.4) are realized through the implementation of a real-time communication interface based on the WebSocket Secure protocol. The server is implemented using Node.js (v.4.2.6), with respective WebSocket endpoint implementations in the Unity and JavaScript client applications accordingly.13
4 Methodology
In order to assess how the developed system and its provided features are used by human users for collaborative data analysis in practice, we planned an empirical evaluation in the format of an user interaction study. This section describes the study design and applied measures.
4.1 Study Design
The study was conducted with pairs of participants who alternated the roles of one person being immersed in VR, and the other using the non-immersive web application (within-subject design). One researcher was responsible for the practical conduction of the study and joined the pair, taking care of the study moderation, ensuring the developed system was functioning as intended, making observations and taking notes during the pair’s task completion, and furthermore documenting the process.
4.1.1 Setup and Environment
The study was set up in a controlled environment at our research group lab. The lab features a square two-by-two meter area, designated for the VR user to move freely without obstacles. There is enough space in the lab for the researcher’s workplace, from which the study moderation was conducted. Additionally, the lab features a workbench that is divided using a physical partition from the researcher’s workplace, allowing the VR user to complete their informed consent and questionnaires with pen and paper. The user operating the web application was seated alone in a dedicated separate office that featured a workbench with a computer, a 27-inch monitor, keyboard and mouse, as well as enough space to write down notes and complete the informed consent and questionnaires with pen and paper. Detailed information about hardware and software are described in Section 3.5. Additional remarks in general as well as in regard to the ongoing COVID-19 pandemic during the time of the study are stated in the article’s Ethics Statement.
4.1.2 Task
The pair of participants used different interfaces (hybrid); the choice of interface additionally affected which part of the dataset they had access to, and therefore determined their role (asymmetric). Using the non-immersive interface provided access only to the climate data within the desktop application, while using the immersive interface provided access only to the plant data within the virtual environment. This made the users “climate” and “plant” experts respectively; these roles would flip with the switching of the interfaces for the second study task (within-subject design).
The collaborative nature of the tasks required them to work together to determine the correlations of each of the climate parameters to each of the plant parameters; the non-immersive user was additionally tasked to write down the answers, and any worthwhile observations, for both participants (using printed sheets that were provided; these are included in this article’s Supplementary Material).
Due to the artificial nature of the datasets, each of the pair’s answers could be checked against the model used to generate them, making the nature of this study a confirmative analysis (Aigner et al., 2011, Chapter 1.1) compared to the explorative analysis of our previous study (Reski et al., 2020b).
The choice of context (climate and flora at different locations across Europe, and how the climate conditions affect the plant growth) was chosen as concepts familiar to all participants. At the same time, any previous knowledge of geography and agriculture had to be dismissed, therefore the study was presented with a “science fictional” description to the participants that had to suspend their disbelief and pretend that they were exploring a parallel universe in the far future instead of working with real observations that followed known phenomena. The detailed task description, as it was presented to participants in our user interaction study, is included in the article’s Supplementary Material.
4.1.3 Study Procedure
Each study session followed the same procedure of three stages: 1) introduction, 2) fruits task scenario, and 3) veggies task scenario. The overall duration was aimed at approximately 2 hours, including all three stages. The initial choice of which participant used which interface was random. For the two task stages, the participants were encouraged to explore the data and complete their task at their own pace. However, for practical purposes, the pair was given a duration of approximately 30 min to aim for and to have a frame of reference in regard to their task completion progress. Whether the pair required more or less time, was up to them. Consequently, each participant was anticipated to spent approximately 35 min (5 min warm-up; 30 min task) immersed in VR.
In the introduction, the participants were first welcomed and then asked to fill out an informed user consent in regard to their participation. Afterwards, demographic information about the participants’ background and prior virtual reality experiences were inquired. The moderator provided an overview about the two applications and their collaborative features, as well as about the data context and the task for their upcoming joint data explorations, i.e., the first and second task stages.
For the first task, each participant of the pair assumed their role and respective application. Using a special warm-up dataset, different from each of the two task scenario datasets, the participants were provided with the opportunity to warm-up and become familiar with their interfaces and the collaborative features. Once the pair felt comfortable, the moderator loaded the task scenario dataset and issued the start for the pair’s task completion by initiating the audio recording. During the tasks, the pair could only talk to each other, while the moderator refrained from making any comments to the pair, only writing down noteworthy observations. Once the pair considered themselves to be done with their task by speaking aloud “We are done with the data exploration” (or equivalent), the moderator stopped the audio recording. The participants were then asked to complete three questionnaires (in order): System Usability Scale (SUS), User Engagement Scale - Short Form (UES-SF), and our Spatio-Temporal Collaboration Questionnaire (see Section 4.2.3).
After a short break in which the moderator made several preparations, the participants switched their assumed roles and applications, and the second task stage started by following the same procedure as in the first one (warm-up, task, questionnaires). Finally, the pair was thanked for their participation and sent off. If they inquired about their task performance, they were informed after the study completion.
4.2 Measures
In order to investigate our research objective as described in Section 1 and Section 2.3, we assessed usability, user engagement, and aspects of the pair’s collaboration. For that purpose, we applied a mixture of quantitative and qualitative measures to collect data.
4.2.1 System Logs and Task Assessments
We collected system logs of all the participants’ interactions with their respective interfaces during the task sessions. Each log entry consists of a timestamp (in seconds), a user identifier, and multiple fields that describe the various contextual interactions in detail, e.g., a movement to a specific location or the selection of a specific time event or time range. Since all interactions in the non-immersive interface are communicated to the immersive interface via real-time communication interface, we decided to log the interactions for both users conveniently unified in one place. The outcome is a CSV file that can be easily processed according to our interests. For instance, an analysis can be conducted to identify when the collaborators were actively investigating the data in the same spatial location, or in regard to when each collaborator moved from location to location, to name just two examples. Within the scope of the presented collaborative system, we implemented the system logging for both interfaces as a separate lightweight module that is integrated as part of the VR application (see Section 3.5).
Based on the designed data analysis task as described in Section 4.1.2, we are able to assess the pair’s ability to collaboratively identify the potential correlations between the plant and the climate dimensions using their respective interfaces. For each task, this results in a total of ten correlation answers, i.e., five plant data dimensions × two climate data dimensions, each indicating either a negative, positive, or no correlation. While the option to answer no correlation was provided, a correlation was always defined by the models used in the fruits and veggies scenarios. Additionally, each of the ten correlation answers included an associated confidence (low, medium, high, or do not know), describing the pair’s reported confidence for their respective answers.
4.2.2 System Usability Scale and User Engagement Scale
To make assessments about the general usability of each interface, the immersive VR and the non-immersive desktop one, we asked the participants to complete the System Usability Scale (SUS) questionnaire (Brooke, 2013, 1996). The SUS is composed of ten 5-point Likert scale items, resulting in an interpretable score between 0 (negative) to 100 (positive) (Brooke, 2013). Additionally, we choose to adopt the adjective ratings as proposed by Bangor et al. (2009), further facilitating the interpretation of the numerical score and explanation of the results.
Furthermore, to gain insights about the collaborators’ general engagement with their respective interface, we asked them to complete the User Engagement Scale - Short Form (UES-SF) questionnaire (O’Brien et al., 2018). As opposed to the much more extensive 30 item Long Form version, the UES-SF consists instead of only twelve 5-point Likert scale items, i.e., three items for each of its four factors: Focused Attention, Perceived Usability, Aesthetic Appeal, and Reward (O’Brien et al., 2018). Scores on a scale from 1 (negative) to 5 (positive) can be calculated for each of the four factors individually as well as an overall engagement score (O’Brien et al., 2018).
Assessing system usability and user engagement within the scope of our task allows to gain further insights into the implemented data exploration interfaces and their collaborative features. While both interfaces are using fundamentally different display and interaction technologies, we believe it is important to potentially identify factors that might impact the pair’s collaboration. The SUS and the UES-SF questionnaires are comparatively inexpensive data collection methods, and are both widely recognized and applied in the research community (Brooke, 2013; O’Brien et al., 2018).
4.2.3 Spatio-Temporal Collaboration Questionnaire
With our research objective in mind, we are motivated to investigate aspects of the pair’s collaboration. In particular, additionally to observations through a researcher, we are interested in the pair’s own perception of their collaboration after the task completion. For that purpose, means of self-reporting through the participants are required, commonly implemented through Likert scale statements (quantitative) or open-ended interview-like questions (qualitative). To the best of our knowledge, there is no dedicated standardized CSCW questionnaire for the purpose of investigating collaboration in virtual environments. We also examined potential alternatives, for instance the Social Presence Module as part of the Game Experience Questionnaire (Poels et al., 2007; IJsselsteijn et al., 2013), but deemed those not specific enough within the scope and purpose of our investigation, where a pair is exploring and interacting with spatio-temporal data – a comparatively common use case (Fonnet and Prié, 2021).
Consequently, we set out to design a questionnaire to satisfy our needs. Based on relevant literature, we started by identifying important aspects and dimensions of collaboration. Dix (1994) presents a general framework for CSCW by dissecting its components in Cooperative Work and various aspects of Computer Support, i.e., Communication, Computerized Artefacts of Work, and Non-Computerized Artefacts. Throughout the framework, the importance of communicative aspects as part of cooperative work is emphasized, in particular as Computer Mediated Communication, arguing for its appropriate integration respectively (Dix, 1994). Within the context of CSCW, four key features that collaborative virtual environments should strive to support are defined by Snowdon et al. (2001) as follows: Sharing Context, Awareness of Others, Negotiation and Communication, and Transitions between Shared and Individual Activities. A conceptual framework and taxonomy by Gutwin and Greenberg (2002) is dedicated to awareness within the context of group work. Awareness, seen as a state of being attentive and informed about the events in a situation and environment, can be maintained rather easy and natural in face-to-face workspaces as opposed to groupware ones that do not feature face-to-face communication (Gutwin and Greenberg, 2002). Gutwin and Greenberg (2002) differentiate between situation awareness, workspace awareness, and awareness maintenance, and move on to propose a Workspace Awareness Framework to describe aspects related to environment, knowledge, exploration, and action. Pinelle et al. (2003) propose a task model to support Collaboration Usability Analysis. They categorize the mechanics of collaboration into different aspects of communication and coordination, and go on to describe their task model that consists of scenario, task (individual and collaborative), and action components. Andriessen (2001) proposes a heuristic classification of the major activities involved in cooperative scenarios according to interpersonal exchange processes (communication), task-oriented processes (cooperation, coordination, information sharing and learning), and group-oriented processes (social interaction). Within the more specific context of Collaborative Visual Analytics, Heer and Agrawala (2008) discuss important design considerations to facilitate collaborative data exploration, among others relevant to Common Ground and Awareness, Reference and Deixis, and Incentives and Engagement.
Based on the insights and impressions gained from the various classifications according to the described literature, all discussing collaboration in regard to similar themes from slightly different perspectives, we subjectively decided to follow and adopt the descriptions by Snowdon et al. (2001), emphasizing various key aspects that collaborative virtual environments should aim to support. We believe that the investigation of Sharing Context, Awareness of Others, Negotiation and Communication, and Transitions between Shared and Individual Activities should allow for the retrieval of insights in regard to different important collaborative aspects, thus providing a “bigger picture” of the collaboration during the completion of an analytical task (Snowdon et al., 2001).
Our self-constructed questionnaire, named the Spatio-Temporal Collaboration Questionnaire, was designed to assess aspects in a setting of synchronous collaboration as follows. It features 17 5-point Likert scale statements that are thematically relevant to the four dimensions as adopted from Snowdon et al. (2001), and described in the following way:
• Transitions between Shared and Individual Activities (TSIA): The interplay between individual and group efforts, including the ability to switch between these, within the scope of collaborative work.
• Negotiation and Communication (NC): Verbal conversation (i.e., talk) facilitated through the ability of utilizing nonverbal information cues in order to discuss and interpret any task-related aspects of the activity (e.g., findings in the data, roles and structure of task approach, and so on).
• Sharing Context (SC): Characteristics and features of the shared space that facilitate and support focused and unfocused collaborative work, leading to shared understandings.
• Awareness of Others (AO): The ability to understand your partner’s activity during times of 1) focused collaboration and active communication (i.e., group efforts), as well as 2) more independent and individual work.
Table 1 presents an overview of all item statements and their Likert scales across these four dimensions. The design of the individual item statements is held purposefully generic, anticipating re-usability, remix, and further adoption for evaluations in similar contexts in the future. Under consideration of our overall scenario and task as described in Section 3 and Section 4.1.2, only the items AO.2, AO.3, AO.5, and AO.6 are rather use case specific in regard to the collaborator’s ability to send and retrieve spatio-temporal references using their respective interfaces. Therefore, these four items inquire ratings about the collaborator’s location in space and time reference during group and individual efforts. In practice, the questionnaire is to be filled out by each participating collaborator individually and directly after the respective task completion. The evaluation of the answers should allow for a quantitative analysis of the system’s collaborative features, and provide insights in regard to the collaboration as perceived by the collaborators themselves. Furthermore, the results should be interpreted within the context of the tested system and against its anticipated design, for instance to assess if an anticipated role distribution (equal, unequal) between the collaborators was fulfilled as intended, to name just one example. A two-page print version of the questionnaire, as it was presented to participants in our user interaction study, can be found in the article’s Supplementary Material.
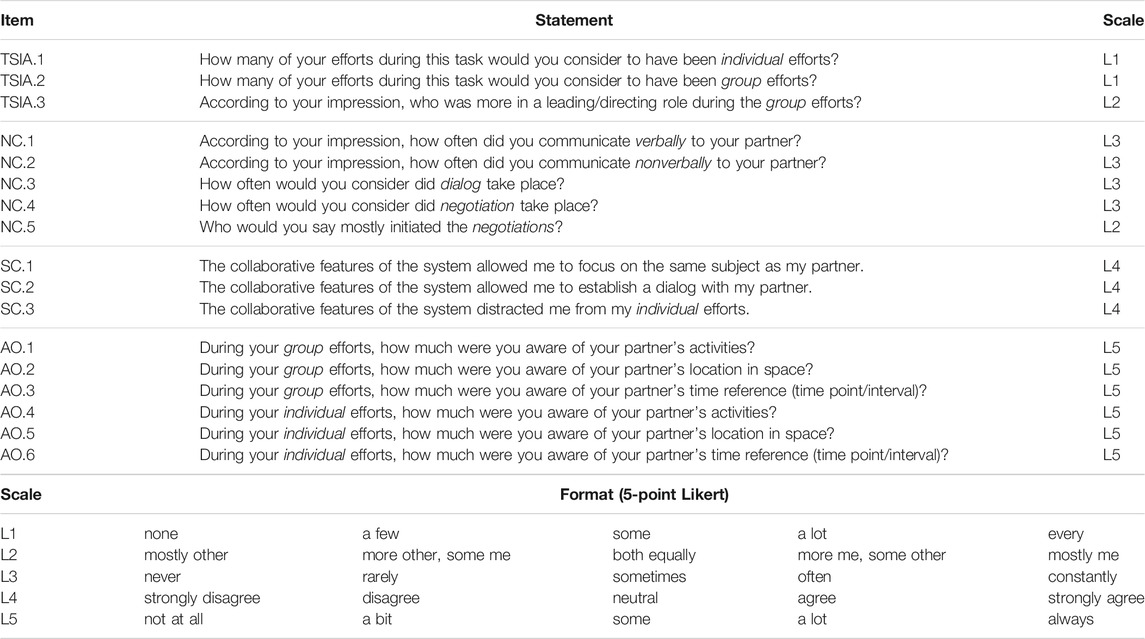
TABLE 1. Overview of the items and Likert scales used in the designed Spatio-Temporal Collaboration Questionnaire.
4.2.4 Audio Recordings
As the participants were located in two physically separated rooms during the task sessions, there needed to be a way for them to verbally communicate (besides the nonverbal communication features of our system, i.e., the spatio-temporal referencing). The Zoom Cloud Meetings14 teleconferencing software was installed on both the machine that the non-immersed participant was using, as well as on the machine that run the immersive application. This enabled the participants to talk to each other via an audio call, which was recorded. Zoom conveniently allows the recording of separate audio streams for each call participant; therefore, at the end of each task session, three audio files (one of the combined audio, and one from each user) were obtained. Using the Audacity15 audio editor software and its Sound Finder tool, it is possible to obtain timestamps that describe when sound was detected16 in each participant’s audio file, and therefore roughly when they were (individually) speaking. Summing up the time intervals provides an estimation of each participant’s “speaking” amount, and it was also possible to calculate when and how much participants were “overlapping” (talking at the same time). These timestamps were further synchronized with the system log timestamps, by knowing when the audio recording of each session started (and ended). This can allow the correspondence of verbal communication activity and system events (including nonverbal communication cues).
5 Results
5.1 Participants
We recruited five pairs, resulting in a total of n = 10 participants. The two participants of each pair knew each other prior to the study.17 The study was conducted in the English language which all participants, although not native English speakers, were fluent in. Two pairs reported a background in Information Visualization and Visual Analytics. One pair reported a Computer Science background, and another one in Applied Linguistics. The participants of the remaining pair stated a background in Linguistics, and Psychology respectively. Only one participant with a background in Computer Science considered having a lot of previous experiences with VR interfaces, while all others reported a few. None of the participants had any visual perception issues with the applied color coding throughout both interfaces.18
5.2 Task Completion
All pairs were able to complete the two tasks (fruits and veggies scenarios), by providing an estimation for each of the ten correlations in each task scenario (five for sunlight vs plants, and five for humidity vs plants). The answers are presented in Table 2. Overall, they were on average 84% correct and 10% incorrect by estimating that there was no correlation at all (but not being wrong by estimating the opposite correlation, which only happened for 6%). Two chi-squared tests were performed to determine whether there was a difference between the answer frequencies (correct or wrong/no correlation combined) and either the task scenarios (fruits or veggies) or the climate variable (sunlight or humidity). In both cases there was none: X2 (1, N = 100) = 1.86, p = 0.17 and X2 (1, N = 100) = 0, p = 1, respectively. The confidence for any wrong or no correlation answers was medium or low, and only the participants of the pair p4 stated a high confidence (for their two mistakes).
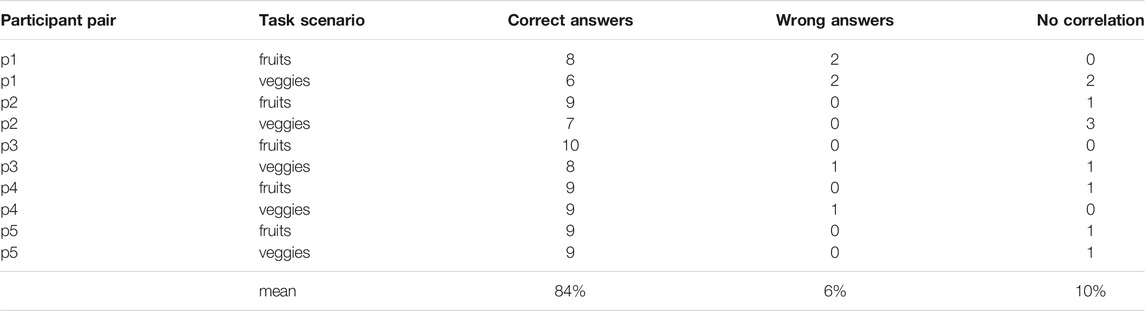
TABLE 2. Participants’ answers to the two task scenarios. Out of ten required answers for each scenario, the number of correct answers (according to the model used in the task), the number of wrong answers (positive when negative correlation was the correct answer, and vise versa), and the number of times the participants estimated that there was no correlation (there was always a correlation according to the model).
5.3 Usability and User Engagement
The System Usability Scale (SUS) scores of the two interfaces (immersive VR environment and non-immersive desktop terminal) are presented in Figure 6, left. The User Engagement Scale - Short Form (UES-SF) scores are presented in Figure 6, right. In both evaluations the scores are very positive, ranging between “good” and even “best imaginable” for SUS, and having median values at or above four (out of five) for all factors of the UES-SF.
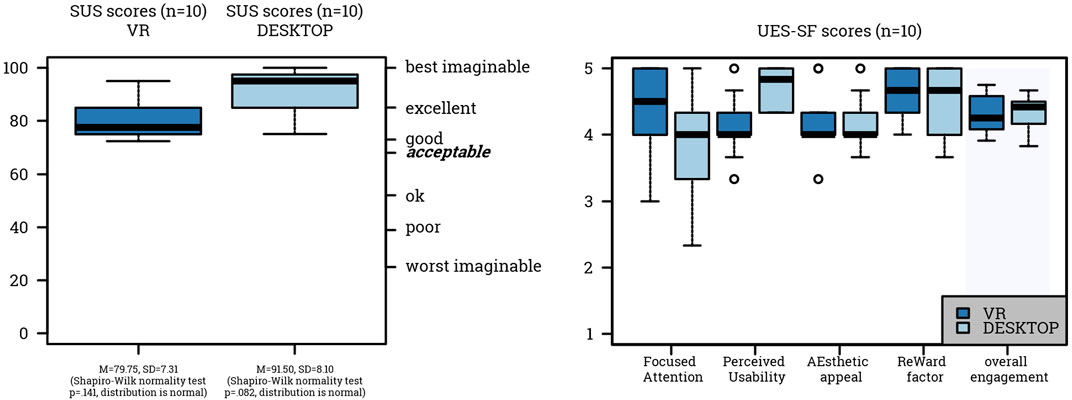
FIGURE 6. System Usability Scale (SUS) scores (left) and The User Engagement Scale - Short Form (UES-SF) scores (right), provided by the participants after they used the immersive VR (darker blue color) and the non-immersive desktop (lighter blue color) interfaces. The right axis adjective ratings for the SUS scores are based on Bangor et al. (2009), Figure 4.
There were three instances where the scores for the two interfaces noticeably differed: 1) Focused Attention (UES-SF), 2) SUS, and 3) Perceived Usability (UES-SF). First, the immersive interface’s Focused Attention (UES-SF) was rated higher than the non-immersive one, which is encouraging given the IA context of this work. However, a Wilcoxon signed rank test with continuity correction was conducted to compare the Focused Attention (UES-SF) score medians for the immersive and non-immersive interfaces; V = 27, p = 0.23, there was no significant difference of medians. Second, the non-immersive interface’s usability score (SUS) was rated higher than the immersive one. A paired t-test was conducted to compare the SUS score means for immersive (M = 79.75, SD = 7.31) and non-immersive (M = 91.5, SD = 8.1) interfaces; t (9) = −3.38, p = 0.008, the means were significantly different. Upon closer examination of the received answers for the individual SUS items, it appears that the difference was due to an item on whether support from a technical person would be required to use the system. Requiring technical assistance was not an issue during any of the sessions. However all but one of the participants declared minimal previous experience with VR and this can be an expression of lack of confidence from their part. Third, the non-immersive interface’s Perceived Usability (UES-SF) was rated higher than the immersive one. A Wilcoxon signed rank test with continuity correction was conducted to compare the Perceived Usability (UES-SF) score medians for the immersive and non-immersive interfaces; V = 5.5, p = 0.027, there was no significant difference of medians. Upon closer examination of the received answers for the individual Perceived Usability (UES-SF) items, it appears that this was mostly due to an item about frustration, which seems understandable given the relatively higher complexity of the immersive interface.
5.4 Collaboration Performance
5.4.1 Spatio-Temporal Collaboration Questionnaire
The answers to the Spatio-Temporal Collaboration Questionnaire (see Section 4.2.3) from the perspectives of the immersed and non-immersed users are provided in Figure 7. The discussion of the results is based primarily on the median values and, where significant, on the interquartile range.
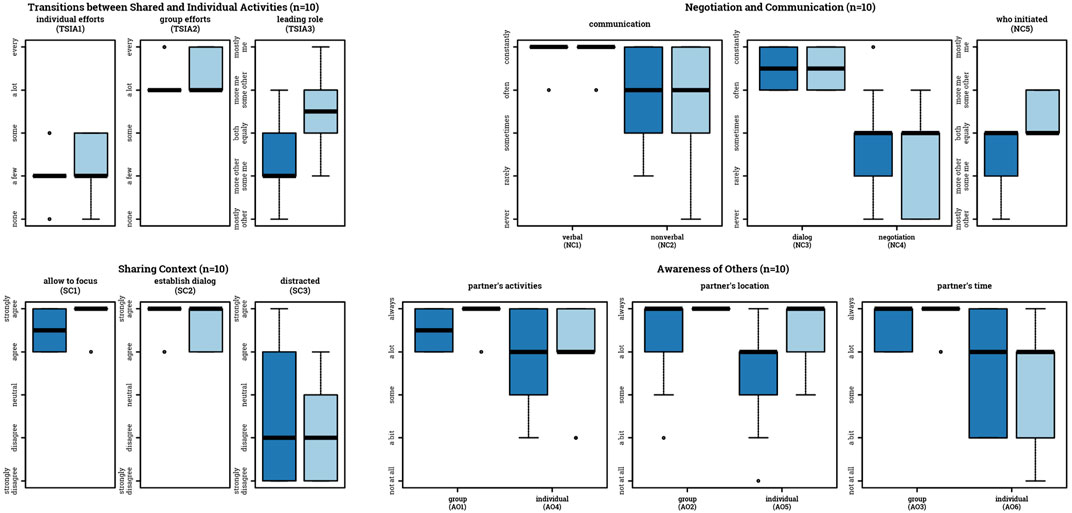
FIGURE 7. Answers for the Spatio-Temporal Collaboration Questionnaire, provided by the participants after they used the immersive VR (darker blue color) and the non-immersive desktop (lighter blue color) interfaces. Items grouped around Transitions between Shared and Individual Activities (top left), Negotiation and Communication (top right), Sharing Context (bottom left), and Awareness of Others (bottom right) dimensions. See Table 1 for the full item statements.
The participants reported that there were a few individual efforts (TSIA.1), and a lot of group efforts (TSIA.2); the non-immersed users also had the impression that they took a more leading role than the immersed users (TSIA.3).
The participants reported constant verbal communication (NC.1), and often nonverbal communication (NC.2). The participants reported that were almost constantly in dialog (NC.3) and that they sometimes negotiated (NC.4). Similarly to the responses as to who took more often the leading role (TSIA.3), the non-immersed users considered that they initiated these negotiations more often than the immersed users; however this was done equally on median (NC.5). Noteworthy for the context of the NC items, all paired medians were the same. Wilcoxon signed rank tests were conducted to determine whether the median values were the same for the immersive and non-immersive interface users, for all NC items; in all cases there was no significant difference (p = 1 for NC1, NC2 and NC3; p = 0.42 for NC4 and p = 0.018 for NC5).
The participants strongly agreed that the system allowed them to focus on the same subject as their partner (SC.1), and also to establish dialog (SC.2). While the participants disagreed that the collaborative features of the system distracted them from their individual efforts, the interquartile range for the immersed users was wider (SC.3).
The participants were always aware of their partner’s activities during group efforts and a lot during individual efforts (AO.1 and AO.4). The awareness of others during individual efforts was a little lower than during group efforts, as expected. The participants were always aware of their partners’ location during both group and individual efforts, except for the immersed users during individual efforts (AO.2 and AO.5). Finally, the participants were always aware of their partner’s time reference during group efforts (AO3), and a lot during individual efforts with quite wide interquartile range for both users (AO.6).
5.4.2 Joint Data Exploration
Table 3 presents the session duration for each task scenario in minutes (M = 28, SD = 9), the number of unique places the participants visited (both, together, and independently), how long they were at the same place at the same time (M = 87%, SD = 7%), how long the speaking time was for the immersive (M = 29%, SD = 14%) and the non-immersive interface users (M = 39%, SD = 13%), as well as how long their speaking overlapped each other (M = 2%, SD = 0.2%).
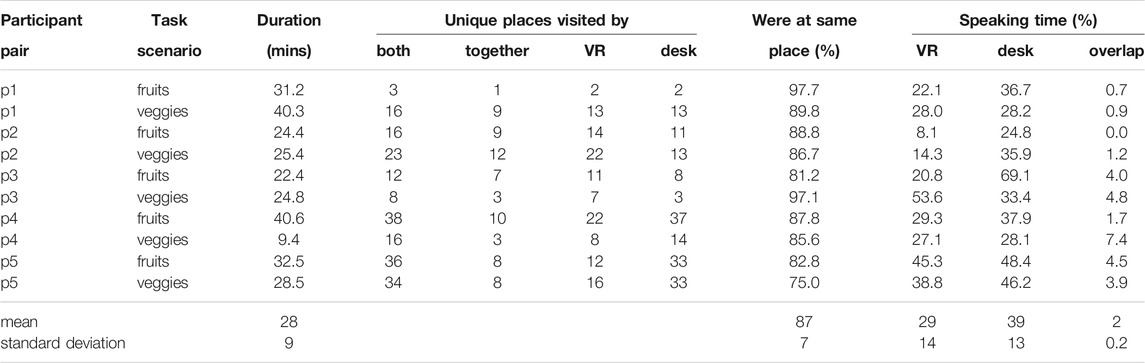
TABLE 3. Session duration, unique places visited by the participants (both, together, and independently), how long the participants shared the same context (being at same location in both interfaces), and how long they spoke. Percentage values normalized according to session duration. Data obtained by processing the system logs (see Section 4.2.1) and the participants’ individual audio recordings (see Section 4.2.4).
One noticeable outlier regarding session duration was the second session by the fourth pair. However the short duration had no impact on the task performance (see Table 2) and was not due to the participants being in a hurry to complete their session. Overall, there was no significant difference of session duration means comparing the fruits (M = 30, SD = 7) and veggies (M = 26, SD = 11) scenarios; paired t-test, t (4) = 0.65, p = 0.55. A paired t-test was conducted to compare the normalized amounts that the participants were at the same place for the fruits (M = 88%, SD = 7%) and veggies (M = 87%, SD = 8%) scenarios; t (4) = 0.18, p = 0.86, indicating that the means were not significantly different. A paired t-test was conducted to compare the immersed and non-immersed users speaking time means; t (9) = −1.80, p = 0.11, indicating that the means were not significantly different. However, every participant that changed role from using the non-immersive to the immersive interface spoke less, and every participant that changed role from using the immersive to the non-immersive interface spoke more or about the same.
Additionally, we visualized the participants’ verbal communication activity based on the recorded audio (see Section 4.2.4), as well as plotted their spatial data exploration over time as 3D pathway visualizations19 based on the collected system logs (see Section 4.2.1). Both visualizations for every task session can be found in the article’s Supplementary Material.
5.4.3 Observations
5.4.3.1 Data Exploration and Task Solving Strategy:
Throughout all ten task sessions, the collaborators appeared to be very engaged and motivated to solve the given task as best as possible by identifying the appropriate correlations. They would come up with a hypothesis for a plant-climate correlation based on their joint observations in one location, and then move on to confirm this by investigating the same data variables in one or several other locations before confirming or rejecting their initial hypothesis. This behaviour was observed in nine of the ten sessions. Only one pair (p1, fruits scenario) deducted all correlations based on their observations from a single location. Furthermore, most sessions followed a rather systematic approach, guided through the answer sheet the non-immersive interface user was in charge of, seemingly providing somewhat of a starting point for their investigation. However, as the collaborators were focusing on one plant-climate correlation, they were also often able to make interesting observations relevant for others along the way, effectively diverting from the structure of the answer sheet and collecting their insights rather organically as their investigation proceeded. Particularly towards the end of their task session, they would together refer back to the answer sheet to identify which plant-climate correlations remained unexplored. The participants in none of the sessions appeared hectic, stressed, or otherwise pressured for time. Three of the five pairs approached the task completion noticeably objective-oriented, considering what would be the best or most effective way to solve the task using the provided interfaces. The other two pairs appeared to be more freely and openly exploring the data and making observations. At times, the choice of what location to explore next seemed to be influenced by the collaborators’ prior knowledge or relation to a specific country, providing another point of reference for their ongoing investigation.
5.4.3.2 Collaboration
In six sessions, the collaborators appeared to be equally guiding and directing the task completion, going back and forth based on their respective observations. The non-immersive interface user seemed to be in a somewhat more leading role during the remaining four sessions, providing more directions in regard to what to explore next. Generally, throughout all the sessions the collaborators were able to communicate in a seemingly organic manner with each other, using various deictic and reference-related terms (Heer and Agrawala, 2008) to support their contextual information exchange. The implemented synchronous collaborative features in both interfaces appeared to further facilitate their natural interaction, resulting in comments such as “You see, the point [ in time ] you selected is actually interesting for me too, because (…).” In at least four sessions, the collaborators were observed laughing at various occasions, appearing to overall enjoy themselves during their joint data exploration. At times, the collaborators also made inquires to one another, requesting observations about the data explored by their partner. Among others, such inquires included:
• “Could you please highlight
• “Can you do one more [ highlight ]?”
• “How does the
• “How does the period I marked now look like [ for you ]?”
• “Let’s try something different: Can you see where a peak for
• “Can you check
• “Can you describe the trend for the entire time?”
• “Can you suggest one more location [ from looking around ]?”
• “It’s so great that you can tell me where
5.4.3.3 System Features Interaction
The majority of interactions of all participants in the immersive VR environment, wearing the HMD and utilizing the 3D gestural input, appeared natural and fluent. One minor usability issue with the implemented 3D gestural input was discovered, potentially resulting in an unintended target-based travel movement: Depending on how the user would attempt to touch the Activation Toggle, sometimes they would have their hand in an index-finger pointing forward posture, triggering a travel movement accordingly (see Figure 3A). Nevertheless, in the rare cases that this occurred, the immersive interface user was able to quickly recover from this, traveling back to their desired location in order to continue the investigation, while letting their partner know that they “accidentally traveled someplace else”. In line with the prior described inquires, often the non-immersed user created temporal references in their interfaces, upon which the immersed interface user was able to describe their data at that point in time, or time range respectively. In seven sessions, the immersed interface user performed various times what can be best described as “live annotation”, i.e., they would grab the Time Slice, move it slowly in time, and describe how the time-series of a plant variable is evolving as the position of the Time Slice updates (see Figure 3B). These live annotations would result in descriptions such as for example “It is fairly low here, now it rises, more, and more, now it is at its peak, and now it goes down again.” Similarly, at times they would also grab the Time Slice or make a time range selection and move it quickly back and forth to signal a specific period to their partner (see Figures 3B, 5B, respectively Figures 3C, 5C), while commenting on observations along the way. Furthermore, the immersive interface users were also able to detect patterns in the data, allowing them to make deductions accordingly. For instance, one VR user expressed “If we find out what happens with
5.4.3.4 Reference and Deixis Terminology
Even though numerical value information of the different data variables was available in both interfaces, the collaborators largely appeared to ignore these throughout the majority of the task sessions. Instead, they used various descriptors in order to explain to each other their observations of the time-series data as presented in their respective interfaces. A selection of such descriptors, as noticed by the observer, include (in alphabetical order): bump/bumpy, curvy, down, high, inverse/opposite, low, (local) minimum, (local) maximum, mountain, peak, period, slope, spikes, top, uniform, up, valley. Furthermore, general deictic terms for both spatial and temporal references included: here, from here to there, this [point in time/location], these [time range], earlier, later.
5.5 Limitations
CIA is concerned with the utilization of immersive display and interaction technologies for data analysis purposes that accommodate multiple users (Billinghurst et al., 2018). The empirical evaluation of such systems is inherently challenging and demanding in general (Billinghurst et al., 2018; Skarbez et al., 2019; Ens et al., 2021), also as collaborative systems often require design considerations for both individual and group aspects (Gutwin and Greenberg, 1998). Within the scope and nature of our empirical evaluation and based on the amount of participants, the analysis of the collected data allows to identify and indicate interesting trends and noteworthy considerations rather than the statement of definitive conclusions. Naturally, the collection of data through the conduction of further studies in the future could provide additional meaningful insights. Furthermore, the presented data should be interpreted within the presented task scenario, i.e., a collaborative confirmative analysis task with no time limitations.
6 Discussion
6.1 System Design Reflections
6.1.1 Usability
All reported usability scores (SUS) for both interfaces are above the good margin, indicating that the users were generally able to operate the interfaces for their intended purpose. Given the overall purposefully minimalistic but representative designed interactive InfoVis, the comparatively high usability scores (median above excellent) for the non-immersive desktop terminal are not that surprising, as it relied on rather established visualization approaches, i.e., line graphs and bird’s-eye view map (Lundblad et al., 2010; Ward et al., 2015). The comparatively novel approach as implemented in the immersive VR environment, and considering that all but one participant reported only minor experiences with VR in general before, we are particularly encouraged by the received positive usability feedback. All participants were able to quickly pick up and learn the various aspects of the immersive interface during their 5 minutes warm-up time, i.e., understand the concept of the 3D Radar Charts and the collaborative information cues, become comfortable with wearing the HMD, and utilize the 3D gestural input to interact in the VR environment. This is in line with the general anticipation of utilizing immersive technologies for their natural interaction techniques (Büschel et al., 2018; Skarbez et al., 2019). After all, enabling users to simply pick up the technology and start using it for data analysis purposes in an intuitive manner without extensive training allows them to focus at the subject matter at hand. The self-reported usability scores coincide also with the observations, confirming the VR user’s ability to operate the immersive interface in a natural and fluent manner. In fact, the majority of the participants made reflections at the very end of the study, i.e., after the completion of their second task, positively highlighting the “smoothness” of the VR experience and that they overall could have easily spent even more time with their joint data analysis activity. Considering these comments in regard to the measured session duration (M = 28, SD = 9) and within the presented data analysis scenario and task, we believe this to be a step towards the direction of moving beyond comparatively brief “just a few minutes” VR experiences. This is also important keeping in mind the complexity inherent from CSCW, i.e., interpretation of data, information exchange, as well as discussion and negotiation take time (Andriessen, 2001; Heer and Agrawala, 2008). Following this line of thought and with respect to such multi-user interplay, one can potentially anticipate comparatively longer exposure times in VR within CIA scenarios compared to single user experiences. Among others, we believe the above good usability scores for both interfaces are important within the scope of our investigation for two reasons in particular. First, it validates that the interfaces could be operated as intended (see Section 3.2 and Section 3.3) and without any major usability flaws. Consequently for our study, we can assume that it is rather likely that a “difficult to operate interface” would have had a potentially negative impact on the pairs’ overall collaboration. And second, it also indirectly validates the usability of the designed and integrated synchronous collaborative features as part of each respective interface. The visual information cues (see Section 3.4) were easy to recognize and provided important contextual references about their partner’s activity, as also emphasized by Cruz et al. (2015). Additionally, these spatio-temporal references were integrated in a rather seamless manner, allowing for the automatic transmission of information as the users naturally interacted with their interfaces. As opposed to introducing additional dedicated actions in regard to what information to share and when, such as used by Welsford-Ackroyd et al. (2020), Reski et al. (2020b), and Peter et al. (2018), and based on our observations, this seemed to have allowed the collaborators to naturally interact with each other, seamlessly picking up and referring to their partner’s context without noticeable action delays, i.e., without the need to wait for a specific collaborative signal.
6.1.2 User Engagement
The median user engagement scores (UES-SF) for both interfaces are at or above 4, indicating overall high user engagement with the provided collaborative system during the data analysis task. This corroborates the observer’s impressions of the collaborators being motivated and eager to use their interfaces to explore the data and to find the correct answers, noticeably enjoying themselves and their collaboration during their confirmative analysis task. These results align well with the often stated argument that immersive technologies have the potential to provide “engaging” experiences that encourage data interaction and interpretation (Hackathorn and Margolis, 2016; Dwyer et al., 2018; Ens et al., 2021).
Furthermore, the results allow for a discussion in regard to the individual user engagement factors. The immersive interface users reported a higher Focused Attention compared to the users who operated the non-immersive desktop terminal. We can argue for a couple of potential reasons for this. Primarily, the characteristics of the applied display and interaction technologies have to be taken into account. Perceiving a virtual environment through an HMD and allowing for natural hand interaction, i.e., a comparatively high level of immersion, may have required the VR user to be generally somewhat more attentive, as there are many visual stimuli to process – both in regard to the data visualization in the immersive VR environment itself as well as due to the integrated visual information cues triggered through the non-immersed collaborator. Additionally, it also needs to be considered that while the non-immersed user explored two data variables (climate data) per location, the immersive interface was presented with five data variables (plant data) per location (see Section 3.1 and Section 4.1.2). Nevertheless, the general high Focused Attention across both interfaces can be attributed to the overall close collaboration between the users, e.g., the pairs investigating the same respective locations for the majority of the task duration (see were at same place column in Table 3), collaboratively making observations. In regard to the slightly lower Focused Attention score reported by the non-immersive interface users, another aspect comes to mind: The note-taking and completion of the pen-and-paper answer sheet (see Section 4.1.2 and Supplementary Material). During the task, they were in charge of keeping track and filling out the provided plant-climate answer matrix, which arguably may have effected their attention to the interface as they were required to temporary switch their focus to the paper answer sheet.
The reported Perceived Usability scores for the two interfaces were in line with the reported SUS scores, as discussed in the prior section.
Aspects in regard to the Aesthetic Appeal were rated similarly positive across both interfaces as well. At this stage of the collaborative system, we focused in both the immersive and the non-immersive interface on the essential parts that allow the users to explore and analyse data, trying to avoid unnecessary information or distracting elements in general. We are satisfied with the received Aesthetic Appeal scores, overall indicating that participants enjoyed the chosen graphical elements and visual design for each of the interfaces accordingly.
The positive Reward scores, reported with medians above 4.5 for both interfaces, are particularly interesting and encouraging to us. On the one hand, the collaborators were observed being particularly motivated to solve the given task correctly, often verifying their observations of the time-series data across multiple different locations to ensure that their answer was correct. A reoccurring expression across the different task sessions was along the lines of “I am sure we got it [ right ], but let’s just check one more [ location ]”. The investigative nature of the confirmative data analysis task, provided the pairs with a clear purpose for this activity, which is also important in regard to moving beyond initial novelty reactions (Snowdon et al., 2001). At the same time, it was completely up to them to organize their task solving approach, resulting in interesting data exploration strategies. The freedom of task approach, combined with the fact that they had to work together, using different types of display and interaction technologies, but still being able to have a notion of what their partner was up to, supported through the synchronous collaborative features integrated in the interfaces, are likely to have positively contributed to these Reward scores. The participants appeared genuinely excited that “it [ the collaborative system ] really worked” and “we [ the collaborators ] are able to see each other”, thus successfully enabling them to be mutually aware of each other (Benford and Fahlén, 1993; Benford et al., 1994; Heer and Agrawala, 2008). The positive Reward scores for both interfaces within the presented collaborative context arguably also indicate a comparatively equal user contribution: Of course each interface served their own purpose, but they were engaging for both collaborators alike, motivating them to partake in the data analysis activity – as anticipated (see Section 2.3). We believe it is also important to consider and discuss two more factors within the context of the positive Reward scores: The overall high rated usability, and the absence of an explicit time limitation. The users ability to use the interfaces as intended in a scenario where they were not pressured for time, informally confirmed by some of the participants’ expressions that they could have spent even more time with the developed system, likely also contributed beneficently to the Reward scores.
6.1.3 Closing Remarks
To summarize, both the immersive and non-immersive interface were assessed positively in regard to usability and user engagement. We believe it is important to highlight again that the reported scores are not meant to be compared in a “X is better than Y” manner, nor can they (due to the asymmetric role setup), as the interfaces serve different purposes. Instead, with the primary objective to investigate collaborative aspects when combining immersive and non-immersive interfaces into the same data analysis workflow, as motivated in Section 2.3, we believe it is crucial to have an understanding and assessment of the applied tools that are likely to impact the collaboration. After all, the empirical evaluation of collaborative immersive systems is complex (Billinghurst et al., 2018; Skarbez et al., 2019; Ens et al., 2021). Having received a similar assessment by the participants, we can assume that the two interfaces are appropriately balanced in regard to their purpose and operability within the scope of the presented context (see Section 3) as well as with respect to anticipated hybrid data analysis workflows (Isenberg, 2014; Cavallo et al., 2019; Wang et al., 2019). We argue that this serves as a good foundation for the assessment of various collaborative aspects, particularly when using heterogeneous device types and an asymmetric user role setup.
6.2 Collaboration Reflections
6.2.1 System Logs, Audio Analysis, Observations, and Task Completion
The analysis of the system logs as presented in Table 3 reveals that the collaborators spent the majority of their time investigating the time-series data at the respective same spatial location (min 75.0%, max 97.7%). This also becomes apparent when examining the audio analysis and pathway visualizations (see Supplementary Material). Consequently, we can infer that the collaborators found themselves in a state of rather close collaboration for the majority of the session duration, i.e., directly interacting with each other in the same data context, making efforts as a group to solve the task. They communicated about their observations and findings both verbally, i.e., by talking to each other to explain, discuss, and negotiate, and nonverbally, i.e., by making spatio-temporal references to point and highlight data for their peer (see Section 3.4). Collaboration relies inherently on complex personal and social processes (Heer and Agrawala, 2008; Billinghurst et al., 2018), therefore every human user has slightly different ways and approaches of interacting with one another. We believe this is well reflected in the results of the audio analysis in regard to the “speaking” time during the task sessions (see Table 3). For instance, some pairs (e.g., pair p2, fruits scenario, 24.4 min: 8.1 and 24.8%) communicated verbally less compared to others with much higher speaking time rates (e.g., pair p3, fruits scenario, 22.4 min: 20.8 and 69.1%). However, examining their verbal activity over time (see Supplementary Material), we can identify a steady activity in the majority of cases that also align with the positive user engagement results. Nevertheless, there were also some instances when the collaborators made some more individual efforts. These usually occurred when a pair set out to find a new spatial location to explore, either in regard to yet completely unexplored plant-climate correlations, or in order to verify and confirm previously made deductions. Most of the time, both users began to explore the data using their interfaces independently in order to find a place that contained “interesting” data, or in the words of the participants, time-series data visualizations that are “curvy or bumpy” and feature “peaks, spikes, slopes, or valleys”. An interesting case is pair p4 within the veggies scenario, whose verbal activity was much lower during these phases compared to the ones when they explore the same spatial location. However, during similar spatial exploration phases by other pairs, their overall verbal activity did not seem to change that much compared to the remainder of their joint data exploration, indicating that they generally kept talking to each other independent of whether they were making individual or group efforts.
In general, all pairs were able to collaboratively complete the tasks of identifying the various data correlations (ten in total per task scenario) in a satisfactory manner (see Section 5.2). Given the hybrid asymmetric setup (heterogeneous device types and different user roles), we did not anticipate any knowledge carry over from the fruit to the veggies scenario in regard to the respective interface’s operation. A carry over of data insights was also not possible as both task scenarios featured different datasets. There is the possibility for the pair’s task solving approach in the veggies task to be somewhat influenced and informed by their strategy in the prior fruit task. However, we have confirmed that there was no significant impact on their task performance (see Section 5.2). Given these circumstances as well as the prior described influences of the personal and social processes on collaboration (Heer and Agrawala, 2008; Billinghurst et al., 2018), we believe it is unlikely that there was a noticeable knowledge carry over between the two task scenarios.
With all the above in mind, throughout the following sections we can have a closer look at the collaborators’ self-reported assessments as collected using the Spatio-Temporal Collaboration Questionnaire (see Figure 7).
6.2.2 Transitions between Shared and Individual Activities
The pairs’ reporting in regard to the occurrence of individual and group efforts is in line with the observations and system log analysis. They considered having made a lot of (shared) group efforts, while only a few individual efforts during the task solving activity. Furthermore, the pairs had the impression that the non-immersed user was in a somewhat more leading or directing role compared to the immersed one. While the immersive interface users reported a median of more other, some me, the median for the non-immersive interface users lies between both equally and more me, some other. Based on our observations, it is likely that the task answer sheet responsibility has given the non-immersed user a little bit the edge towards being the task director. Even though the non-immersed user assumed such a “leading” role at times, we do not consider this to be the same as the dedicated guiding roles such as discussed by Welsford-Ackroyd et al. (2020) or Peter et al. (2018), but instead an overall rather balanced interplay between the collaborators for their own purposes that is conceptually similar to the scenarios as described by Lee et al. (2020), Sugiura et al. (2018), and Gugenheimer et al. (2017).
6.2.3 Negotiation and Communication
In regard to the pairs’ verbal communication frequency, both interface users reported that they talked pretty much constantly, which agrees with visual impressions from the audio activity analysis (see Supplementary Material). The pairs stated that they often utilized the nonverbal communication features, i.e., the provided collaborative synchronous features (see Section 3.4). Furthermore, the pairs considered dialog taking place for the majority of their verbal communication. Negotiation was reported taking place only sometimes if at all, rather similarly initiated from both interface users. All the above is interesting for a couple of reasons. First, the medians from both interface users across these five items are equal, overall indicating that the collaborators had a rather similar impression about their negotiation and communication independent of the interface type. Second, considering the higher share of dialog compared to the lower amount of negotiations, it seems that the collaborators were rather successful in their verbal and nonverbal communication, being overall able to follow their joint data descriptions and interpretations, without much need for additional negotiation. And third, the reported amounts of verbal and nonverbal communication, most of the time categorized as dialog, further indicate a close collaboration between the two interface users. It was also interesting to observe pairs establishing their individual reference terminologies (as presented in Section 5.4.3), including common and reoccurring expressions as well as more unique ones.
6.2.4 Sharing Context
The results indicate that the implemented collaborative features allowed the users to focus on the same subject as their peer and to establish a dialog accordingly, which is a foundational aspect for successful CSCW (Snowdon et al., 2001; Heer and Agrawala, 2008; Cruz et al., 2015). Overall, the collaborators disagreed that these features distracted them from their individual efforts, however with a slightly bigger range of provided impressions. Generally, all the results in this category are favourable within the context of the presented setup and task. The ability to focus on the same subject matter and to establish dialog are crucial for any kind of collaboration (Dix, 1994). With both interface users confirming that they were able to do so, the overall design of the synchronous collaborative features across both the immersive and non-immersive interface can be considered validated within the presented context, of course assuming that a verbal communication channel is available (see Figure 1). These results are also relevant within the context of physically distributed collaboration environments (Skarbez et al., 2019), as it enables analysts to work together remotely, independent of their distance to each other. Furthermore, while the collaborators did not assess the implemented collaboration features as distractions during their individual efforts, it is important to consider the amount of reported individual effort that took place, i.e., only a few. On the one hand, the collaborators assessment is a promising trend in regard to the provided features design, allowing them to focus ad-hoc on their peer’s context without interfering with their own individual efforts. On the other, some further investigations using tasks that involve more individual efforts throughout the collaborative task are necessary to confirm or reject this trend. Finally, it was also interesting to observe that some pairs came up independently from each other with similar ways of utilizing the implemented collaborative features, such as the “live annotation” behaviour (see Section 5.4.3).
6.2.5 Awareness of Others
Both interface users reported high awareness about their respective partner’s activity in general, their location in space, and their time reference. These assessments allow again some reflections and discussion on the implemented system features that aimed to facilitate their awareness of one another. First, the assessments for joint awareness was reported slightly higher during group efforts, which is desired as this is arguably the situation when it is more important to know about the collaborator’s activity. Nevertheless, the awareness was still rated fairly high even during the few individual efforts, and seemingly in a non-distracting manner as discussed before. Second, the awareness of the immersed user was slightly higher perceived through the non-immersed user, with everyone agreeing that they were always aware of the activities of the user in the immersive VR environment. Reflecting on the characteristics of the implemented visual information cues across both interfaces (see Section 3.4), one aspect becomes apparent in regard to seemingly different update frequencies. For instance, the location and time reference updates from the immersive interface appear much more “continuous” in the non-immersive interface, e.g., the position and orientation of the immersed user are constantly updating, and even new time event and time range selections appear much more in motion and fluent due to the nature of the involved technologies. This arguably provides smooth visual transitions from one state to another, naturally updating the non-immersive interface accordingly. The other way around, collaborative information cues from the non-immersed user update more “discrete” and “event”-like in the immersive VR environment, i.e., new selections appear when they are done, providing comparatively fewer visual transition cues. We believe that this may be a good starting point for further investigation into this matter. Overall, based on the implemented collaborative information cues across both interfaces, it appears that each user was able to follow and have an understanding of their partner’s current investigation, closely coupled with the results of the Sharing Context category. Considering the general importance of mutual awareness for the design of collaborative systems (Benford et al., 1994; Snowdon et al., 2001; Cruz et al., 2015), not least as important foundation to establish communication that results in the subsequent interpretation and discussion of the data (Andriessen, 2001), the received awareness assessments can be interpreted positively. We can argue that the designed visual approaches for supporting spatio-temporal references worked well and as intended in both the immersive and non-immersive interface, allowing the pairs to point and highlight data to their peer accordingly. Our results also align well with the insights reported by Nguyen and Duval (2014), stating that rather simple awareness cues can often be sufficient to provide the collaborator with an understanding of the shared workspace.
6.2.6 Closing Remarks
Throughout all task sessions, the collaborators were able to work closely as a group for the majority of their joint session duration in order solve the given confirmative data analysis task in a satisfying manner (see Table 2). Considering that they had to provide ten answers (including ten accompanying confidence indications), they were overall quite busy during an average half hour for data exploration, observing, interpreting, and discussing their findings. They communicated a lot by having complementing dialog that was further facilitated through the various spatio-temporal referencing features of their interfaces. The setup allowed them to closely explore and interpret the data in space and time, making important observations and deductions along the way. One pair in particular highlighted the “detective work”-like nature of the task and their joint collaboration, reflecting on the great interplay between the two interfaces, rating the experience in a very positive manner. The participants’ overall excitement as well as the natural way of interacting with each other was a reoccurring theme through the different task sessions, likely positively contributing to their collaboration assessments. This can be further underlined through a selection of noteworthy participant comments after their task completion:
• “Oh, this was really fun and worked really well.”
• “Oh wow, did we take that long? It was so much fun.”
• “It was a lot of fun actually.”
• “This was so cool.”
• “It worked really well.”
• “I was really able to see you!”
Comments such as particularly the last one, are quite interesting given that there were no “avatar”-like representation of the users in either of the interfaces, such as for instance as utilized by Nguyen et al. (2019) or Benford et al. (1994), but just the provided visual references. It appears that the participants made the mental association between the visual references and their peers, themselves. Similar observations within the context of remote collaboration around interactive tabletop systems, also including rather abstract and minimal visual representations for the collaborator’s input, were made by Kim et al. (2010), reporting that users in their study “(…) felt as though the remote participants were in the room itself.” It would be interesting in the future to investigate effects on collaboration and empathy when there is no virtual user avatar but instead other similar more abstract means of user representation, identifying requirements and use cases where one approach is potentially preferable over the other. For instance, a CIA system presented by Nguyen et al. (2019) used a virtual avatar representation for the peer in the VR environment. How could an alternative approach without such an avatar look like, and what would the difference be in the (perceived) collaboration?
The expressed appreciation for the collaborative system and rewarding experience through the participants is much in line with the visions for such hybrid analysis environments, combining different types of technologies, as described by Wang et al. (2019) and Isenberg (2014). All in all, using different types of display and interaction technologies and facilitated through various collaborative features, we can summarize that within the scope of our experiment, all pairs were able to successfully collaborate with each other in a rather balanced shared workspace manner, as opposed to more common remote expert scenarios in similar technological setups (Ens et al., 2019).
7 Conclusion and Future Work
We set out to investigate collaborative aspects during joint data analysis that combines interfaces of heterogeneous display and interaction technologies. Within the overall context of CIA and a focus on multivariate data, our research objective was centered on the bridging between immersive and non-immersive interfaces, working towards anticipated multimodal analysis workflows that allow multiple users together to explore and interact with data. Informed by literature in regard to the current state-of-the-art CIA as well as asymmetric VR experiences, we provided considerations and relevance that further motivated our work in this direction. Based on a representative spatio-temporal data scenario, we implemented two interfaces that allow data exploration: An immersive VR environment (HMD and 3D gestural input) as well as a non-immersive desktop terminal (computer monitor, keyboard and mouse). We reported on the design and integration of synchronous collaborative features in these interfaces, allowing their users to utilize visual information cues in regard to spatio-temporal referencing accordingly. In order to evaluate the developed collaborative system in practice, we conducted an empirical evaluation where five pairs of participants successfully completed twice a confirmative data analysis task (within-subject design). To aid our evaluation, we additionally presented 1) a process to generate multivariate datasets that feature correlations along their data variables, allowing us to create a representative confirmative data analysis task, and 2) the design of a self-constructed questionnaire to assess aspects of spatio-temporal collaboration in virtual environments. Based on the results of different measures, including system logs, audio recordings of the collaborators’ verbal communication, observations, as well as questionnaire responses in regard to usability, user engagement, and spatio-temporal collaboration, we were able to validate the design of the presented system and approach in general. The immersive and non-immersive interfaces and their respective collaborative features received good usability scores, and all pairs reported overall high user engagement, emphasizing the rewarding data analysis experience. The results of the Spatio-Temporal Collaboration Questionnaire, interpreted within the described context and scenario, also point towards a general validation of the implemented referencing approaches, allowing the collaborators to work closely together. They were aware of their peer’s activities independent of the interface type, could establish a shared understanding through frequent verbal and nonverbal communication while working as a group for the majority of their task session. Generally, all pairs were excited and enthusiastic to work together in a balanced and equal manner using different display and interaction technologies within the scope of the presented data exploration and analysis scenario.
The results of the empirical evaluation of the collaborative system, e.g., in regard to the reported rewarding experience through the collaborators, are highly encouraging, motivating the development of further systems and interfaces that incorporate and combine different modalities in the future. For instance, we envision that collaborative information cues, such as presented in the non-immersive interface, to be integrated more closely into existing InfoVis and VA solutions in the future, e.g., those similar to the descriptions by Ward et al. (2015, Chapters 6 and 7) and Lundblad et al. (2010). Technologies supporting such integration (Internet connectivity and speed, modern web technologies and application programming interfaces) are available. The analysis of spatio-temporal data is a common and timely topic (Fonnet and Prié, 2021), and further real world case studies and evaluations using a combination of immersive and non-immersive technologies lend themselves naturally to gain new empirical data, aiming to further advance the emerging field of CIA. For instance, we are currently exploring new applied real world scenarios for collaboration approaches as presented in this article, among others within contexts such as climate change, smarter systems, and digital humanities. In the setup of our task, we provided the non-immersed user with a pen-and-paper answer sheet, which we discussed might have influenced some minor aspects of their collaborative experience. It would be intriguing to extend the presented system through features that allow data annotation directly in their respective interfaces – a topic that is largely underexplored (Ens et al., 2019; Fonnet and Prié, 2021). Such features could not just be interesting for their synchronous collaboration, but also in regard to asynchronous ones. Reflecting on the design of the Spatio-Temporal Collaboration Questionnaire, it allowed us to receive self-assessed feedback from the participants in a structured manner that was also in line with other applied data collection methods. Consequently, we intend to reuse the questionnaire in the future for similar investigations, either as is or adapting some item descriptions in consideration to new research objectives. While we designed the methodology of our empirical evaluation around a variety of different methods and metrics, it would be certainly intriguing to also investigate other relevant aspects in future evaluations that feature such a heterogeneous device type and asymmetric user role setup, e.g., among others, workload (Reid and Nygren, 1988; Hart, 2006), interaction flow (Rheinberg et al., 2003), situation awareness (Endsley, 1988), and the many facets of user experience (Schrepp et al., 2017). Also, dependent on scenario and data context, it would be interesting to introduce additional active collaborators to the analysis workflow, considering further design challenges due to the increased number of participants. Finally, for the scope of this article we only analysed the activity, i.e., frequency, of the pairs’ verbal communication. With the audio recordings at hand, there are potentially several interesting directions for further semantic analysis, allowing to get additional insights in collaborative aspects from a more linguistic perspective.
Data Availability Statement
All original contributions as part of the presented research are available in the article itself as well as the provided Supplementary Material and stated online repositories. Any further inquiries may be directed to the corresponding author.
Ethics Statement
We, the authors, acknowledge that any of our research addresses and follows ethical considerations for the work with human participants in general (Norwegian National Committee For Research Ethics in Science and Technology, 2016; Swedish Research Council, 2017). Ethical review and approval were not required for the study on human participants in accordance with the local legislation and institutional requirements. The participants provided their written informed consent to (1) participate in the study, and (2) allow the publication of any potentially identifiable images or data included in this article. The empirical evaluation as presented in this manuscript was conducted in May/June 2021 during the at the time ongoing global COVID-19 pandemic, which required the implementation of some additional practical precautions. We closely observed pandemic related matters on a daily basis and followed (1) the national safety rules and recommendations according to The Public Health Agency (Folkhälsomyndigheten) in Sweden, (2) the regional safety rules and recommendations for Kronobergs län according to Emergency information from Swedish authorities (Krisinformation), and (3) the local safety rules and recommendations according to Linnæus University (Linnéuniversitetet). A study session was only conducted if all involved individuals (moderator, pair of two participants) reported themselves as symptom-free. Furthermore, the moderator was wearing a face mask at all times. Face masks and hand disinfection gel was freely and voluntarily available to each participant. Physical distance between moderator and each participant was kept at all times during the study (the study required no physical contact at any time). The study procedure was organized in a way that the participants were located in different office rooms, so that at no point in time they were located in the same one, ensuring recommended physical distancing at all times. All involved technical equipment was carefully sanitized between each study task.
Author Contributions
All authors (NR, AA, and AK) devised the research scope. NR and AA designed the empirical evaluation. NR reviewed the literature, developed all technical parts of the collaborative system (immersive VR environment, non-immersive desktop terminal, synchronous collaborative features), recruited study participants, and conducted the empirical evaluation (user interaction study) as well as the data collection. AA created the multivariate correlated-timelines dataset and study task scenario. NR and AA designed the Spatio-Temporal Collaboration Questionnaire with additional comments and feedback from AK. AA and NR conducted the data analysis. NR and AA wrote the manuscript. All authors discussed and reviewed the manuscript.
Conflict of Interest
The authors declare that the research was conducted in the absence of any commercial or financial relationships that could be construed as a potential conflict of interest.
Publisher’s Note
All claims expressed in this article are solely those of the authors and do not necessarily represent those of their affiliated organizations, or those of the publisher, the editors and the reviewers. Any product that may be evaluated in this article, or claim that may be made by its manufacturer, is not guaranteed or endorsed by the publisher.
Acknowledgments
The authors wish to thank Jukka Tyrkkö for early discussions in regard to the user interaction study task, all the participants of the user interaction study, as well as the reviewers for their comments that helped to improve the manuscript. This work was partially supported through the ELLIIT environment for strategic research in Sweden.
Supplementary Material
The Supplementary Material for this article can be found online at: https://www.frontiersin.org/articles/10.3389/frvir.2021.743445/full#supplementary-material
Footnotes
1Video demonstration of the developed collaborative system (4:19 min, no audio): vimeo.com/623459537
2Our World in Data: ourworldindata.org/; Spatio-Temporal Statistics in R: spacetimewithr.org; The Swedish dataportal: www.dataportal.se/en; Swedish Meteorological and Hydrological Institute: www.smhi.se/en/; Time, Space, Spacetime in R: pebesma.staff.ifgi.de/R/Lancaster.html
339 locations × 7 data variables × 150 time events = 40,950 data values
4Each timeline was generated taking into account length (number of time events), minimum and maximum values, a regression slope, amount of noise, and a series of normal distributions that could be added at different places along the timeline. The function output was further smoothed as a spline, and vertically scaled and/or re-positioned. For more details see the GitHub repository in Footnote 7.
5Apples, Oranges, Bananas, Berries, and Grapes for the fruits scenario; Tomatoes, Carrots, Potatoes, Cabbages, and Lettuces for the veggies scenario.
6Sign and value of Pearson’s correlation coefficients agreed to the defined model, and p-values were below significance level for the majority of plant/climate pairs, allowing the model to be used as the base truth to measure the participants’ observations against.
7GitHub repository of the correlated-timelines project: github.com/arisalissandrakis/correlated-timelines
839 3D Radar Charts (1 per location) × 5 plant data variables × 150 time events = 29,250 time event data values
9GitHub repository of the Unity - 3D Radar Chart project: github.com/nicoversity/unity_3dradarchart
10GitHub repository of the Unity - PolyExtruder project: github.com/nicoversity/unity_polyextruder
11GitHub repository of the Unity - rworldmap import project: github.com/nicoversity/unity_rworldmap
12GitHub repository of the Unity - Log2CSV project: github.com/nicoversity/unity_log2csv
13GitHub repository of the Unity - Connect via WebSocket server to JavaScript client project: github.com/nicoversity/unity_wss_js
14Zoom Cloud Meetings – official homepage: zoom.us
15Audacity – official homepage: www.audacityteam.org
16Based on a decibel threshold and minimum duration of silence between sounds; the default settings of 26 dB and 1 s were used.
17Among other considerations, this type of recruitment was part of safety measures due to the ongoing COVID-19 pandemic at the time of the study.
18The color coding across both interfaces utilizes various recommendations as provided by colorbrewer2.org.
19Interactive 3D pathway visualizations for all task sessions can be viewed online: vrxar.lnu.se/apps/2021-frivr/
References
Aigner, W., Miksch, S., Schumann, H., and Tominski, C. (2011). “Visualization of Time-Oriented Data,” in Human-Computer Interaction Series (HCIS). 1st edn (London: Springer). doi:10.1007/978-0-85729-079-3
Andriessen, J. H. E. (2001). “Group Processes,” in Working with Groupware: Understanding and Evaluating Collaboration Technology, Computer Supported Cooperative Work (CSCW) (London: Springer), 89–124. doi:10.1007/978-1-4471-0067-6_6
Bangor, A., Kortum, P., and Miller, J. (2009). Determining What Individual SUS Scores Mean: Adding an Adjective Rating Scale. J. Usability Stud. 4, 114–123.
Benford, S., Bowers, J., Fahlén, L. E., and Greenhalgh, C. (1994). “Managing mutual awareness in collaborative virtual environments,” in Proceedings of the Conference on Virtual Reality Software and Technology (VRST 1994) (Singapore: World Scientific Publishing Co., Inc.), 223–236. doi:10.5555/207072.207146
Benford, S., and Fahlén, L. (1993). “A Spatial Model of Interaction in Large Virtual Environments,” in Proceedings of the Third European Conference on Computer-Supported Cooperative Work (ECSCW 1993) (Milan, Italy: Springer, Dordrecht), 109–124. doi:10.1007/978-94-011-2094-4_8
Billinghurst, M., Cordeil, M., Bezerianos, A., and Margolis, T. (2018). “Collaborative Immersive Analytics,” in Immersive Analytics. Lecture Notes in Computer Science (LNCS, Volume 11190). Editors K. Marriott, F. Schreiber, T. Dwyer, K. Klein, N. H. Riche, T. Itohet al. First online edn. (Cham: Springer), 221–257. doi:10.1007/978-3-030-01388-2_8
Brooke, J. (1996). “SUS: A ’Quick and Dirty’ Usability Scale,” in Usability Evaluation in Industry. Editors P. W. Jordan, B. Thomas, I. L. McClelland, and B. Weerdmeester (Boca Raton, Florida, United States: CRC Press), 189–194. doi:10.1201/9781498710411
Büschel, W., Chen, J., Dachselt, R., Drucker, S., Dwyer, T., Görg, C., et al. (2018). “Interaction for Immersive Analytics,” in Immersive Analytics. Lecture Notes in Computer Science (LNCS, Volume 11190). Editors K. Marriott, F. Schreiber, T. Dwyer, K. Klein, N. H. Riche, T. Itohet al. First online edn. (Cham: Springer), 221–257. doi:10.1007/978-3-030-01388-2_4
Butcher, P. W. S., John, N. W., and Ritsos, P. D. (2019). “VRIA - A Framework for Immersive Analytics on the Web,” in Extended Abstracts of the 2019 CHI Conference on Human Factors in Computing Systems (CHI EA 2019) (Glasgow, Schotland, UK: Association for Computing Machinery (ACM)), LBW2615:1–LBW2615:6. doi:10.1145/3290607.3312798
Casarin, J., Pacqueriaud, N., and Bechmann, D. (2018). UMI3D: A Unity3D Toolbox to Support CSCW Systems Properties in Generic 3D User Interfaces. Proc. ACM Human-Computer Interaction (CSCW) 2, 29:1–29:20. doi:10.1145/3274298
Cavallo, M., Dolakia, M., Havlena, M., Ocheltree, K., and Podlaseck, M. (2019). “Immersive Insights: A Hybrid Analytics System for Collaborative Exploratory Data Analysis,” in Proceedings of the 25th ACM Symposium on Virtual Reality Software and Technology (VRST 2019) (Parramatta, NSW, Australia: Association for Computing Machinery (ACM)), 9:1–9:12. doi:10.1145/3359996.3364242
Churchill, E. F., and Snowdon, D. (1998). Collaborative Virtual Environments: An Introductory Review of Issues and Systems. Virtual Reality 3, 3–15. doi:10.1007/BF01409793
Cordeil, M., Cunningham, A., Bach, B., Hurter, C., Thomas, B. H., Marriott, K., et al. (2019). “IATK: An Immersive Analytics Toolkit,” in Proceedings of the IEEE Conference on Virtual Reality and 3D User Interfaces (VR 2019) (Osaka, Japan: Institute of Electrical and Electronics Engineers (IEEE)), 200–209. doi:10.1109/VR.2019.8797978
Cruz, A., Morgado, L., Paredes, H., Fonseca, B., and Martins, P. (2015). “Fitting Three Dimensional Virtual Worlds into CSCW,” in Proceedings of the 19th International Conference on Computer Supported Cooperative Work in Design (CSCWD 2015) (Calabria, Italy: Institute of Electrical and Electronics Engineers (IEEE)), 419–424. doi:10.1109/CSCWD.2015.7230996
Dix, A. (1994). “Computer Supported Cooperative Work: A Framework,” in Design Issues in CSCW. Computer Supported Cooperative Work. Editors D. Rosenberg, and C. Hutchison (London: Springer), 9–26. doi:10.1007/978-1-4471-2029-2_2
Dwyer, T., Marriott, K., Isenberg, T., Klein, K., Riche, N., Schreiber, F., et al. (2018). “Immersive Analytics: An Introduction,” in Immersive Analytics. Lecture Notes in Computer Science (LNCS, Volume 11190). Editors K. Marriott, F. Schreiber, T. Dwyer, K. Klein, N. H. Riche, T. Itohet al. First online edn. (Cham: Springer), 1–23. doi:10.1007/978-3-030-01388-2_1
Endsley, M. R. (1988). “Situation awareness global assessment technique (SAGAT),” in Proceedings of the IEEE 1988 National Aerospace and Electronics Conference (Dayton, OH, USA: Institute of Electrical and Electronics Engineers (IEEE)), 789–795. doi:10.1109/NAECON.1988.195097
Ens, B., Bach, B., Cordeil, M., Engelke, U., Serrano, M., Willett, W., et al. (2021). “Grand Challenges in Immersive Analytics,” in Proceedings of the 2021 CHI Conference on Human Factors in Computing Systems (CHI 2021) (Yokohama, Japan: Association for Computing Machinery (ACM)), 459:1–459:17. doi:10.1145/3411764.3446866
Ens, B., Lanir, J., Tang, A., Bateman, S., Lee, G., Piumsomboon, T., et al. (2019). Revisiting collaboration through mixed reality: The evolution of groupware. Int. J. Human-Computer Stud. 131, 81–98. doi:10.1016/j.ijhcs.2019.05.011
Fonnet, A., and Prié, Y. (2021). Survey of Immersive Analytics. IEEE Trans. Vis. Comput. Graphics 27, 2101–2122. doi:10.1109/TVCG.2019.2929033
Gugenheimer, J., Stemasov, E., Frommel, J., and Rukzio, E. (2017). “ShareVR: Enabling Co-Located Experiences for Virtual Reality between HMD and Non-HMD Users,” in Proceedings of the 2017 CHI Conference on Human Factors in Computing Systems (CHI 2017) (Denver, Colorado, USA: Association for Computing Machinery (ACM)), 4021–4033. doi:10.1145/3025453.3025683
Gutwin, C., and Greenberg, S. (2002). A Descriptive Framework of Workspace Awareness for Real-Time Groupware. Comput. Supported Coop. Work (CSCW) 11, 411–446. doi:10.1023/A:1021271517844
Gutwin, C., and Greenberg, S. (1998). “Design for Individuals, Design for Groups: Tradeoffs Between Power and Workspace Awareness,” in Proceedings of the 1998 ACM Conference on Computer Supported Cooperative Work (CSCW 1998) (Seattle, Washington, USA: Association for Computing Machinery (ACM)), 207–216. doi:10.1145/289444.289495
Hackathorn, R., and Margolis, T. (2016). “Immersive Analytics: Building Virtual Data Worlds for Collaborative Decision Support,” in 2016 Workshop on Immersive Analytics (IA) (Greenville, SC, USA: Institute of Electrical and Electronics Engineers (IEEE)), 44–47. doi:10.1109/IMMERSIVE.2016.7932382
Hart, S. G. (2006). Nasa-Task Load Index (NASA-TLX); 20 Years Later. Proc. Hum. Factors Ergon. Soc. Annu. Meet. 50, 904–908. doi:10.1177/154193120605000909
Heer, J., and Agrawala, M. (2008). “Design Considerations for Collaborative Visual Analytics,” in 2007 IEEE Symposium on Visual Analytics Science and Technology (Sacramento, CA, USA: Institute of Electrical and Electronics Engineers (IEEE)), 171–178. doi:10.1109/VAST.2007.4389011
IJsselsteijn, W. A., de Kort, Y. A. W., and Poels, K. (2013). The Game Experience Questionnaire. Tech. Rep.. Eindhoven: Technische Universiteit Eindhoven.
Isenberg, P., Elmqvist, N., Scholtz, J., Cernea, D., Kwan-Liu Ma, K.-L., and Hagen, H. (2011). Collaborative visualization: Definition, challenges, and research agenda. Inf. Visualization 10, 310–326. doi:10.1177/1473871611412817
Isenberg, T. (2014). “An Interaction Continuum for Visualization,” in Proceedings of the VIS Workshop on “Death of the Desktop: Envisioning Visualization without Desktop Computing”, Paris, France. Editors Y. Jansen, P. Isenberg, J. Dykes, S. Carpendale, and D. Keefe, 1–3.
Khadka, R., Money, J. H., and Banic, A. (2018). “Evaluation of Scientific Workflow Effectiveness for a Distributed Multi-User Multi-Platform Support System for Collaborative Visualization,” in Proceedings of the Practice and Experience on Advanced Research Computing (PEARC 2018) (Pittsburgh, Pennsylvania, USA: Association for Computing Machinery (ACM)), 61:1–61:8. doi:10.1145/3219104.3229283
Kim, K., Javed, W., Williams, C., Elmqvist, N., and Irani, P. (2010). “Hugin: A Framework for Awareness and Coordination in Mixed-Presence Collaborative Information Visualization,” in Proceedings of the ACM International Conference on Interactive Tabletops and Surfaces (ITS 2010) (Saarbrücken, Germany: Association for Computing Machinery (ACM)), 231–240. doi:10.1145/1936652.1936694
Kolence, K. W., and Kiviat, P. J. (1973). Software Unit Profiles & Kiviat Figures. SIGMETRICS Perform. Eval. Rev. 2, 2–12. doi:10.1145/1041613.1041614
Kolence, K. W. (1973). The Software Empiricist. ACM SIGMETRICS Perform. Eval. Rev. 2, 31–36. doi:10.1145/1113644.1113647
LaValle, S. M. (2020). Virtual Reality. (Online). http://lavalle.pl./vr/
LaViola, J. J., Kruijff, E., McMahan, R. P., Bowman, D., and Poupyrev, I. P. (2017). 3D User Interfaces: Theory and Practice. 2nd edn. Boston: Addison-Wesley Professional.
Lee, J., Kim, M., and Kim, J. (2020). RoleVR: Multi-experience in immersive virtual reality between co-located HMD and non-HMD users. Multimed Tools Appl. 79, 979–1005. doi:10.1007/s11042-019-08220-w
Lundblad, P., Thoursie, J., and Jern, M. (2010). “Swedish Road Weather Visualization,” in 2010 14th International Conference Information Visualisation (IV) (London, UK: Institute of Electrical and Electronics Engineers (IEEE)), 313–321. doi:10.1109/IV.2010.51
Nguyen, H., Ward, B., Engelke, U., Thomas, B., and Bednarz, T. (2019). “Collaborative Data Analytics Using Virtual Reality,” in Proceedings of the 2019 IEEE Conference on Virtual Reality and 3D User Interfaces (IEEE VR 2019) (Osaka, Japan: Institute of Electrical and Electronics Engineers (IEEE)), 1098–1099. doi:10.1109/VR.2019.8797845
Nguyen, H., and Duval, T. (2014). “A Survey of Communication and Awareness in Collaborative Virtual Environments,” in Proceedings of the International Workshop on Collaborative Virtual Environments (3DCVE 2014) (Minneapolis, MN, USA: Institute of Electrical and Electronics Engineers (IEEE)), 1–8. doi:10.1109/3DCVE.2014.7160928
Norwegian National Committee For Research Ethics in Science and Technology (2016). Guidelines For Research Ethics in Science and Technology. 2nd edn.. https://www.forskningsetikk.no/en/guidelines/science-and-technology/guidelines-for-research-ethics-in-science-and-technology/
O’Brien, H. L., Cairns, P., and Hall, M. (2018). A practical approach to measuring user engagement with the refined user engagement scale (UES) and new UES short form. Int. J. Human-Computer Stud. 112, 28–39. doi:10.1016/j.ijhcs.2018.01.004
Peter, M., Horst, R., and Dörner, R. (2018). “VR-Guide: A Specific User Role for Aysmmetric Virtual Reality Setups in Distributed Virtual Reality Applications,” in Tagungsband 15. Workshop der GI-Fachgruppe VR/AR (Düsseldorf, Germany: Gesellschaft für Informatik (GI)), 83–94.
Pinelle, D., Gutwin, C., and Greenberg, S. (2003). Task Analysis for Groupware Usability Evaluation: Modeling Shared-Workspace Tasks with the Mechanics of Collaboration. ACM Trans. Comput.-Hum. Interact. 10, 281–311. doi:10.1145/966930.966932
Poels, K., de Kort, Y. A. W., and IJsselsteijn, W. A. (2007). D3.3: Game Experience Questionnaire: development of a self-report measure to assess the psychological impact of digital games. Tech. Rep. Technische Universiteit Eindhoven.
Reid, G. B., and Nygren, T. E. (1988). The Subjective Workload Assessment Technique: A Scaling Procedure for Measuring Mental Workload. Adv. Psychol. 52, 185–218. doi:10.1016/S0166-4115(08)62387-0
Reski, N., Alissandrakis, A., and Kerren, A. (2020a). “Exploration of Time-Oriented Data in Immersive Virtual Reality Using a 3D Radar Chart Approach,” in Proceedings of the 11th Nordic Conference on Human-Computer Interaction: Shaping Experiences, Shaping Society (NordiCHI 2020) (Tallinn, Estonia: Association for Computing Machinery (ACM)), 33:1–33:11. doi:10.1145/3419249.3420171
Reski, N., Alissandrakis, A., Tyrkkö, J., and Kerren, A. (2020b). ““Oh, that's where you are!” – Towards a Hybrid Asymmetric Collaborative Immersive Analytics System,” in Proceedings of the 11th Nordic Conference on Human-Computer Interaction: Shaping Experiences, Shaping Society (NordiCHI 2020) (Tallinn, Estonia: Association for Computing Machinery (ACM)), 5:1–5:12. doi:10.1145/3419249.3420102
Rheinberg, F., Vollmeyer, R., and Engeser, S. (2003). “Die Erfassung des Flow-Erlebens [The assessment of flow experience],” in Diagnostik von Selbstkonzept, Lernmotivation und Selbstregulation [Diagnosis of motivation and self-concept]. Editors J. Stiensmeier-Pelster, and F. Rheinberg (Göttingen, Germany: Hogrefe), 261–279.
Schrepp, M., Hinderks, A., and Thomaschewski, J. (2017). Construction of a Benchmark for the User Experience Questionnaire (UEQ). Int. J. Interactive Multimedia Artif. Intelligence 4, 40–44. doi:10.9781/ijimai.2017.445
Shneiderman, B. (1996). “The Eyes Have It: A Task by Data Type Taxonomy for Information Visualizations,” in Proceedings 1996 IEEE Symposium on Visual Languages (Boulder, CO, USA: Institute of Electrical and Electronics Engineers (IEEE)), 336–343. doi:10.1109/VL.1996.545307
Sicat, R., Li, J., Choi, J., Cordeil, M., Jeong, W.-K., Bach, B., et al. (2019). DXR: A Toolkit for Building Immersive Data Visualizations. IEEE Trans. Vis. Comput. Graphics 25, 715–725. doi:10.1109/TVCG.2018.2865152
Skarbez, R., Polys, N. F., Ogle, J. T., North, C., and Bowman, D. A. (2019). Immersive Analytics: Theory and Research Agenda. Front. Robot. AI 6, 82:1–82:15. doi:10.3389/frobt.2019.00082
Snowdon, D., Churchill, E. F., and Munro, A. J. (2001). “Collaborative Virtual Environments: Digital Spaces and Places for CSCW: An Introduction,” in Collaborative Virtual Environments: Digital Places and Spaces for Interaction. Computer Supported Cooperative Work (CSCW). Editors E. F. Churchill, D. N. Snowdon, and A. J. Munro (London: Springer), 3–17. doi:10.1007/978-1-4471-0685-2_1
Sugiura, Y., Ibayashi, H., Chong, T., Sakamoto, D., Miyata, N., Tada, M., et al. (2018). “An Asymmetric Collaborative System for Architectural-scale Space Design,” in Proceedings of the 16th ACM SIGGRAPH International Conference on Virtual-Reality Continuum and its Applications in Industry (VRCAI 2018) (Tokyo, Japan: Association for Computing Machinery (ACM)), 1–6. doi:10.1145/3284398.3284416
Swedish Research Council (2017). Good Research Practice. 2nd edn. Stockholm: Vetenskapsrådet. https://www.vr.se/english/analysis/reports/our-reports/2017-08-31-good-research-practice.html.
Thomsen, A. L., Nilsson, N. C., Nordahl, R., and Lohmann, B. (2019). Asymmetric collaboration in virtual reality: A taxonomy of asymmetric interfaces for collaborative immersive learning. Tidsskriftet Læring Og Medier (LOM) 12, 28. doi:10.7146/lom.v12i20.109391
Wang, X., Besançon, L., Gueéniat, F., Sereno, M., Ammi, M., and Isenberg, T. (2019). “A Vision of Bringing Immersive Visualization to Scientific Workflows,” in Proceedings of the 2019 ACM Conference on Human Factors in Computing Systems (CHI) - Workshop on Interaction Design & Prototyping for Immersive Analytics (Glasgow, Scotland, UK: Association for Computing Machinery (ACM)), 8.
Ward, M. O., Grinstein, G., and Keim, D. (2015). Interactive Data Visualization: Foundations, Techniques, and Applications. 2nd edn.. Boca Raton, Florida, United States: A K Peters/CRC Press.
Welsford-Ackroyd, F., Chalmers, A., dos Anjos, R. K., Medeiros, D., Kim, H., and Rhee, T. (2020). “Asymmetric Interaction between HMD Wearers and Spectators with a Large Display,” in Poster session at The 2020 IEEE Conference on Virtual Reality and 3D User Interfaces (IEEE VR 2020) (Atlanta, Georgia, USA: Institute of Electrical and Electronics Engineers (IEEE)), 2. doi:10.1109/vrw50115.2020.00186
Wideström, J., Axelsson, A.-S., Schroeder, R., Nilsson, A., Heldal, I., and Abelin, Å. (2000). “The Collaborative Cube Puzzle: A Comparison of Virtual and Real Environments,” in Proceedings of the 3rd international conference on Collaborative virtual environments (CVE 2000) (San Francisco, California, USA: Association for Computing Machinery (ACM)), 165–171. doi:10.1145/351006.351035
Keywords: asymmetric user roles, computer-supported cooperative work, heterogeneous display and interaction technologies, immersive analytics, empirical evaluation, spatio-temporal data exploration, synchronous remote collaboration, virtual reality
Citation: Reski N, Alissandrakis A and Kerren A (2022) An Empirical Evaluation of Asymmetric Synchronous Collaboration Combining Immersive and Non-Immersive Interfaces Within the Context of Immersive Analytics. Front. Virtual Real. 2:743445. doi: 10.3389/frvir.2021.743445
Received: 18 July 2021; Accepted: 26 October 2021;
Published: 17 January 2022.
Edited by:
Jan Gugenheimer, Télécom ParisTech, FranceReviewed by:
Luciana Nedel, Federal University of Rio Grande do Sul, BrazilErnst Kruijff, Hochschule Bonn-Rhein-Sieg (H-BRS), Germany
Copyright © 2022 Reski, Alissandrakis and Kerren. This is an open-access article distributed under the terms of the Creative Commons Attribution License (CC BY). The use, distribution or reproduction in other forums is permitted, provided the original author(s) and the copyright owner(s) are credited and that the original publication in this journal is cited, in accordance with accepted academic practice. No use, distribution or reproduction is permitted which does not comply with these terms.
*Correspondence: Nico Reski, nico.reski@lnu.se