 Yaping Ma
 Yun Xie
 Rong Ha1
- 1School of Agriculture, Ningxia University, Yinchuan, China
- 2College of Forestry, Nanjing Forestry University, Nanjing, China
Goji berry (Lycium barbarum L.) exposure to elevated CO2 (eCO2) for long periods reduces their sugar and secondary metabolite contents. However, sugar accumulation in fruit depends on photosynthesis and photoassimilate partitioning. This study aimed to explore photosynthesis, sugar content, and sucrose metabolism-related enzyme activities in goji berry leaves and fruits under ambient and eCO2 levels, and identify the genes encoding L. barbarum acid invertase (LBAI), L. barbarum sucrose synthase (LBSS), L. barbarum sucrose phosphate synthase (LBSPS), and L. barbarum neutral invertase (LBNI), based on transcriptome profiling. Further, the characterization of four identified genes was analyzed including subcellular localization and expression patterns. In plants grown under eCO2 for 90 or 120 days, the expression of the above-mentioned genes changed significantly as the photosynthetic rate increased. In addition, leaf and fruit sugar contents decreased, and the activities of four sucrose metabolism-related enzymes increased in leaves, while acid and neutral invertase increased in fruits. Protein sequence analysis demonstrated that LBAI and LBNI contain a conservative structure domain belonging to the glycosyl hydrolases (Glyco_hydro) family, and both LBSS and LBSPS belonging to the sucrose synthase (Sucrose_synth) and glycosyltransferase (Glycos_transf) family. Subcellular localization analysis showed that LBAI, LBNI, and LBSS were all located in the nucleus, plasma membrane, and cytoplasm, while LBSPS was located in the plasma membrane. The expressions of LBAI, LBSPS, and LBNI were high in the stems, whereas LBSS was predominantly expressed in the fruits. Our findings provide fundamental data on photosynthesis and sugar accumulation trends in goji berries under eCO2 exposure.
Introduction
Goji berry (Lycium barbarum L.) is a deciduous perennial shrub of the Solanaceae family, traditionally used as a medicinal plant in East Asia (Amagase and Farnsworth, 2011; Pedro et al., 2018). The species has been planted in China for over 2,000 years and contains various bioactive and pharmacological components that promote metabolism and help control diabetes, regulate immunity, and protect the nervous system. Hence, it is widely used for its unique efficacy in immune regulation and anti-aging and anti-tumor effects. Studies have demonstrated that the whole goji berry plant (fruits, roots, leaves, bark, and flowers) contains a variety of phytochemical components, such as polysaccharides (LBP), flavonoids, carotenoids, alkaloids, amides, peptides, anthraquinones, sterols, natural acids, and glycolipids that have high medicinal values and plays a role in functional food development (Wang et al., 2015; Byambasuren et al., 2019). Goji berry fruits contain certain bioactive secondary metabolites which are often used for a wide range of pharmacological and therapeutic purposes as they are thought to have immunomodulatory, anti-inflammatory, anti-mutagenic, anti-cancer, anti-radiation, anti-aging, anti-stress, cardio-protective, and wound healing effects (Leontopoulos et al., 2017a,b; Kwok et al., 2019). Its leaves are also rich in various bioactive compounds, which are used as enzyme inhibitors and for their antimicrobial effects (Pereira et al., 2019; Zhao et al., 2019). Large quantities of dicaffeoylspermine/spermidines have been found in their roots and are thought to have beneficial effects on fever, night sweats, anxiety, kidney problems, backaches, and insomnia (Yao et al., 2018). Hence, as a medicinal and food plant, goji berry has attracted increased global attention and, as such, has broad development prospects in the fields of medicine and nutritional health.
Global warming is rapidly becoming a major threat to water resource availability and plant growth and fecundity worldwide (Kadiyala et al., 2015). Furthermore, rising atmospheric CO2 concentrations caused the greenhouse effect are increasingly acknowledged as the primary factor accelerating global climate change (IPCC, 2014). Concomitantly, as CO2 is the main reactant in photosynthesis, changes in ambient CO2 concentrations directly impact plant physiology and growth (Wei et al., 2018). Plant exposure to short-term elevated CO2 (eCO2) levels (700 μmol mol−1) significantly increases aboveground biomass and grain yield components while having a modest influence on the biochemical composition of the mature grain (although a reduction in plant nitrogen content is concomitant; Soba et al., 2019). In goji berries, results from experiments which simulated eCO2, higher temperature, and drought stress conditions associated with climate change showed that these factors significantly affected physiology, important pharmacological secondary metabolites, and sugar accumulation and distribution (Cao et al., 2011; Zhao et al., 2015b; Ma et al., 2019a). Our previous research showed that eCO2 increases photoassimilate partitioning and the transport of products derived from photosynthetic metabolisms, such as soluble sugars and polysaccharides, toward stems and leaves (Cao et al., 2011; Hou and Cao, 2011). Furthermore, long-term eCO2 decreases net photosynthetic rate (Pn), stomatal conductance (gs ), and photosynthetic CO2 assimilation rate, while promoting the accumulation of aboveground biomass to a greater extent than that of underground biomass (Guo et al., 2019). Moreover, long-term eCO2 causes a clear reduction in fruit sugar content and markedly alters the activities of the sucrose metabolism-related enzymes such as sucrose synthase (SS), sucrose phosphate synthase (SPS), neutral invertase (NI), and acid invertase (AI; Liu et al., 2016; Ha et al., 2019). In addition, eCO2 clearly impacts sugar metabolism gene expression. Using transcriptome analysis, the L. barbarum UDP-glucuronate 4-epimerase (LBGAE), L. barbarum alpha-galactosidase (LBGALA), and L. barbarum malate synthase (LBMS) genes, involved in the regulation of four sugar metabolism pathways, were found to be highly differentially expressed under eCO2 (Ma et al., 2019a, 2021). Several studies have found that the genes L. barbarum acid invertase (LBAI; Wang et al., 2014), L. barbarum neutral invertase (LBNI; Wang et al., 2019), L. barbarum sucrose synthase (LBSS; Wang et al., 2019), and L. barbarum sucrose phosphate synthase (LBSPS; Wang et al., 2013) play key roles in sugar transport and regulation in goji berries. However, no study has investigated how these genes regulate sugar metabolism functions or physiology in response to changing environmental conditions, such as climate change.
Our previous study reported that total sugar and carotenoid contents decreased in goji berry fruits after 120 days of growth in an eCO2 treatment. Three genes (LBGAE, LBGALA, and LBMS) were identified to play critical regulatory roles in the sugar metabolic pathway at various eCO2 concentrations (Ma et al., 2019a). Flavones, carotenoids, and various sugar components are the most important nutritional and medicinal components in goji berries, concentrations of which are determined by a key metabolite, sugar. As a non-referenced genome species, there are no studies on goji berry that clearly outline how gene function is regulated in sugar metabolism. Our work aimed to identify key genes related to sugar metabolism for the eventual goal of identifying and potentially developing goji berry varieties that produce larger quantities of sugar and secondary metabolites in eCO2 conditions. Therefore, in this study, we identified sucrose metabolism-related genes LBAI, LBSS, LBSPS, and LBNI based on recent studies and analyzed their characteristics, subcellular localization, and temporal and spatial expressions. Additionally, we investigated the photosynthetic characteristics, contents of different sugars, and activities of the sucrose metabolism-related enzymes (LBSS, LBSPS, LBNI, and LBAI) in both leaves and fruits. Our study provides novel insights into the sugar metabolism responses of goji berry to changes in CO2 concentrations. Such information is valuable, given the increasing importance of goji berry for medicinal and nutritional uses and the impending plant growth issues associated with climate change. Our study also provides direction for selecting candidate genes that contain high sugar and secondary metabolites contents to use in goji berry breeding.
Materials and Methods
Plant Material and Elevated CO2 Treatments
Goji berry plants from the cultivar “Ningqi 1” were provided by the Ningxia Academy of Agriculture and Forestry Sciences (Yinchuan, Ningxia, China), and the materials were of the same with de novo transcriptome materials (Ma et al., 2019a, 2021). The experimental farm is located in Yongning County in the Yellow River alluvial plain in central Ningxia Province, China (38°13'50.34'' N; 106°14'22.19'' E; 1116.86 m a. s. l.; inland, in the northwest). The climate at the study site is arid and moderately temperate, with a frost-free period of 140–160 days, and annual precipitation of 180–300 mm.
The experiments were conducted in a total of nine open-top chambers (OTCs) with three treatments: ambient (380 ± 20 μmol mol−1 CO2, considered consistent with the local environment), elevated I (570 ± 20 μmol mol−1 CO2, predicted concentration for the year 2025), and elevated II (760 ± 20 μmol mol−1 CO2, predicted concentration for the year 2050). CO2 concentration settings were based on projections reported in the IPCC report (IPCC, 2014). Each treatment was performed in three OTCs (nine chambers in total) between May 1, 2019 and October 1, 2019.
Nine 1-year-old goji berry cuttings were planted evenly in each OTC and grown uniformly. The growth management of the plants was as follows: organic fertilizer (organic content ≥45%, total content of N, P, and K ≥ 5%, water ≤ 30%, PH:5.5~8.5; according to the national standard of organic fertilizer NY525-2012) was applied in each OTC in April, and organic water-soluble fertilizer (18-18-18+2MgO Multi-feed, Haifa, Israel) was applied in July, August, and September. During the goji berry growing period, 1.5% Sophora flavescens lectin and 0.9% avermectin were used to control aphids and gall mites.
The OTC control system and experimental layout are shown in Figure 1A. The CO2 simulation control system consisted of three parts: the OTC, control system, and monitoring system. The OTC is a regular octagonal prism structure made of plastic, steel, and 4 mm of thick high-transmittance glass with dimensions of 1.08 m in length, 2.78 m in diameter, and an inner and outer height of 2.55 m and 2.10 m, respectively. Each OTC was set up in an interval length of 3 m (Figure 1A). The monitoring system consisted of CO2 analyzers (JQAW-12AC, 0–2000 μmol mol−1, Beijing Kunlun Coastal Sensing Technology Co., Ltd., Beijing, China), temperature and humidity sensors (JWSK-6ACW, Beijing Kunlun Coastal Sensing Technology Co., Ltd., Beijing, China), and a data acquisition system (Figure 1B). The control system also contained other components, including a programmable logic controller (PLC), GPRS communication module, touch screen, micro-relay, CO2 pressure reducing valves, solenoid valves, perforated windpipes, and CO2 cylinders. The OTC control system automatically collected and uploaded data every 6 min using a system controller coupled to the proportional-integral controller. A linear controller enabled deviation monitoring according to a given and an actual output value. The system was also equipped with a GSM communication module connected with the PLC through the protocol point to point interface (PPI) and is used to upload all the data to a web server. CO2 exposure time was set between 8 AM and 8 PM daily. The OTC control and monitoring systems and data were accessed in real-time through a web browser and mobile app, which reduced operating costs and allowed environmental variable monitoring (Figure 1C). The control system, described in more detail by Ma et al. (2019b), aims to assist climate change research and has successfully applied for and is the subject of a patent application (Ma et al., 2020). The variation curves of CO2 concentrations, temperatures, and ambient relative humidity monitored in the natural atmosphere from May 1 to October 1, 2019 are shown in Figure 1D; the averages were 378.48 μmol mol−1, 21.7°C, and 58.2%, respectively, with ranges of 365.17–397.46 μmol mol−1, −5.6 to 45.1°C, and 6.2–99.9%, respectively. Meanwhile, in the OTCs, the average CO2 concentrations under ambient, elevated I, and elevated II treatments were 369.33, 545.93, and 751.49 μmol mol−1, respectively. The average temperature was 22°C, with a minimum temperature of 15.67°C and maximum temperature of 33.72°C, and the average ambient relative humidity was 62.2%. Ma et al. (2019b) report more detailed OTC monitoring data.
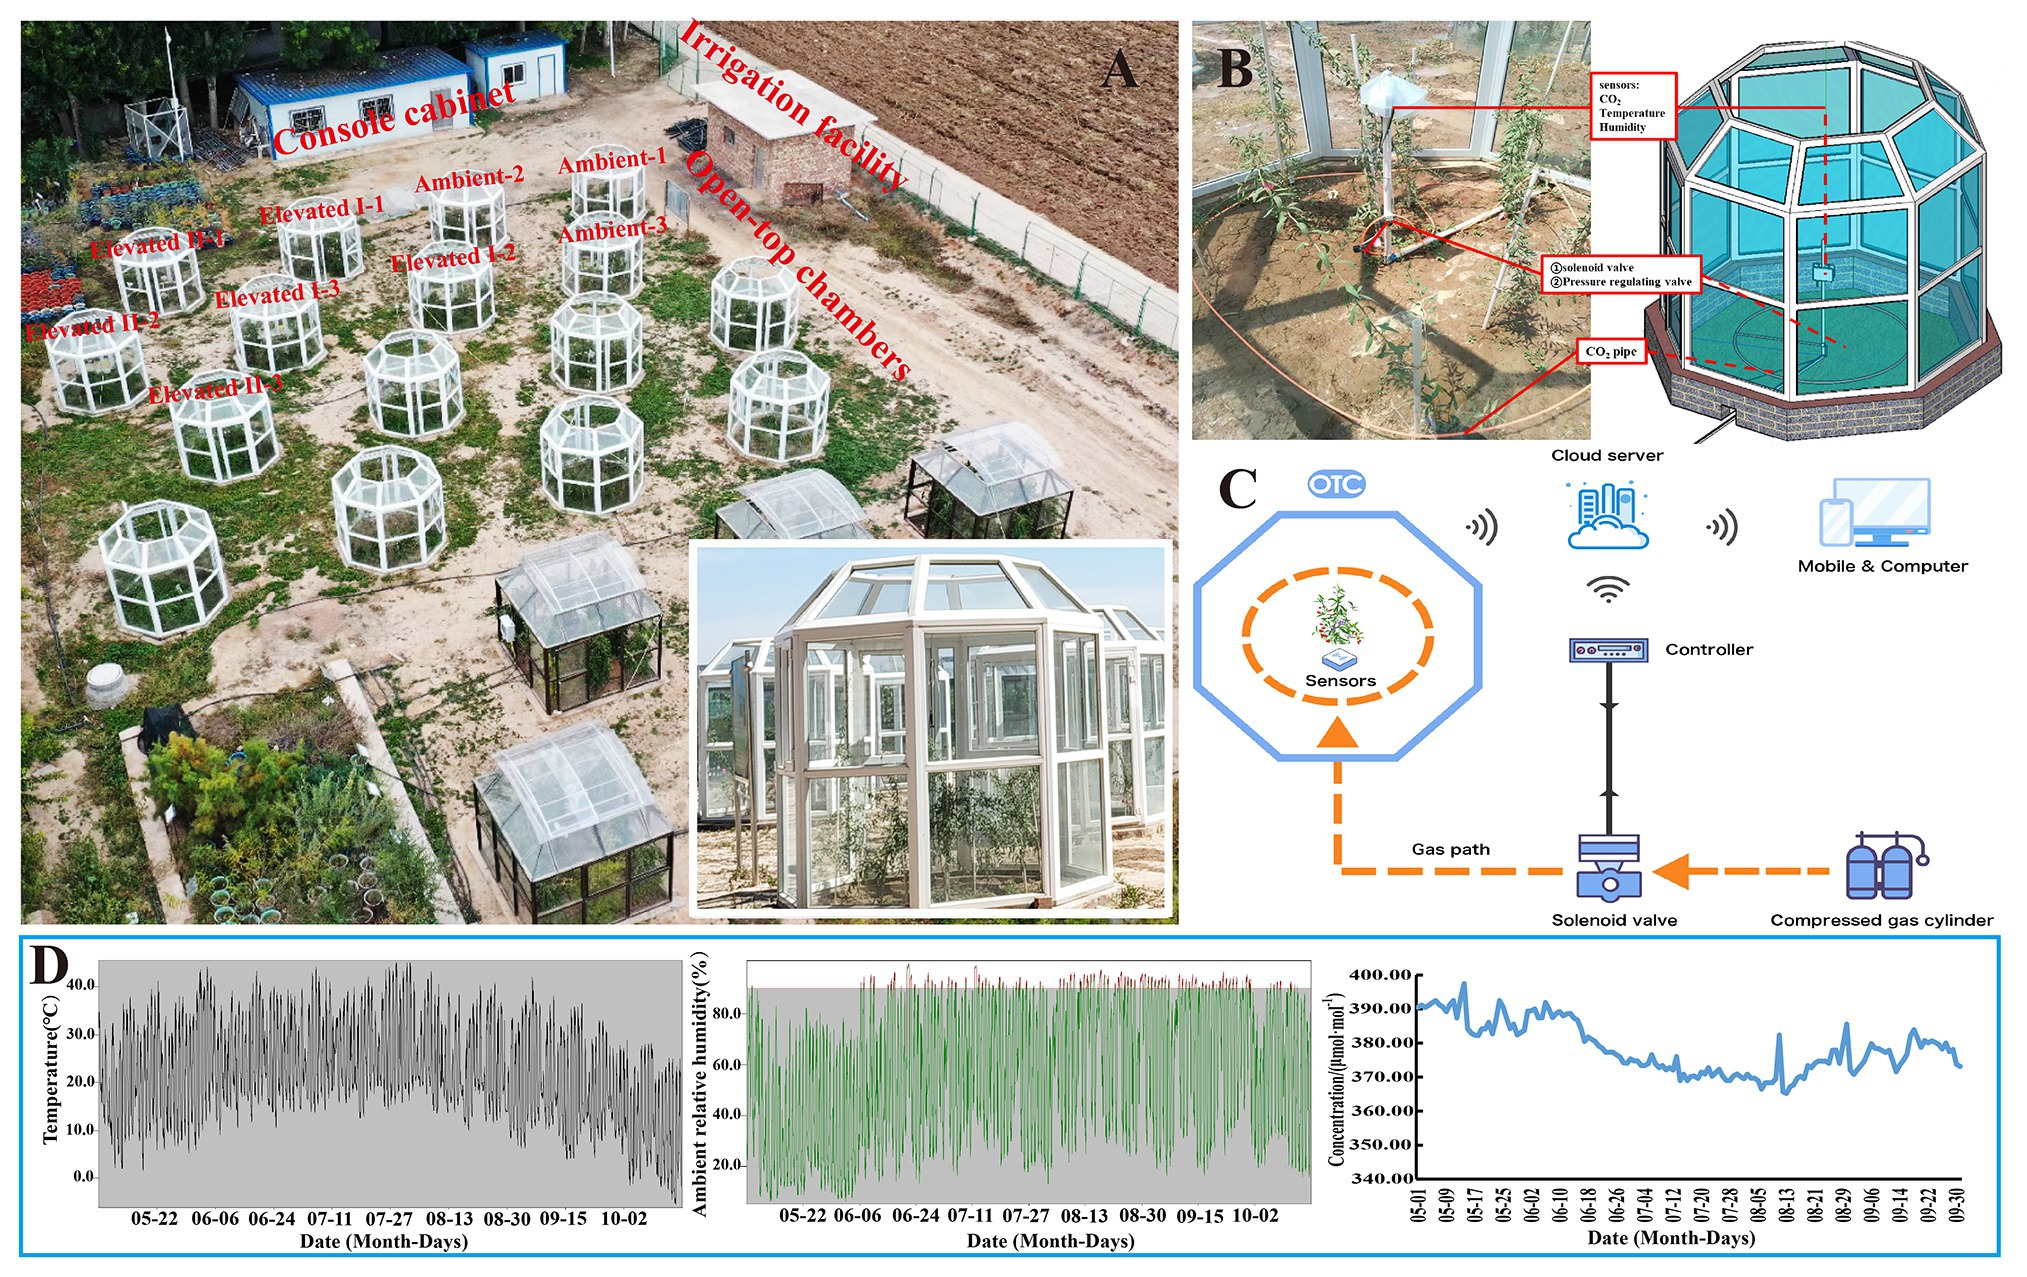
Figure 1. Open-top chamber (OTC) layout (A), chamber structure (B), control system (C), and natural environment temperature, air relative humidity, and CO2 concentration monitoring (D).
Root, stem, leaf, and fruit tissue samples were collected following 90 (August 8) and 120 (September 7) days of treatment to determine sugar contents and enzyme activities. Enzyme-encoding gene transcript levels were determined using real-time quantitative reverse transcription PCR (qRT-PCR) in fruit and leaf tissue samples. Upon collection, samples were immediately frozen in liquid nitrogen and stored at −80°C until analysis.
Photosynthetic Rate and Chlorophyll Content Measurements
Net photosynthetic rate (Pn), water use efficiency (WUE), intercellular CO2 concentration (Ci), stomatal conductance (gs), and leaf transpiration rate (Tr) under ambient and eCO2 (I and II) conditions were measured after 90 or 120 days between 9:00 and 11:00 AM with a portable photosynthesis system (Li-Cor 6,400; Li-Cor Inc., NE, United States). Measurements were performed after stabilization for 3 min to attain a steady-state under a light-saturating photosynthetic photon flux density of 2000 μmol m−2 s−1 and a leaf temperature of 28°C. Seedlings with 6–8 leaves from top to middle were selected for measurements. WUE was calculated using the formula WUE = Pn/Tr. From May 23 to September 22, 2019, at least 10 leaves from top to middle were selected to determine chlorophyll contents at 15-day intervals using a portable chlorophyll meter (SPAD-502, Konica Minolta, Japan), which was assumed to reflect relative chlorophyll content.
Sugar Content and Sucrose Metabolism-Related Enzyme Analysis
Fruits and leaves were collected from trees kept under ambient or eCO2 (I or II) conditions in OTCs after 90 and 120 days and stored at −80°C to determine glucose, fructose, starch, and sucrose contents, and the activities of sucrose metabolism-related enzymes LBAI, LBSS, LBSPS, and LBNI. All the below experiments contained three biological replicates, and each replicate included at least three technical replicates.
Glucose, fructose, sucrose, and starch were determined by the anthrone-sulfuric acid method with slight modifications (Leyva et al., 2008; Li et al., 2011). Glucose, fructose, and sucrose: The samples (5 g) were finely grounded using mortar and pestle with 75% ethanol. The mixture and its rinsed components were added to the volumetric flask amounting to a total volume of 80 ml. The solution was placed in an 80°C water bath for 15 min and then cooled down 20°C. Thereafter, it was centrifuged at 8000 rpm for 10 min, of which the supernatant was extracted into 10 ml test tubes with added distilled water to 10 ml. Then, 1 ml of the filtered sample solution was placed in a test tube, and 1 ml of distilled water was added, making a total volume of 2 ml. Using a burette, anthrone-sulfuric acid was added to the solution, shaken for 10 s, and heated in a boiling water bath for 3.5 min. The above steps were repeated with 2 ml distilled water as a control. The absorbance was measured at 620 nm wavelength using a spectrophotometer.
Starch: The samples (5 g) were weighed, grounded, and properly mixed in a mortar, and then transferred to a 50 ml centrifuge tube. To moisten the samples, 2 ml of 80% ethanol was added to the mixture. Thereafter, 5 ml of distilled water and 25 ml of 80% ethanol were added; the solution was thoroughly mixed and placed at 20°C for 5 min, and then centrifuged at 2500 rpm for another 5 min. The supernatant was discarded, and 30 ml of 80% ethanol solution was added. The above steps were repeated to obtain the residue, then 5 ml of distilled water and 30 ml 52% perchloric acid solution were added, and the solution was placed in a vortex oscillator for 10 min. Subsequently, it was centrifuged at 2500 rpm for 10 min, of which the supernatant was transferred into a 100 ml volumetric flask with 100 ml of distilled water. The solution was then filtered, and 10 ml was placed in a 250 ml volumetric flask. After that, distilled water was added, and 2 ml was taken and placed in a 10 ml tube. It was placed in a cold bath for 2 min, and then 6 ml of anthrone sulfate solution was added and thoroughly mixed. It was again placed in a cold bath for 2 min, a boiling water bath for 5 min, and then cooled to room temperature 20°C. Absorptivity was determined at 640 nm.
LBAI, LBNI, LBSS, and LBSPS activities assay was conducted with reference to Zheng et al. (2008) and Liu et al. (2016) with a slight modification.
LBAI and LBNI activities assay: Samples (0.5 g) were finely grounded in liquid nitrogen using a chilled mortar and pestle for 10 min, and extraction buffer [200 mmol·L−1 phosphate buffer, 5 mmol·L−1MgCl2, 0.1% beta-mercaptoethanol, 0.05% Triton-X 100, 0.05% bovine serum albumin (BSA), 2% polyvinylpolypyrrolidone (PVPP), pH 7.5] was added. The homogenate was centrifuged at 20000 rpm for 30 min, and the supernatant was collected. (NH4)2SO4 up to 80% saturation was added and left to settle for 30 min, and then centrifuged at 20,000 rpm for 20 min. The supernatant was removed, and desalting buffer (20 mmol·L−1 phosphate buffer, 0.25 mmol·L−1MgCl2, 0.01% beta-mercaptoethanol, 0.05% BSA, pH 7.5) was added. To dissolve precipitate again, the residue was dialyzed for 24 h at 4°C.
LBSS and LBSPS activities assay: The extraction method was same with the method described above; however, different buffers were used; extraction buffer [200 mmol·L−1 HEPES-NaoH, 5 mmol·L−1MgCl2, 0.01% beta-mercaptoethanol, 0.05% Triton-X 100, 0.05% BSA, 2% PVPP, 1 mmol·L−1 ethylene diamine tetraacetic acid (EDTA), 10 mmol·L−1 L-Ascorbic acid, 10 mmol·L−1 cysteine hydrochloride, 2% glycerol, pH 7.5]; desalting buffer [20 mmol·L−1 HEPES-NaoH, 0.25 mmol·L−1MgCl2, 0.01% beta-mercaptoethanol, 0.05% BSA, 1 mmol·L−1 EDTA, 1 mmol·L−1 ethylene glycol tetraacetic acid (EGTA), 2% glycerol, pH 7.5].
Identification, Characterization, Molecular Cloning, Vector Construction, and Transformation of Sucrose Metabolism-Related Genes
According to recent studies, the key genes closely related to sugar transport and regulation in goji berry were isolated using homologous cloning. The functions of LBAI, LBSS, LBSPS, and LBNI were predicted (Wang et al., 2014, 2019; Zhao et al., 2015a). Our work also found that LBGALA, LBGAE, and LBMS have key regulatory functions in sugar metabolism (Ma et al., 2019a, 2021). Our work aimed to find genes closely related to sugar metabolism in goji berry and further study their functions in order to improve the breeding of high sugar varieties in the future. Hence, we selected previously identified genes, LBAI, LBSS, LBSPS, and LBNI, to analyze their characteristics to provide a basis for further functional studies.
The sequence for L. barbarum sucrose metabolism-related genes LBAI (GenBank: KM191309.1, KC776575.1), LBSS (KC907702.1, KM191310.1), LBSPS (KM191308.1), and LBNI (KR026955) were searched against the NCBI nucleotide collection (nr/nt) using BLASTN (GenBank; Benson et al., 2012),1 and the full-length sequences were downloaded. BLASTN was performed again on each downloaded sequence against the database of the goji berry de novo transcriptome (Ma et al., 2019a) using a local database constructed with BLASTN 2.9.0+ (Morgulis et al., 2008). Sequence data identified for sucrose metabolism-related genes LBAI, LBSS, LBSPS, and LBNI were deposited into GenBank under reference numbers MN718195, MN718196, MN718197, and MN718198, respectively.
The ProtParam tool was used to analyze protein physicochemical properties.2 The open reading frame (ORF) was identified by utilizing an ORF finder.3 DNAMAN (V8.0, Lynnon Corporation, Vandreuil, QC, Canada) software was used to analyze the molecular mass, base composition, and base distribution of the nucleic acid sequences, and SignalP4.1 was employed to predict protein subcellular locations. Also,4 SWISS-MODEL was used to predict the structure of proteins.5
The cloning kit used was the NovoRec® PCR seamless one-step directional cloning kit (Novoprotein Scientific Inc., Shanghai, China). Primers were designed using Primer Premier 6.0 software (Premier Biosoft, Palo Alto, CA, United States). Primer sequences are listed in Supplementary Table S2. According to the designed primer, the target gene was cloned by PCR using sucrose metabolism-related gene sequences as templates. The reaction system was as follows: 25 μl of 2X Fast Pfu Master Mix (E035-02A Novoprotein, Shanghai, China), 0.5 μl of F (10 μM), 0.5 μl of R (10 μM), 0.5 μl of template, and up to 50 μl of distilled and deionized H2O. The reaction program for PCR was as follows: 95°C for 5 min, followed by 30 cycles of 94°C for 30 s, 50°C for 30 s, 72°C for 30 s per kb, and 72°C for 8 min. The 1% agarose gel was prepared, and then the PCR product was added to the gel hole, and the gel was placed in the electrophoresis tank. The voltage was set to 60–100 V, and the sample moved from the negative electrode (black) to the positive electrode (red) direction. Electrophoresis stopped when the bromophenol blue moved to approximately 1 cm below the plywood. A fluorescent band displayed the presence of DNA under a UV lamp, and it was photographed this using a gel imaging system. The gel containing the target band was quickly cut under the UV lamp and transferred to a 2 ml centrifuge tube. According to the instructions of the gel recovery kit (Bioteke Corporation, Beijing, China), the target fragment was recovered and stored at −20°C.
The plasmids pART-CAM-EGFP was digested with EcoRI and XhoI, and samples were loaded onto an agarose gel to detect the results. The large segment of the vector corresponding to the gel strip was cut, and a gel recovery kit (Bioteke Corporation, Beijing, China) was used to recover the enzyme cut products. The double-enzyme digestion reaction system used was as follow 8 μl of 2XTango buffer, 1 μl of XhoI, 1 μl of EcoRI, 8 μl of plasmids, and up to 40 μl of distilled and deionized H2O. Samples were incubated at 37°C for 2.5 h, followed by 65°C for 20 min until enzyme inactivation. The target DNA fragment and linearized carrier were added to the centrifugal tube with a certain molar ratio (3:1–10:1) for recombination reaction. After mixing at 37°C for 30 min, there was an immediate transformation, and the remaining sample was stored at −20°C.
Transformation and positive cloning identification: a tube containing 50 μl of DH5α competent cells was placed on melting ice and lightly shaken to suspend the cells. Then, we added 10 μl of reaction fluid. This solution was shaken lightly and incubated for 30 min on ice. The solution was then placed into a 42°C water bath for 90 s to initiate heat shock. After this, it was quickly put on ice for 2 min. We added 700 μl of LB liquid medium and then incubated at 37°C for 60 min. We then centrifuged the sample at 5000 g for 1 min to collect the bacteria. A certain amount of bacteria was evenly applied to a plate containing streptomycin antibiotics. This was then coated with sterilized glass beads. After the bacterial solution was absorbed by the agar, it was inverted at 37°C overnight. We then selected colonies for PCR positive cloning identification and detection of primers for forward (PF) and primer 4.
Agrobacterium strain GV3101 transformation: We used the Plasmid Mini Kit I (D6943, Beijing Think-Far Technology Co. Ltd., Beijing, China) to extract the right sequencing plasmid. We placed GV3101 competent cells on ice, added 5–10 μl of plasmid, and slightly shook the solution. We then placed it in an ice bath for 10 min, froze it in liquid nitrogen for 5 min, placed it in a 37°C water bath for 5 min, and then an ice bath for 5 min. Then, we mixed it with 800 μl of antibiotic-free LB liquid medium, shook it at 28°C for 3–4 h, and centrifuged it at 5000 rpm for 1 min. We applied an appropriate amount of bacteria onto a plate (containing spectinomycin and rifampicin), inverted and cultured at 28°C. After a single colony grew out, we selected six single colonies per gene for colony PCR verification. The detection primers were the same as those used with the amplified gene primer.
Transient transformation of tobacco to subcellular localization: the tested Agrobacterium strain GV3101 solution was centrifuged (200 rpm) at 28°C overnight. We then added 1.5 ml of bacteria solution to a sterile centrifuge tube and centrifuged at 8000 rpm for 2 min. Room temperature 20°C precipitated the bacteria solution, suspending the bacteria. A small amount of suspended bacteria solution was diluted 10 times and then valued OD600. We multiplied the OD600 by 10 to obtain the suspended bacterial solution’s OD600 value. Finally, we calculated the suspension solution for infection as 0.5–5 μl, and the OD600 value as 0.4. We placed the final suspension solution in a 1.5 ml centrifuge tube and set it at 20°C for 1–3 h to initiate infection. Before infection, we placed the tobacco samples under a white fluorescent lamp for 1 h to open pores. A sample of three inverted leaves and another sample of four inverted leaves were selected for the infection experiments (infection between two veins). Two leaves were selected from one plant and infected with one bacterial solution. We gently rubbed the back of a leaf blade (0.5 cm2) with a syringe (without the needle) or punctured it with a small needle to remove the waxy layer. A suspension of 1 ml was allowed to absorb into each tobacco leaf to initiate infection. Then, we put the samples back into a culture room for the night. The expression was highest 2–3 days after infection. The infection area was cut, and the epidermis was peeled under a fluorescence microscope. Samples were examined using laser confocal microscopy (FV3000, Olympus, Tokyo, Japan), and excitation of fluorescence was performed at 488 nm for green fluorescent protein (GFP) fluorescence and 561 nm for chlorophyll fluorescence and bright field, and emission setting was 500–550 nm for GFP fluorescence and 570–620 nm for chlorophyll fluorescence and bright field.
Expression Analysis of Sucrose Metabolism-Related Genes
Gene expression analysis was performed using qRT-PCR. Total RNA was extracted from roots, stems, leaves, and fruits of goji berry using RNAprep Pure Plant Kit (Tiangen, Beijing, China) according to the manufacturer’s instructions. RNA quality was assessed by performing electrophoresis on 0.8% agarose gel, and RNA concentration was measured using a NanoDrop 2000 spectrophotometer (Thermo Scientific, United States). Quantitative PCR (qPCR) was performed with the Lightcycler 480 system (Roche). Specific qPCR primers for LBAI, LBSS, LBSPS, LBNI, and β-actin (internal reference) were designed based on a full cDNA sequence (SupplementaryTable S2) using the PrimerQuest Tool.6 First-strand reverse transcription was performed using the miRcute Enhanced miRNA cDNA First Strand Synthesis kit (KR211, Tiangen, Beijing, China), prepared as follow: 10.0 μl 2 × miRNA RT Reaction Buffer, total RNA, 2.0 μl miRNA RT EnzymeMix, and up to 20 μl RNase Free dH2O. Reverse transcription was performed at 42°C for 30 min, followed by 2 min at 95°C to inactivate the enzyme, and the temperature was then decreased to 4°C. Subsequently, qPCR was performed using the miRcute Plus miRNA qPCR Detection kit (SYBR Green; FP411, Tiangen, Beijing, China). The reaction volume of 20 μl consisted of 10 μl 2 × miRcute Plus miRNA Premix, 0.4 μl PCR forward (10 μM) and reverse (10 μM) primers, 1.0 μl cDNA template, and 8.2 μl dH2O. The reaction program for qRT-PCR was denaturation at 95°C for 15 min, followed by 45 cycles of 94°C for 30 s, and 60°C for 1 min. Real-time PCR was performed for each gene using three biological replicates and three technical replicates. Relative expression levels of LBAI, LBSS, LBSPS, and LBNI were calculated using the 2−ΔΔct method with three technical replicates (Livak and Schmittgen, 2001).
Statistical Analysis
The observed results of chlorophyll, photosynthesis, sugar content, sucrose metabolism-related enzyme activities, and qPCR data were analyzed by one-way ANOVA model using GraphPad prims software (version 7, GraphPad Software Inc, La Jolla, CA, United States), with Tukey’s HSD multiple comparisons applied at a 0.01 significance level. Pearson analysis was applied to identify the correlation among sugars in leaves and sugars and enzymes in berries.
Results
Chlorophyll and Photosynthesis
Leaf chlorophyll content was determined under ambient and eCO2 conditions at 15-day intervals during the growth period of goji berry seedlings. As shown in Figure 2A, chlorophyll content increased over time under different eCO2 concentrations, and significant (p < 0.05) differences were observed on five dates (June 7th,August 8th and 23rd, and September 7th and 22nd).
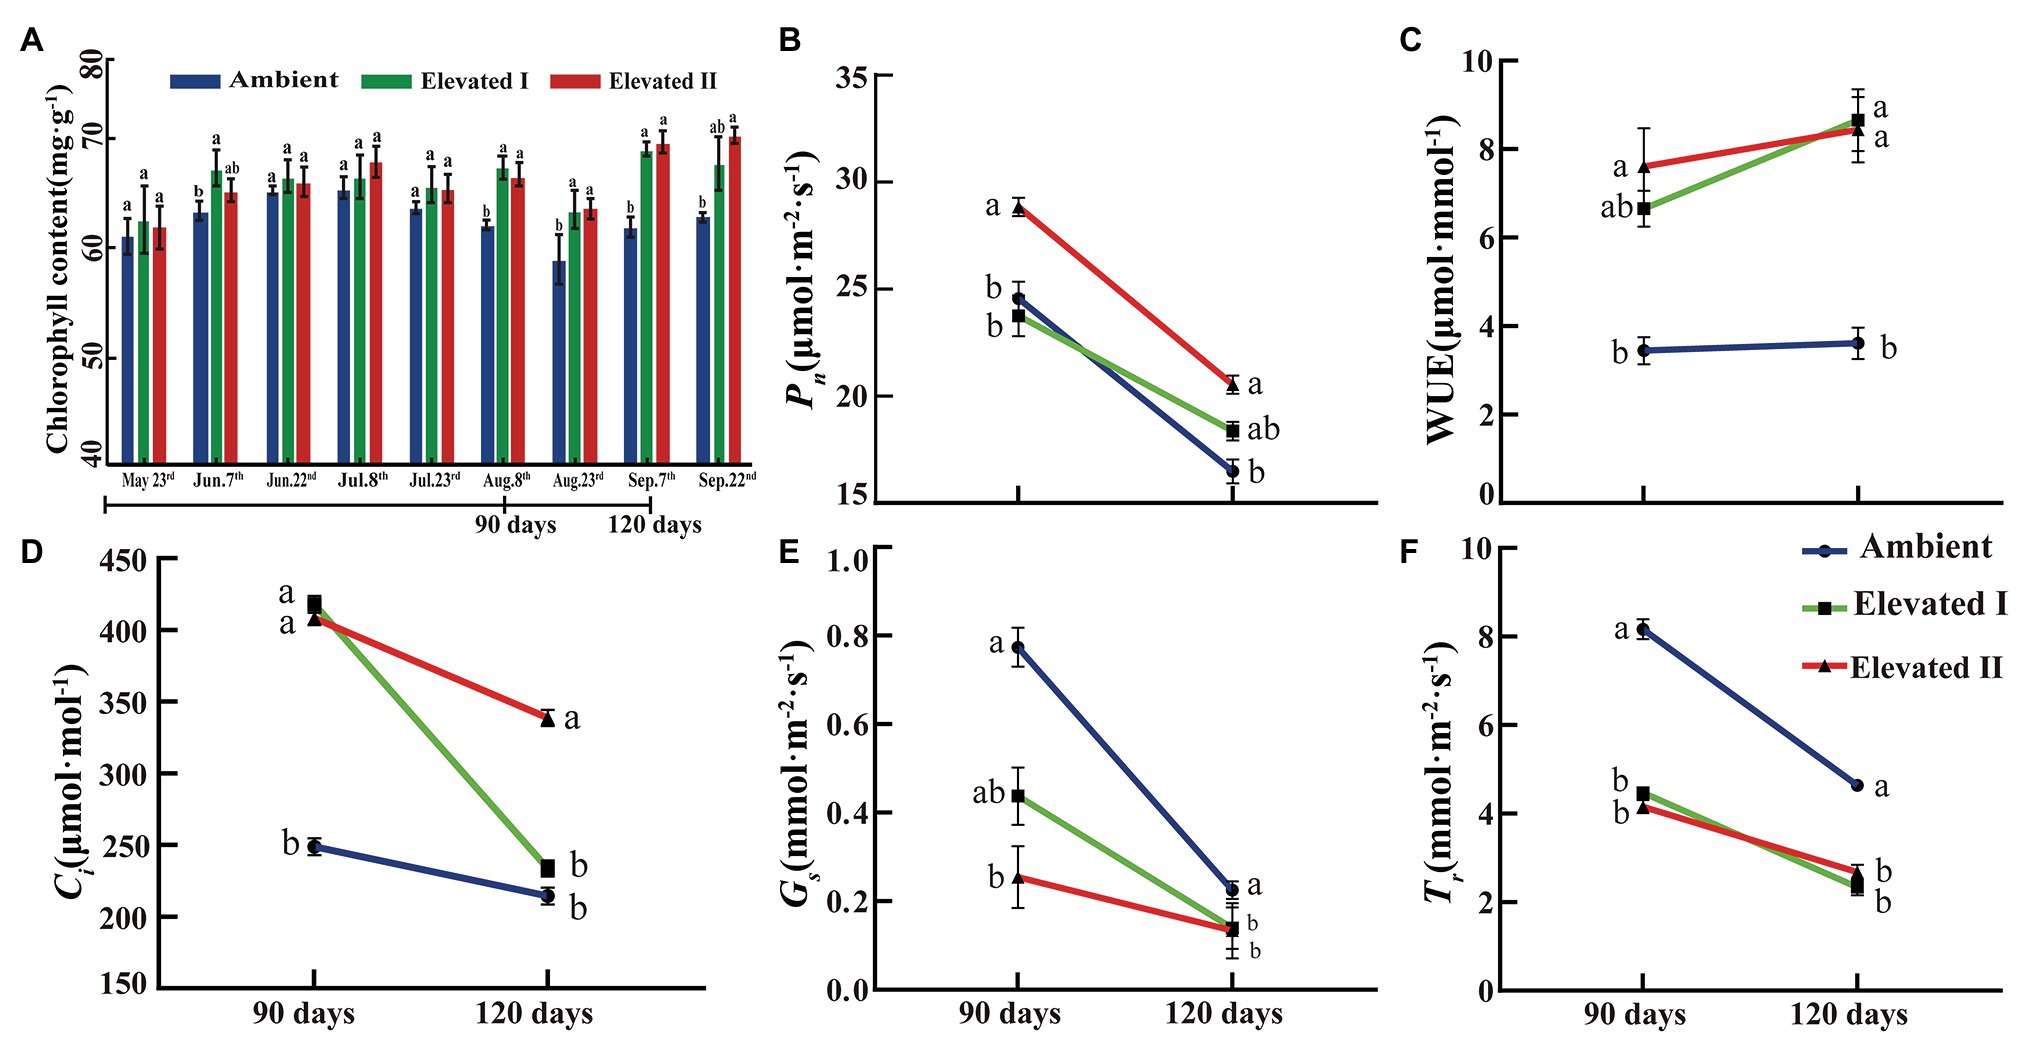
Figure 2. Chlorophyll content (A) and photosynthetic capacity (B–F) under elevated and ambient CO2 in goji berry for 90 and 120 days. Pn, net photosynthetic rates, WUE, water use efficiency, Ci, intercellular CO2 concentration, gs, stomatal conductance, Tr, transpiration rate. Different lowercase letters indicate significant difference at p < 0.05.
Photosynthetic parameters, including Pn, Ci, gs, and Tr, were measured. Additionally, WUE was estimated to evaluate CO2 treatment effects on photosynthesis and biomass accumulation at 90 and 120 days after treatment initiation. Pn (Figure 2B), Ci (Figure 2D), gs (Figure 2E), and Tr (Figure 2F) showed a consistent downward trend at 90 and 120 days under eCO2. In contrast, WUE (Figure 2C) was significantly (p < 0.05) higher in plants grown under eCO2 (at both I and II) after 90 or 120 days than in plants exposed to ambient CO2.
Sugar Content and Sucrose Metabolism-Related Enzyme Activities
Various sugar components and sucrose metabolism-related enzyme levels were determined in goji berry leaves and fruits grown under ambient and eCO2 for 90 and 120 days (Figures 3, 4). All four sugars under study – glucose, fructose, sucrose, and starch – followed a downward trend under eCO2. Glucose, fructose, and starch levels decreased significantly (p < 0.05) in leaves and fruits grown under elevated II eCO2 for 120 days (Figures 3A−C,E−G), whereas sucrose increased significantly (p < 0.05) in 90 day samples (Figures 3D,H) compared with plants under ambient CO2 conditions. The activity of all four sucrose metabolism-related enzymes – LBAI, LBSS, LBSPS, and LBNI – were also determined both at 90 and 120 days (Figure 4). These four enzymes showed an upward trend in leaves under eCO2, and this trend was significant (p < 0.05) under eCO2 II in 120 day samples (Figures 4A–D). However, compared with plants grown under ambient conditions, plants under eCO2 II showed significantly (p < 0.05) reduced LBSS and LBSPS activities and increased LBAI activity after 120 days.
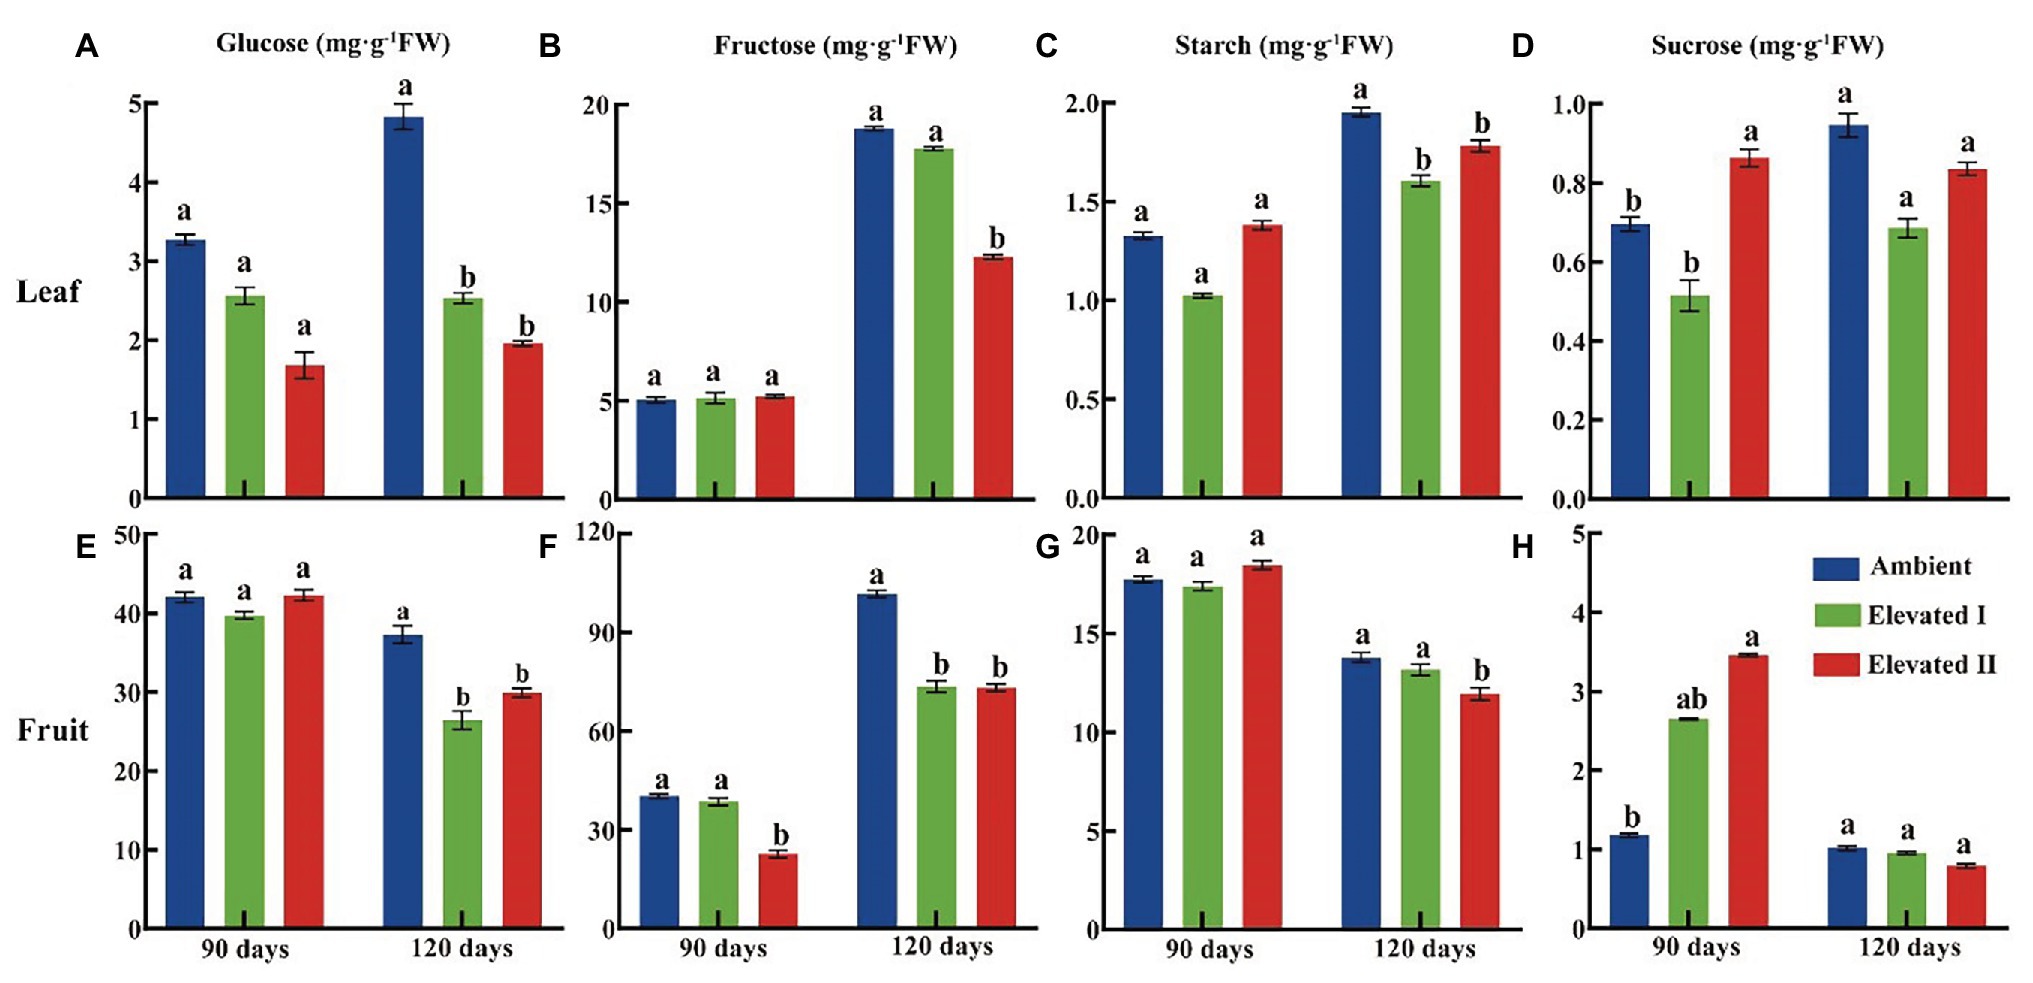
Figure 3. Glucose (A,E), fructose (B,F), starch (C,G), and sucrose (D,H) content in leaf and fruit under elevated and ambient CO2 for 90 and 120 days. Different lowercase letters indicate significant difference at p < 0.05. FW, Fresh weight.
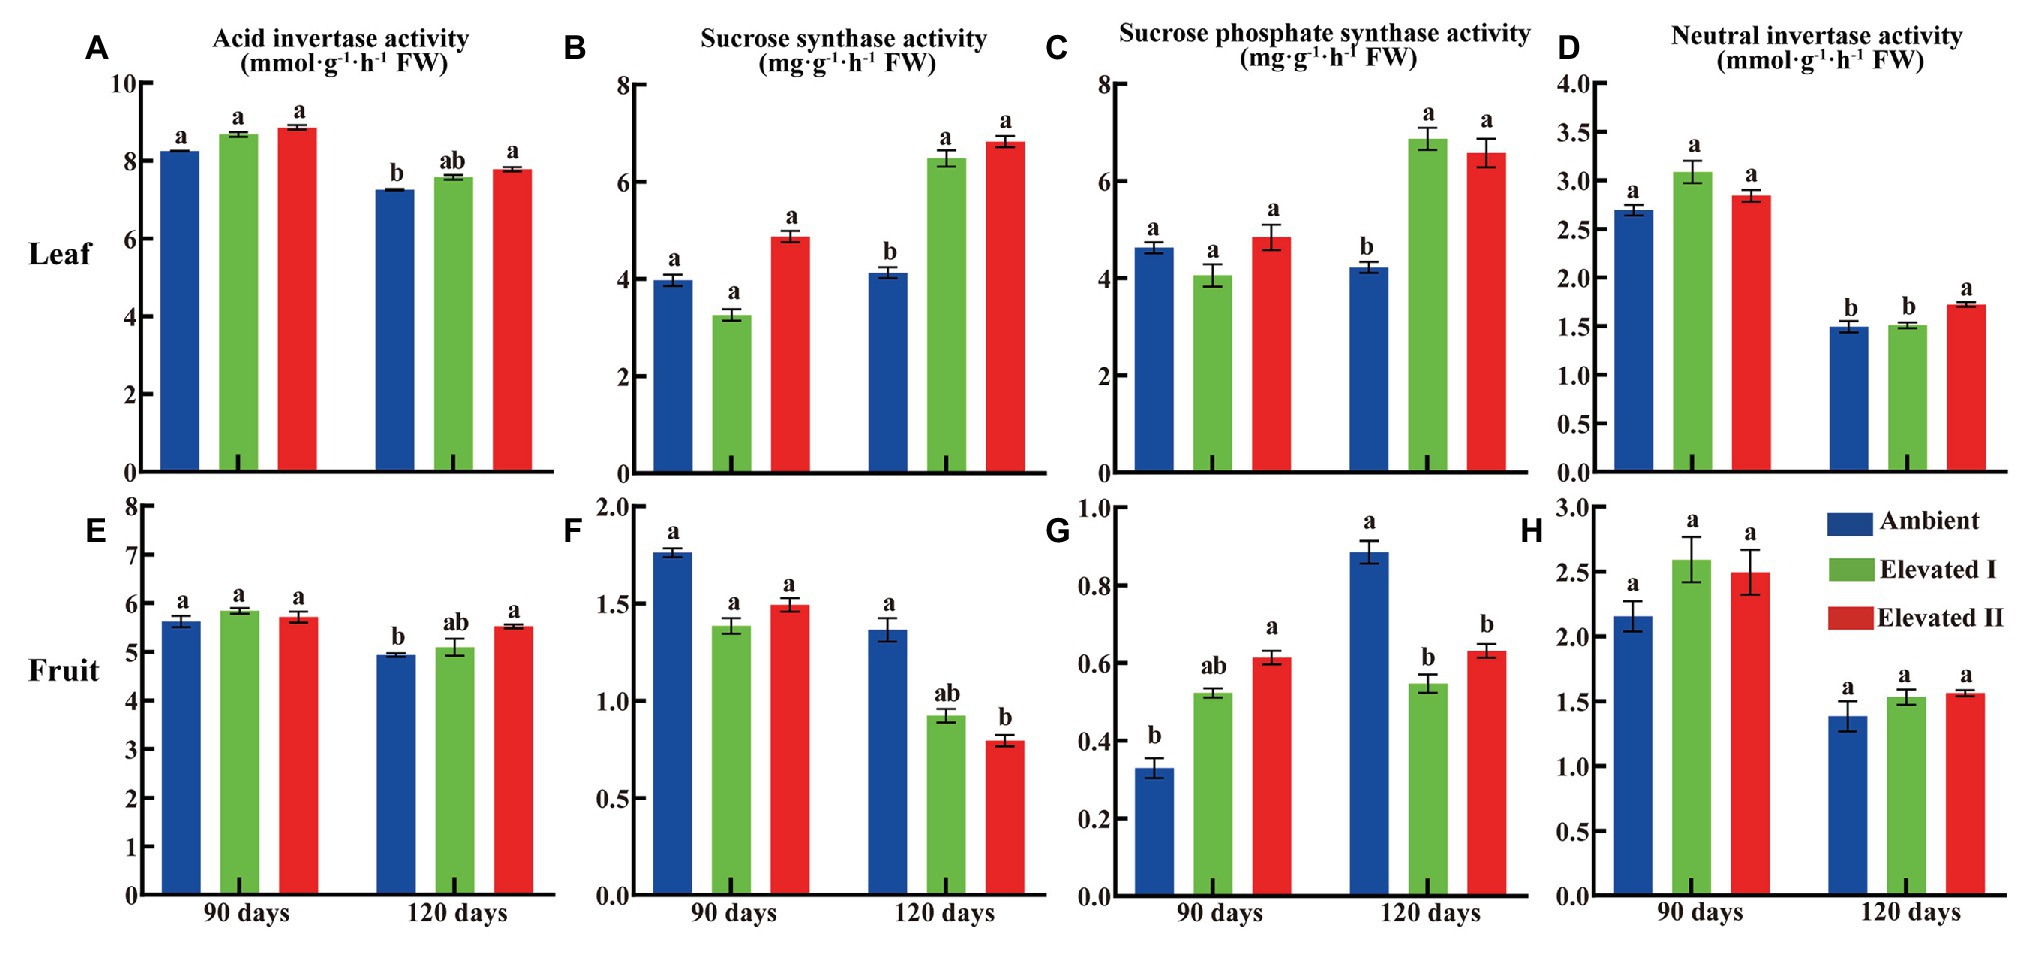
Figure 4. Activity of acid invertase (A,E), sucrose synthase (B,F), sucrose phosphate synthase (C,G), and neutral invertase (D,H) in leaf and fruit under elevated and ambient CO2 for 90 and 120 days. Different lowercase letters indicate significant difference at p < 0.05. FW, Fresh weight.
Correlation Between Sugar Content and Sucrose Metabolism-Related Enzyme Activities
Pearson correlation analysis was used to analyze the correlation between sugars in leaves and between sugars and enzymes in berries (Figure 5). A positive, significant (p < 0.05) correlation was observed between sucrose in leaves, and fructose (Pearson 0.677) and glucose (Pearson 0.683) in berries (Figure 5B); conversely, a strong (p < 0.01) negative correlation was detected between glucose in leaves and fructose (Pearson −0.901), glucose (Pearson −0.779), and sucrose (Pearson −0.730) in berries (Figure 5B). Furthermore, eCO2 enhanced a significant correlation between sugar and enzyme activities in fruit samples (Figures 5C,D). A positive, significant (p < 0.01) correlation was observed between LBAI and fructose (Pearson 0.758), LBAI and glucose (Pearson 0.874), LBNI and fructose (Pearson 0.882), LBNI and glucose (Pearson 0.901; Figure 5D); conversely, a significant negative correlation of LBAI and sucrose (p < 0.05, Pearson −0.689), LBNI and sucrose (p < 0.01, Pearson −0.868), LBSS with fructose (p < 0.01, Pearson −0.846), and sucrose (p < 0.05, Pearson −0.604) was observed in berries (Figure 5D).
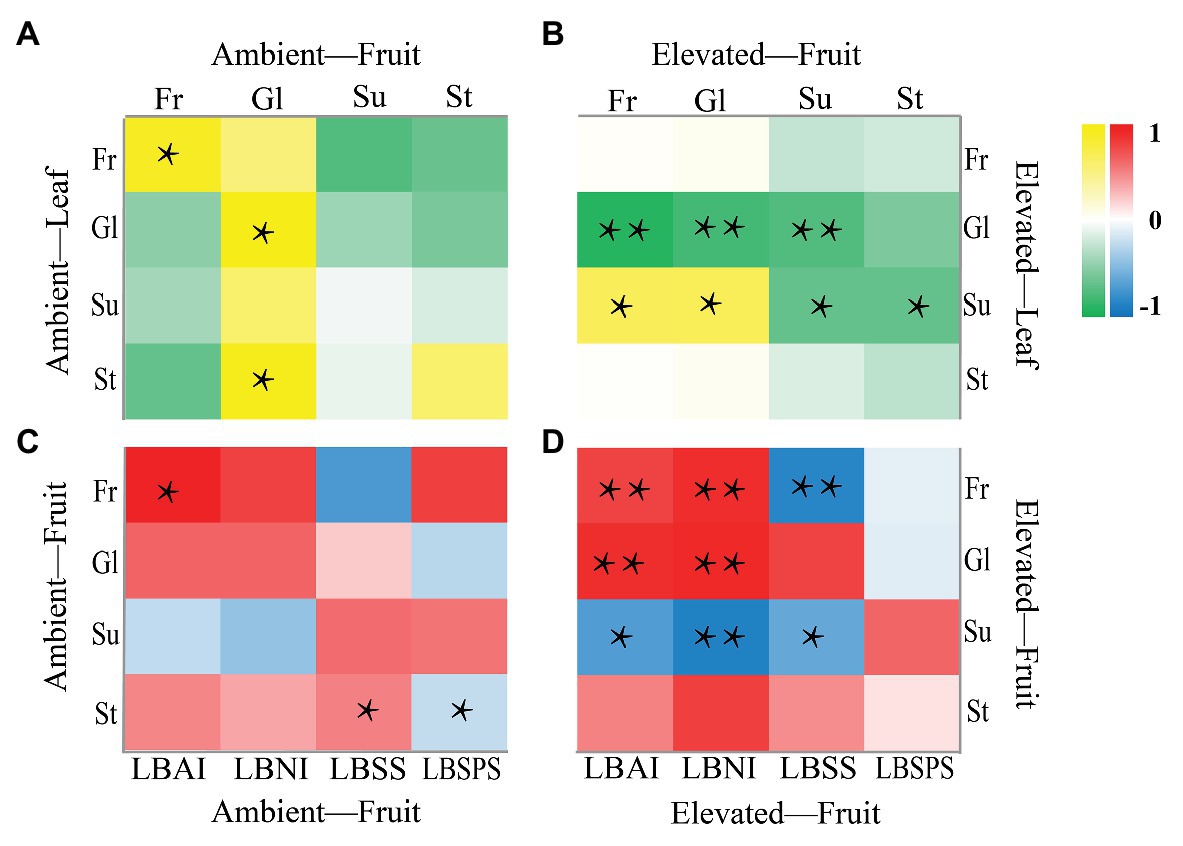
Figure 5. Correlation analysis of sugar in leaf and fruit (A,B) and sugar and enzyme in fruit (C,D). *p < 0.05, **p < 0.01.
Sucrose Metabolism-Related Gene Identity, Molecular Cloning, and Vector Construction and Transformation
The sequences of the four sucrose metabolism-related genes were based on a previous transcriptome profiling study of goji berry (Ma et al., 2019a). A BLAST search was performed via the NCBI database against the transcriptome database of goji berry, and sucrose metabolism-related genes LBAI, LBSS, LBSPS, and LBNI were identified. A 2,808-bp LBAI (GenBank accession no. MN718195) sequence from the transcriptome shared 99% (KM191309.1) and 92% (KC776575.1) homology with the published sequence of goji berry, while a 3,288-bp LBSS (GenBank accession no. MN718196) sequence shared 99% homology with the corresponding sequence (KC907702.1 and KM191310.1); in turn, a 3,612-bp LBSPS (GenBank accession no. MN718196) and a 3,842-bp LBNI (GenBank accession no. MN718198) shared 99% (KM191308.1) and 84% (KR026955) homology with the corresponding sequences, respectively.
We identified the sucrose metabolism-related genes LBAI, LBSS, LBSPS, and LBNI by designing a primer (Supplementary Table S2) to amplify the target gene ORF sequence (Figures 6A–D). Then, we constructed the pART-CAM-EGFP plasmid and verified it using double enzyme digestion and further sequencing (Figures 6E–H) to verify that the sequence alignment was in line with the sequences of LBAI, LBSS, LBSPS, and LBNI (Supplementary Figure S1). After sequence verification, the recombinant plasmid pART-CAM-EGFP was transformed into the Agrobacterium strain GV3101 and validated using colony PCR (Figures 6I–L).
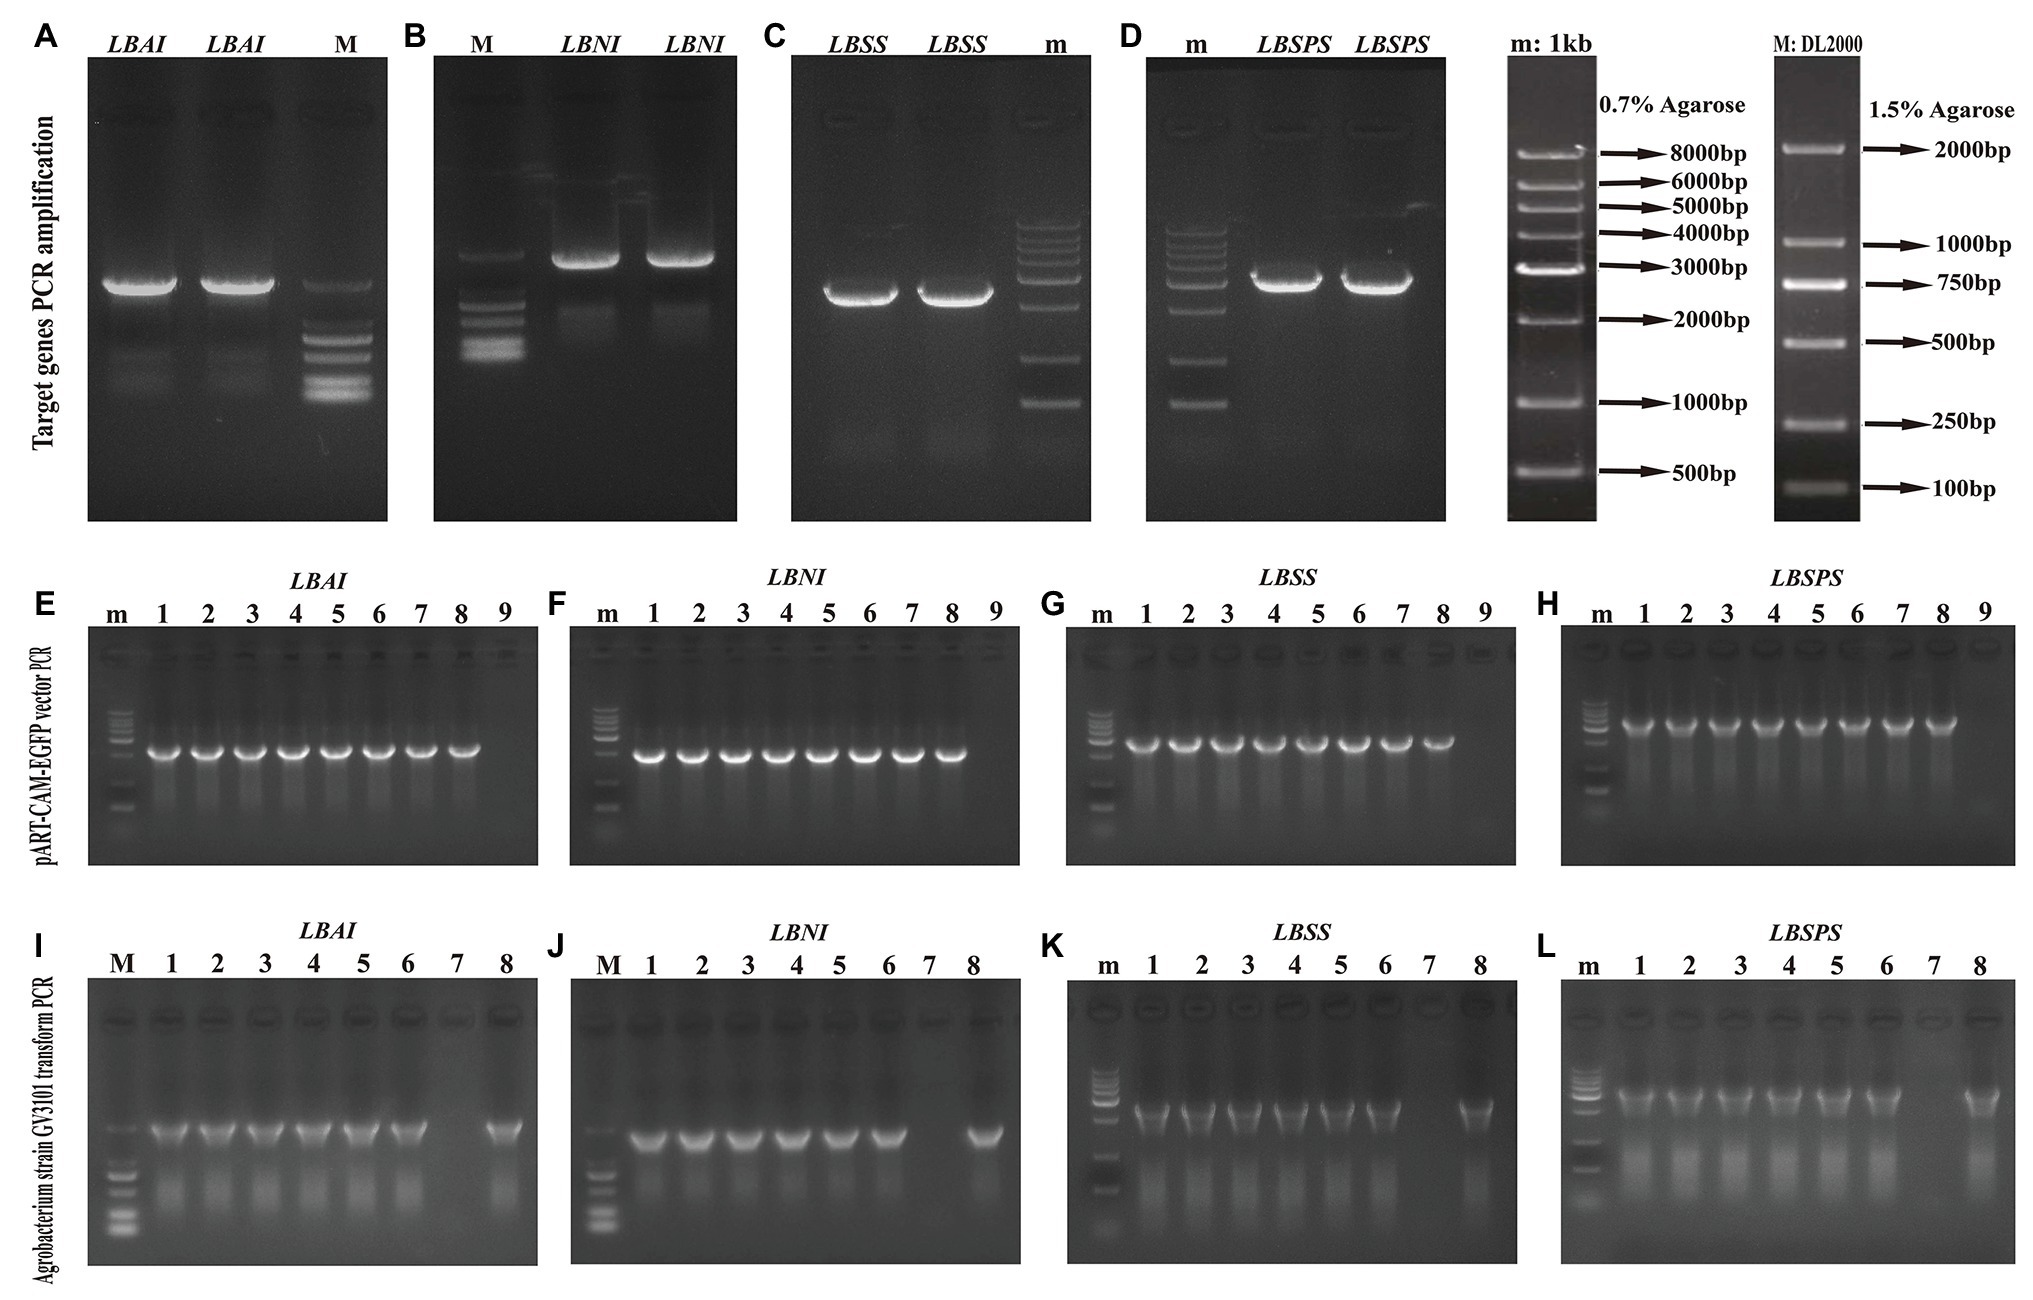
Figure 6. Target genes amplification (A–D), vector pART-CAM-EGFP PCR identification (E–H), Agrobacterium strain GV3101 transform PCR identification (I–L) of LBAI, LBSS, LBSPS, and LBNI, respectively. m: 0.7% agarose, 1 kb Marker; M: 1.5% agarose, DL2000 Marker; (E–H): 1–8: single colony of Escherichia coli strain, 9: ddH2O negative control; (I–L): 1–6: single colony of Agrobacterium strain, 7: ddH2O negative control, 8: plasmid pART-CAM-EGFP, positive control.
Sucrose Metabolism-Related Gene Characterization and Subcellular Localization
Sequence analysis showed that LBAI contains 1,920 bp from ORF, which codes for 639 amino acids. In addition, LBSS, LBSPS, and LBNI comprise 805, 1,060, and 331 amino acids coded for by 2,418, 3,183, and 996 bp from ORF, respectively. Protein sequence analysis demonstrated that LBAI and LBNI contain a conservative structure domain belonging to the glycosyl hydrolases (Glyco_hydro) family. Similarly, both LBSS and LBSPS have sucrose synthase (Sucrose_synth) and glycosyltransferase (Glycos_transf) family domains (Supplementary Table S1). The physicochemical properties of proteins, such as formula, molecular weight, theoretical pI, instability index, aliphatic index, and grand average hydropathicity, were analyzed and listed in Supplementary Table S1. Moreover, prediction of protein secondary and tertiary structures (Supplementary Figure S2) indicated that LBAI, LBSS, LBSPS, and LBNI are mainly composed of alpha-helix, random coils, and extended strands (Supplementary Table S1). Besides this, subcellular localization prediction disclosed that LBAI, LBSS, LBSPS, and LBNI have the highest possibility of being located in the plasma membrane, mitochondrial matrix space, nucleus, and cytoplasm (Supplementary Table S1). Analysis indicated that LBAI, LBSS, LBSPS, and LBNI are soluble and non-secretory proteins synthesized in the cytoplasm without protein translocation abilities. To validate this prediction, the fusion of GFP pART-CAM-EGFP plasmid constructs were generated and temporarily expressed in tobacco mesophyll cells to examine their subcellular localization. The tobacco epidermal cells that were transformed with an empty GFP vector displayed fluorescence throughout the cell. The green fluorescence was distributed in the cytoplasm, nucleus, and plasma membrane. Similar to the control group, LBAI-GFP, LBNI-GFP, and LBSS-GFP were all found to be present in the nucleus, plasma membrane, and cytoplasm (Figure 7). These findings were largely consistent with the predictions from above bioinformatics. However, the only difference was that LBSPS-GFP was detected in the plasma membrane (Figure 7).
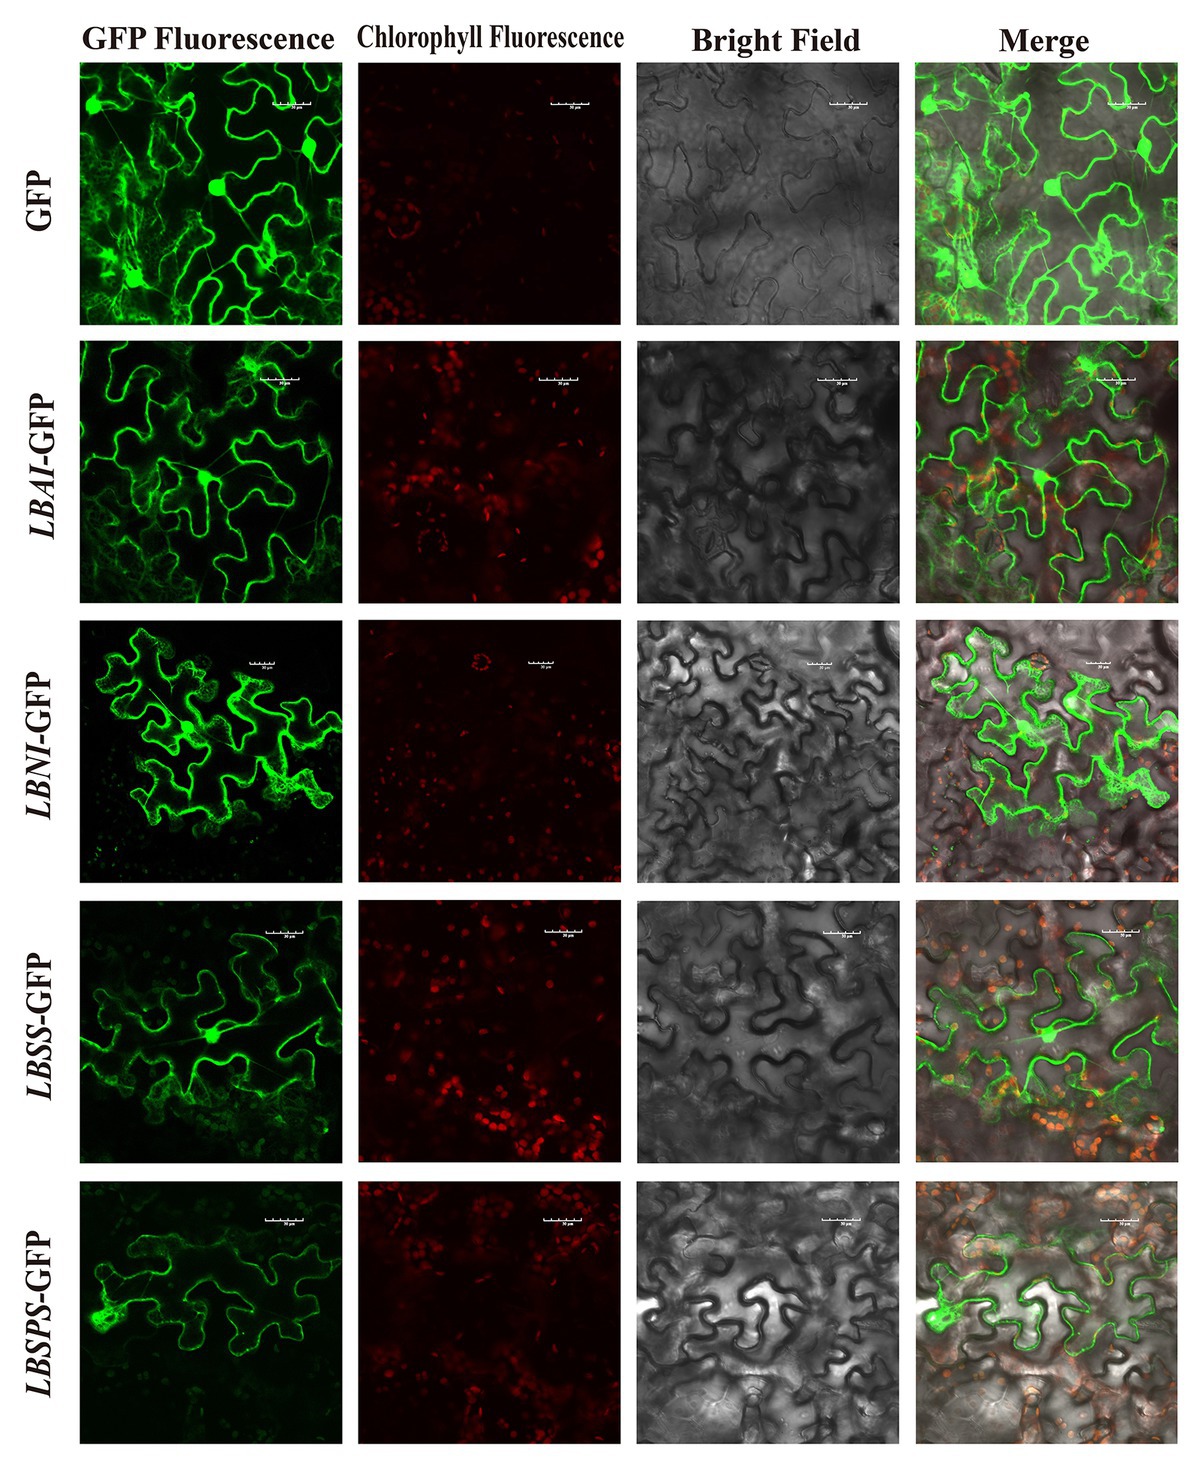
Figure 7. Subcellular localization of the LBAI, LBSS, LBSPS, and LBNI green fluorescent protein (GFP) in tobacco epidermal cells. GFP, transient expression of empty vector GFP; LBAI-GFP, transient expression of LBAI-GFP vector; LBNI-GFP, transient expression of LBNI-GFP vector; LBSS-GFP, transient expression of LBSS-GFP vector; LBSPS-GFP, transient expression of LBSPS-GFP vector.
Sucrose Metabolism-Related Gene Expression Patterns
Sucrose metabolism-related gene expression was analyzed using qRT-PCR in different tissues of plants grown under eCO2 conditions (Figure 8). LBAI, LBSS, LBSPS, and LBNI were expressed in all tissues used in the study (root, stem, leaf, and fruit tissues). LBAI expression increased (p < 0.05) in roots and stems after 90 days (elevated II) and in stems after 120 days (Figures 8A,C,D), whereas LBSS increased (p < 0.05) in leaf after 90 and 120 days and in fruit after 90 days (Figures 8E–G). Additionally, LBSPS increased (p < 0.05) in stem after 90 days (elevated II), as well as in root and stem (elevated II), and leaf (elevated I) tissues after 120 days (Figures 8B–D,F). Moreover, LBNI increased (p < 0.05) in the stem, and fruit (elevated II) tissues after 90 days and in fruit (elevated I) tissues after 120 days (Figures 8C,G,H).
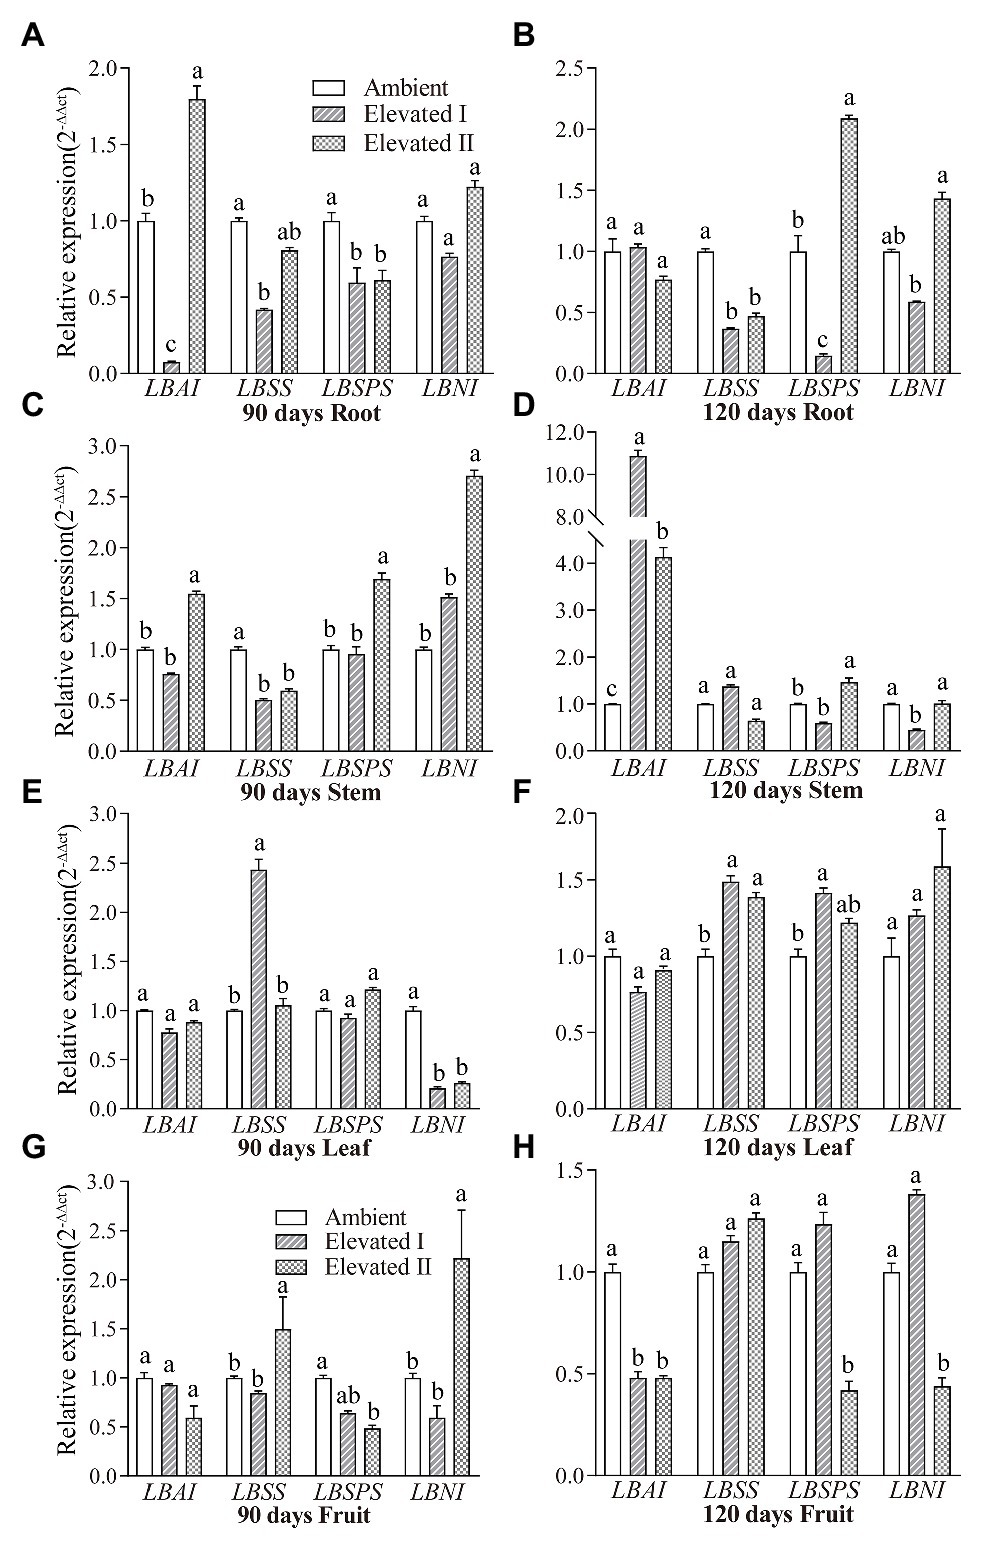
Figure 8. Expression patterns of gene LBAI, LBSS, LBSPS, and LBNI in root (A,B), stem (C,D), leaf (E,F), and fruit (G,H) under elevated and ambient CO2 for 90 and 120 days. Different lowercase letters indicate significant difference at p < 0.05.
Discussion
Previous studies showed that eCO2 had a remarkable impact on the growth and development of goji berry plants and on the accumulation of photosynthetic products (Cao et al., 2011; Guo et al., 2019). Long-term CO2 enrichment affected the allocation and accumulation of photosynthetic products in different organs. Based on observations on goji berry growing in OTCs over the entire growth period, eCO2 contributed to increasing vegetative growth, significantly increasing plant biomass and clearly changing fruit morphological traits (Ha et al., 2019). Additionally, compared to ambient CO2, eCO2 enhanced the photosynthetic capacity and reduced sugar and secondary metabolite levels; furthermore, long-term eCO2 treatment reduced sucrose synthesis and metabolism-related enzyme activity and affected the level of expression of genes involved in regulating sugar metabolism pathways (Liu et al., 2016; Ma et al., 2019a). However, although those studies revealed some physiological characteristics and molecular regulation mechanisms of goji berries under eCO2, to our knowledge, the study reported herein is the first one to focus on the relationship between different sugars and sucrose metabolism-related enzyme activities and the spatial-temporal expression pattern of the associated sucrose metabolism-related genes.
Previous studies found that short-term CO2 (30 or 60 days) treatments showed no significant differences in plant morphological and physiological characteristics (Cao et al., 2011; Hou and Cao, 2011; Liu et al., 2016; Guo et al., 2019; Ha et al., 2019). However, after 120 days, total sugars and carotenoid contents increased significantly, whereas flavone content decreased significantly. Transcriptome analysis of fruit has also shown that three genes play a key role in the regulation of four sugar metabolism pathways (Ma et al., 2019a). A previous study found that heights and ground-level diameters were significantly higher in plants grown in eCO2 compared to those grown in ambient conditions for 90 days. Additionally, fruit diameters and single fruit weights also significantly increased, whereas leaf areas increased after 60 days and were significantly different after 90 days (Ha et al., 2019). Hence, in our study, we chose to use 90 and 120 day CO2 treatments to further aid research in this field.
Physiological Response to eCO2
Atmospheric CO2 is the substrate for photosynthesis. Unsurprisingly, changes in CO2 concentrations usually directly affect photosynthetic production and growth. Indeed, a high CO2 concentration enhances plant biomass by promoting photosynthesis and, consequently, boosting carbon assimilation (Kull et al., 2003; Bergamaschi et al., 2018). The present study observed a significant increase in chlorophyll contents after 90 days in both eCO2 treatments compared to ambient conditions. Concomitantly, Pn, WUE, and Ci increased, whereas gs and Tr decreased in eCO2-treated goji berry plants. This effect was greater under the higher CO2 concentration, which is consistent with several studies. For example, a synchronous increase in Pn, Ci, and WUE was observed in Paris polyphylla cultivars under eCO2 concentrations (800 μmol mol−1), while gs and Tr remained unchanged (Qiang et al., 2020). Different Indica rice cultivars consistently show an increase in Pn under eCO2 treatments but show no significant variations in leaf chlorophyll contents during short-term eCO2 treatments (Fabre et al., 2020). Furthermore, a previous study found no difference in photosynthetic rates between Triodia pungens plants grown in ambient and eCO2 concentrations; in this case, eCO2 resulted in lower gs and Tr, improved WUE, and higher dry biomasses (Xian et al., 2020). However, studies have also shown that plants often show photosynthetic downregulation under long-term eCO2 exposure, while biomass production may change and even decrease due to species-specific responses to different treatment durations (Reich et al., 2018; Mehta et al., 2019). In C3 plants, eCO2 concentrations result in reduced rubisco concentrations, and both photosynthesis and photorespiration decrease to maintain substrate concentrations (Luo et al., 2009). Studies have shown a significant increase in chlorophyll content and photosynthetic rate in yellow poplar (Liriodendron tulipifera) treated with eCO2 for 4 months (Je et al., 2018). Similarly, in the present study, long-term eCO2 treatment increased chlorophyll contents and Pn, thereby enhancing the photosynthetic ability of goji berries and leading to a greater accumulation of photosynthetic products.
The warming effect of globally elevated CO2 is also of concern, as CO2 and temperature have been shown to have interactive effects on some crops (Xu et al., 2013; Dwivedi et al., 2017). Previous studies showed that the morphological and physiological characteristics of goji berries change significantly under the stress of elevated temperature and drought. Using OTCs to simulate an atmospheric temperature increase of 3.7°C above ambient temperatures, seedling heights, ground-level diameters, leaf fresh weights, leaf dry weights, and leaf areas of goji berry were found to increase significantly. After 60 and 90 days of treatment, net photosynthesis rates (Pn) had decreased, but after 120 days, it had increased. In terms of fruit quality under elevated CO2 concentration treatment, after 90 days, the contents of carotenoids and flavones decreased significantly, but after 120 days, flavone content had increased (Ma et al., 2019a).
Sugar Contents and Sucrose Metabolism-Related Enzyme Activities
Fruit and leaf glucose, fructose, starch, and sucrose contents decreased in the long-term eCO2 treatment in this study. Concomitantly, eCO2 affected sugar metabolism-related enzymes, increasing LBAI, LBSS, LBSPS, and LBNI in leaves while reducing LBSS and LBSPS in fruit tissues. Our previous work found that eCO2 reduces sugar and secondary metabolite levels (Cao et al., 2011; Ma et al., 2019a). Furthermore, we found that LBAI, LBSS, and LBSPS activities increase in fruit tissue after 90 days but decrease after 120 days of eCO2 treatment (Liu et al., 2016). Sucrose, glucose, and fructose synthesized in source tissues are the three major soluble sugars, sucrose is then transported to the sink tissues that contribute to total sugar content. Furthermore, these sugars essentially determine the number and quality of fruits produced (Tian, 2003; Basson et al., 2010). Sucrose metabolism-related enzymes including SS, SPS, NI, and AI, have all been found to play key roles in the assimilation and transport of sugars in plants (Zhang et al., 2012, 2019). SPS is involved in sucrose synthesis, while AI and NI are involved in sucrose decomposition, and SS catalyzes either sucrose synthesis or catabolism (Liu et al., 2011).
In this study, LBAI, LBSS, LBSPS, and LBNI activities tended to increase in leaves collected after 90 days of treatment, although no significant differences relative to those of the control were observed. Similar results were observed in fruit tissues, except that LBSPS increased significantly in this case. LBSS and LBSPS play a pivotal role in sucrose biosynthesis and transport, and LBSPS activity increases in leaves under eCO2, thereby causing increased leaf sucrose contents (Hussain et al., 1999; Moore et al., 1999). However, after 120 days under eCO2, the activities of the above-mentioned four sucrose metabolism-related enzymes increased significantly in leaves, whereas in fruit tissues, LBSS and LBSPS decreased significantly. Simultaneously, LBAI increased and LBNI showed no change.
Sucrose and starch are the major end products of photosynthesis in most plants and they are also major carbon sources involved in the synthesis of other important structural and metabolic compounds, such as cellulose and proteins (Annunziata et al., 2017; Xie et al., 2018; Ma et al., 2019a). Additionally, only two types of enzymes can cleave sucrose in plants: sucrose invertase, and sucrose synthase (SS; Lugassi et al., 2015).
The leaf is the main photosynthetic organ and the products of leaf photosynthesis are transported to sink organs mainly as sucrose. Furthermore, sucrose metabolism-related enzymes are the key enzymes facilitating the entry of sucrose into several metabolic pathways (Zhang et al., 2017). As eCO2 significantly affects enzyme activity, it, therefore, affects many metabolic processes, including photosynthesis, and nutrient uptake and assimilation (Hofmann et al., 2013). In this study, the activities of LBAI and LBNI in fruit and leaf tissues were similar to those in plants under either ambient or eCO2 conditions, while sucrose contents and LBSPS activities significantly increased in fruits after 90 days of eCO2 treatment. This indicates that the short-term eCO2 treatment increased LBSPS enzyme activity and, thus, facilitated sucrose accumulation in this organ. However, long-term eCO2 exposure reduced SS and SPS activities in fruits and leaves, while starch and sucrose contents increased in leaves and decreased in fruits, compared to those with the short-term treatment. These results clearly indicate that long-term eCO2 conditions are not conducive to sugar accumulation in goji berry fruit. Similar results were also observed in goji berry fruits under 120 days elevated CO2 treatment, where the content of polysaccharides and fructose was significantly reduced (Ha et al., 2019). As global warming intensifies, goji berry may suffer negative impacts. Breeding goji berry varieties that show good tolerances to elevated CO2 and temperatures are important for coping with climate change in the future.
Correlations between the contents of different kinds of sugars and the four sucrose metabolism-related enzymes in leaf and fruit tissues were further analyzed under ambient and eCO2 conditions. Similar studies have found significant positive correlations between fructose and LBAI in goji berry leaves and fruits (Zheng et al., 2009; Wang et al., 2014). Furthermore, several studies have also shown that LBSPS activity is negatively correlated with starch and positively correlated with sucrose in fruits (Wang et al., 2004; Zhang et al., 2004).
Regulation and Function of Sucrose Metabolism-Related Genes
An early study determined that four sucrose metabolism enzymes (AI, NI, SS, and SPS) work together to balance sugar transport and deposition or utilization in citrus fruits (Lowell et al., 1989). A study also confirmed the effects of different sucrose metabolism-related enzymes on the accumulation of different sugars during tomato fruit development (Miron and Schaffer, 1991). Several recent studies have reported the activities and expression patterns of sucrose metabolism-related enzymes in different species. As shown by a study on pineapples, SPS and SS activities, and gene transcript levels gradually increased, while NI decreased during pineapple fruit development (Zhang et al., 2019). Another study also showed that homologous cloning of SPS and NI genes and transcription expression analysis of SPS, SS, and NI indicate that there are distinct patterns related to sugar accumulation and composition in pineapple fruits (Zhang et al., 2012).
Recent studies have described the effects of the expression and regulation of the sucrose metabolism-related enzyme genes LBAI, LBSS, LBSPS, and LBNI on sugar accumulation in goji berries. However, the mechanism underlying plant regulation of sugar metabolism in fruits during acclimation to eCO2 conditions remains unknown. The enzymes LBAI, LBSS and LBSPS are closely related to the sugar synthesis in goji berry and mainly involvement in starch and sugar metabolism pathways (Ma et al., 2019a, 2021), the genes LBAI, LBSS, LBSPS, and LBNI are expressed in different tissues and are involved in important sugar synthesis and regulation pathways influencing enzymes and metabolism. Our study identified and isolated four sucrose metabolism-related genes – LBAI, LBSS, LBSPS, and LBNI – based on the de novo transcriptome of goji berry (Ma et al., 2019a). BLAST searches indicated that the sequences of these genes had high homology with reported sequences for goji berry (Wang et al., 2019). In addition, subcellular localization analysis revealed that LBAI, LBNI, and LBSS were predominantly located in the nucleus, plasma membrane, and cytoplasm, while LBSPS was localized in the plasma membrane. Previous studies have reported that in goji berry, AI was localized in vacuoles (Wang et al., 2014), SPS in the nucleus (Wang et al., 2013), and NI in the cytoplasm (Wang et al., 2019), but these analyses were based on bioinformatics. In this study, the expression position of the sucrose metabolism-related gene protein was determined by predicting and further verifying the transient transformation of tobacco. Differential expression patterns among roots, stems, leaves, and fruits under different CO2 conditions revealed that the genes have diverse spatiotemporal expression patterns. At least one study found that SPS and NI expression levels correlated with their corresponding enzyme activities during goji berry fruit development, whereas those of AI and SS were not related to changes in enzyme activities in different cultivars (Wang et al., 2019). Our data further demonstrates that these four sucrose metabolism-related genes play an important role in sugar metabolism in goji berry plants. Further development of cultivars that can regulate sugar metabolism through molecular breeding methods is needed.
Conclusion
This study confirmed that chlorophyll, photosynthesis, various sugars, and related enzyme activities in goji berry leaves and fruits were significantly affected by eCO2 after 90 and 120 days. Additionally, LBAI, LBSS, LBSPS, and LBNI were identified based on transcriptome profiling and the analysis of characteristic, subcellar locations, and expression patterns. Protein sequence analysis indicated that LBAI and LBNI contain a Glyco_hydro family conservative structure domain, and both LBSS and LBSPS have Sucrose_synth and Glycos_transf family domains. In addition, subcellular localization analysis found all three genes (LBAI, LBNI, and LBSS) in the nucleus, plasma membrane, and cytoplasm, while LBSPS was found in the plasma membrane. The four genes were expressed in all examined tissues treated with eCO2, including roots, stems, leaves, and fruits. Our results provide a sound theoretical basis for understanding sugar metabolism responses to changes in CO2 concentrations and provide candidate genes for the future breeding of goji berry plants containing high sugar and secondary metabolites materials.
Data Availability Statement
The datasets presented in this study can be found in online repositories. The names of the repository/repositories and accession number(s) can be found at: https://www.ncbi.nlm.nih.gov/genbank/, MN718195; https://www.ncbi.nlm.nih.gov/genbank/, MN718196; https://www.ncbi.nlm.nih.gov/genbank/, MN718197; and https://www.ncbi.nlm.nih.gov/genbank/, MN718198.
Author Contributions
BC and LS designed the experiments. YM, YX, and RH performed the experiments. YM analyzed the data and drafted the manuscript. BC revised the manuscript. All authors contributed to the article and approved the submitted version.
Funding
This research was funded by the National Natural Science Foundation of China, grant numbers 31660199 and 31160172.
Conflict of Interest
The authors declare that the research was conducted in the absence of any commercial or financial relationships that could be construed as a potential conflict of interest.
Acknowledgments
We would like to thank the support from School of Agriculture and Experimental Farm of Ningxia University.
Supplementary Material
The Supplementary Material for this article can be found online at: https://www.frontiersin.org/articles/10.3389/fpls.2021.643555/full#supplementary-material
Footnotes
1. https://www.ncbi.nlm.nih.gov/genbank
2. https://web.expasy.org/protparam/
3. http://www.ncbi.nlm.nih.gov/gorf/gorf.html
4. http://www.cbs.dtu.dk/services/SignalP/
References
Amagase, H., and Farnsworth, N. R. (2011). A review of botanical characteristics, phytochemistry, clinical relevance in efficacy and safety of Lycium barbarum fruit (Goji). Int. Food Res. J. 44, 1702–1717. doi: 10.1016/j.foodres.2011.03.027
Annunziata, M. G., Apelt, F., Carillo, P., Krause, U., Feil, R., Mengin, V., et al. (2017). Getting back to nature: a reality check for experiments in controlled environments. J. Exp. Bot. 68, 4463–4477. doi: 10.1093/jxb/erx220
Basson, C., Groenewald, J., Kossmann, J., Cronjé, C., and Bauer, R. (2010). Sugar and acid-related quality attributes and enzyme activities in strawberry fruits: Invertase is the main sucrose hydrolysing enzyme. Food Chem. 121, 1156–1162. doi: 10.1016/j.foodchem.2010.01.064
Benson, D. A., Cavanaugh, M., Clark, K., Karsch-Mizrachi, I., Lipman, D. J., Ostell, J., et al. (2012). GenBank. Nucleic Acids Res. 41, D36–D42. doi: 10.1093/nar/gks1195
Bergamaschi, P., Danila, A., Weiss, R., Ciais, P., Thompson, R., Brunner, D., et al. (2018). Atmospheric monitoring and inverse modelling for verification of greenhouse gas inventories. Luxembourg: Publications Office of the European Union.
Byambasuren, S.-E., Wang, J., and Gaudel, G. (2019). Medicinal value of wolfberry (Lycium barbarum L.). J. Med. Plants Stud. 7, 90–97.
Cao, B., Song, P., Kang, J., Hou, J., and Song, L. (2011). Effect of elevated CO2 concentration on growth in Lycium barbarum. Sci. Silvae Sin. 47, 193–198. doi: 10.11707/j.1001-7488.20110730
Dwivedi, S., Kumar, S., Kumar, R., Prakash, V., Rao, K., Samal, S., et al. (2017). Interactive effect of elevated CO2 and temperature on the incidence of brown spot and sheath blight of rice (Oryza sativa L.). Int. J. Curr. Microbiol. App. Sci. 6, 195–202. doi: 10.20546/ijcmas.2017.604.023
Fabre, D., Dingkuhn, M., Yin, X., Clément Vidal, A., Roques, S., Soutiras, A., et al. (2020). Genotypic variation in source and sink traits affects the response of photosynthesis and growth to elevated atmospheric CO2. Plant Cell Environ. 43, 579–593. doi: 10.1111/pce.13693
Guo, F., Ha, R., Ma, Y., and Cao, B. (2019). Effects of elevated CO2 concentration on photosynthesis characteristics and biomass allocation of Lycium barbarum seedlings. Acta Bot. Boreal. Occident. Sin. 39, 302–309.
Ha, R., Ma, Y., Cao, B., Guo, F., and Song, L. (2019). Effects of simulated elevated CO2 concentration on vegetative growth and fruit quality in Lycium barbarum. Sci. Silvae Sin. 55, 28–36. doi: 10.11707/j.1001-7488.20190604
Hofmann, L. C., Straub, S., and Bischof, K. (2013). Elevated CO2 levels affect the activity of nitrate reductase and carbonic anhydrase in the calcifying rhodophyte Corallina officinalis. J. Exp. Bot. 64, 899–908. doi: 10.1093/jxb/ers369
Hou, J., and Cao, B. (2011). Effect of elevated CO2 concentration on carbon and nitrogen allocation in Lycium barbarum. J. Northwest For. Univ. 39, 75–77. doi: 10.13759/j.cnki.dlxb.2011.09.017
Hussain, M., Allen, L. Jr., and Bowes, G. (1999). Up-regulation of sucrose phosphate synthase in rice grown under elevated CO2 and temperature. Photosynth. Res. 60, 199–208. doi: 10.1023/A:1006242001390
IPCC (2014). Climate change 2013: The physical science basis: Working group I contribution to the fifth assessment report of the intergovernmental panel on climate change. New York: Cambridge University Press.
Je, S., Woo, S., Lee, S., Kwak, M., Lee, T., and Kim, S. (2018). Combined effect of elevated CO2 concentration and drought on the photosynthetic apparatus and leaf morphology traits in seedlings of yellow poplar. Ecol. Res. 33, 403–412. doi: 10.1007/s11284-017-1495-7
Kadiyala, M., Nedumaran, S., Singh, P., Chukka, S., Irshad, M. A., and Bantilan, M. (2015). An integrated crop model and GIS decision support system for assisting agronomic decision making under climate change. Sci. Total Environ. 521, 123–134. doi: 10.1016/j.scitotenv.2015.03.097
Kull, O., Tulva, I., and Vapaavuori, E. (2003). Influence of elevated CO2 and O3 on Betula pendula Roth crown structure. Ann. Bot. 91, 559–569. doi: 10.1093/aob/mcg052
Kwok, S., Bu, Y., Lo, A. C., Chan, T. C., So, K. F., and Lai, J. S. (2019). A systematic review of potential therapeutic use of Lycium barbarum polysaccharides in disease. Biomed. Res. Int. 2019:4615745. doi: 10.1155/2019/4615745
Leontopoulos, S., Skenderidis, P., Anatolioti, V., Kokkora, M., Tsilfoglou, S., Petrotos, K., et al. (2017a). Antifungal activity of Azadirachta indica aqueous and non-aqueous extracts on Colletotrichum gloeosporioides, Botryodiplodia theobromae and Fusarium solani. A first approach. Int. J. Food Eng. 6, 38–50.
Leontopoulos, S., Skenderidis, P., Kalorizou, H., and Petrotos, K. (2017b). Bioactivity potential of polyphenolic compounds in human health and their effectiveness against various food borne and plant pathogens. A review. J. Food Biosyst. Eng. 7, 1–19.
Leyva, A., Quintana, A., Sánchez, M., Rodríguez, E. N., Cremata, J., and Sánchez, J. C. (2008). Rapid and sensitive anthrone-sulfuric acid assay in microplate format to quantify carbohydrate in biopharmaceutical products: method development and validation. Biologicals 36, 134–141. doi: 10.1016/j.biologicals.2007.09.001
Li, N., Zhang, S., Zhao, Y., Li, B., and Zhang, J. (2011). Over-expression of AGPase genes enhances seed weight and starch content in transgenic maize. Planta 233, 241–250. doi: 10.1007/s00425-010-1296-5
Liu, Y., Qi, H., Bai, C., Qi, M., Xu, C., Hao, J., et al. (2011). Grafting helps improve photosynthesis and carbohydrate metabolism in leaves of muskmelon. J. Biol. Sci. 7:1161. doi: 10.7150/ijbs.7.1161
Liu, Y., Zhang, Y., and Cao, B. (2016). Effects of hight atmospheric CO2 concentrations on activities of sucrose metabolism-related enzymes in Lycium barbarum fruit. J. Northwest For. Univ. 31, 44–47. doi: 10.3969/j.issn.1001-7461.2016.04.08
Livak, K. J., and Schmittgen, T. D. (2001). Analysis of relative gene expression data using real-time quantitative PCR and the 2−ΔΔCT method. Methods 25, 402–408. doi: 10.1006/meth.2001.1262
Lowell, C. A., Tomlinson, P. T., and Koch, K. E. (1989). Sucrose-metabolizing enzymes in transport tissues and adjacent sink structures in developing citrus fruit. Plant Physiol. 90, 1394–1402. doi: 10.1104/pp.90.4.1394
Lugassi, N., Kelly, G., Fidel, L., Yaniv, Y., Attia, Z., Levi, A., et al. (2015). Expression of Arabidopsis hexokinase in citrus guard cells controls stomatal aperture and reduces transpiration. Front. Plant Sci. 6:1114. doi: 10.3389/fpls.2015.01114
Luo, R., Wei, H., Ye, L., Wang, K., Chen, F., Luo, L., et al. (2009). Photosynthetic metabolism of C3 plants shows highly cooperative regulation under changing environments: a systems biological analysis. Proc. Natl. Acad. Sci. U. S. A. 106, 847–852. doi: 10.1073/pnas.0810731105
Ma, Y., Cao, B., Song, L., Ha, R., Jia, H., and Liu, K. (2020). Gas saving type control system of top-open gas simulation chamber and its control method. Invention patent ZL201711003932.1. 2020.10.27.
Ma, Y., Devi, M. J., Reddy, V. R., Song, L., Gao, H., and Cao, B. (2021). Cloning and characterization of three sugar metabolism genes (LBGAE, LBGALA, and LBMS) regulated in response to elevated CO2 in Goji berry (Lycium barbarum L.). Plants 10:321. doi: 10.3390/plants10020321
Ma, Y., Reddy, V. R., Devi, M. J., Song, L., and Cao, B. (2019a). De novo characterization of the Goji berry (Lycium barbarium L.) fruit transcriptome and analysis of candidate genes involved in sugar metabolism under different CO2 concentrations. Tree Physiol. 39, 1032–1045. doi: 10.1093/treephys/tpz014
Ma, Y., Wang, N., Jia, H., and Cao, B. (2019b). Evaluation of a modified open-top chamber simulation system on the study of elevated CO2 concentration effects. J. Earth Environ. 10, 307–315. doi: 10.7515/JEE182070
Mehta, K., Jaiswal, D., Nayak, M., Prasannan, C. B., Wangikar, P. P., and Srivastava, S. (2019). Elevated carbon dioxide levels lead to proteome-wide alterations for optimal growth of a fast-growing cyanobacterium, Synechococcus elongatus PCC 11801. Sci. Rep. 9, 1–14. doi: 10.1038/s41598-019-42576-1
Miron, D., and Schaffer, A. A. (1991). Sucrose phosphate synthase, sucrose synthase, and invertase activities in developing fruit of Lycopersicon esculentum Mill. and the sucrose accumulating Lycopersicon hirsutum Humb. and Bonpl. Plant Physiol. 95, 623–627. doi: 10.1104/pp.95.2.623
Moore, B., Cheng, S., Sims, D., and Seemann, J. (1999). The biochemical and molecular basis for photosynthetic acclimation to elevated atmospheric CO2. Plant Cell Environ. 22, 567–582. doi: 10.1046/j.1365-3040.1999.00432.x
Morgulis, A., Coulouris, G., Raytselis, Y., Madden, T. L., Agarwala, R., and Schäffer, A. A. (2008). Database indexing for production MegaBLAST searches. Bioinformatics 24, 1757–1764. doi: 10.1093/bioinformatics/btn322
Pedro, A. C., Maurer, J. B. B., Zawadzki-Baggio, S. F., Ávila, S., Maciel, G. M., and Haminiuk, C. W. I. (2018). Bioactive compounds of organic goji berry (Lycium barbarum L.) prevents oxidative deterioration of soybean oil. Ind. Crop. Prod. 112, 90–97. doi: 10.1016/j.indcrop.2017.10.052
Pereira, C., Locatelli, M., Innosa, D., Cacciagrano, F., Polesná, L., Santos, T., et al. (2019). Unravelling the potential of the medicinal halophyte Eryngium maritimum L.: in vitro inhibition of diabetes-related enzymes, antioxidant potential, polyphenolic profile and mineral composition. S. Afr. J. Bot. 120, 204–212. doi: 10.1016/j.sajb.2018.06.013
Qiang, Q., Gao, Y., Yu, B., Wang, M., Ni, W., Li, S., et al. (2020). Elevated CO2 enhances growth and differentially affects saponin content in Paris polyphylla var. yunnanensis. Ind. Crop. Prod. 147:112124. doi: 10.1016/j.indcrop.2020.112124
Reich, P. B., Hobbie, S. E., Lee, T. D., and Pastore, M. A. (2018). Unexpected reversal of C3 versus C4 grass response to elevated CO2 during a 20-year field experiment. Science 360, 317–320. doi: 10.1126/science.aas9313
Soba, D., Ben Mariem, S., Fuertes-Mendizábal, T., Méndez-Espinoza, A. M., Gilard, F., González-Murua, C., et al. (2019). Metabolic effects of elevated CO2 on wheat grain development and composition. J. Agric. Food Chem. 67, 8441–8451. doi: 10.1021/acs.jafc.9b01594
Tian, G. (2003). Study on structure and bioactivity of glycoconjugate compounds of Fructus lycii. World Sci. Techonol. Moder. Tradit. Chin. Med. 5, 22–30. doi: 10.3969/j.issn.1674-3849.2003.04.005
Wang, L., Ding, X., Wang, Y., and Li, X. (2013). Cloning and tissue expression analysis of sucrose phosphate synthase gene from Lycium barbarum L. Acta Bot. Boreal. Occident. Sin. 33, 1516–1520.
Wang, L., Xia, R., and Zhou, K. (2004). Study on the sugar accumulation process of Newhall navel orange and changes of activities of sucrose-metabolizing enzymes. J. Fruit Sci. 21, 220–223. doi: 10.3969/j.issn.1009-9980.2004.03.008
Wang, L., Zhao, H., Wang, Y., Ding, X., and Ma, J. (2014). Cloning and tissues expression analysis of soluble acid invertase gene from Lycium barbarum L. North. Hort. 86–90.
Wang, T., Wright, D., Xu, H., Yang, Y., Zheng, R., Shi, J., et al. (2019). Expression patterns, activities and sugar metabolism regulation of sucrose phosphate synthase, sucrose synthase, neutral invertase and soluble acid invertase in different Goji cultivars during fruit development. Russ. J. Plant Physiol. 66, 29–40. doi: 10.1134/S1021443719010199
Wang, Y., Chen, H., Wu, M., Zeng, S., Liu, Y., and Dong, J. (2015). Chemical and genetic diversity of wolfberry. Dordrecht: Springer.
Wei, Z., Du, T., Li, X., Fang, L., and Liu, F. (2018). Interactive effects of elevated CO2 and N fertilization on yield and quality of tomato grown under reduced irrigation regimes. Front. Plant Sci. 9:328. doi: 10.3389/fpls.2018.00328
Xian, L., Schmidt, S., Dreccer, F., and Memmott, P. (2020). “Photosynthetic and Growth Response of Triodia pungens to Elevated CO2 Concentration,” in Proceedings of the 22nd International Grassland Congress, University of Kentucky: UKnowledge; September 15–19, 2020; 1340–1342.
Xie, Y., Xu, L., Wang, Y., Fan, L., Chen, Y., Tang, M., et al. (2018). Comparative proteomic analysis provides insight into a complex regulatory network of taproot formation in radish (Raphanus sativus L.). Hortic. Res. 5, 1–14. doi: 10.1038/s41438-018-0057-7
Xu, Z., Shimizu, H., Yagasaki, Y., Ito, S., Zheng, Y., and Zhou, G. (2013). Interactive effects of elevated CO2, drought, and warming on plants. J. Plant Growth Regul. 32, 692–707. doi: 10.1007/s00344-013-9337-5
Yao, R., Heinrich, M., and Weckerle, C. S. (2018). The genus Lycium as food and medicine: a botanical, ethnobotanical and historical review. J. Ethnopharmacol. 212, 50–66. doi: 10.1016/j.jep.2017.10.010
Zhang, X., Liu, S., Du, L., Yao, Y., and Wu, J. (2019). Activities, transcript levels, and subcellular localizations of sucrose phosphate synthase, sucrose synthase, and neutral invertase and change in sucrose content during fruit development in pineapple (Ananas comosus). J. Hortic. Sci. Biotechnol. 94, 573–579. doi: 10.1080/14620316.2019.1604169
Zhang, X., Wang, W., Du, L., Xie, J., Yao, Y., and Sun, G. (2012). Expression patterns, activities and carbohydrate-metabolizing regulation of sucrose phosphate synthase, sucrose synthase and neutral invertase in pineapple fruit during development and ripening. Int. J. Mol. Sci. 13, 9460–9477. doi: 10.3390/ijms13089460
Zhang, Y., Chen, K., Zhang, S., and Wang, J. (2004). Sugar metabolism and its regulation in postharvest ripening kiwifruit. J. Plant Physiol. Mol. Biol. 30, 317–324.
Zhang, Y., Pan, J., Huang, X., Guo, D., Lou, H., Hou, Z., et al. (2017). Differential effects of a post-anthesis heat stress on wheat (Triticum aestivum L.) grain proteome determined by iTRAQ. Sci. Rep. 7, 1–11. doi: 10.1038/s41598-017-03860-0
Zhao, J., Li, H., Yin, Y., An, W., Wang, H., Wang, Y., et al. (2015a). Cloning and expression of acid invertase gene (LBAI) in wolfberry (Lycium barbarum L.). Jiangsu J. Agr. Sci. 31, 1140–1148. doi: 10.3969/j.issn.1000-4440.2015.05.031
Zhao, Q., Pan, J., and Cao, B. (2015b). Effects of elevated temperature and drought stress on photosynthesis of Lycium barbarum. Acta Ecol. Sin. 35, 6016–6022. doi: 10.5846/stxb201401090073
Zhao, X., Guo, S., Yan, H., Lu, Y. Y., Zhang, F., Qian, D., et al. (2019). Analysis of phenolic acids and flavonoids in leaves of Lycium barbarum from different habitats by ultra-high-performance liquid chromatography coupled with triple quadrupole tandem mass spectrometry. Biomed. Chromatogr. 33:e4552. doi: 10.1002/bmc.4552
Zheng, G., Luo, X., Mai, L., and Wang, J. (2009). Study on physiological reason for difference of sugar accumulation in different Lycium barbarum varieties. J. Agric. Sci. 30, 1–4. doi: 10.3969/j.issn.1673-0747.2009.01.001
Keywords: Lycium barbarum L., photosynthesis, sucrose metabolism-related enzymes, subcellular localization, gene expression patterns
Citation: Ma Y, Xie Y, Ha R, Cao B and Song L (2021) Effects of Elevated CO2 on Photosynthetic Accumulation, Sucrose Metabolism-Related Enzymes, and Genes Identification in Goji Berry (Lycium barbarum L.). Front. Plant Sci. 12:643555. doi: 10.3389/fpls.2021.643555
Edited by:
Sergio Tombesi, Catholic University of the Sacred Heart, ItalyReviewed by:
Tse-Min Lee, National Sun Yat-sen University, TaiwanAnthony Guihur, University of Lausanne, Switzerland
Gerhard Fischer, National University of Colombia, Colombia
Copyright © 2021 Ma, Xie, Ha, Cao and Song. This is an open-access article distributed under the terms of the Creative Commons Attribution License (CC BY). The use, distribution or reproduction in other forums is permitted, provided the original author(s) and the copyright owner(s) are credited and that the original publication in this journal is cited, in accordance with accepted academic practice. No use, distribution or reproduction is permitted which does not comply with these terms.
*Correspondence: Bing Cao, bingcao2006@126.com