


Introduction
North Water is a polynya with persistent open water and thin ice in a region surrounded by thick ice. It is located in Smith Sound and northern Baffin Bay (Fig. 1). This recurring polynya was first noticed by a British explorer and navigator, William Baffin, in the first week of July 1616 and since then this feature has been the subject of several scientific expeditions. As a result, the history of North Water has been well documented (Reference Dunbar and Dunbar, MaxwellDunbar and Dunbar, 1972). Recent investigations of North Water mechanisms were conducted by reconnaissance flights and satellites (Reference Dunbar and GreenawayDunbar and Greenaway, 1956; Reference DunbarDunbar, 1969, Reference Dunbar1972[a]; Reference Aber and VowinckelAber and Vowinckel, 1972; Reference Ito and MüllerIto and Müller, 1977). In addition, an interdisciplinary programme was undertaken jointly by McGill University, Arctic Institute of North America, and Geo-graphisches Institut des ETH of Switzerland (Reference MüllerMüller and others, 1975, Reference Müller, Müller, Ohmura and Braithwaite1976; Reference MüllerMüller, 1976).

Fig. 1. The position of North Water and surrounding area.
Most studies present results of North Water during the spring and summer seasons, i.e. during the periods of polar light, when field observations are more convenient. However, the North Water polynya shows remarkable features during the winter season (Reference Barnes, Barnes, Chang and WillandBarnes and others, 1970, Reference Barnes, Barnes, Chang and Willand1972). Indeed, a few studies were conducted during the winter season by aircraft (Reference DunbarDunbar, 1971, Reference Dunbar1972[b], Reference Dunbar1973[a], Reference Dunbar1973[b], Reference Dunbar1974; Reference MülerMüller and others, unpublished [a], Reference Müller and Müller[b], Reference Müller and Müller[c]). However, such reconnaissance of North Water lacks continuity and is incomplete in terms of both coverage and data.
Of course observation of North Water during the months of October through March is difficult because of the long-continuing darkness while the sun is below the horizon. Satellite images in the visible wavebands are not useful during polar nights and, indeed, are not usually acquired. However, satellite sensors in the thermal infrared (TIR) and microwave portions of the electromagnetic spectrum can provide an observational capability during nights and the periods of polar darkness. The main objective of this paper is to examine the usefulness of satellite TIR images for monitoring North Water during the periods of polar darkness.
Satellite Remote Sensing
Thermal infrared (TIR) sensors
Several operational and resource satellites that carry TIR sensors are listed in Table I. Most of the operational satellites such as NOAA, Nimbus, and Seasat have TIR sensors in the wavelengths of 10.5−12.5 μm with resolution varying from 0.8 to 8 km. The TIR sensor of DMSP satellites cover the wavelengths 8−13 μm with a 0.6 km resolution, although the images of this defence satellite are not readily available. In addition, Band 8 of the multispectral scanner in the Landsat-3 resource satellite covered the TIR region 10.5–12.5 μm of the electromagnetic spectrum. However, this band is no longer operational. Further, the newly launched Seasat-A has failed. Therefore, considering the resolution, frequency of coverage, reliability, and easy availability of images from all satellites, as indicated in Table I, only NOAA TIR images are currently suited for monitoring North Water during the periods of polar darkness.
Table I. Parameters of Operational Satellites with TIR Sensors

The NOAA-5 satellite has a polar orbit with an average altitude of 1500 km. The TIR sensors of NOAA satellites operate at a wavelength of 10.5−12.5 μm with a ground resolution of 0.8 km at nadir. The 10.5−12.5 μm wavelength in the electromagnetic spectrum is within the atmospheric window which is characterized by a very low concentration of water vapour and other atmospheric gases. Thus the TIR sensors use this atmospheric window to obtain high-quality images.
Interpretation of satellite TIR images
A NOAA TIR image acquired during the night or polar darkness represents the spatial distribution of radiation emitted by the surface of the Earth as well as the atmosphere. The following summary of the physics of TIR propagation serves to introduce the basic concepts of interpreting a NOAA TIR image. Objects that are not at absolute zero temperature (o K or –2 73°C) radiate energy over all wavelengths in the electromagnetic (EM) spectrum. In the infrared spectrum, radiation temperature varies with the physical temperature of the object and the emissivity of the surface and thus the distribution of the radiant energy emission is not a linear function of the surface physical temperature (Reference ReevesReeves, [c1975]). The radiant temperature measured by a NOAA satellite is a function of the emissivities of the water and ice, and the physical temperatures of their surface layers.
In the NOAA TIR images, the values of radiance are presented as different grey levels. These levels are useful for analysis of relative changes in emissivity and surface temperatures. Corrections for atmospheric effects, clouds, and instrument noise can be made for quantitative use of surface temperature data (Reference Cihlar and ThompsonCihlar and Thompson, [1977]; Reference Cihlar and McQuillanCihlar and McQuillan, 1978). In the images, features with relatively higher temperatures (e.g. leads, polynyas, and open water and thin ice or nilas) are represented in dark grey to black tones, because of higher radiant energy reaching the radiometer. Features with lower temperatures (e.g. pack ice, thick multi-year ice, and icebergs) are portrayed in light grey tones thereby indicating less radiant energy reaching the radiometer.
NOAA TIR images for the North Water region were analysed for three winter seasons:1974–75 1975–76 and 1976–77. The existence of ice cover in the images was established through the identification of distinct tonal contrasts which are based on relative temperature differences and day-to-day pattern stabilities.
North Water
Monitoring North Water
Figures 2and 3 represent the synoptic view of ice and open water in Smith Sound and northern Baffin Bay region for the months October 1975 through September 1976. Figure 3 comprises TIR images obtained during the periods of polar darkness and Figure 3, the images in the visible band obtained with solar illumination. The two figures trace one complete annual cycle for North Water. Because the satellite images of Fig 2 indicate a synoptic view of thin ice and open water for a particular date, only the general trends in the ice conditions can be observed. Moreover, it should not be assumed that the transition of the state of ice conditions from one month to the next, as indicated in Fig 2a, is smooth, because the amount of ice in North Water can fluctuate widely depending on weather conditions.
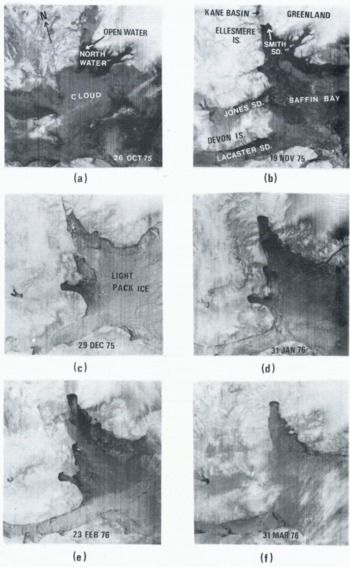
Fig. 2. Synoptic view of NOAA TIR imagery showing ice cover and open/semi-open water over Smith Sound and surrounding region for the months October 1975 through March 1976.

Fig. 3. Synoptic view of NOAA visible VHRR imagery showing open water and ice cover over Smith Sound and surrounding region for the months April 1976 through September 1976.
Strong radiant contrast between relatively cool thick ice, and warmer open water and thin ice is shown in Fig 2a In October, ice build-up continues in northern Baffin Bay though Smith Sound remains relatively open. Ice floes from Lincoln Sea pass through Smith Sound into northern Baffin Bay. In the image, low stratus cloud or steam fog, which is common over northern Baffin Bay during fall and winter, is also shown as dark grey tone. Steam fog, which is also known as Arctic sea smoke, forms when very cold air passes over areas of open water surrounded by ice.
In 1975, November was the month for initial formation of an ice dam in northern Smith Sound Fig 2b. The formation and disintegration of the ice dam continued through November and December (Fig 2band Fig 2c) until freezing of the dam, which took place in January 1976 (Fig 2d). The November and December images (Fig 2band Fig 2c) show that ice concentration in southern Smith Sound depends on the presence of an ice dam in northern Smith Sound. More open water and thin ice was noted when the ice dam was present in 1975-76 (Fig 2b and Fig 2d). On the other hand, in the absence of an ice dam in December Fig 2c pack ice moved from Kane Basin into Smith Sound and more thick ice was present in both that sound and northern Baffin Bay. In the November (Fig 2b) and particularly in the December Fig 2cimages, open water and thin ice (grey area) were prominent in western Jones Sound, which was further away from the North Water area.
In January 1976 (Fig 2d), a convex ice dam developed across northern Smith Sound. In the area south of the ice dam, the presence of open water and thin ice was indicated by dark grey to black tones. Open water and thin ice existed south of the ice dam probably because of Strong upwelling or convectional current south of the dam. Farther south in Smith Sound, the darker tones changed to lighter tones suggesting that the ice was thicker at the head of Baffin Bay. Open water and thin ice (darker grey tones) were present not only south of the dam (i.e. in northern Smith Sound), but also at several other places, especially along the north-west coast of Greenland, the south-eastern coast of Ellesmere Island, and at both ends of Jones Sound. The most striking fact in the January image was the presence of large prominent leads along the west coast of Greenland (Melville Bay) and the southern coast of Devon Island (Lancaster Sound). In addition, several smaller leads developed and refroze in Baffin Bay. The large easterly lead in Melville Bay might be related to persistent offshore easterly winds over north-western Greenland during the winter months, especially in January Reference Canada(Canada. Hydrographic Service, 1970).
In February 1976 (Fig 2e), the North Water polynya at the head of Smith Sound was very prominent. Areas of open water/thin ice (dark grey tones) were also scattered over northern Baffin Bay. These areas were more prominent in the February image than in its January counterpart. The significant feature as revealed from daily examination of satellite images was the continuing influx of large masses of ice from Lancaster Sound into north-western Baffin Bay as shown in January and February images (Fig 2d and Fig 2e). In addition, the large and small leads which were present in the January image could be seen in February (Fig 2e).
The maximum concentration of ice occurred in March 1976 (Fig 2f) with a very small area of dark grey to black tones. Note the changes of grey tones that occurred between February and March images. Most areas of darker grey tone in the February image (Fig 2e) had changed to lighter grey tones in March (Fig 2f), thereby indicating thicker ice in Smith Sound and northern Baffin Bay. However, leads were still prominent at Melville Bay and Lancaster Sound. The striking feature was the continuation of open water and thin ice in western Jones Sound from November to March images (Fig 2b)
As was expected, open water in Smith Sound and northern Baffin Bay expands southward after April, and the whole area is ice free by the end of June (Figure 3). However, the ice dam in Smith Sound did not disintegrate until the end of July (Fig 3d) after which the ice floes from southern Kane Basin started moving into Smith Sound and northern Baffin Bay. Fig 2 and 3 together portray one complete cycle of North Water and stress the value of satellite images in understanding the dynamics of North Water.
Monitoring the ice dam
The term “ice dam” is used to describe an arcuate blockage which extends between the eastern and western shores of Smith Sound and Kennedy Channel and for a time prevents the passage of ice. The same terminology was used by Reference ToomaTooma (1978) to describe the same feature in Smith Sound.
The ice dam in northern Smith Sound plays an important role in the North Water mechanism. Before the formation of an ice dam in the fall and winter, ice moves freely through Kane Basin into Baffin Bay. With the formation of an ice dam, the North Water polynya became more prominent (Fig. 2b, d, and e). Therefore, temporal variations in the ice dam have important ramifications for ice movements and local climates which are related to the presence or absence of North Water polynya.
During the 1975-76 winter season, the formation of a concave ice dam across northern Smith Sound was first noticed on the 15 November image (Fig 4a). But the ice dam had disintegrated by 23 November, possibly because of storm passage and increasing ice pressure from additional floes moving into Kane Basin from Lincoln Sea (Fig 4b). Indeed, this repeti-tive process of ice-dam formation and disintegration continued through November and December until the freeze-up of the first dam in northern Kennedy Channel (Fig 4c). Finally the second ice dam at Smith Sound was frozen for the balance of the winter on 27 January (Fig 4d). Similar processes of formation and disintegration of the ice dams at Smith Sound and Kennedy Channel were also observed during the 1974−75 winter season (Table II). In both cases, final freeze-up of the second ice dam at Smith Sound occurred after the forma-tion of the first ice dam at Kennedy Channel.

Fig. 4. Synoptic view of NOAA TIR imagery showing ice-dam formation and disintegration at Smith Sound and Kennedy Channel during 1975–76 winter season: (a) ice-dam formation at Smith Sound, (b) ice-dam disintegration at Smith Sound, (c) ice-dam freeze-up at Kennedy Channel, and (d) ice-dam freeze-up at Smith Sound.
Table II Events of Ice Dam Formation and Disintegration at North Smith Sound and Kennedy Channel During 1974−75, 1975–76 and 1976–77, Winter Seasons

During the 1976−77 winter season, a departure from the above process was noticed. In that season, the ice dam at Smith Sound was frozen much earlier than during the previous two winter seasons (Table II). Further, the sequence of formation of ice dams was also reversed, i.e. the ice dam at Smith Sound was frozen on 4 December (Fig 5a) and the dam at Kennedy Channel was frozen later on 19 February 1977 (Fig 5c). Figure 5a, b and 5c shows the sequence of formation of ice dams at Smith Sound and Kennedy Channel during 1976−77 winter season. The early freeze-up of an ice dam at Smith Sound in December 1976 indicated early establishment of winter atmospheric circulation over the eastern Canadian Arctic in 1976–77 winter season (Fig 6). The monthly 1000 mbar level constant-pressure maps for January 1976 and December 1976, which were the ice-dam freeze-up months for 1975–76 and 1976–77 respectively, show similar atmospheric pressure patterns (Fig 6b). During freeze-up of the ice dams in Smith Sound, the pattern of atmospheric circulation changed. The trough or low-pressure cell which was usually present over northern or north-eastern Baffin Bay (Fig 6a) during the months before ice-dam freeze-up at Smith Sound was replaced by a high-pressure cell during the month in which the ice dam froze (Fig 6b). At the same time, the lows moved from northern Baffin Bay (Fig 6a) toward southern Greenland and Iceland (Fig 6b). In 1976-77, the early replacement of a low by a high-pressure cell and the accompanying very cold temperatures over northern Baffin Bay appear to have been a contributing factor to the early freeze-up of the ice dam at Smith Sound.

Fig. 5. Synoptic view of NOAA TIR imagery showing ice-dam formation and disintegration at Smith Sound and Kennedy Channel during 1976–77 winter season: (a) ice-dam freeze-up at Smith Sound, (b) absence of ice dam at Kennedy Channel, and (c) ice-dam freeze-up at Kennedy Channel.

Fig. 6. 1000 mbar constant-pressure weather map showing the positions of low and high pressure cells for the months: (a) before (i.e. December 1975 and November 1976), and (b) during (i.e. January 1976 and December 1976), the ice-dam formation in Smith Sound for 1975–76 and 1976–77 winter seasons.
Effects of North Water on Ice Movement and Climate
During the time between the opening and freezing of the ice dam in northern Smith Sound, large quantities of first- and multi-year ice flow from the Arctic Ocean into northern Baffin Bay through the routes of Lincoln Sea, Hall Basin, Kennedy Channel, Kane Basin, and Smith Sound. During fall and early winter, movement of ice floes into Baffin Bay is facilitated by the high floe speed, open water, and the fragile thin ice cover of Smith Sound and northern Baffin Bay. In addition to ice movements, the North Water polynya in the winter months should modify the local air mass and, therefore, have an effect on local climates. Thus, the effects of the North Water polynya on both ice movements and local climates are examined next.
Ice movements
The ice movements through Smith Sound, as identified from day-to-day satellite images during the periods October through the time of ice-dam freeze-up at Smith Sound are presented statistically in Table III. It should be noted here that in a NOAA image it is difficult to distinguish between a large single floe and a compact field made up of a number of smaller floes. Satisfactory floe statistics for August and September could not be interpreted due to high cloud cover in the images. Sea-ice information derived from satellite images could be regarded as quantitative because the flow, frequency, and movements were interpreted through their relative grey-scale contrasts.
Table III Generalized Ice-Floe Statistics for Northern Smith Sound as Derived from NOAA TIR Imagery for three Winter Seasons (1974– 75, 1975– 76, and 1976–77)

The number of ice floes in Smith Sound was high during October, while the lowest number was recorded in January, which was the month for ice-dam freeze-up at Smith Sound during both the 1974-75 and 1975–76 winter seasons. The number in the parentheses beside floe frequency indicates the total percentage of days during which northern Smith Sound was open for that particular month. As an example, in November 1974, northern Smith Sound was open for 30% of the days or, conversely it was blocked by a temporary ice dam for 70% of the month. The number of floes indicates a very large temporal variation for each season as well as for three winter seasons. Small floes normally predominate during October, November, and December whereas large floes predominate in January (Table III). Though the displace-ment rates vary widely from 3 km/d to 21 km/d, the majority of floes moved at 12 km/d.
In the absence of an ice dam at Smith Sound, first- and multi-year floes move south along the western side of Smith Sound and northern Baffin Bay (Fig 7). Moreover, multi-year ice floes originating in the Arctic Ocean and in the channels of the Queen Elizabeth Islands are drawn into Baffin Bay through Lancaster Sound and to a much lower extent through Jones Fig 7 Sound because of westerly winds and the presence of thin ice (Fig 8). Examination of NOAA images for 1974-77 ar,d winter seasons reveals that maximum movement of ice through Lancaster Sound normally takes place during October and early November. By analysing day-to-day TIR images during the fall and winter seasons, it appears feasible to calculate the amount of ice driven into Baffin Bay which might give an early indication of a bad or good ice year for navigation in Baffin Bay.

Fig. 7. NOAA TIR imagery for so October 1976. It shows south and south-eastward floe movements along the western side of Smith Sound and northern Baffin Bay.

Fig. 8. Synoptic view of NOAA TIR imagery (digitally processed and geometrically corrected) for 16 November 1977. It shows how ice floes are drawn into northern Baffin Bay through Penny Strait, Barrow Strait, Lancaster Sound, Jones Sound, and Smith Sound. Note the floes of very light grey scale in eastern Kane Basin. These are probably large multi-year floes or giant icebergs moving southward from the north-west Greenland coast.
As noted earlier, with the formation of an ice dam at Smith Sound, the North Water polynya becomes more prominent in the early winter months with an increased area of open water and thin ice. The satellite images in figure 2(c, d and f) indicates the southward movement of ice. Indeed, additional ice forms in Smith Sound to replace the young ice carried southward by winds and currents thereby increasing net ice volume in southern Baffin Bay. Thus, Smith Sound and northern Baffin Bay becomes an active and important ice factory during the winter months (Reference Dunbar and Dunbar, MaxwellDunbar and Dunbar, 1972, p. 240), especially during January and February ( Fig 2d and Fig 2e).
Climates
It is to be expected that the open water and thin ice of the North Water area would modify the winter air mass and thereby influence local climates. Indeed, the relatively mild winter of northern Baffin Bay has long been recognized (Reference Hare and MontgomeryHare and Montgomery, 1949).
Northern Baffin Basin has a much higher frequency of cyclones in winter than in summer (Reference KleinKlein, 1957; Reference CanadaCanada. Hydrographic Service, 1970, p. 4–5). Higher cyclogenesis can be related to higher ocean-to-atmosphere heat flux and more evaporation from the North Water polynya during the winter season. Indeed, even a very small amount of open water can control ocean-atmospheric heat flux. Because the heat flux from the open ocean to the atmosphere is almost twice that of ice to the atmosphere (Reference Campbell, Campbell, Gloersen, Zwally, Ramseier and ElachiCampbell and others, [c1977]), North Water must be a significant source of heat during the periods of polar darkness. Muller and others (unpublished [a], p. 134) estimated that (1) the heat loss from the surface of Smith Fig 8 Sound is on average of about 800 cal cm−2 d−1 (34 kJ m−2 d−1) for the winter seasons; and (2) the evaporation from Smith Sound varies from 1.2 mm per day during the periods October through December to 0.8 mm per day during January through March. Thus higher ocean-to-atmosphere heat flux and higher evaporation contribute to higher frequency of winter cyclogenesis in northern Baffin Bay, especially in February (Reference CanadaCanada. Hydrographic Service, 1970, P- 4). Naturally, a higher frequency of cyclogenesis contributes to higher winter precipi-tation. Indeed, the precipitation in the North Water area is about 30% higher than in the surrounding region (Muller and others, unpublished [a], p. 135).
Conclusions
This study reveals the unique value of NOAA TIR images for monitoring North Water during the periods of polar darkness. Night-time TIR images are a most effective means of mapping sea-ice distribution and movements. Further, NOAA TIR images are invaluable for generalized statistical analysis of sea ice. Since the TIR images are dependent on thermal/ emissivity contrasts, boundaries between first- and multi-year ice and open water can be mapped more reliably than boundaries between open water and thin ice.
The survey of NOAA TIR images indicates that North Water is not an area of completely open water during winter months. However, patches of open water and thin ice normally exist in several areas of Smith Sound, northern Baffin Bay, the eastern end of Jones Sound, and in the eastern part of Lancaster Sound. Moreover, the persistence of leads and polynyas at Melville Bay, Smith Sound, and Lancaster Sound is a remarkable phenomenon. A similar feature of interest is the open water and thin ice at Kennedy Channel and western Jones Sound. The formation of ice dams at Kennedy Channel and Smith Sound are major controls on the presence of open water and thin ice areas just south of the dams. In two out of three years that were studied, the ice dam at Smith Sound was preceded by the formation of an ice dam at Kennedy Channel. Both ice dams are geographically persistent during the winter season.
Although this study was directed towards the use of satellite monitoring of North Water, the method can be applied to the observations of sea-ice movements, especially first- and multi-year ice floes in Arctic Canada during the periods of polar darkness.
Finally, satellite TIR remote sensing offers the only feasible means of acquiring the meso-scale synoptic information on the North Water mechanism and also for estimating heat flux for the development of climatic models. It is expected that satellite TIR images will continue to play a useful role in monitoring and mapping sea ice as well as environmental changes during the periods of polar darkness.
Acknowledgements
The author is indebted to Dr Alan F. Gregory, President of Gregory Geoscience Ltd, Ottawa for reviewing the manuscript, to Gregory Geoscience Ltd for financial assistance, and to the National Research Council of Canada for the financial assistance of an industrial post-doctoral fellowship. Thanks are due to Mr W. J. Sowden, Chief, Ice Climatology Section, Ice Forecasting Central, A.E.S., Ottawa for providing satellite images and weather maps.


