Abstract
Young researchers (ages 8 and 13, respectively) designed two studies, each with 100+ respondents, to explore how respondents who might choose to become health aides (females, ages 16-25) would respond to different messages about aspects of the job. The first study dealt with the respondent’s feelings about taking care of an older male client, the second study dealt with both the respondent’s feelings about taking care of an older female AND at the same time how the older female client might feel. Both studies showed the ability of the templated Mind Genomics process (www.bimileap.com) to help the researchers develop better ideas, and in the end produce strong performing data, as proven by the IDT (index of divergent thought, measuring strength of ideas based upon the responses of external respondents).
Introduction
In a previous study, the authors presented a new approach to understanding the minds of people. Rather than having adult or at least ‘older’ individuals create experiments, the approach worked with young people, giving them the tools to be researchers. The rationale for that study was that young people may perceive a situation quite differently from the way older people perceive the situation. Researchers are well aware of individual differences as well as meaningful variation in the topic that they study, while remaining blissfully unaware of the differences in viewpoint of the same problem by different individual [1]. One may study the way younger and older individuals perceive the same topic, with the substance of the investigation being a comparison of perceptions of the same problem. Such an approach can generate a valuable corpus of data, but inevitable the focus of the research will devolve to the differences in the questions that the different groups of researchers will ask in their pursuit of knowledge. Whereas it may be laudable to develop such knowledge, viz., differences in the perception of the same topic by different groups, the focus on comparing the different researcher groups ends up with comparisons of database, such comparisons being done in a lockstep manner.
The contribution of this paper and its previously published companion paper differs, following a new vision. That vision is that the database of knowledge be created by young researchers, the effort focused on learning about the world through the eyes of these young researchers. Whereas comparison with older researchers may be interesting, in the end the goal is to let the natural inquisitiveness of young researchers open up the world as they see that world. Furthermore, by letting the young researchers follow their own interests, we get a sense of how they perceive the world, without having to proceed in a lockstep fashion with similar perceptions by older individuals. In a sense, we are building a world of knowledge through the lenses of young people who are now equipped with easy-to-use, quick, inexpensive, and engaging state of the art research tools and statistics.
The Mind Genomics Process for Creating Knowledge
The objective of Mind Genomics is to create knowledge about how people make decisions about the ordinary aspects of the day [2]. The interested reader is referred to the various published papers which outline the approach and which provide examples of the applications in topics as diverse as the law [3], society [3,4], as well as commercial endeavors such as the design and marketing of food [5,6], and so forth. The actual research is straightforward, founded on the premise that the solid data emerges from the pattern of responses to test stimuli, when these stimuli are created by combining messages or elements into short test paragraphs. The combinations of messages are more natural, combining different ideas, in a manner that would be experienced by a person in daily life. Rather than asking the respondent to ‘think’ about the individual messages, thus possibly introducing bias and the effort by respondents to ‘get the right answer’, the researcher forces the respondent to evaluate the combination in a way that can be described as ‘gut feel.’ The respondent cannot guess the right answer, ending up simply rating the combinations almost automatically, without thinking, mimicking a great deal of our ‘automatic pilot’ which guides us through daily life.
The study begins with the selection of four questions which tell a story. The newly updated version of the BimiLeap program provides artificial intelligence to help the researcher identify the questions (Idea Coach). Once the respondent has selected the four questions, the BimiLeap program offers AI-powered Idea Coach once again to help the researcher to select four answers for each question. Finally, the program dynamically creates different combinations of the 16 elements, putting these elements into a group of 24 ‘vignettes’, or combinations [7]. Each respondent tests a totally different set of vignettes, much like an MRI. The process takes about 3-4 minutes on the computer, with many respondents reporting that they felt that they could not get the ‘right answer’ because there seemed to be no obvious structure.
The analysis of the foregoing data, done by regression and clustering, end up creating a simple equation of the form: Dependent variable = k0 +k1(A1) + k2(A2) … k16(D4). The dependent variable is the assigned rating by the respondent to a vignette, or for Mind Genomics a transformed value. The independent variables are A1-D4, the 16 elements, which are either present or absent in the vignette. The coefficients k1-k16 tell us the contribution of each element to ‘driving’ or influencing the dependent variable, DV. Finally, the additive constant, k0, tells us the estimated value of the DV, the dependent variable if the vignette were to contain no elements, a purely hypothetic case since all vignettes comprise 2-4 elements specified by the underlying experimental design. The additive constant is typically looked as a baseline value.
The two new studies run by senior authors Ciara Mendoza and her brother Cledwin Mendoza deal with aides to seniors (age 84 for males, 94 for females). The two studies were positioned slightly differently, but both dealt with aides doing various activities with and for their clients. In both studies the respondents were 100+ women, ages 16-25, from the United States, with stated income of $35,000 or less. The objective was to sample female respondents would someday think of becoming a health aide or companion for an older individual. The respondents were recruited by Luc.id Inc., a company specializing in aggregating respondents for online panels. The actual specifications for the respondents were set up in the recruitment specifics, in an API linked to Luc.id. All the researchers had to do was selecting the qualifications for the respondent, and order (purchase) the respondents. Once the researcher paid for the panel by credit card the study was launched, requiring about 1-2 hours to complete. All specifics about panelist ‘incentives’ to participate were handled separately by Luc.id. It is important to keep in mind that the study might have taken a week or two to complete through other means, such as inviting one’s friends. The system developed with Luc.id took that down to 60-90 minutes.
The final things to keep in mind before we look at the studies is that the analysis is fairly standard by now, using data transformation to create the ‘dependent variable’, followed by OLS (ordinary least-square regression) to create equations, and then k-means segmentation [8] to identify groups which are different in the way they responds to the elements, the so-called mind-sets.
Structure of the Studies and the Analyses
The topic of aging is growing in interest for a simple, overwhelming unchallengeable reason, demographics. The population is growing older [9,10]. With aging comes the inevitable consequences of loss of physical capacity [11], loss of mental capacity [12,13] and the increasing recognition that older people often perform better when they are encouraged and helped by aides specially trained for older people [14-17].
The focus of these two experiments is to understand the mind of women, ages 16-25, who might possibly become health aides, ministering to very old individuals, clients well into their 90’s. Such information about what prospects think about the aspects of a job helps the employer to keep abreast of both the changes in the way prospective employees ‘think about a job’, as well as understand the type of person who might be best suited from the job, based upon the way the job candidates ‘thinks.’ Finally, the ability to gather such information literally in less than a day, for very little money allows anyone to make better decisions, either about hiring a candidate employee, or for the employee choosing the employer or even the best career. To prepare for these larger studies calling for 100 respondents per study, the young researchers practiced setting up studies in BimiLeap, and running five respondents per study. This practice allowed them to become more facile with the BimiLeap approach, with the use of artificial intelligence through Idea Coach, and finally to break somewhat free of the embedded artificial intelligence by editing the answers provided to them, in some cases pre-empting the artificial intelligence to provide their own answers. This ability to edit or replace AI-suggested answers is an important one. Research by author HM and colleagues testing AI-generated vs. human-generated answers found that, in most cases dealing with issues of daily life, the human-generated answers generated higher response levels than AI-generated answers, strongly suggesting that whereas AI-generated answers are often sufficient, some can be improved or added with human judgment. However, we should note that as the AI algorithms improve, the quality of the answers is likely to also improve. Even with improvements, the authors expect that human researchers will remain the final judges and arbiters of the most appropriate answers [18].
The actual studies are summarized in two sets of three tables each. The first table in the triplet shows the parameters of the equation relating the presence/absence of the elements to the TOP2, the positive ratings (viz., easy to take care). The second table in the triplet shows the parameter of the equation relating the presence/absence of the elements to the BOT2 ratings (viz., hard to take care). The third table in the triplet shows the Index of Divergent Thought, an approach to measure the quality of thought, based upon the weighted number of positive coefficients. It will be clear from this third table in the triplet that the young researchers have been able to master some of the important aspects of the research approach, specifically the selection of strong performing elements.
Study 1: Taking Care of a 94 Year Old Man
The study concerned the feelings towards an old man, with the aide’s job, in part, were to talk to the man for an hour. As in these studies by young researchers, all of the material was created by them, with minimal direction from the senior authors. The top row of Table 1 shows the introduction to the topic, as presented to the respondents. The respondents themselves will have no ideas about the correct answer because they read the orientation paragraph, and then immediately rate a set of 24 vignettes comprising 2-4 of the elements without any interaction with a person to give them a clue about ‘right/wrong,’ doing so in 3-4 minutes. As mentioned in the short introduction, the BimiLeap program produces a single model or equation for the total set of 105 respondents, then produces 105 separate models or equations, one for each respondent. Finally, the BimiLeap program clusters the 105 respondents based upon their individual models, using the values for the 16 coefficients, emerging with three distinct groups of people . These are the mind-sets. The BimiLeap program then creates one new equation based on all the individuals within a mind-set.
Table 1: Performance of elements dealing with care for a 94 year old man. Part 1 shows the results for ratings of ‘easy’. Part 2 shows the results for ratings of ‘difficult.’
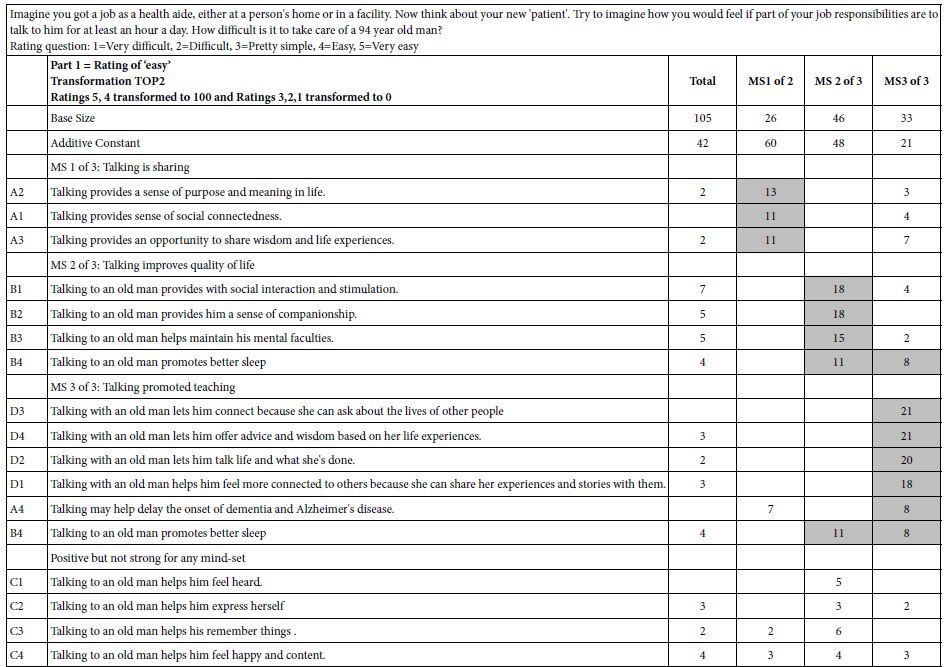
We now explore Table 1, Part A (drivers of ‘easy’), beginning with the Total Panel, and then proceeding to a comparison of the mind-sets.
- Additive constant for the total panel is th estimated proportion of the transformed responses (TOP2) to be 100, or the original ratings to be 4 or 5, in the absence of elements. Clearly the experimental design precludes that, forcing each vignette to contain a minimum of two elements and a maximum of four elements, with no vignette containing mor than one element or answer from a question. Thus the additive constant is a baseline. For total panel the additive constant is 42. This means that the baseline ease to take care of the old man is low. There is a great deal of difficulty. Only 42% of the responses would be stating ‘easy’.
- The mind-sets show an exceptionally large variation in basic easy’ responses. Mind set 1 feels that it will be very easy (additive constant 60) whereas Mind set 3 feels that it will be not easy (additive constant 21)
- The ‘story’ continues with the coefficients. Although the respondents may have felt that they were ‘guessing’ nothing could be further from the truth. Keep in mind that we are looking only at the positive coefficients, viz., those which mean that incorporating the element into the vignette increases the rating of ‘easy’ (viz., rating of 5,4). The coefficients show the incremental percentage of respondents rating the vignette ‘easy.’
- Looking at the top part of Table 1, devoted to TOP2, the ratings of ‘easy’, and focusing only on the column or Total Panel, we see that most of the elements which appear have low positive coefficients. This tells us that they do drive a response of ‘easy’ for the vignette BUT not too strongly. Only one of the elements, B7, Talking to an old man provides with social interaction and stimulation, with a coefficient of +7, approaches the status of ‘strong performer’. The status of ‘strong performer’ is based upon statistical considerations, with a coefficient of +8 approaching ‘statistical significance’ in the underlying regression analysis.
- It is when we get to the mind-sets that we see strong elements emerging. The rationale for the emergence of these mind-sets is simply that the Total Panel comprises these groups which cancel out the ‘signals’ emerging from each mind-set. In other words, there is too much ‘noise’ in the total panel.
- The mind-sets emerge from the process of clustering, viz., dividing the 105 respondents by the pattern of their 16 coefficients. The flat data that we saw for the total panel seems to disappear, to be replaced by different groups of strong performing elements. The composition of each mind-set is determined by the clustering process, a purely mathematical process. It is the researcher’s job to find the underlying story, and thus give the mind-set a name. Sometimes these underlying stories are not clear when we extract only two mind-sets. The stories get clearer when we extract three mind-sets. Of course, the story will get increasingly clear as we extract more than three mind-sets, but good research practice dictates that work with as few mind-sets as possible (parsimony), as well as strive for a clear story (interpretability).
- As we inspect the top section of Table 1, we see many strong performing elements in each mindset, as well as many blank cells. Our conclusion is respondents see the topic of caring for a 94 year old as having different benefits. From a practical point of view we now have a deeper understanding of the different facets of taking are of a 94 year old man, facets are perceived by real people, rather than by policy makers and managers.
- Moving now to the bottom section of Table 1, we inspect the results after turning the scale around, looking at the elements which drive ‘difficult.’ Keep in mind that BOT2 looks at the data in the same way, but only after the transformation.
- Our inspection of the data for ‘difficult’ begins with the additive constant. The four numbers suggest low but not very low basic perception of ‘difficult.’ The additive coefficient for Total Panel is 30, which is appreciable, and not small at all. It means in the absence of any information, we expect 30% of the ratings of the vignette to be 1 pr 2, respectively.
- When we move to the mind-set we see that we will encounter a range of basic perceptions of ‘difficult’ with Mind-Set 3 expected to rate almost half of the vignettes as difficult or very difficult. From a practical point of view, we should expect less ‘trouble’ working with Mind=Set 1 with their low additive constant of 17 for ‘difficult’, and more ‘trouble’ with working with Mind-Set 3 with their high additive constant of 45.
- The actual coefficients are occasionally positive, but many are blank, so they are irrelevant. Furthermore, Table 1 shows no strong performing elements for ‘difficult.’ Nothing stands out, either for the Total Panel or for the three mind-sets.
Study 2 – Taking Care of a 94 Year Old Woman
This second study was more adventurous, reflecting the effort to understand what the respondent would feel (Ratings 5 and 4 vs. ratings 1 and 2), and what the 94 year old client (Lila) might feel. Our focus will be primarily on what the respondent says she herself would feel, and then secondarily on what the respondent thinks her client would feel. For the respondent, the key new things to consider are the need to answer considering the two options, her feeling and her guess about the respondents feelings. Table 2 shows the distribution of the five point ratings across all 101 respondents (R5-R1), as well as the four ‘net’ values. These net values are R54 (Respondent feels it will be easy), R12 (Respondent feels it will be hard), R52 (Respondent feels that the client will like it), and finally R14 (Respondent feels that the client will dislike it).
Table 2: Averages of transformed ratings and ‘net ratings’ for the vignettes
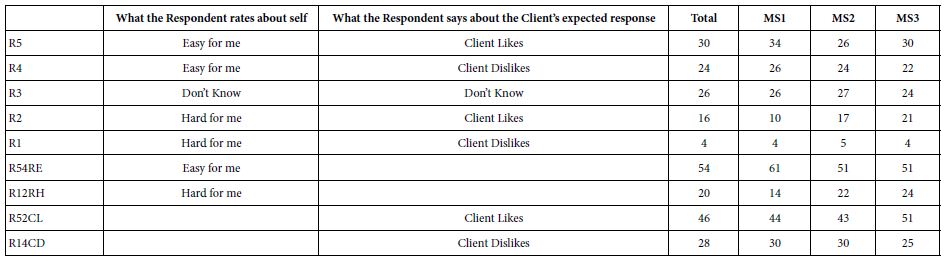
The pattern of percentages in Table 2 suggests differences among the mind-sets, and that the respondents can differentiate their feelings from those of the presumed client feelings. For example, R4 (easy for me; client dislikes) as well as R2 (hard for me, client likes) show non-zero values. Respondents are able to differentiate themselves from their clients, even for the same vignette. The ability appears in the entire total panel and all three mind-sets.
Table 2 suggests that the respondents seem able to differentiate what they feel about the information in a vignette versus what they expect another person to feel. The ability to differentiate different points of view with a single rating permits the researcher to more deeply understand how people respond versus how they think others will respond. This finding should not surprise us. The basis of consumer research is the evaluation of different aspects of a concept or product. Of greater interest will be the analysis to discover the nature of the specific elements, viz., which specific elements are perceived to be easy/client will like, versus easy/client will dislike, etc. We now move to the analysis of the data as we in Table 1, looking only at the first half of the rating scale, easy vs. hard, independent of the expected response of the client. Table 3 (Top portion) shows the results similar to Table 1, viz. for ratings of ‘Easy’ (TOP2). We see that the additive constants are in the middle range, 45 for the total, and 39 to 59 for the mind-sets. The stronger results emerge from the coefficients. There is only one strong performing element for the Total Panel (D3: Talking with an old lady lets her connect because she can ask about the lives of other people). In contrast, when the respondents are clustered into three groups, viz., mind-sets, several elements emerge as strong performers for each mind-set.
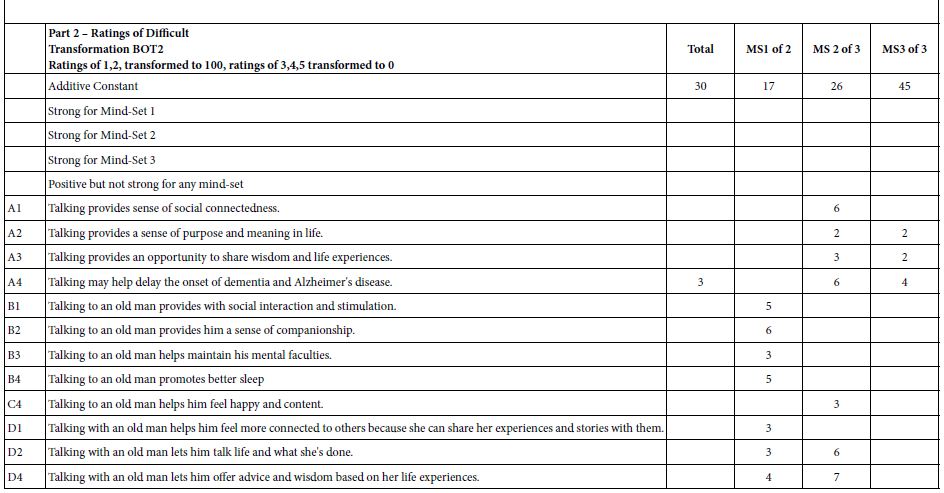
Table 3: Performance of elements dealing with care for a 94 year old woman. The table focuses only on the rating of easy/hard as perceived by the respondent. Part 1 shows the results for ratings of ‘easy’. Part 2 shows the results for ratings of ‘difficult.’
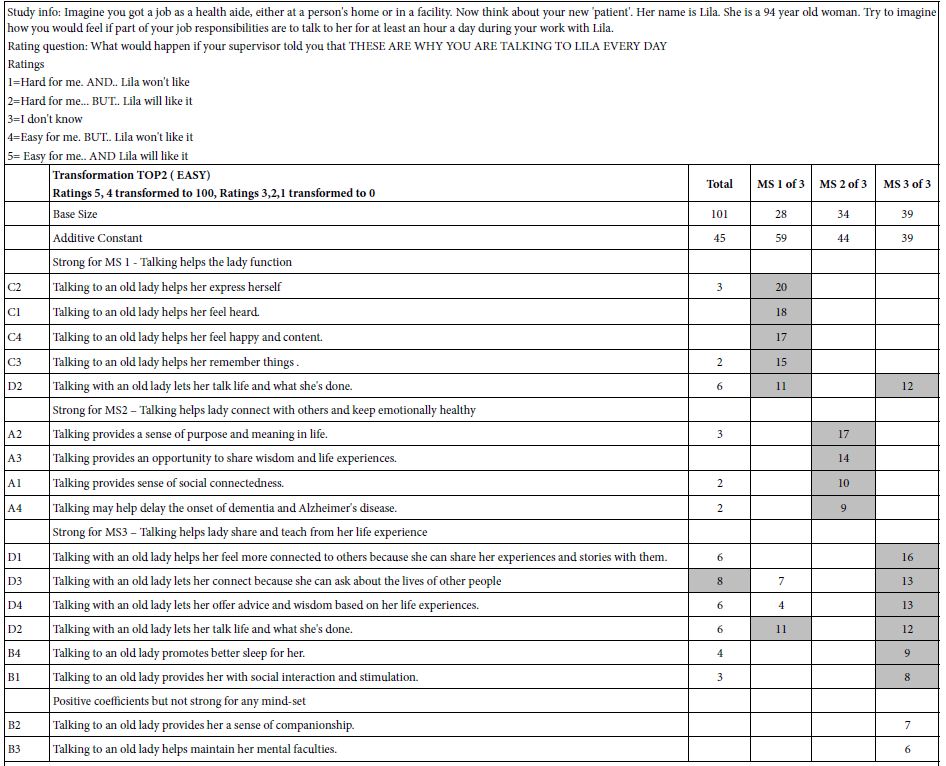
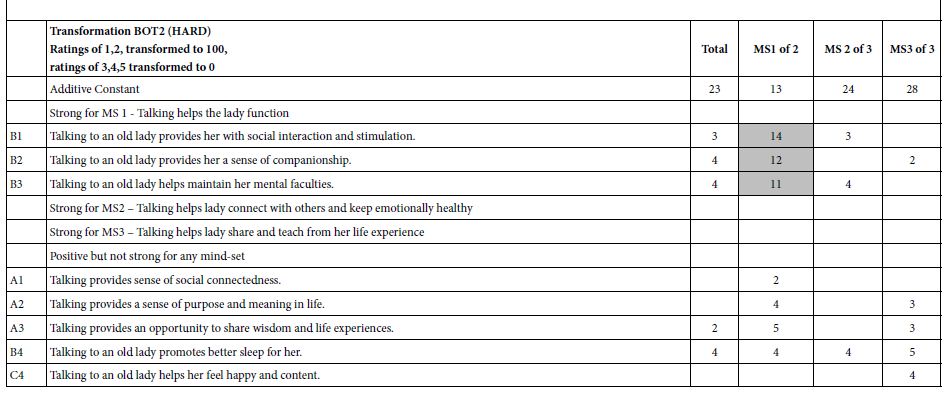
Table 4: Performance of elements showing the ‘expected response’ of the 94 year old woman (client). The table focuses only on the rating of how the respondent feels that the client will like the element. 1 shows the results for ratings of ‘client like’. Part 2 shows the results for ratings of ‘client dislikes.’
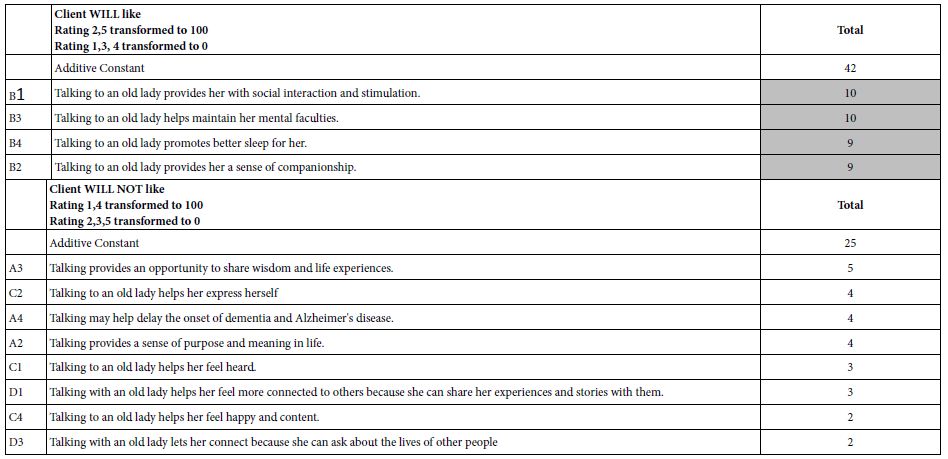
When we look at the mind-sets in terms of easy vs. hard for the aide (viz. for the respondent assuming to herself that she is the aide), we find that the differences among the mind-sets are subtle, rather than dramatic. It may be that adding another consideration to the rating scale, the response of the client, viz., the old lady, may interfere with the ability of the respondent to focus on how she feels about the message for herself as the aide. When we move to the bottom up (HARD), in the second part of Table 3 we find that Mind-Set 1 begins with the lowest level of basic perceived hard (Additive Constant =13), and, in turn, shows the only strong performing elements. The other two mind-sets as well as Total Panel show no strong performing elements. When we move to the second part of the scale, that dealing the expected response of the ‘client’, viz., the 94 year old woman, we begin to get a clear picture of what might be the most important elements. These are from group B.
Talking to an old lady provides her with social interaction and stimulation.
Talking to an old lady helps maintain her mental faculties.
Talking to an old lady promotes better sleep for her.
Talking to an old lady provides her a sense of companionship.
It may well turn out that for these types of studies about jobs, the best approach is to use a double sided scale, one side dealing with one’s own feelings, the other side dealing with the expected response of others.
Measuring the Performance of the Research Results
A continuing issue in research is the measurement of ‘research quality.’ How does one know whether a study is of high quality or poor quality? One may look at the execution of the study, the analysis of the data, and even the writeup of the results to get a sense of whether the study is worthy of publication. But what about studies of the everyday, where the topic may not be particularly interesting because it is ordinary, ‘mundane,’ and simply falls below the radar of a serious scientist.
The issue of ‘research quality’ is especially important for the efforts which go into studies using Mind Genomics. By its very nature, Mind Genomics deals with the boring, the ordinary, despite the ordinariness of the topic, well executed Mind Genomics experiment emerges with a great of insight about the thinking by people, doing so without changing the reality of the situation, without somehow manipulating the situation to show an effect. A key aspect of Mind Genomics is that the test stimuli are evaluated by people for their basic ‘loading’ on different variables, such as one’s perceived enjoyment in doing the action. We can define the performance of the element as being the coefficient. That coefficient shows the degree to which the element departs in a positive way from the current baseline. Presumably the greater the sum of departures from the current baseline, the better the experiment because it is the human judge who rates the test elements.
Mind Genomics studies lend themselves to measures of research quality that can be made automatic, and objective. It is not an expert who evaluates the vignettes, but real individuals. In turn the individuals, who evaluate, viz. the respondents, can be sourced from many places, with the respondent ‘panel’ shaped to fit required specifications. As such, Mind Genomics both creates the test stimuli, and evaluates them by people, in what might be called a meld of objective and subjective measures. In the end, however, the evaluation of the test vignettes is done in a structured, and reproducible fashion, leading to numbers (additive constants, coefficients, after the dependent variable is specified). The measure of research quality developed for Mind Genomics is called the IDT, the Index of Divergent Thought. The calculations for the IDT are shown in Table 5. The IDT works simply by considering only positive coefficients of 1 or higher for six groups. These groups are Total Panel, the three mind-sets, discussed here, and the two-mindsets, not discussed here. The approach sums the positive coefficients for each of the six groups, weights each sum by the relative proportion of the respondents in that group, and then adds the weighted sums.
Table 5: The IDT (Index of Divergent Thought) and its computation for the two studies, on a 94 year old man, and a 94 year old woman
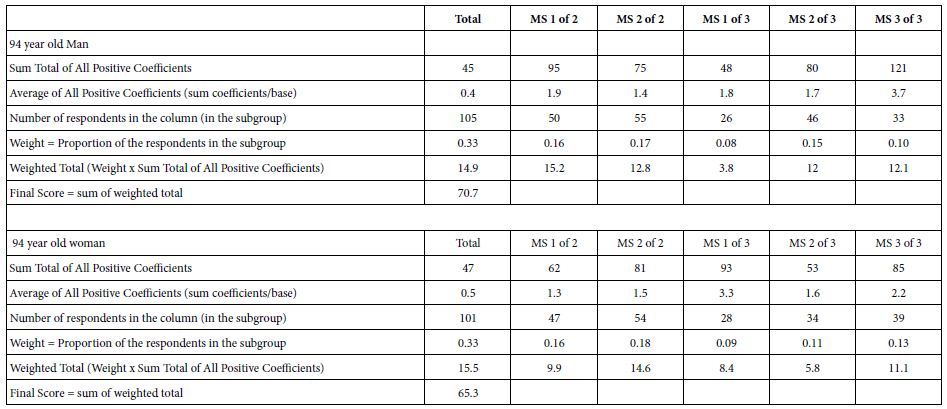
In many studies the IDT is often 30-50. The IDT results are very high for these two studies, perhaps the result of the young researchers gaining experience in how to think about the problems, combine with their ability to work with artificial intelligence suggestions, and then modify these suggestions to be simple, and direct. The IDT values of 70.7 and 65.3 are unusually high, and speak to the positive impact Mind Genomics can exert on the intellectual development of young people when they are actively involved as science researchers.
Discussion and Conclusions
As the world of consumer research evolves, it is becoming increasingly clear that the voices of researchers need not remain those of the academic elite who have been educated in best practices. The results shown in this paper suggest that the increasing power of the computer, and of artificial intelligence, is allowing more people to participate in the creation of knowledge, indeed knowledge of high quality. What then has been shown in this study beyond the ability of young people to become researchers? If one were to summarize the learnings, it is that there is an opportunity to improve societal welfare by understanding the needs of people through research. The simple examples of these two studies suggest specific activities which are hard, activities which are easy, and that people differ from each other in their opinions. These differences among people emerge when people are presented with compound test stimuli, preventing the people from ‘knowing the right answer.’
When we look at the different activities, and the responses to those activities, we become more away of subtle differences in behaviors that we might have combined under a general rubric. For example, talking to the client and encouraging the client to talk may seem to be one simple topic, but there are many facets of talking. Only through experiments such as those enabled by Mind Genomics can we end up quantifying the differences. Yet, beyond the template lies the suggesting power of Idea Coach (artificial intelligence), the response of real human beings (test execution), and the power of objective analysis (regression and clustering). This triumvirate, acting together in the period of an hour or two, and supporting the efforts of young researchers, or indeed anyone, anywhere interested in a problem, promises a breakthrough in the education of young people in a new manner, and perhaps the solution of societal problems driven by young minds, rather than by experienced but desensitized professionals whose very history ends up blinding them to important, emerging opportunities.
References
- Mendoza Cl, Mendoza CI, Deitel J, Braun M, Rappaport S, et al. (2022) Empowering the Young Researcher: A systematic exploration to understand people’s minds concerning the job of a home aide for a 3-6 year old child.
- Moskowitz HR, Gofman A, Beckley J, Ashman H (2006) Founding a new science: Mind genomics. Journal of Sensory Studies 21: 266-307.
- Moskowitz HR, Wren J, Papajorgji P (2020) Mind Genomics and the Law. LAP LAMBERT Academic Publishing.
- Moskowitz H, Kover A, Papajorgji P (2022) Applying Mind Genomics to Social Sciences. IGI Global.
- Porretta S (2021) The changed paradigm of consumer science: from focus group to mind genomics. In: Consumer-based New Product Development for the Food Industry. Royal Society of Chemistry 21-39.
- Porretta S, Gere A, Radványi D, Moskowitz H (2019) Mind Genomics (Conjoint Analysis): The new concept research in the analysis of consumer behaviour and choice. Trends in Food Science & Technology, 84: 29-33.
- Gofman A, Moskowitz H (2010) Isomorphic permuted experimental designs and their application in conjoint analysis. Journal of Sensory Studies 25: 127-145.
- Likas A, Vlassis N, Verbeek JJ (2003) The global k-means clustering algorithm. Pattern Recognition 36: 451-461.
- Baltes PB (1993) The aging mind: Potential and limits. The Gerontologist 33: 580-594. [crossref]
- Van Eenoo L, Declercq A, Onder G, Finne-Soveri H, Garms-Homolova V, et al. (2016) Substantial between-country differences in organising community care for older people in Europe—a review. The European Journal of Public Health 26: 213-219.
- Kagwa SA, Boström AM, Ickert C, Slaughter SE (2018) Optimising mobility through the sit‐to‐ stand activity for older people living in residential care facilities: A qualitative interview study of healthcare aide experiences. International Journal of Older People Nursin 13. [crossref]
- Koenig HG, George LK, Schneider R (1994) Mental health care for older adults in the year 2020: A dangerous and avoided topic. The Gerontologist 34: 674-679. [crossref]
- Sung HC, Chang SM, Tsai CS (2005) Working in long‐term care settings for older people with dementia: nurses’ aides. Journal of Clinical Nursing 14: 587-593. [crossref]
- Diwan S, Berger C, Manns EK (1997) Composition of the home care service package: Predictors of type, volume, and mix of services provided to poor and frail older people. The Gerontologist 37: 169-181.
- Gallagher S, Bennett KM, Halford JC (2006) A comparison of acute and long‐term health‐care personnel’s attitudes towards older adults. International Journal of Nursing Practice 12: 273-279.
- O’Brien N (2003) Emergency preparedness for older people. New York, International Longevity Center-USA.
- Piercy KW (2000) When it is more than a job: Close relationships between home health aides and older clients. Journal of Aging and Health 12: 362-387. [crossref]
- Moskowitz HR, Rappaport S, Deitel Y (2022) The quality of ideas when AI (artificial intelligence) is used as a coaching device. Mind Genomics Studies in Psychology & Experience (ISSN: 2771-9308).