INTRODUCTION
Low back pain (LBP) is one of the most commonly reported musculoskeletal conditions amongst adults in the United States.1 Although populations that consistently engage in physically demanding activities such as athletes, tactical professionals (law enforcement, first responders, military), and manual laborers may sometimes possess higher levels of fitness, they too have demonstrated high rates of low back injuries.2–7 The responsibility of musculoskeletal providers to effectively manage LBP and make appropriate return to activity decisions is arguably more challenging in physically active than in sedentary populations due to the physically demanding requirements of their sport or occupation.8–10 Deadlift variations are common movement patterns that are present within strength and conditioning programs and within physically demanding occupations.7,11 Deadlift training is intended to strengthen the musculature of the lumbopelvic region and lower extremities to help individuals prepare for and improve upon the specific physical demands of their sport, occupation, and active lifestyle.12–14 However, little evidence exists to inform rehabilitation clinicians about when neuromuscular impairments resulting from low back injury may preclude an individual from safely returning to deadlift training or when using deadlift variations as a rehabilitation exercise is indicated.15,16 The high incidence of low back injuries amongst individuals who are expected to return to perform deadlift or deadlift-like movements (e.g. hip-hinge) places an urgent requirement on researchers and clinicians to further identify neuromuscular impairments that may be prohibitive of a safe return to deadlift training following low back injury.15–17
Stiffness is a mechanical property of muscle that has been suggested as an important measure of muscle health and function.18–20 Myotonometry is a non-invasive, objective method of quantifying muscle stiffness through portable, handheld devices called myotonometers.21 During isometric contractions, muscle stiffness has demonstrated a stronger, positive linear relationship with force production (R2 = 0.977) than the linear relationship demonstrated between electromyography (EMG) and force (R2 = 0.936).22 The relationship between muscle stiffness and force indicates that stiffness may be a superior metric than EMG to determine the relative force that an individual muscle is contributing to a multi-muscle task.23,24 Furthermore, the ability of myotonometry to quantify muscle stiffness under relaxed and contracted states makes it a more versatile method for identifying neuromuscular impairments than EMG which can only measure neural drive from an actively contracting muscle.25 The ability to reliably identify impairments under passive conditions is not a trivial matter as numerous studies have demonstrated that abnormal passive muscle stiffness levels are present in individuals with a variety of neuromusculoskeletal disorders, including LBP.18,26,27 The MyotonPRO Digital Palpation Device (Myoton AS, Tallinn, Estonia) is a myotonometer that can quantify active and passive muscle stiffness in a quick and reliable manner that is necessary for obtaining tests and measures in clinical settings.28,29 Utilization of the MyotonPRO in individuals with LBP may help clinicians identify and monitor neuromuscular impairments to improve plan of care decisions that improve outcomes and help to reduce LBP re-injury rates.
Increased stiffness of lumbar spine muscles has been demonstrated in those with LBP, but this has only been demonstrated with the participants lying in prone.20,27,30 No study has investigated muscle stiffness in LBP populations in body positions relevant to sport and occupational function such as in the standing and deadlifting positions. Investigating muscle stiffness of both the lumbar spine and the lower extremities during these positions will help researchers and clinicians better understand how muscle stiffness behaves during loaded body positions and how this may be altered in those with LBP. Therefore, the primary purpose of this study was to compare the stiffness of trunk (lumbar multifidus [LM] and longissimus thoracis [LT]) and lower extremity (vastus lateralis [VL] and biceps femoris [BF]) muscles between individuals with and without LBP during the lying, standing, and deadlifting body positions. The secondary purpose was to compare percent-muscle stiffness changes that occur as participants transition from a relaxed condition to the standing (trunk musculature only) and deadlift positions (trunk and lower extremity musculature). Participants with LBP were hypothesized to demonstrate increased trunk muscle stiffness in the relaxed and standing conditions, but for the deadlift conditions individuals with LBP were hypothesized to exhibit decreased trunk and hamstring muscle stiffness with increased vastus lateralis muscle stiffness secondary due to pain-induced compensatory deadlift mechanics.
METHODS
Participants
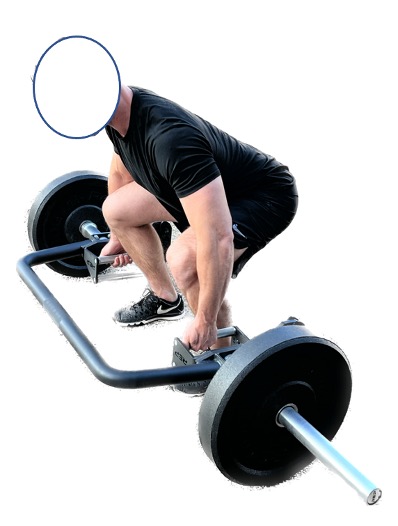
Sixty-eight physically active adults were recruited for the study through word of mouth and flyers distributed across the university campus. Healthy volunteers were included if they had no complaint of lower extremity or spine pain that limited their participation in physical activity over the prior six months and were able to achieve the body position required to perform a trap bar deadlift (Figure 1). Healthy volunteers were excluded if they were pregnant or had a body mass index (BMI) categorized as obese (30 kg/m2). Individuals with BMI that qualified as obese were excluded because subcutaneous adipose exceeding 20 mm in thickness may interfere with the MyotonPRO’s ability to accurately measure muscle stiffness.31 Volunteers with LBP were included if they were currently experiencing pain between the 12th rib and the gluteal fold, had moderate LBP-related disability (defined as a score of > 20 on the Oswestry Disability Index [ODI]), and were able to achieve the trap bar deadlift position. Volunteers with LBP were excluded if they were pregnant, had a BMI that qualified as obese, or any current medical conditions of a serious nature (fracture, cancer, systemic disease, lower quarter neurological deficits). Participants were first screened for study eligibility (ODI score and BMI) via email and again the day of study participation. Prior to data collection, all participants signed an informed consent form approved by the university’s Institutional Review Board (Project ID: 1921195-3) and the study was performed in accordance with the ethical standards of the Declaration of Helsinki.

Procedures
Prior to collection of muscle stiffness measures, participants had their height and weight recorded with a stadiometer (Seca 777, Hamburg, Germany), then completed self-report questionnaires for demographic, activity level, exercise frequency, LBP-related disability, pain, and anxiety. Physical activity level was assessed with a single question, “Over the last year, how would you assess your activity level?” with possible responses being “inactive”, “somewhat active”, “active”, and “very active.” This question has demonstrated adequate reliability and validity to assess activity level when compared to more comprehensive questionnaires.32 Furthermore, activity level assessed with this single question has been shown to have a positive relationship with lumbar muscle stiffness.32,33 Weekly participation in aerobic and resistance exercise was assessed with a training frequency question that asked participants, “Over the last year, how frequently (on average) did you participate in at least 30 minutes of aerobic or resistance training?” with possible answers being “less than 1 day per week”, “1-3 days per week”, and “greater than 3 days per week.” The numeric pain rating scale (NPRS) is an 11-point (0-10) scale that is a reliable and responsive measure in people with LBP.34 Participants with LBP rated their pain in each body position that stiffness measures were collected. The ODI is a reliable and valid 0-100 scale measuring LBP-related disability where higher scores relate to higher disability.35 Anxiety was assessed with the Beck Anxiety Inventory (BAI) which is a 21-item questionnaire that scores somatic symptoms of anxiety on a 0-63 point scale (higher scores represent more anxiety).36 The BAI has demonstrated adequate reliability and validity when compared to other anxiety questionnaires and anxiety assessed with this measure has been shown to demonstrate a negative relationship with muscle stiffness.36,37 Upon completion of questionnaires, participants with LBP received a subjective and neuromusculoskeletal exam to determine their appropriateness for the study.
Stiffness measurements were collected on the VL, BF, LM (L5 spinal segment), and LT (L1 spinal segment) muscles during the lying (prone/supine) and contracted (standing and trap bar deadlift positions) conditions. These muscles were selected due to their demonstrated importance to deadlift performance as well as spinal health and function in individuals with LBP.27,30,38,39 Measurement locations were determined using documented electromyography (EMG) sites that were consistent with recommendations stated on the device manufacture’s website (myoton.com).40 Measurements were acquired with the participant’s shoes off, recorded from the more symptomatic side in individuals with LBP, and randomized to the left or right side in asymptomatic individuals. Measures were only collected on the more symptomatic side in participants with LBP to reduce the number of deadlift repetitions that participants had to perform. Furthermore, higher muscle stiffness measures have been found on the more symptomatic side in people with LBP.20 Participants with LBP were asked to withhold from receiving any therapeutic interventions for their back pain and from taking any back pain specific medications (pain relievers, anti-inflammatories, muscle relaxers) 12 hours prior to study participation. All participants were asked to maintain their usual level of physical activity 24 hours prior to study participation.
MyotonPRO Measurements
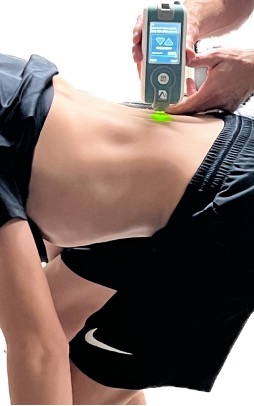
Stiffness measures were obtained using a single measure with the single tap mode of the MyotonPRO to reduce the time required to obtain the measurements in the deadlift position. A previous study found good to excellent test-retest reliability (intraclass correlation coefficients = 0.81 to 0.97) using this method in the same muscles and body positions.29 Muscle stiffness measures were acquired by the examiner positioning the probe of the MyotonPRO perpendicularly on the belly of the targeted muscles at the recommended locations.40 The examiner lowered the device into measurement range which was identified by illumination of a green light on the device (Figure 2).41 A quick (15 ms) and light (0.4 N) device-initiated mechanical impulse force was transmitted through the probe, causing the targeted tissue to respond with a damped oscillation that was registered by the device accelerometer.41 The tissue’s stiffness measurement (Nm) was computed and displayed on the device screen.23

Standardization of Measures
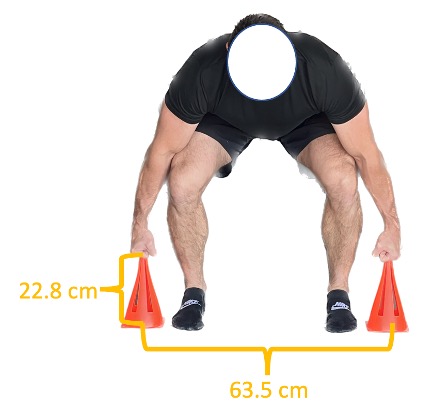
Measures were first obtained in the lying (supine and prone) position then measured in the standing and trap bar deadlift positions. Lying measures were obtained in supine for the VL muscle and in prone for the BF, LM, and LT muscles. Prior to collecting stiffness measures, trunk angles were collected with an inclinometer at the T12 spinal segment in both the standing and deadlift positions to assess for spinal angle differences between groups. Lying and standing measures were collected in the same order (VL, BF, LM, LT) whereas the deadlift measurements were randomized to account for a possible order effect. Standing measures were obtained with the participants standing with a cone positioned between their feet to standardize stance width. Plastic cones were used to simulate the width and height of trap bar handles to prevent participants from lifting or resting on the trap bar while in the deadlift position (Figure 3). Participants were positioned between two cones that were 63.5 cm apart (width of the trap bar handles). Participants self-selected a stance width that was most comfortable for them to achieve the trap bar deadlift position. The stance width was recorded and maintained for all subsequent deadlift repetitions. Participants were required to squat to a depth that allowed them to contact the top of the cones with closed fists. The height of the cones (22.8 cm) was selected because it is the approximate height of the top of a trap bar handle when loaded with bumper plates. Furthermore, it was reasoned that abnormalities in muscle stiffness were most likely to occur when LBP participants were in the starting position of the deadlift where the highest spine loads have been shown to occur.42 Participants were required to squat and hold the trap bar deadlift position for approximately 2-5 seconds during four separate repetitions while the examiner obtained muscle stiffness measures on each muscle.

Statistical Analysis
Data analyses were performed using SPSS, version 28.0 software (IBM Corp, Armonk, New York) and included data from all 68 participants for the VL, BF, LM, and LT for the relaxed and deadlift positions and the LM and LT for the standing position. Sixty-eight participants ensured at least 80% power to detect an effect size of 0.7 (28 Nm) between groups when using a 2-tailed alpha of .05. Baseline characteristics were summarized by treatment group and compared with independent t-tests for parametric data and Mann-Whitney-U and Chi-squared tests for categorical and dichotomous data, respectively. Variables that were significantly different per group were used in linear regression analyses with each muscle stiffness outcome to assess for use as a covariate. Variables that were statistically different between groups and linearly related to the dependent variable were used as covariates. Additionally, variables such as physical activity that have demonstrated a linear relationship with muscle stiffness20 were assessed for use as a covariate with linear regression analyses. Separate analyses of covariance were conducted to compare absolute and relative (percent-muscle stiffness change from the relaxed to the standing and deadlifting positions) muscle stiffness measures between the groups for each muscle and condition. Percent-muscle stiffness change was calculated for each muscle of interest for the standing and deadlift conditions with the appropriate formula ([standing or deadlift stiffness – lying stiffness]/lying stiffness x 100). Finally, t-tests were used to compare trunk angles and stance widths between groups.
RESULTS
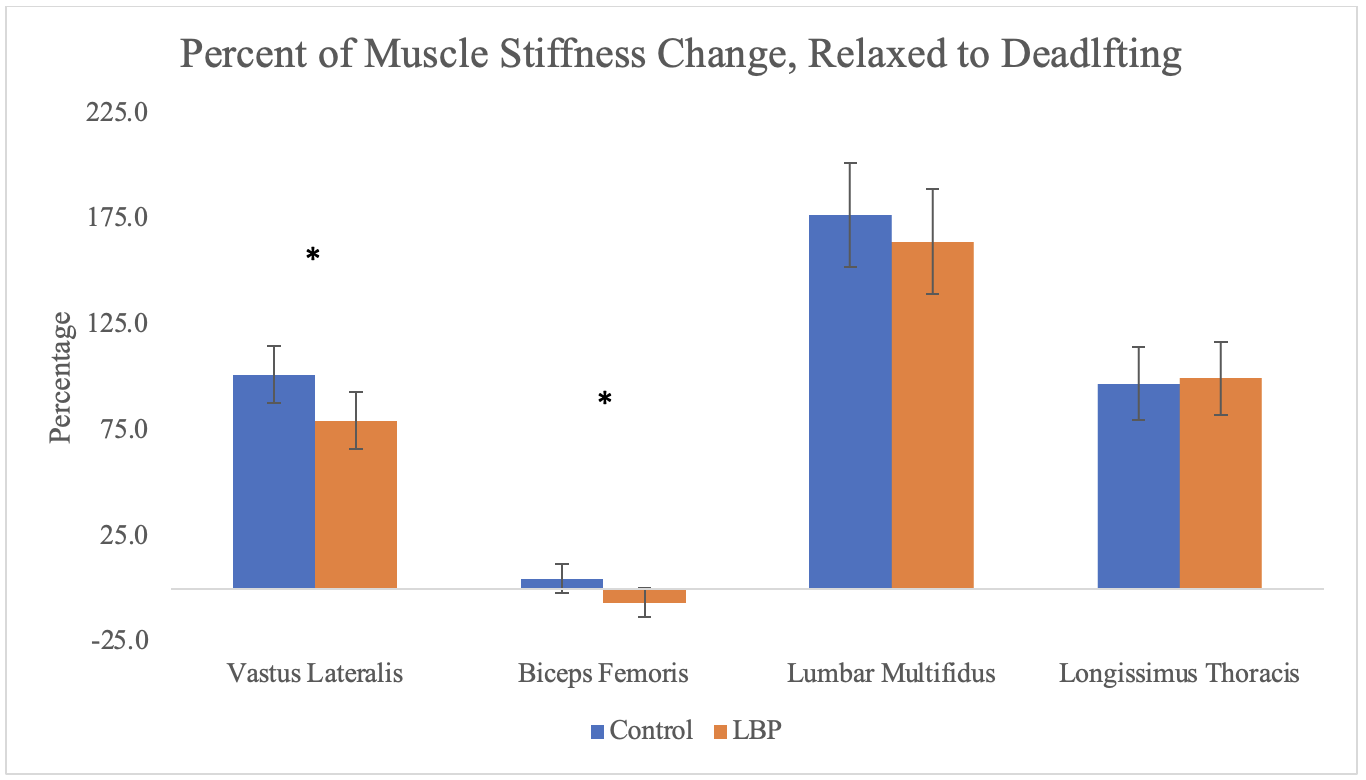
Table 1 displays demographic, physical activity, pain, and low back disability data for each group. Sex and physical activity were identified as significant covariates. Comparisons of adjusted means and 95% confidence intervals (CI) are displayed for each muscle across the three conditions in Table 2. The only difference between the two groups was in the VL muscle with the LBP group demonstrating a higher adjusted mean stiffness of 22 Nm (95% CI, 0.21 to 43.8) in the relaxed position. Table 3 and Figure 4 displays percent-muscle stiffness changes that occurred as participants transitioned from the relaxed to the standing and deadlift positions. There were no significant differences in percent-muscle stiffness change between the lying and standing positions between the two groups. Within the trap bar deadlift position there was a significantly greater increase in the percent-muscle stiffness change that occurred in the VL (p = .029, 21.9%) and BF (p = .024, 11.2%) muscles in the control group than in the LBP group. No between group differences were identified for standing and deadlifting trunk angles or for deadlifting stance widths (p-value range = .205 to .573). Mean LBP intensity was 4/10 (SD = 2) for each body position and 11 (32%) of the participants with LBP reported at least a 1-point increase in pain when they were in the deadlift position.

DISCUSSION
Little is known about how thigh and trunk muscle stiffness behave in individuals with LBP under loaded conditions. The results of this study demonstrate that in young, physically active adults with moderately disabling LBP, stiffness of the VL, BF, LM, and LT muscles are not statistically different than healthy controls during standing and deadlifting positions. Although significant percent-muscle stiffness increases were found in the control group for the VL and BF muscles for the deadlift position, these increases were modest and within measurement error.29 These findings contribute to the growing body of literature regarding how muscle stiffness relates to LBP and how myotonometry may be used to monitor for neuromuscular deficits that have been difficult to reliably quantify with other clinical methods.43 Furthermore, these findings have important implications for rehabilitation providers managing physically active individuals who have LBP and will be returning to deadlift training and/or performing similar deadlift-like movements upon completion of rehabilitation.
The lack of statistically significant differences in muscle stiffness between the two groups across all conditions was not an expected finding. Earlier studies have shown increased erector spinae stiffness in those with LBP and demonstrated that muscle stiffness was positively related to pain scores and negatively related to function.27,30 In contrast, this study found no between group differences for LM or LT stiffness in the relaxed condition despite the participants with LBP exhibiting higher levels of LBP-related disability than in previous studies (Table 1). However, it is worth highlighting that in younger individuals with LBP, Ilahi et al.30 found that only females demonstrated an increase in relaxed erector spinae stiffness compared to age- and activity-matched controls. Moreover, Wu et al.27 found statistically significant increases in a mixed-sex group of elderly with LBP, but the mean muscle stiffness differences (42.1 Nm) between the healthy and LBP groups did not exceed minimal detectable differences reported in their study (47.2-50.2 Nm). The inconsistency in findings clearly highlights that further research is necessary to better understand the relationship between lumbar musculature stiffness and LBP.
The hypotheses that participants with LBP would demonstrate differences in the standing and deadlift postures was also mostly unsupported by the results. Movement and motor control impairments are known to occur secondary to pain.44,45 Thus, it was expected that LBP symptoms would be exacerbated under these relatively loaded conditions, leading to compensatory motor control strategies that would manifest as altered stiffness in the muscles of interest. The absence of muscle stiffness differences in these positions suggests there may have been an insufficient level of pain intensity and/or LBP-related disability to result in muscle dysfunction. It is also possible that the MyotonPRO measures were not sensitive enough to detect mild differences that may have been present between the two groups. Specific to the deadlift position, pain data analysis demonstrated that only 32% (n = 11) of the LBP group reported an increase in pain while they were in the deadlift posture. Furthermore, only two participants reported a 2-point increase in pain that is necessary for clinical significance.34 Though speculative, it may be that a compensatory deadlift posture (e.g. adopting a more upright trap bar deadlift set-up) may only be found in individuals who experience a clinically meaningful increase in LBP symptoms that are specific to the deadlift set-up position. Another explanation could be that individuals with mild to moderate levels of spinal pain and disability only demonstrate compensatory trap bar deadlift mechanics with deadlift attempts of higher intensities. Future studies should seek to answer these questions as they could help to further clarify when individuals with LBP may be safe to return to deadlift training and at what capacity.
This is the first study to use muscle stiffness to determine inter-muscular load sharing percentages while performing a variation of the deadlift. Figure 4 and Table 3 demonstrate the relative change in muscle stiffness as participants transitioned from the lying (relaxed) position to the deadlift position. The substantial increases in stiffness for the VL, LM, and LT muscles suggests that these muscles are important force producing muscles during performance of the trap bar deadlift. These results are supported by previously recorded deadlift muscle activation patterns measured with EMG,38 and demonstrates the versatility of myotonometry as a method to estimate individual muscle contributions (through the surrogate of muscle stiffness) to a compound movement such as the deadlift.
Finally, this is the first study to compare performance of a deadlift variation between healthy and LBP cohorts using muscle stiffness as an outcome. The results are largely consistent with a similar study that used force production and EMG to compare isometric deadlift performance between individuals with and without LBP.16 Stock et al.16 demonstrated that individuals with acute, non-specific LBP had the same force output and muscle excitability patterns as healthy controls. Collectively, these findings suggest that within young, active individuals with mild to moderate pain levels and LBP-related disability, deadlift variation training may be able to be performed without any added concern for re-injury secondary to lumbar spine or lower extremity neuromuscular impairments. Additionally, this study adds to the growing body of literature evaluating if and how myotonometry may be a useful clinical method to assist clinicians with detecting neuromuscular deficits.
Limitations
The present study had several important limitations. First, the generalizability of this study is limited to young, active individuals with mild to moderate levels of LBP-related disability. Similarly, the deadlift variation used in this study was specific to the trap bar and the starting (“initial pull”) position of the lift and therefore does not apply to other deadlift variations, positions, or to dynamic movements. Additionally, the deadlift inter-muscular stiffness percentages identified in this study occurred under minimal load (body weight) and may not accurately represent individual muscle contributions as isometric deadlifts are performed at higher intensities. Finally, the MyotonPRO measurements are limited by subcutaneous fat thickness that exceeds 2 cm and can only target superficial tissues that can me palpated.31 Despite attempts to combat these limitations by requiring participants to have BMIs less than 30kg/m2 and using recommended muscle stiffness measurement locations it is possible that fat, non-target muscle, and fascia located over the target muscles may have interfered with some muscle stiffness measures.
Conclusion
The results of this study indicate that no significant differences in muscle stiffness exist between participants with LBP and healthy controls in the lying, standing, or deadlifting conditions. Although differences in percent-muscle stiffness changes were noted between groups for the deadlift position, the differences were within measurement error. Future studies should seek to expand on these findings by using myotonometry to further investigate the relationships between muscle stiffness and deadlift performance in LBP populations of varying degrees of pain and/or disability.
Conflicts of interest
The authors report no conflicts of interest.