INTRODUCTION
The incidence of shoulder injuries in contact and collision sports is high with potentially career-ending consequences.1 The shoulder is the most commonly injured peripheral region in rugby union,2,3 and high force collisions are commonplace.4 Common positions of shoulder injury in contact and collision sports are well documented.5,6 Reaching out to grab an opponent with the arm elevated, horizontally abducted, and externally rotated places stress on anterior shoulder structures and can result in an anterior shoulder dislocation.4,7 Falling on an outstretched arm with the arm extended out in front5,8,9 or blocking with arms fully extended in American football, produces an axial load through the humerus causing a posterior shear force and can result in a posterior shoulder dislocation if adequate force is applied.10 These collision sports apply a great deal of stress to the shoulder which is why regaining adequate stability is necessary before return to sport.
Following an injury, the goal of rehabilitation is to restore athletes’ function to previous levels and provide safe return to play. However, the high rates of recurrent shoulder injuries in rugby (75%) suggest that current rehabilitation strategies are sub-optimal.1 Rehabilitation consists of exercise prescription which incrementally increases stress and load to contractile and non-contractile tissues, in order for the tissues to adapt.11 Significant electromyographical (EMG) research exists that helps guide clinicians in exercise selection to ensure activation and strengthening of the necessary musculature.12–14 Additionally, knowledge of the forces and moments at the shoulder could help guide exercise selection and return to play. During the functional phases of rehabilitation, exercises are selected to gradually expose the athlete to greater joint loads and provocative positions that challenge joint stability. It is critical that the loads produced by these exercises are understood so they can be incorporated appropriately into rehabilitation and return to sport testing. Thus, ensuring the appropriate direction and magnitude of stress is applied to the joint.
Vertical ground reaction forces (VGRF) have been studied during upper extremity functional tests.15,16 However, VGRF does not specifically describe the forces at the shoulder. Biomechanical modelling using inverse dynamics allows the calculation of forces and moments in six degrees of freedom at a joint. Clinicians could use this information to choose functional performance tests that stress shoulder tissues at the appropriate level and direction. The (SHR) and (LH) tests are reliable upper extremity functional tests that replicate positions of anterior and posterior shoulder instability.17 However, it is not known what biomechanical forces, moments, and muscle activation levels are produced during these tests. Therefore, the purpose of this study is to describe the shoulder forces and muscle activation levels during closed chain functional tests of the SHR and LH tests. This study provides clinicians with specific information regarding the shoulder forces and muscle activation in key musculature around the shoulder during the SHR and LH tests to assist with return to play decision-making for a patient with shoulder instability.
METHODS
Participants
This clinical laboratory observational study recruited 10 asymptomatic participants (age 25±4 years, height 172±8cm, mass 71±13kg) between August and November 2017. All participants were right-handed, and instrumentation and testing were performed on the dominant shoulder. Participants were included if they were able to perform five full push-ups. Participants were excluded if they had a history of upper extremity injury or surgery within the prior two years. Prior to testing, the study was explained to the participants, and they had an opportunity to ask questions before signing a consent form approved by the University of Kentucky’s Institutional Review Board. Age, body mass (kg) and height (m) were recorded.
Study Procedures
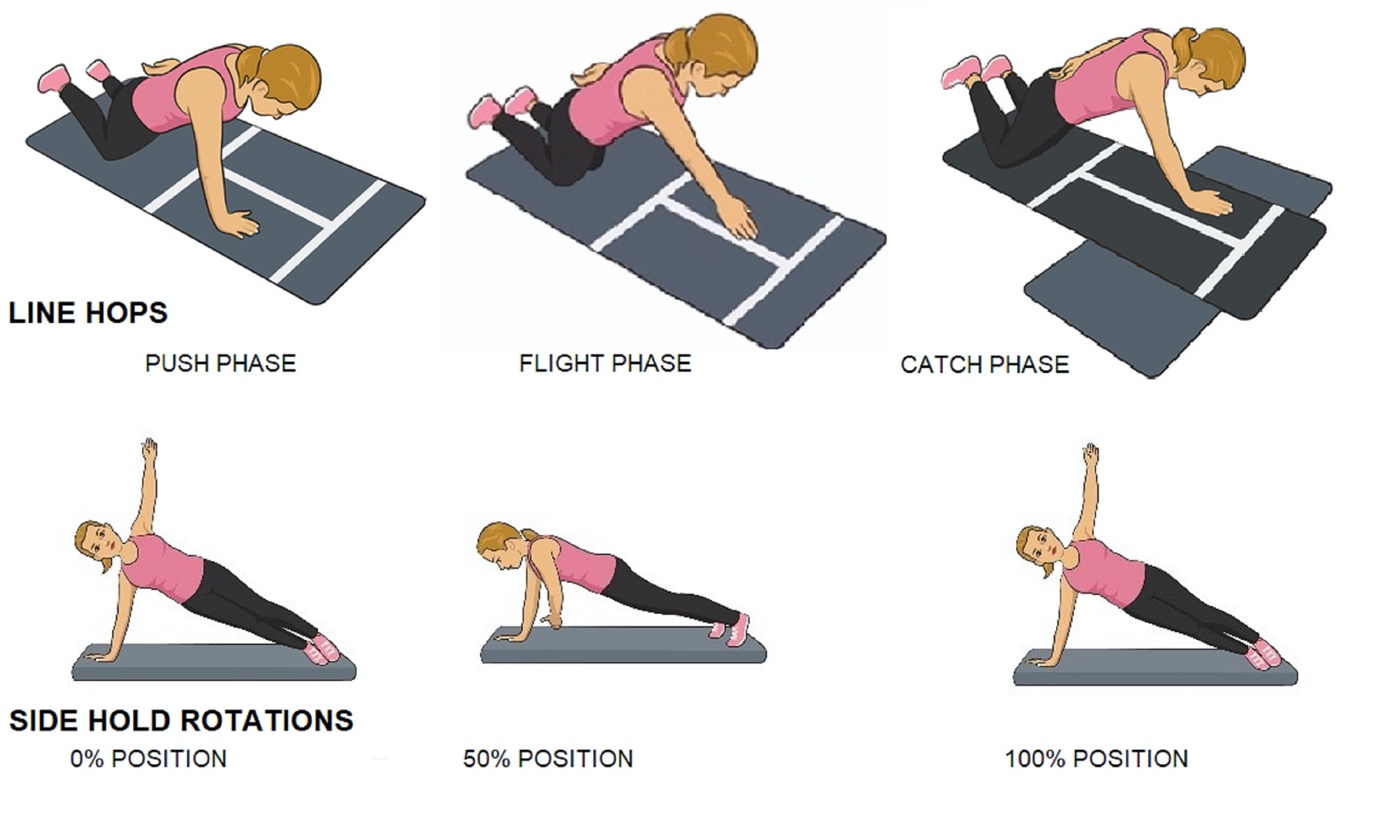
The LH and SHR functional tests (Figure 1) were performed in a biomechanical laboratory to measure electromyographical (EMG) shoulder muscle activity. Forty reflective markers were applied to bilateral upper extremities and trunk to record kinematic trunk, shoulder, elbow, and wrist motions in order to calculate shoulder forces and moments using inverse dynamics. This study describes the direction and amplitudes of shoulder forces during functional testing.

EMG Electrodes Application and Normalization
Five bipolar 4-contact surface EMG sensors (Trigno, Delsys Inc. Natick, MA) with an inter-electrode distance of one cm were applied to the subjects’ dominant right anterior deltoid, and serratus anterior using standard procedures (Appendix).18 Three muscles (supraspinatus, infraspinatus, and subscapularis) were instrumented with two sterile intramuscular fine wire electrodes each. Bipolar fine wire electrodes were placed in the muscle belly with an inter-electrode distance of 1cm using a two separate needle sticks per muscle.19 All EMG electrodes, leads, and wireless transmitters were taped down using double-sided tape and paper tape to minimize movement artifact. Electrode placements and maximal voluntary isometric contractions (MVIC) test positions are detailed in Appendix. Five second MVIC contractions were performed three times for each test position. A 60 second rest was given between each maximal effort for muscle recovery. The order of muscle testing was randomized.
Kinematic Markers
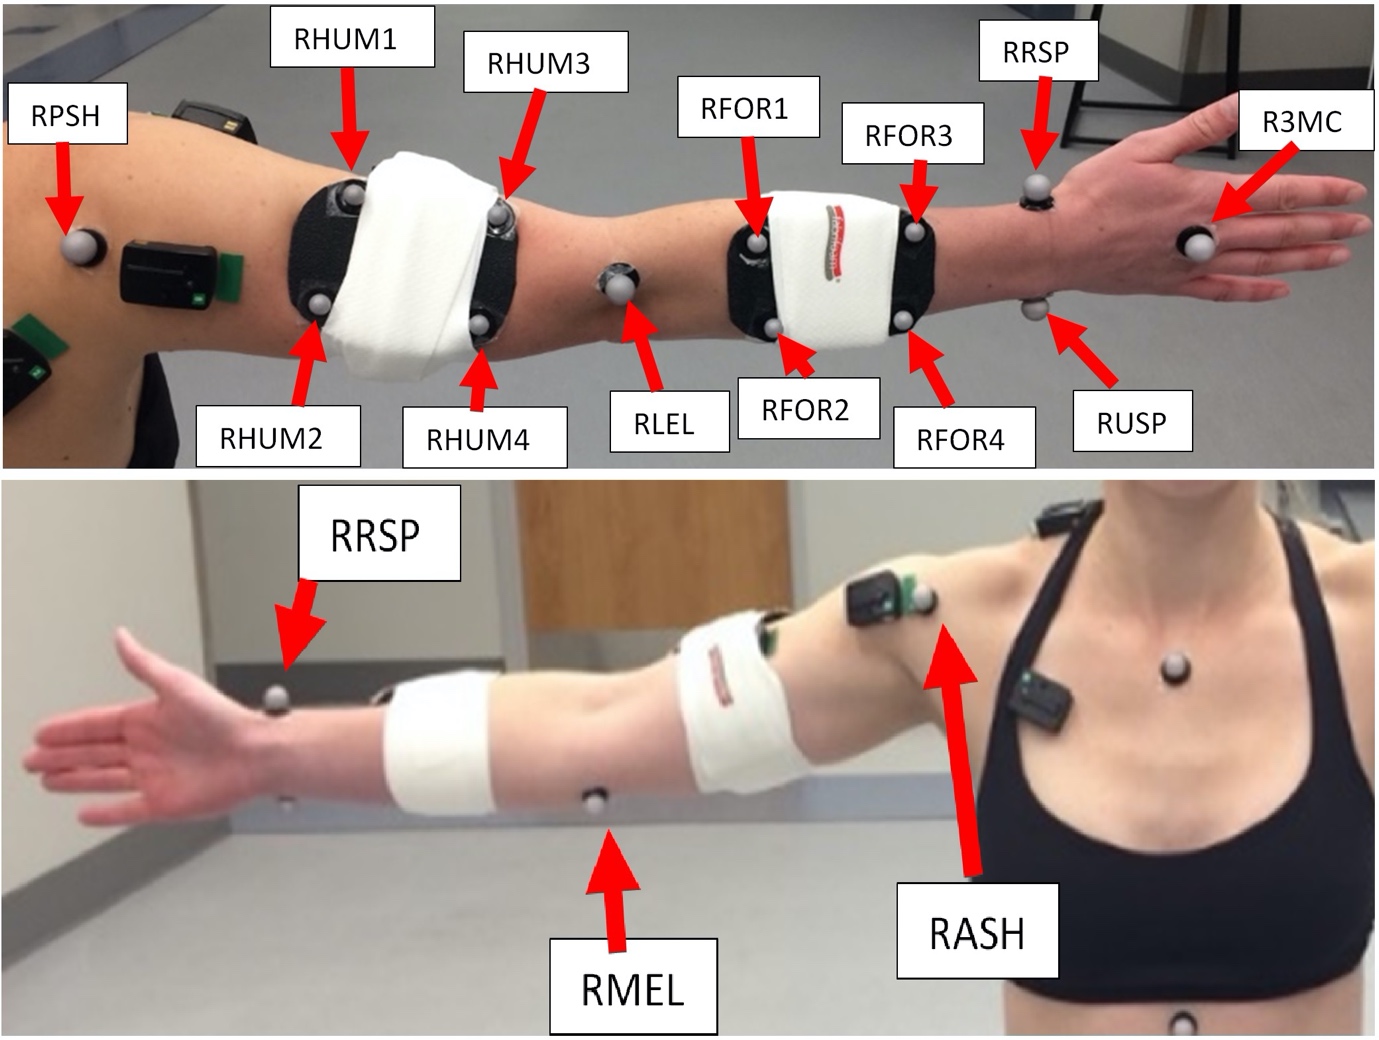
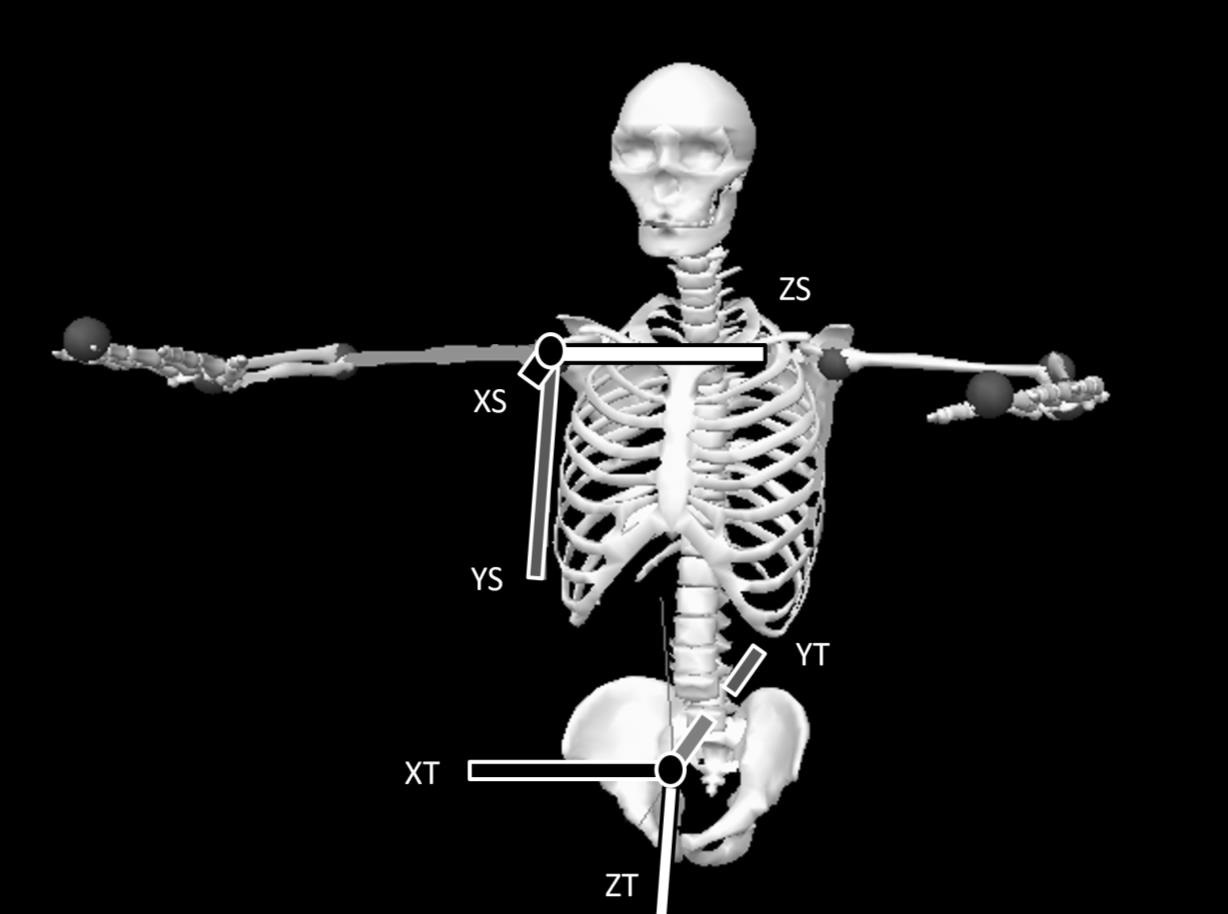
Forty reflective markers were attached with double-sided tape to a set of standardized anatomical locations (bilaterally on the anterior superior iliac spine, sternal notch, xiphoid process, spine of the 7th cervical vertebrae (C7), spine of the 8th thoracic vertebrae (T8), left 12th rib over the kidney and bilaterally on the anterior and posterior humeral head, medial and lateral humeral epicondyle, radial and ulnar styloid process, and the head of the third metacarpal).20 Clusters of four markers were placed on bilateral forearms, and upper arms, and a cluster of three-markers placed on the sacrum with elastic strapping (Figure 2). Static calibration was performed with arms abducted to 90° and elbows flexed to 90°, captured using the coordinate system defined in Figure 3.


Functional tests
Participants performed two functional tests, the LH and SHR tests (Figure 1) in random order. These tests have been described previously as part of the Shoulder Arm Return to Sport battery.17 The SHR test is performed by having the participants start in a side plank, weight bearing through an extended arm, with the shoulder in horizontal abduction. Participants then rotate their body into shoulder horizontal adduction and back. The LH test is single arm hop back and forth over a 2.5cm line in a kneeling position with hips extended. Each participant performed five repetitions of each test. Due to time variation for each repetition, data were time normalized with a 0-100% time window.
Each functional task was divided into phases to evaluate EMG and force data. The SHR test was divided into four phases: 0%, 50% and 100% occurring when right horizontal abduction/adduction shoulder velocity was zero, while 25% and 75% were halfway points between zero shoulder velocity. The participant started and ended in maximal horizontal abduction. The LH test was divided into three phases: Flight phase commenced when there was no load (<10N) on the force plate. Catch phase commenced when the force plate was loaded at >10N. Push phase commenced halfway between the start of catch and the start of flight.
Data Analysis
Kinematic and Kinetic Data Analysis
The three-dimensional kinematics of the trunk and upper extremities were measured with twelve high speed infra-red video based three-dimensional motion capture system (Vicon Inc., Oxford, United Kingdom) synchronized with Bertec force plates (Model 6090, Bertec Corp., Columbus, OH). Three-dimensional marker trajectories were collected at a sampling frequency of 200Hz and raw force data from the force plates were collected at a sampling frequency of 2000Hz. Nexus software (Vicon Inc., Oxford, United Kingdom) was used to record time synchronized marker trajectory, force plate, and EMG data. Raw marker trajectory data were filtered using a low-pass Butterworth filter with a cut off frequency of 6Hz. Raw force and moment data from the force plates were filtered using a low-pass Butterworth filter with a cut-off frequency of 50Hz. Body segment (hand, forearm, humerus, and torso) inertial parameters were estimated using regression equations described by Dumas et al.21 Body mass (kg) and height (m) for each subject individually were taken into all 3D calculations to account for individual differences. Distal to proximal joint forces and moments were calculated via inverse dynamics using Visual 3D (v6 professional, C-motion INC., Germantown, MD, USA). All force and moment data were calculated as external to represent the net forces or moments acting on the shoulder during the tasks. Shoulder force and moment directions were reported relative to the thorax coordinate system (X: Right, Y: Posterior, Z: Inferior, Figure 3).
Through the entire movement, shoulder moments and forces were captured. The joint coordinate data relevant to mechanisms of anterior and posterior shoulder instability were selected. These included anterior/posterior, compression/distraction, and vertical ground reaction forces, and horizontal abduction/adduction moments. The kinetic data were ensemble averaged across participants.
EMG data analysis
All surface EMG data were collected at 1000Hz and 2000 Hz for indwelling electrodes. A notch filter was applied between 50-60Hz prior to the data being smoothed using a root mean square function with a 50 millisecond time window. During performance of all testing, the same processing was applied and all EMG data were represented as a percentage of maximal voluntary isometric contraction (MVIC).22 The average of the three highest 250ms during the five second muscle test represented 100% MVIC for each muscle.22 The average EMG amplitude for each muscle was calculated across each of the phases, during the performance of both functional tests. The ensemble average was calculated from each participant to represent the EMG amplitude for each muscle by phase.
Statistical Analysis
The ensemble average for kinetic data were calculated for anterior/posterior forces, compression/distraction forces, and horizontal abduction/adduction moments. The maximum values and their respective 95% confidence intervals were reported. Maximal vertical ground reaction forces were calculated for each test. The ensembled EMG data are presented as descriptive data using median and interquartile ranges due to small sample size.
RESULTS
Side Hold Rotations
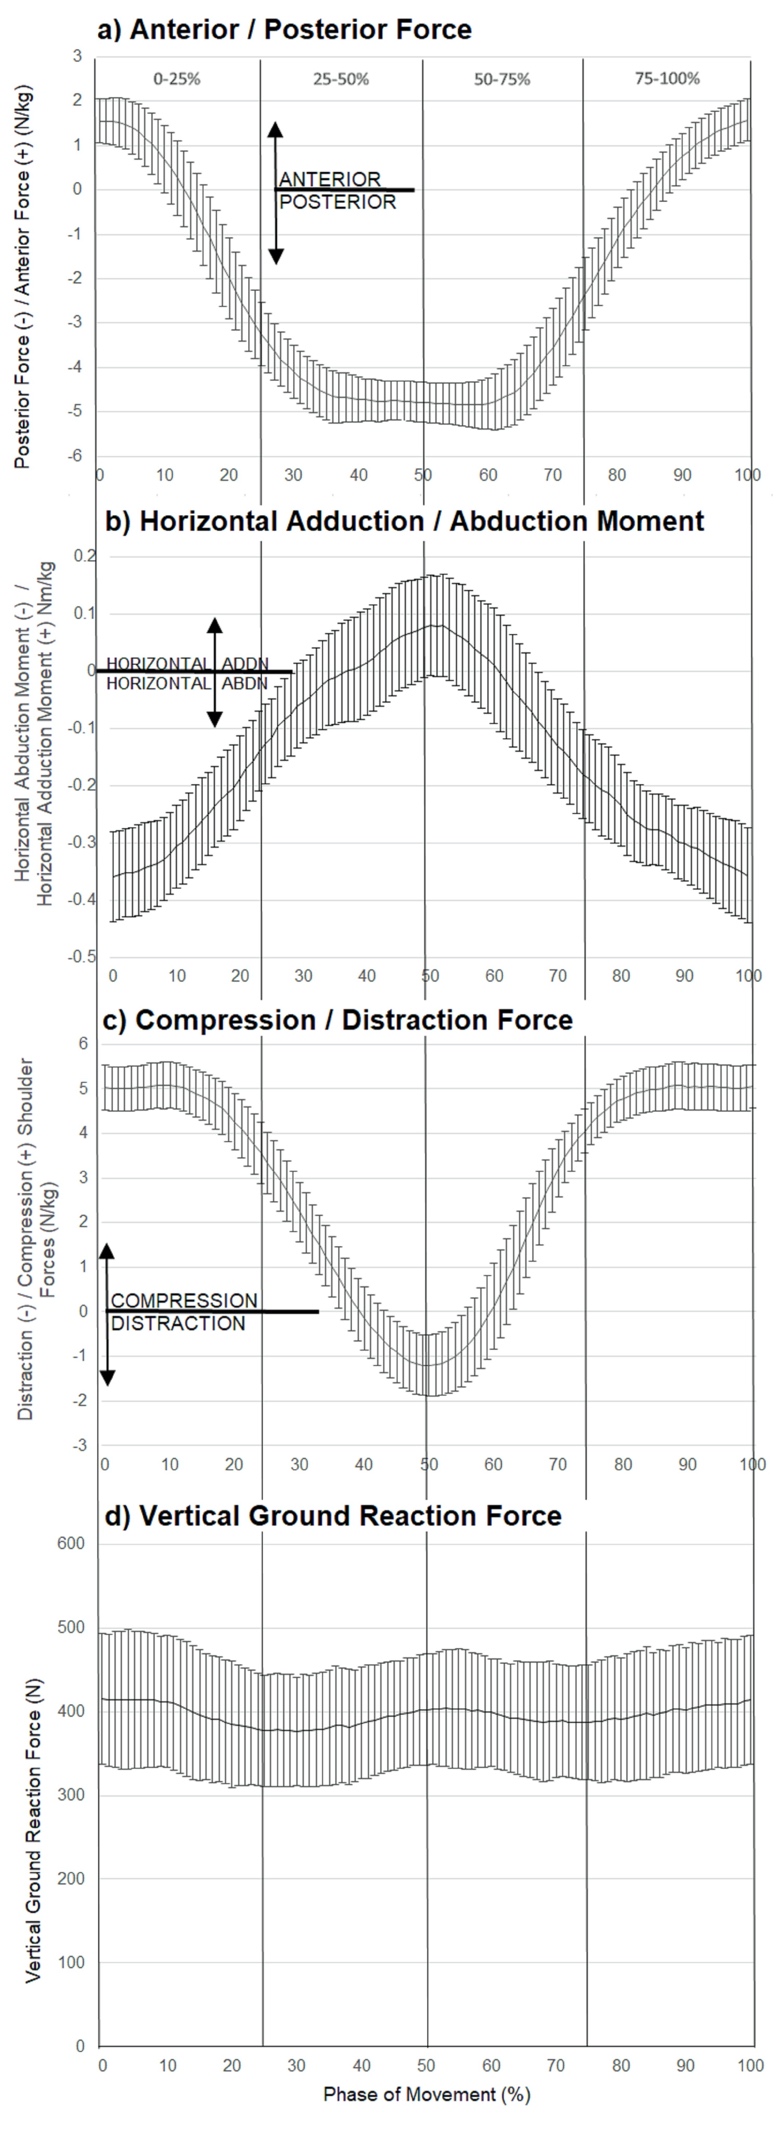
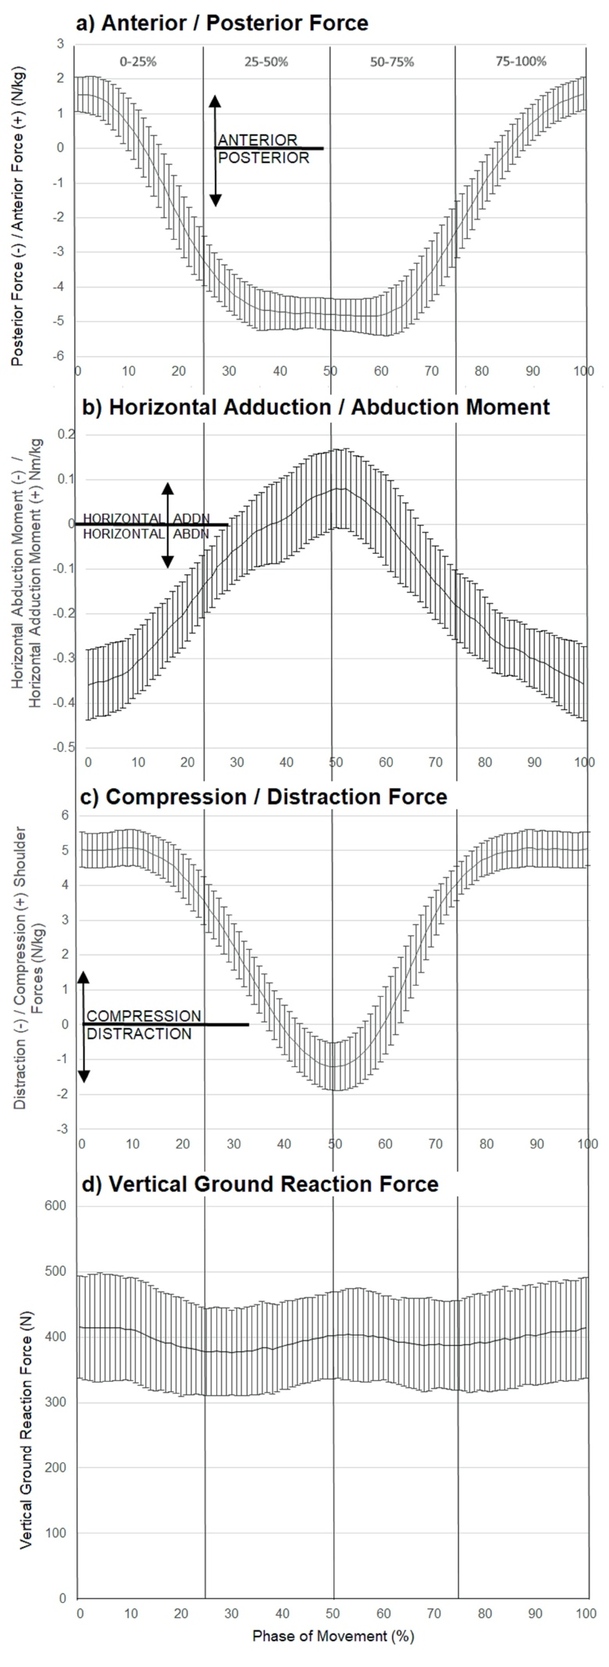
Maximum external posterior force was seen during the middle phase of the SHR test (4.84 N/kg, CI95 4.32-5.36N/kg). The maximal external anterior force was at the point of maximal horizontal abduction (1.57 N/kg, CI95 1.10-2.01N/kg). The maximal external compressive force (5.09 N/kg, CI95 4.45–5.61 N/kg) was at the beginning of the test movement. The SHR test also produced a horizontal abduction moment (0.36 Nm/kg, CI95 0.27–0.43 Nm/kg) at the beginning/end of the test movement (Figure 4). The maximum vertical ground reaction force (VGRF) was 415.26 N (CI95 366.59-463.93N) occurred at the beginning of the test movement (Figure 4).
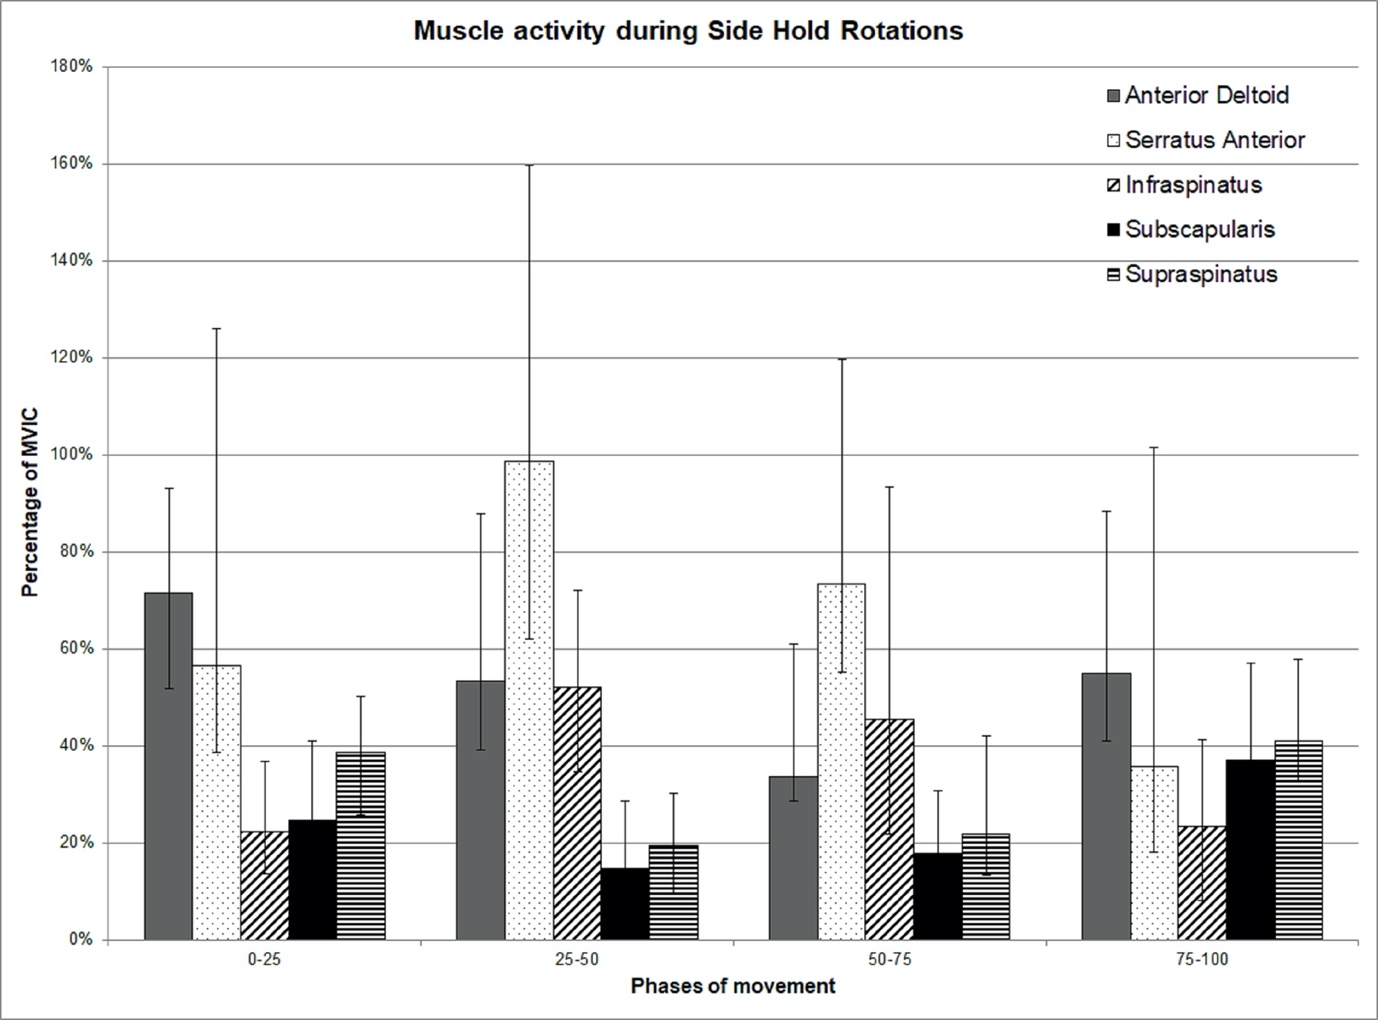
The highest levels of serratus anterior occurred in the middle phases of the SHR test, during phases 25-50 (98 %MVIC) and 50-75 (73 %MVIC). Similarly, high levels of infraspinatus were seen during phases 25-50 (52 %MVIC) and 50-75 (45 %MVIC). High levels of these muscles occurred when the maximal posterior forces and horizontal adduction moments were recorded. Subscapularis (37 %MVIC) and supraspinatus (41 %MVIC) appeared most active at the end (75-100 %MVIC) of the SHR test when anterior translational forces and horizontal abduction moments were high. Anterior deltoid (71 %MVIC) appeared most active at the beginning of the movement as the participant moved into horizontal adduction (Figure 5).

Line Hop test
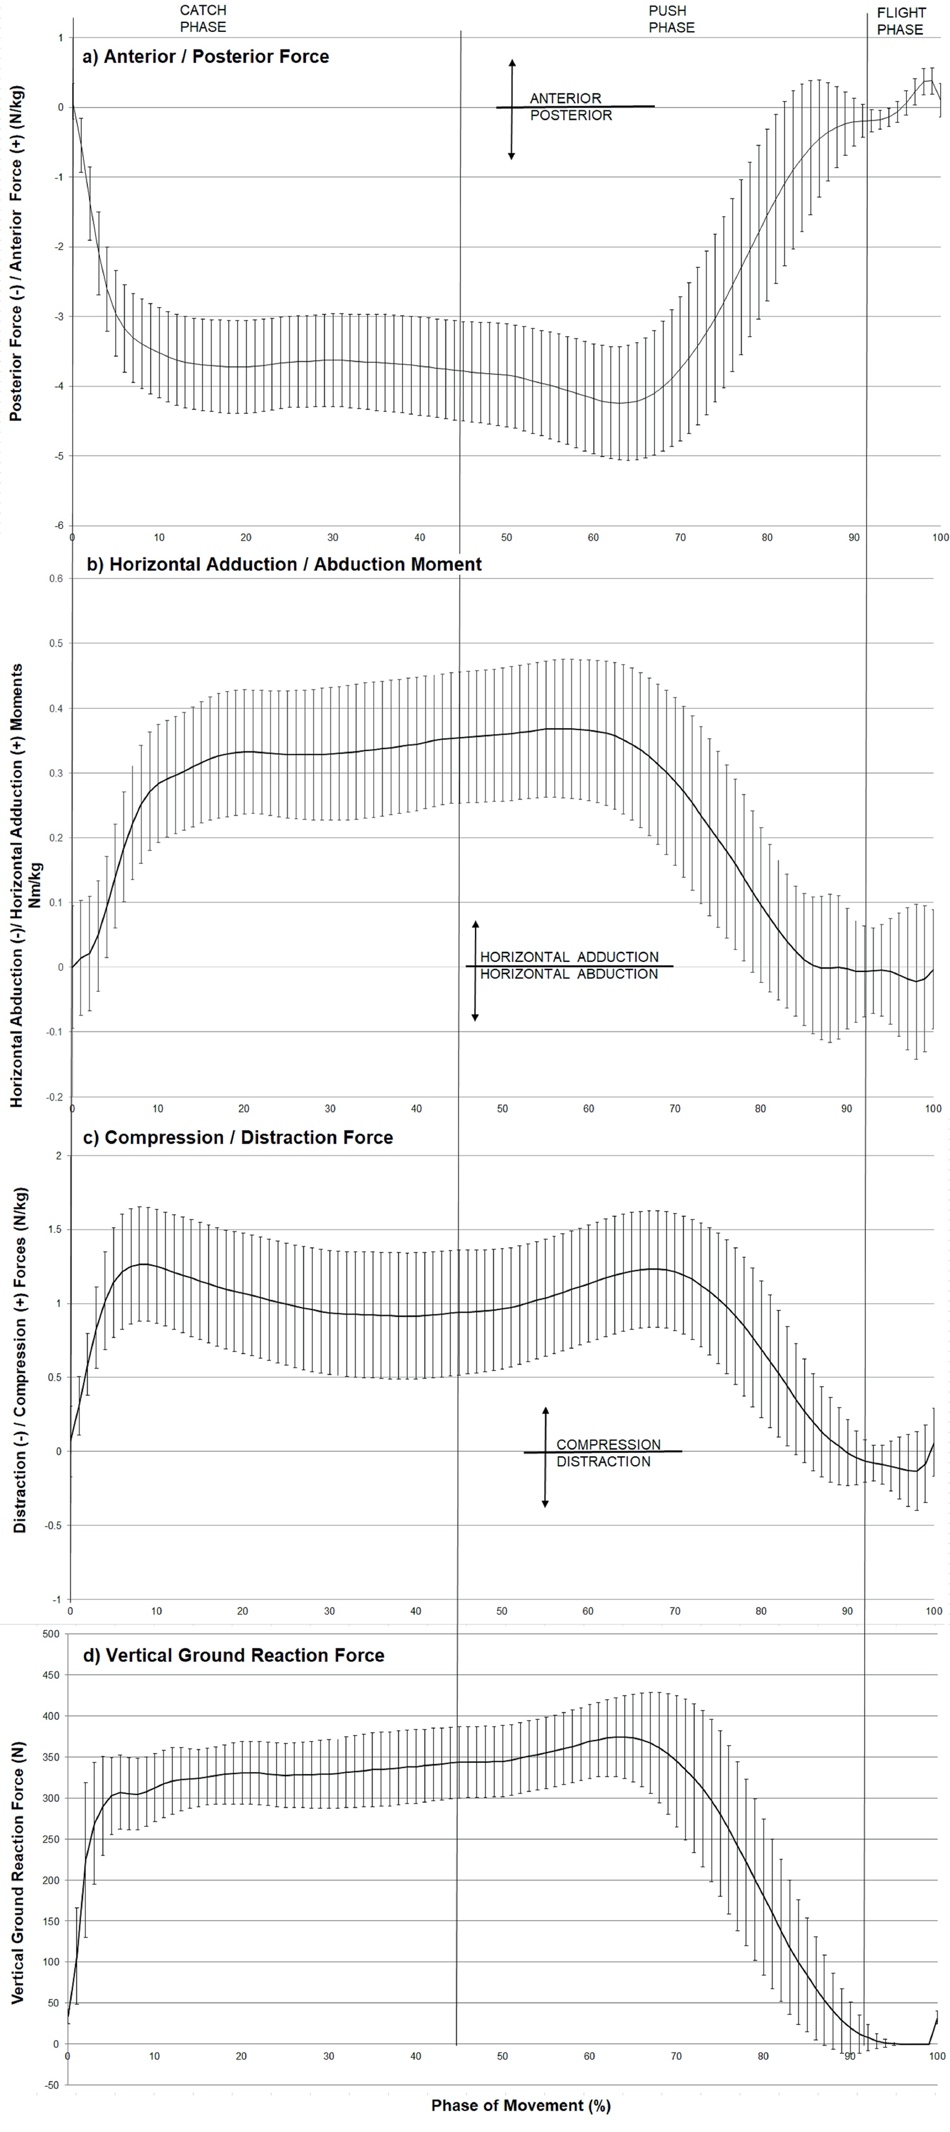
The LH Test produced considerable posterior force during catch and push phase with maximal force (4.25 N/kg, CI95 3.44–5.06N/kg) occurring simultaneously with maximal VGRF (374.24 N, CI95 323.74–424.74 N) (Figure 6). There were maximal compressive forces (1.26 N/kg, CI950.87–1.65 N/kg) and maximal horizontal abduction moments (0.09 Nm/kg, CI95 0.02–0.16Nm/kg).

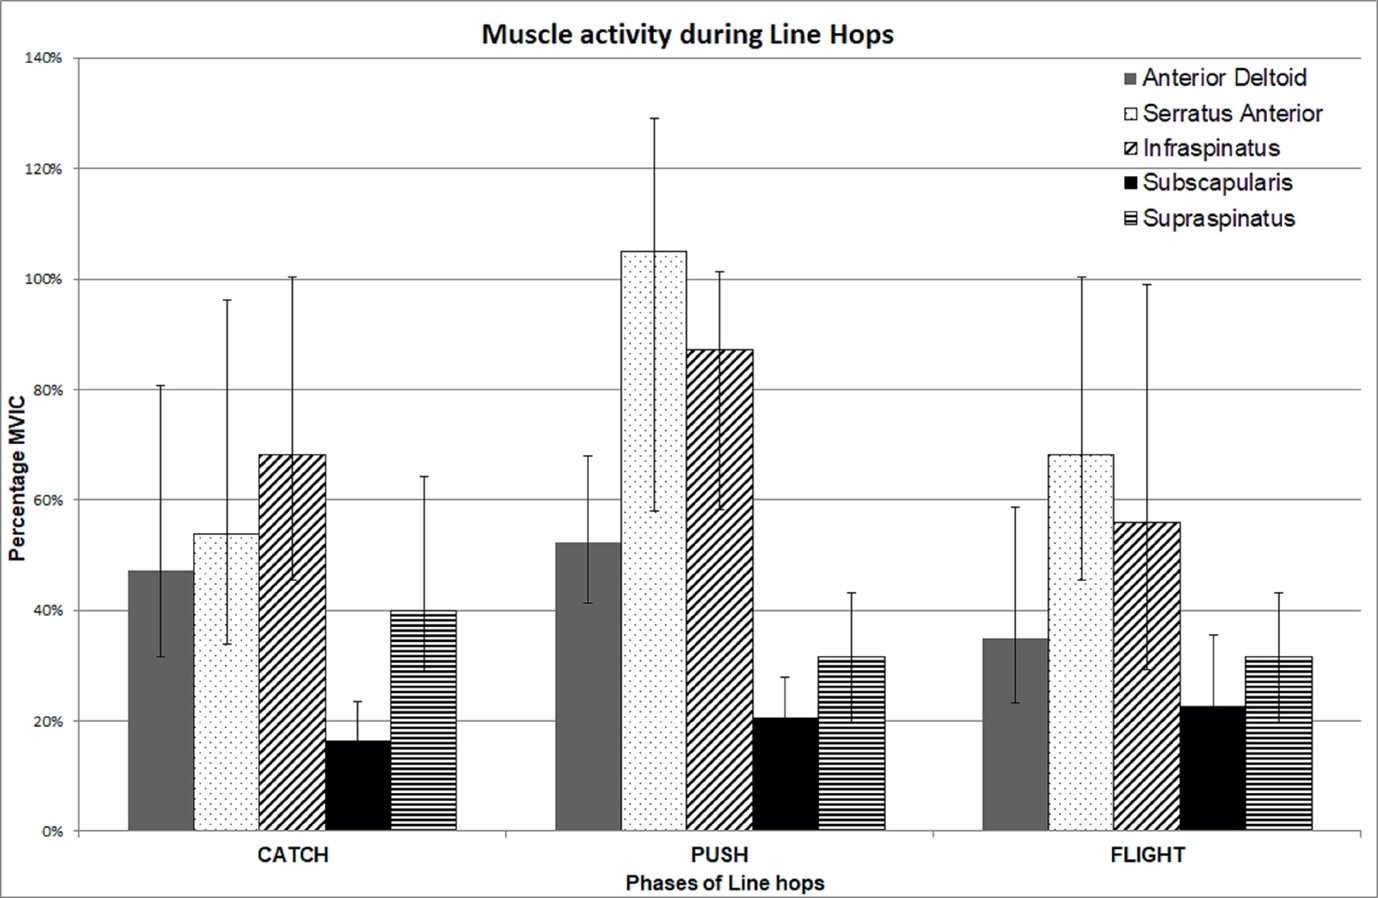
The highest levels of serratus anterior (105 %MVIC) and infraspinatus (87 %MVIC) activity occurred during the push phase of the LH test as participants pushed themselves away from the force plate (Figure 7). The anterior deltoid appeared most active during the push phase (52 %MVIC). Supraspinatus and subscapularis demonstrated relatively constant activity throughout the phases of the LH test (Figure 7).

DISCUSSION
This is the first study to calculate shoulder forces and moments using inverse dynamics during functional shoulder testing to better understand what stresses are applied to the shoulder. The goal of functional testing is to evaluate an athlete’s readiness to return to sport. The demands of contact sport are not well elucidated in the literature making direct comparisons impractical. The goal of this research was to provide clinicians with an appreciation of the demands occurring during two functional tests in order to match potential sport demands with functional tests. Incorporation of EMG data facilitates clinicians’ understanding of the muscles that are challenged during testing and what muscles may need additional strengthening if the subject fails testing. Both functional tests are single-arm closed chain tests that generated high loads as individuals must control a portion of their body weight. Both tests allow side-to-side comparisons.
The SHR test was designed to stress both anterior and posterior shoulder structures which are supported by the results. The peak anterior translation forces, horizontal abduction moments, and compression forces occurred at the beginning (0%) and ending (100%) portion of the test which was at the time of maximal horizontal abduction. This test is performed continuously, therefore these positions are the same. The highest levels of anterior deltoid, supraspinatus and subscapularis occurred during the phase 0-25% when horizontal adduction was initiated, and in 75-100% during deceleration of horizontal abduction. It appears these muscles are critical in both phases to control humeral position. These findings also agree with previous findings that the activity of the rotator cuff was specific to the direction of load.23–25 Cadaveric research has demonstrated that between 211-619N is necessary to anteriorly dislocate a shoulder.26 Comparison of the current study’s findings to these results required conversion of peak anterior translation force of 1.57 N/kg to 127N using the average body weight of the participants (71 kg = 696N). The anterior force (18%BW) is clearly below the threshold to cause dislocation, but the position of horizontal abduction is potentially provocative and would help clinicians identify if a patient has developed sufficient muscular stability and coordination to control these anterior translational forces.
The SHR test generated high posterior translational forces and horizontal adduction moments in the mid-point of the test when the weight bearing arm is in maximal shoulder horizontal adduction (Figure 1). Due to bodyweight loads, reduced compression forces at the shoulder, and horizontal adduction position, the posterior translational forces were three times higher than anterior translational forces. The greatest activation in this horizontal adduction position was observed in the serratus anterior and infraspinatus. The serratus anterior was active to support the individual’s bodyweight, which is consistent with previous pushing literature.27–29 The high muscle activity in this position is reasonable due to the single-arm push-up position of the patient, at this phase of the test. The increased infraspinatus activity was in response to external forces driving the humeral head posteriorly and reduced compression forces in the glenohumeral joint.
The LH test is a more dynamic test, requiring generation and absorption of landing forces as the individual pushes themselves over a line and back from their knees.17 The external force during this test is primarily directed in a posterior direction (Figure 6). The peak magnitude of both tests in a posterior direction were similar, even though the LH test (4.25 N/Kg = 301kg) was performed from a kneeling position while the SHR test (4.84N/Kg =343 Kg) was performed in a full push up position. Converting these normalized values to a clinically relevant value of percent of bodyweight revealed that both tests require a person to handle 43-49% of their bodyweight through one shoulder. When observing the peak magnitudes, the SHR test is greater, yet the dynamic nature of the LH test makes this test more demanding and more sport specific. The SHR test VGRF stayed relatively constant at 400N (Figure 4), while the LH test VGRF changed from 0-300N (Figure 6) at a steep rate of change, especially during the catch phase. The posterior shear force also dramatically increased during the catch phase, indicating rapid loading of the posterior structures of the shoulder. The explosive pushing and catching of the LH test resulted in greater rate of force development when compared with the SHR test. The VGRF created during the LH test approached previously documented VGRF levels during a simulated falling test (390N).30 Chiu and Robinovitch30 also positioned participants on their knees, where they fell forward to land on their right hand with their elbow straight, onto a force plate. Participants in that study fell a maximum of 5cm and the authors predicted that extrapolation to larger fall heights would not result in larger VGRF values. However, falling expectedly from knees to land on the hand, may not accurately represent the magnitude of the forces involved in falling unexpectedly from a standing position. The LH test may not reach the exact same demands during sport but challenges an individual’s ability to both generate and absorb forces through the shoulder in a similar direction as falling on an outstretched hand or blocking in American football.
The muscular recruitment of the serratus anterior during the LH test is comparable to the SHR test, with maximal activity recorded during the push phase of the test (105 %MVIC). This is consistent with previous studies describing high serratus anterior activity during a push up plus.28 Pushing the torso back-and-forth across a line one-handed, is more challenging than simply doing a push up plus motion. During high levels of shoulder posterior force in the LH test (Figure 6), there were high levels of infraspinatus muscle activity (Figure 7). Thus, the rotator cuff activity in the LH test also responded to load, in a direction-specific manner.23–25 It is proposed that infraspinatus stabilized the humeral head from translating posteriorly in response to the posterior translational force of the catch phase. Infraspinatus activity was greatest during the push phase while pushing approximately 40% of the individuals’ bodyweight off the ground. This increase was necessary to facilitate shoulder compressive forces to stabilize the glenohumeral joint.31,32 Clinical testing of the LH test involves completion of a maximum number of repetitions in one minute. The mean number of LH recorded in healthy college participants was 24,17 while elite and schoolboy rugby players achieved a mean score of 32 repetitions, and a maximum score of 66 repetitions.33 It is unknown the effect of multiple repetitions on the endurance capacity and fatigue of the muscle.
Comparison of this study’s findings was difficult due to limited biomechanical studies during functional tests, but a few do exist.15,16 Direct comparisons of VGRF were problematic due to methodological differences but comparisons can be drawn if average bodyweights are assumed. The Athletic Shoulder (ASH) test generated the greatest VGRF when the participant placed their arm in full flexion while laying prone describe as the “I” component and generated 1.59N/kg using the average weight of their participants which was 95kg.16 The peak VGRF has also been measured during the Closed Kinetic Upper Extremity Stability Test, where values of 0.68 N/kg were reported.15 Converting the peak VGRF produced in the LH test and SHR test yielded 5.3N/kg and 5.8N/kg respectively, based on the average weight of 71kg. Knowing the specific loads generated by tests and muscular activation levels allows clinicians to develop a logical progression to progressively increase demands on the shoulder to prepare them to return to sport demands.
Limitations
One of the limitations of this study is the small number of healthy participants with a relatively narrow age band. Use of previously injured athletes would improve external validity and provide some clinical relevance, as these tests are designed for athletes who are returning to sport from an injury but may also increase variability. However, the primary goal was to describe the maximum forces, moments, and muscle activity produced in these tests that may have stressed anterior and posterior shoulder structures. Another limitation was that participants were not instructed on how to land during the Line Hop test. The amount of elbow flexion during landing attenuates forces at the shoulder30 allowing for greater data variability but represents typical catching variations. In the SHR test, the participant was instructed to rotate as far as possible in horizontal abduction. The lack of specific arcs of motion obtained during the SHR test may account for the variation observed in EMG, force, and moment data. Additionally, the data reported were averaged from five trials not a complete one-minute test, so how these measures change over one minute is currently unknown and may demonstrate changes in muscle activation and mechanics over time. Finally, inverse dynamics does not isolate a specific ligamentous or musculotendinous structure to which forces are applied so it is not possible to determine the loads on a specific structure. Further research is needed to stress anterior shoulder structures, examine muscular contributions over a one-minute period and determine how fatigue affects these results. Longitudinal studies are also required to determine the ability of these tests to predict injury.
Conclusions
The kinetic and EMG analyses of these two clinical tests enable clinicians to understand and therefore choose appropriate tests for their patient’s needs. The posterior forces in both the LH test and SHR test were similar and peak values were approximately half of the participants’ bodyweight, indicating high levels of stress on posterior structures. Anterior forces were greatest at end range of horizontal abduction of the SHR test, primarily stressing the anterior GHJ structures. The LH test is a more dynamic task as demonstrated by changes in rate of force development compared to the SHR test. The weight bearing nature of both tests activated the serratus anterior to near maximal level while the infraspinatus was most challenged when external posterior translational forces were greatest. The forces and moments of these tests are higher than those reported in previous research and may simulate loads experienced in contact and collision sports. This biomechanical approach allows clinicians to examine specific information about these tests so they undertake assessments that will match the needs of their patient to return to sport or function.
Conflict of Interest
All authors declare no conflicts of interest.