Introduction
Variations of small-sided games (SSGs) of soccer can induce different tactical, technical, physical, and physiological responses in players (Aslan, 2013; Koklu, 2012; Sarmento et al., 2018). Coaches and physical trainers can achieve specific training goals by modifying SSG configurations such as rules, the number of players per team, pitch size (length x width), and the playing area, according to the expected responses from each SSG format. For example, the use of floaters has been reported to increase a team’s ability to improve ball possession (Praça et al., 2020) and the 2-touch rule increased the team’s cooperation (Sousa et al., 2019). From a physical point of view, the reduction in the number of players per team results in higher exercise intensity with accompanying increases in blood lactate concentration (Köklü et al., 2011).
A large number of studies on SSGs have investigated players’ responses to different numbers of players and/or modified pitch sizes (Sarmento et al., 2018) and often discussed the potential impact of the ‘available area per player’ (i.e., relative area) on the demands of SSGs (Castellano et al., 2015). Indeed, several studies have supported the idea that a larger relative area increases the physical and physiological responses of soccer players during SSGs (Castellano et al., 2015, 2016), with higher values for total distance covered as well as higher mean and maximum heart rates in youth athletes. These results may be related to the increased available area per player which may have induced players to protect a larger area during defence, as well as to cover a larger distance and reach higher speeds during offence and transitions. Nevertheless, as there is currently a dearth of corroborating evidence, it remains unclear whether the relative area of SSGs can be considered a determining factor of the physical and physiological responses of soccer players during games with distinct configurations.
Some of the factors which can influence the relative area have been investigated in previous studies such as the numbers of players per team (Aguiar et al., 2013), the pitch size (Goto and King, 2019), the presence or absence of floaters (Lemes et al., 2020), and the presence or absence of goalkeepers (Gaudino et al., 2014). The lack of control of the relative area, defined as the ratio between the total playing area (width × length) and the total number of players on the pitch, may be a confounding factor which prevents the formation of clear conclusions about the independent variables considered in the studies. Standardisation of the SSG relative area may therefore be necessary to avoid bias when comparing player responses between two distinct SSG formats. Control of intervening variables, such as the relative area, seems to be essential for scientific investigations of SSGs to isolate the effects of independent variables (e.g. pitch size, presence of floaters or goalkeepers).
Systematic reviews can provide relevant information on inconclusive topics and serve as guidelines for future research (Shamseer et al., 2015). Some systematic reviews on SSGs have comprised general issues such as the impact of different SSG configurations on the physical/physiological, technical, and tactical responses (Bujalance-Moreno et al., 2019; Clemente and Sarmento, 2020; Clemente et al., 2020, Sarmento et al., 2018). However, these reviews have not addressed specific topics related to SSGs such as the aforementioned absence of standardization of the relative area. This variable may be considered a source of bias in the research on SSGs and systematic reviews and meta-analyses can be used to address this from a scientific perspective (Munn et al., 2018).
Therefore, we systematically reviewed soccer athletes (population) responses during SSGs which were not matched to the relative area (intervention), by comparing the data between the two protocols with different relative areas (comparison) regarding the total distance, the distance at high-speed, and the mean heart rate (main outcomes). Also, we conducted a meta-analysis comparing SSG protocols with different relative areas. We hypothesised that SSGs with larger relative areas would lead to higher physical and physiological responses. In addition to the impact for the research community regarding this methodological issue, we also expected this systematic review to facilitate the definition of SSG constraints by coaches and physical trainers, thereby increasing their understanding of the effects of an important SSG feature. That is, if the relative area is found to affect physical and physiological responses by encompassing different SSG characteristics (e.g., number of players, pitch size, presence of floaters, etc.), the number of SSG variables taken into account to determine the most appropriate SSG configuration for a specific training goal may be reduced, thereby simplifying the coaches’ choices and ability to reasonably predict the loads imposed by different SSG formats.
Methods
For this systematic review, we followed the recommendations of the Joanna Briggs Institute Reviewers’ Manual (Munn et al., 2015), the Cochrane Collaboration (Higgins and Green, 2016), and PRISMA reporting guidelines (Moher et al., 2016).
Eligibility criteria
Studies were included if they were published in peer-reviewed journals, in English, and presented original data (reviews excluded). The selection of the studies, summarized in Table 1, was based on the following criteria, following the PICOS (Methley et al., 2014).
Table 1
Summary of PICOS headings used in the current review.
I) Population: male soccer players in the Under 12 age group or older who regularly played in competitive leagues at local levels or above (recreational players were excluded). The use of a wide range of ages aimed to verify whether the results could be generalised to players of different competitive levels. Also, we collected data only from participants who regularly trained and competed in soccer to provide training recommendations based on athletes instead of amateurs or recreational players;
II) Intervention: small-sided games collected transversally containing at least two protocols of SSGs with different relative areas, which was required to test whether the relative area impacted players’ responses. Also, we included small-sided games ranging from 1-a-side to 7-a-side (goalkeepers included) to avoid data collected from large-sided games, which were not the focus of the current research;
III) Comparison: data were compared in each study between the SSG protocols with different relative areas and SSG protocols presented standardised duration or physical variables relativised per minute of play. The standardization of the time was required since comparing data from series with different duration would bias the result.
IV) Outcome: the study presented the mean and standard deviation of at least one of the selected variables: mean heart rate (absolute or relative to the maximum heart rate), total distance covered (absolute or relative to the time played in minutes), or distance covered at high speed (absolute or relative to total time played). These variables were selected because they are most commonly addressed in studies, which allowed including a larger sample of studies for the systematic review. When physical variables were collected using GPS devices, the equipment’s sampling frequency should have been ≥ 5Hz; heart rate monitors used to record heart rate data should have presented a sampling frequency ≥ 1Hz. The sampling frequency was chosen to assure the validity and reliability of the data;
V) Study Type: only quantitative studies were included.
Whenever articles lacked information regarding any of the inclusion criteria, the authors were contacted by e-mail to provide the information required. After seven days without a reply, one article was excluded from the sample. Also, the articles were removed when they did not accomplish any of the selected inclusion criteria.
Information Sources
The search was conducted from the 3rd to the 15th of April, 2020. The Web of Science and
Scopus electronic databases were searched for related literature published up to March 2020. Each of the keywords ‘physiological’, ‘physical’, and ‘time-motion’ were combined with ‘small-sided games’ AND ‘football’ or ‘small-sided games’ AND ‘soccer’ within each database.
Study selection and data extraction process
The titles, abstracts, and full texts were evaluated to select the articles for the systematic review. A content analysis of the literature initially encountered was performed by two independent researchers (AAA and BBB) and involved three steps: title, abstract, and full article. When the two researchers disagreed about the inclusion of an article, a third researcher with more experience (CCC) was consulted. The search results were exported from the database websites as BibTex files and inserted into the Mendeley Reference Management Software and Research Network to remove all duplicates. Finally, the articles were included in an Excel spreadsheet for further analysis.
Data items
For the current study, the total distance covered, the distance covered at high speed, and the mean heart rate were selected as the main outcomes. These variables were selected because of their widespread use in previous studies which supports their relevance for describing the physical and physiological demands of SSGs for soccer training. Furthermore, the validity and reliability of the instruments (e.g., GPS devices and heart rate monitors) had already been verified in previous studies (Leger and Thivierge, 1988; Nagahara et al., 2017).
All of the studies included in this review presented the total distance covered in metres. The mean heart rate was reported either in absolute (beats per minute) or relative values (percentage of the maximum heart rate). The distance covered at high speed was defined as the distance covered within the highest speed zone presented in the studies. An exception was made when this zone included displacements only above 25.0 km/h wherein the reliability of the GPS devices was reported to be reduced (Buchheit et al., 2014). In those cases, the second-highest zone was considered for this review (for example 19.3 to 25.2 km/h).
The independent variable was the relative area (i.e., area per player) mathematically defined in this study as the ratio between the area of the pitch (width*length) and the number of active players inside the pitch. Goalkeepers were always included in the calculation of the relative area because of the possibility of moving up to the field to support their team on offence. Additionally, any floaters positioned in the pitch area were included in the calculation of the relative area, while those positioned outside the pitch (e.g., along the sidelines of the pitch) were excluded.
Risk of bias in individual studies
The modified version of the Quality Index (Downs and Black, 1998) which has been adopted in recent systematic reviews (Bujalance-Moreno et al., 2019) was used to assess the risk of bias and methodological quality of the eligible studies included in the meta-analysis. The original scale was reported to have good test-retest (r = 0.88) and inter-rater (r = 0.75) reliability. A modified version of the Quality Index (Bujalance-Moreno et al., 2019) was adopted for this review. It included fourteen of the twenty-seven items proposed in the original scale: 1: Is the hypothesis/aim/objective of the study clearly described?; 2: Are the main outcomes to be measured clearly described in the Introduction or Methods section?; 3: Are the characteristics of the participants included in the study clearly described ?; 6: Are the main findings of the study clearly described?; 7: Does the study provide estimates of the random variability in the data for the main outcomes?; 10: Have actual probability values been reported (e.g. 0.035 rather than <0.05) for the main outcomes except where the probability value was less than 0.001?; 12: Were those subjects who were prepared to participate representative of the entire population from which they were recruited? The proportion of those asked; 15: Was an attempt made to blind those measuring the main outcomes of the intervention?; 16: If any of the results of the study were based on “data dredging”, was this made clear?; 18: Were the statistical tests used to assess the main outcomes appropriate?; 20: Were the main outcome measures used accurate (valid and reliable)?; 22: Were study subjects in different intervention groups (trials and cohort studies) or were the cases and controls (case-control studies) recruited over the same period?; 23: Were study subjects randomised to intervention groups?; 25:
Was there an adequate adjustment for confounding in the analyses from which the main findings were drawn?. The higher the scores, the higher the quality of the studies. This specific scale was used based on its previous adoption in studies within the sports domain (Bujalance-Moreno et al., 2019; Rico-González et al., 2020) and its good levels of test-retest and inter-rater agreement.
Two independent reviewers (AAA and BBB) analysed all of the studies according to the modified Quality Index. The inter-rater agreement was calculated using Cohen’s Kappa and showed a value of 0.814 (standard error of 0.063) in the first assessment. Disagreements were discussed and evaluated by a third reviewer (CCC).
Summary measures
A prediction interval was used to assess the heterogeneity, that is, the variability of effect sizes across the studies (Borenstein, 2020). Results from pooled and individual studies were presented in forest plots with 95% confidence intervals (CI). Hedges’ g effect sizes were calculated and classified as small (0.2), medium (0.5), or large (0.8; Cohen, 1988). All statistical procedures were conducted in R Studio (R Core Team, 2019) according to Chen and Peace (2013).
Synthesis of results
Meta-analyses of mean data for continuous variables are usually performed using the mean differences across studies and the pooled variance (Chen and Peace, 2013). In this study, we obtained the means and standard deviations of the dependent variables recorded from the SSG formats investigated in each study. The data featuring SSGs with different relative areas from each study were paired for comparison. Data from SSGs with the largest relative area were assigned to Group 1, while the data from SSGs with the smaller relative area were assigned to Group 2. Before comparison, the data from these two groups were checked for normality (Shapiro-Wilk test) and homoscedasticity (Levene’s test), and no significant deviations were revealed.
Testing the assumption of homogeneity in effects between studies
The Cochran’s Q-statistic
To test the null hypothesis (that all studies share a common effect size) the Cochran’s Q-statistic was applied. Under the null hypothesis, Q will follow a central chi-squared distribution with degrees of freedom equal to k – 1, thus we can report a p-value for any observed value of Q (Cochran’s Q-statistic; Higgins et al., 2003). The Chi-square test assesses whether any observed differences in results are compatible with chance alone. A low p-value, or a large Chi-square statistic relative to its degree of freedom, provides evidence of heterogeneity of intervention effects beyond those attributed to chance (Deeks et al., 2008). In sum, the purpose of this test is to assess the viability of the null hypothesis, and not to estimate the magnitude of the true dispersion (Borenstein et al., 2020).
The I2 Statistic - heterogeneity of the studies
The I2 statistic captures the proportion of the observed variance, which reflects real differences in effect size (Higgins et al., 2003), that could serve as a kind of a signal-to-noise ratio. I2was used to explain the heterogeneity in the studies (Chen and Peace, 2013) that was attributed to the variance of true effects rather than to sampling errors (Borenstein et al., 2020). I2indices of approximately 25%, 50%, and 75% indicated low, moderate, and high heterogeneity, respectively (Higgins and Green, 2016). Due to the high heterogeneity of the studies, a pooled random-effects model was used (Higgins and Green, 2016).
Risk of bias across studies
The risk of bias across studies was assessed using the extended Egger’s test (Egger et al., 1997) and the procedures described by Ramirez-Campillo et al. (2020) were adopted. Publication bias exists when studies included in the analysis differ systematically from all studies which should have been included. Typically, studies with larger than average effects are more likely to be published, and this can lead to an upward bias in the summary effect (Borenstein et al., 2020).
Results
Study Selection
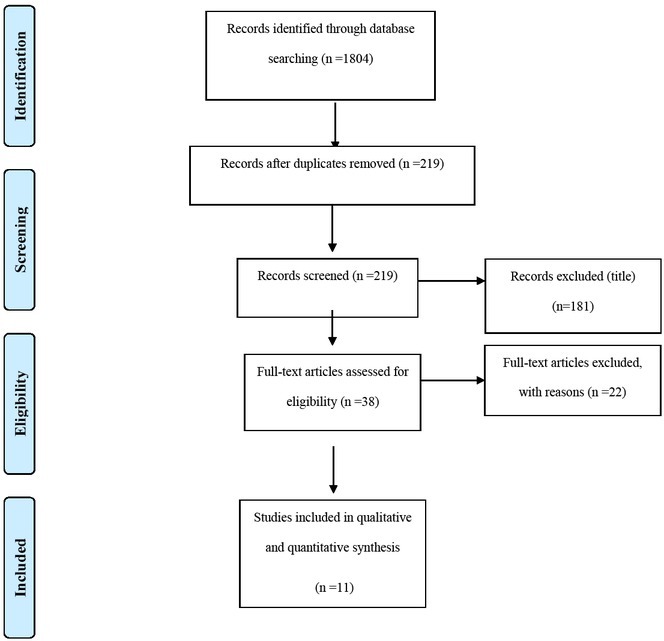
Figure 1 is a flowchart displaying the procedures of exclusion/inclusion of the studies in the review. In the Identification step, 1808 articles were screened in the search for duplicates, lasting 219 for the following steps (1589 articles excluded). In the Screening step, we analyzed the titles and abstracts of the 219 articles for the inclusion and exclusion criteria, remaining 38 for the next step (181 articles excluded). Most of the articles were excluded because they had no dependent variables analyzed in the current study (e.g., analyzed technical or tactical variables only), did not present data from soccer (e.g., analyzed rugby or handball players), or participants were not athletes (e.g., recreational players). In the sequence, we fully analyzed the texts of the remaining 38 articles in the Eligibility step. At this point, the articles were excluded mainly because they did not present SSG protocols with different relative areas in the study design (e.g., tested only the influence of coach instruction or presence/absence of goals on players’ responses). Articles were also excluded if the devices used did not meet the validity and reliability criteria or if it was not possible to extract means and standard deviation from each SSG configuration. Finally, 11 articles were included in the quantitative and qualitative synthesis.
Study Characteristics
A total of 221 players participated in the selected studies, with the sample size of the studies ranging from 12 to 48 participants with mean ages from 10.3 to 26.0 years. Most of the players belonged to clubs competing at regional and national levels. Only one study included elite professional players (English Premier League). The objectives of the selected studies were related to commonly investigated components of SSGs, such as the pitch size, the number of players per team, and the influences of additional players (floaters) or goalkeepers. The relative areas in the studies ranged from 25 to 275 m2. Characteristics of the selected studies are shown in Table 2.
Table 2
Characteristics of the studies included in the review.
| N | Mean Age (SD) | Level | Dependent Variables (only the selected ones for this review) | Formats of play analyzed | High-speed Thresholds (when applicable) | Independent Variables (responsible for creating different pitch sizes) | Largest Area | Smallest Area | |
|---|---|---|---|---|---|---|---|---|---|
| Beato et al. (2014) | 12 | 22.5 | Local | Mean HR | 3 vs. 3 | Not | Number of | 75 m2 | 60 m2 |
| (1.8) | 4 vs. 4 | applicable | players | ||||||
| Belozo et al. (2018) | 11 | 18.0 | National | TD and DHS | 3 vs. 3 | Not | Number of | 130 m2 | 60.75 m2 |
| (1.2) | 6 vs. 6 | mentioned | players | ||||||
| Casamichana et al. (2018) | 21.0 | Mean HR | Not | ||||||
| 20 | (5.0) | Regional | and TD | 5 vs. 5 | applicable | Pitch size | 275 m2 | 83.3 m2 | |
| Castellano et al. (2013) | 21.3 | Mean HR | 3 vs. 3 | Not | Number players and of | ||||
| 14 | Regional | 5 vs. 5 | 215 m2 | 80.6 m2 | |||||
| (2.3) | and TD | 7 vs. 7 | applicable | presence of goalkeepers | |||||
| Castillo et al. (2020) | 24 | 11.8 (0.3) | Regional | TD and DHS | 6 vs. 6 | >16.0 km/h | Pitch size | 75 m2 | 25 m2 |
| Gaudino et al. (2014) | 26 | 26.0 | Internation | TD and DHS | 5 vs. 5 | 19.8-25.2 | Number of | 97.7 m2 | 72.9 m2 |
| (5.0) | al | 7 vs. 7 | km/h | players | |||||
| 2 vs. 2 | |||||||||
| Halouani et al. (2017) | 18 | 13.5 | Regional | Mean HR | 3 vs. 3 | Not | Number of | 125 m2 | 62.5 m2 |
| (0.7) | 4 vs. 4 | applicable | players | ||||||
| Lemes et al. (2019) | 48 | U-13; | National | TD and DHS | 3 vs. 3 | 14.4-21.5 | Pitch size | 131.1 m2 | 108 m2 |
| U-14 | 4 vs. 3 | km/h | |||||||
| Praça et al. (2015) | 16.4 | 3 vs. 3 | 14.4-21.5 | Additional | |||||
| 18 | (0.7) | National | TD and DHS | 4 vs. 3 | km/h | players | 162 m2 | 138.8 m2 | |
| Praça et al. (2018) | 16.4 | Mean HR, | 3 vs. 3 | 14.4-21.5 | Additional | ||||
| 18 | (0.4) | National | TD, and DHS | 4 vs. 3 | km/h | players | 121.5 m2 | 108 m2 | |
| Sanchez-Sanchez et al. (2019) | 10.3 | Additional players and | |||||||
| 12 | (0.5) | Regional | TD and DHS | 6 vs. 6 | ≥18.1 km/h | presence of goalkeepers | 53.3 m2 | 45.7 m2 |
Methodological Quality
The mean Quality Index of the included studies was 78.51%. This is higher than the minimum recommended in the literature (Bujalance-Moreno et al., 2019). The highest index was 90.9% (attributed to two studies), and the lowest was 63.64% (one study). Table 3 presents the scores attributed to each study for each category of the Quality Index (Downs and Black, 1998).
Table 3
Qualitative analysis of the selected studies
| Studies | 1 | 2 | 3 | 6 | 7 | 10 | 12 | 15 | 16 | 18 | 20 | 22 | 23 | 25 | Final Score |
|---|---|---|---|---|---|---|---|---|---|---|---|---|---|---|---|
| Beato et al. (2014) | 1 | 1 | 0 | 1 | 1 | 1 | 0 | U | 1 | 1 | 0 | U | U | 1 | 72,73% |
| Belozo et al. (2018) | 1 | 1 | 1 | 1 | 1 | 0 | 0 | U | 1 | 1 | 0 | U | U | 0 | 63,64% |
| Casamichana et al. (2018) | 1 | 1 | 1 | 1 | 1 | 0 | 0 | U | 1 | 0 | 1 | U | U | 1 | 72,73% |
| Castellano et al. (2013) | 1 | 1 | 1 | 1 | 1 | 1 | 0 | U | 1 | 0 | 1 | U | U | 1 | 81,82% |
| Castillo et al. (2020) | 1 | 1 | 1 | 1 | 1 | 0 | 0 | U | 1 | 1 | 1 | U | U | 1 | 81,82% |
| Gaudino et al. (2014) | 1 | 1 | 1 | 1 | 1 | 0 | 0 | U | 1 | 1 | 1 | U | U | 0 | 72,73% |
| Halouani et al. (2017) | 1 | 1 | 1 | 1 | 1 | 0 | 0 | U | 1 | 1 | 0 | U | U | 1 | 72,73% |
| Lemes et al. (2020) | 1 | 1 | 1 | 1 | 1 | 1 | 0 | U | 1 | 1 | 1 | U | U | 1 | 90,91% |
| Praça et a. (2018) | 1 | 1 | 1 | 1 | 1 | 1 | 0 | U | 1 | 1 | 1 | U | U | 1 | 90,91% |
| Praça et al. (2015) | 1 | 1 | 0 | 1 | 1 | 1 | 0 | U | 1 | 1 | 1 | U | U | 1 | 81,82% |
| Sanchez-Sanchez et al. (2019) | 1 | 1 | 1 | 1 | 1 | 0 | 0 | U | 1 | 1 | 1 | U | U | 1 | 81,82% |
Total distance
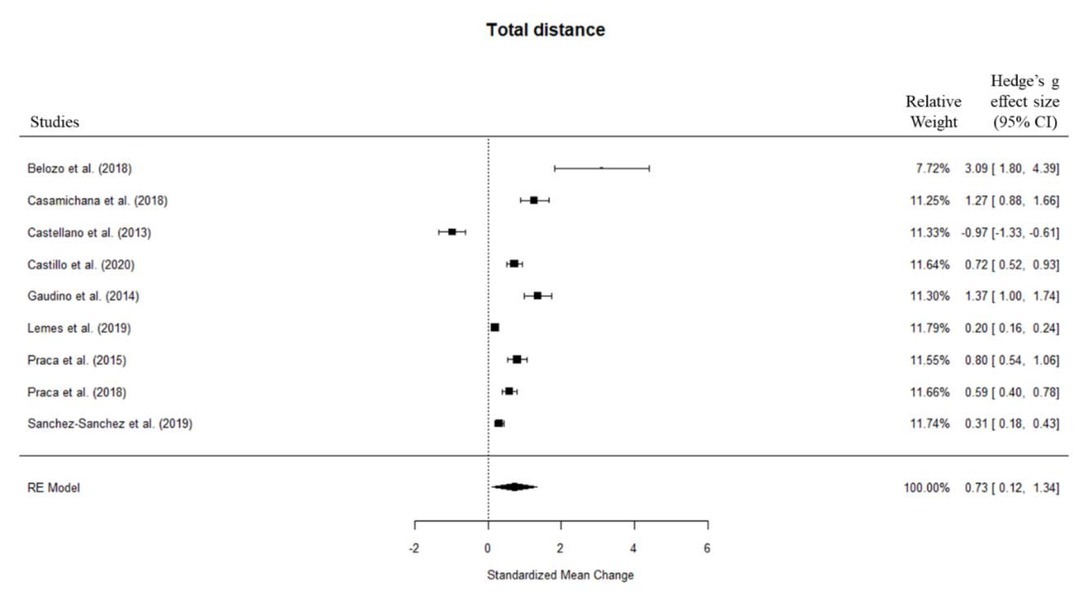
Forest plots showed positive effects of the relative area on total distance (d = 0.73; 95% CI = 0.12–1.34; medium to large effect). The Q-statistic value of 42.35 with df = 8 and a p-value < 0.0001, indicated statistically significant heterogeneity among nine studies. The I2 equal to 81.1% with 95% CI (65.1%, 89.8%), showed the existence of statistically significant heterogeneity. Egger’s test did not show a significant bias between studies (p = 0.128).
Distance covered at higher speed
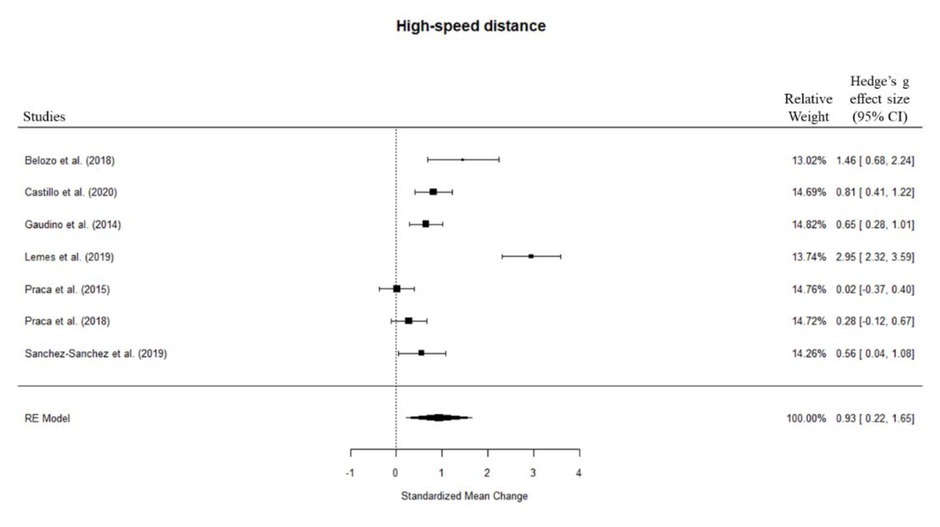
Forest plots showed positive effects of the relative area on distance covered at high speed (d = 0.93; 95% CI = 0.22–1.65; large effect). The Q-statistic value of 31.24 with df = 6 and a p-value < 0.0001, indicated statistically significant heterogeneity among seven studies. The I2 equal to 80.8% with 95% CI (61.1%, 90.5%), showed the existence of statistically significant heterogeneity. Egger’s test did not show a significant bias between studies (p = 0.133).
Mean heart rate
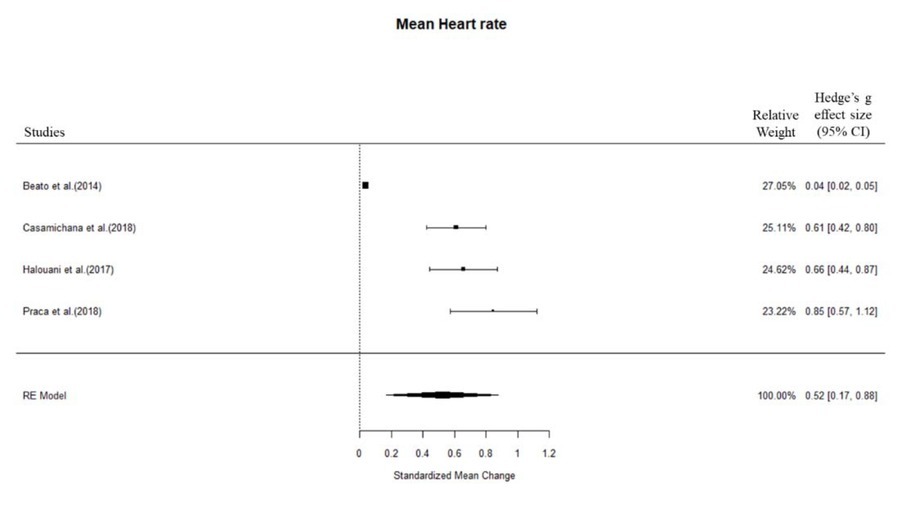
Forest plots showed positive effects of the relative area on the mean heart rate (d = 0.52; 95% CI = 0.17–0.88; medium effect). The Q-statistic value was 2.50 with df = 3 and a p-value = 0.4751. The I2 was 1% with 95% CI (0%, 81.6%), and there was no evidence to reject the null hypothesis of homogeneity of effects between studies. Egger’s test did not show a significant bias between studies (p = 0.195).
Discussion
Configuring SSGs to achieve specific physical and physiological responses from each player is complex because many variables can be modified. In this review, we intended to investigate whether the simple relative area variable could reduce the calculations necessary to establish appropriate SSG formats for soccer players if the change in that variable was able to modify multiple aspects simultaneously (i.e., pitch size, number of players, presence/absence of goalkeepers and/or floaters). This knowledge would allow coaches to more accurately predict increases or decreases in the physical and physiological responses parallel to changes in the relative area. For this reason, we investigated the impact of the relative area on the players’ physical and physiological responses in studies where the relative areas of SSGs were not controlled.
We hypothesised that larger relative areas would induce higher responses according to the results of previous studies that explicitly aimed to investigate this independent variable and properly isolated the variable (Castellano et al., 2016; Olthof et al., 2018). The results of the present study confirmed our expectations by showing a positive and significant effect of the relative area on players with larger areas eliciting higher responses in a wide range of competitive age categories. Moreover, the methodological aspects of the reviewed studies presented sufficient quality to support an important scientific advance regarding the influence of the relative area on SSGs through qualitative and quantitative syntheses.
Total distance and Distance covered at higher speed
Previous studies have reported that SSGs with larger relative areas induce higher physical and physiological responses (Castellano et al., 2016; Olthof et al., 2018). The results of the present review and meta-analysis align with those results even though the included studies did not specifically aim to investigate the influences of the relative area on players’ responses. It has been suggested that larger relative areas allow players to achieve higher speeds more frequently (Lemes et al., 2020). The results of the present study showed positive effects of the relative area on the distance covered at high-speed. There is an obvious explanation for this outcome. The
increased possibility of achieving high speeds seems to be related to the need to cover larger distances in both offensive and defensive situations, which can be achieved with a larger relative area. When a player covers a larger distance, higher accelerations could be reached, and this can lead to higher values of speed.
The data obtained in this research indicate that the augmented score of distance covered at high-speed was accompanied by a larger total distance covered. These results make sense and reiterate the robustness of the outcomes. If a player covers larger distance at high-speed in the available time during SSGs, the output expected would be a greater total distance covered.
These outcomes provide useful practical implications for SSG training prescription. If the training goal is to increase physical demands, then a larger relative area can be an effective alternative.
Mean heart rate
Our data showed positive effects of the relative area on the mean heart rate. This result supports the findings from an earlier study which examined the effect of different pitch sizes (relative area) on physiological variables during SSGs (Köklü et al., 2013). When the pitch size per player (relative area) is increased, players tend to adopt more exploratory behaviour in larger formats (Olthof et al., 2018) to create additional scoring opportunities in offensive situations and avoid the opponents’ advances in defensive situations. Therefore, changes in the relative area modify the players’ tactical behaviour. This in turn leads to increased physical and physiological responses as observed in larger relative areas. The results of the present study demonstrated that a larger total distance covered and distance covered at high-speed have occurred in SSGs with larger relative areas. The increased possibility of achieving high speeds seems to be related to the need to cover larger distances in both offensive and defensive situations, and this could also lead to higher physiological responses. In this way, different relative areas can alter the intensity associated with SSGs.
From a scientific perspective, this systematic review provides useful information to researchers by emphasising the undeniable effect of the relative area of SSGs on the players’ physical and physiological responses. Several independent variables within SSGs can be modified to achieve certain outcomes, such as specific tactical aims (Sarmento et al., 2018); however, many of these modifications also change the relative area. In this review, the modified variables which led to changes in the relative area were the presence or the number of floaters and goalkeepers, players per team, and pitch dimensions.
Practical implications and recommendations for future research
From a practical point of view, head coaches usually choose SSGs during training based on the expected tactical intent. For example, the inclusion of inside floaters may increase the effective playing area within the pitch, while numerical imbalances of team size (i.e., superior or inferior) demand different defensive strategies (Clemente et al., 2020; Praça et al., 2017). However, existing studies have presented potentially conflicting results related to the influence of floaters and the number of players per team on the physical and physiological responses of players, thereby preventing strength and conditioning coaches from gaining a clear understanding of the loads imposed by SSG configurations which were previously designed and implemented by the head coach. Conversely, a simplified analysis of the relative area facilitates the prediction of increases and decreases in the physical demand. If the use of inside floaters which decreases the relative area is required by the coach to elicit more teamwork (Praça et al., 2017), the physical trainer could propose a proportional increase in the pitch size to avoid any non-planned decreases in the training load. The same rationale can be applied to numerical imbalance situations and the presence or absence of goalkeepers.
The qualitative synthesis also showed high variability of the relative area among the studies included in the review (between 25 and 275 m2). It has been suggested that the pitch size should be adjusted to player age and the level of expertise (Castellano et al., 2016) because smaller formats may favour the development of young players. Also, a relative area derived from match play has been suggested to facilitate the exploration of important spatial elements of the sport and provide a specific environment closely related to official matches (Olthof et al., 2019).
Therefore, the dissimilarity of suggestions and the desired outcomes when choosing the relative area of SSGs for soccer training may explain the high variability. Although the present study provides important information on the acute effects of increasing or decreasing the relative area, future research on the varied effects of SSGs configured for distinct relative areas may help coaches use a different relative area in each specific session, thus reducing the unnecessary variability of the configuration.
Therefore, future studies need to control for the relative area by keeping it constant across different SSG formats. Otherwise, the SSG protocols will not be comparable because of the confounding effects of the relative area on the conclusions drawn for the main independent variable. Moreover, the results of previous studies which did not control for the relative area must be interpreted with caution. In particular, further research may be needed to clarify the effects of independent variables in studies when large differences in the relative area between SSG protocols were inadvertently adopted by the authors.
Study limitations
This study has some limitations. First, despite our qualitative analysis of the studies, we cannot ensure that the adopted research procedures controlled for all possible intervening variables. For example, the time of day when data were collected, environmental conditions, and the players’ state of fatigue could significantly influence their physical and physiological responses. Unfortunately, this level of detailed information was not reported in several studies. Another limitation relates to the characteristics of the participants. Only one study investigated elite professional athletes. As most of the studies were conducted with younger players, any generalisation of the results for professional players must be treated with caution. Finally, future studies should systematically review the effects of the relative area on the players’ tactical and technical responses to complement the knowledge gained about physical and physiological stimuli to provide a more holistic understanding of the possibilities of using SSGs for soccer training.
Conclusions
The relative areas of SSG configurations influence the players’ physical and physiological responses during soccer training. The reviewed studies investigated the effects of several independent variables on those responses, including pitch size, team size, and the presence of floaters and/or goalkeepers. Modifications to the relative area after adjusting these variables appeared to contribute to the changes in the physical and physiological responses observed. Our meta-analysis confirmed that as the relative area increased, so did the total distance, the distance covered at high speed, and the mean heart rate. These results present practical applications for coaches and sports scientists engaged in the methodological control of SSG research.