Introduction
The assessment of fat metabolism rates has recently received increased attention in both medical and sports science. It is common knowledge that energy production shifts as exercise intensity increases (Maunder et al., 2018). Lipids are oxidized principally during work at submaximal intensities (<65%VO2max – maximal oxygen uptake). The energetic contribution shifts towards carbohydrates when exercise intensity exceeds 65%VO2max (Purdom et al., 2018). That points to the expediency of selecting an exercise intensity at which the speed of fat oxidation reaches its maximum value (FATmax) only to become negligible (FATmin) as effort intensity increases (Achten et al., 2002). FATmax is strongly correlated with the aerobic threshold (AeT) and FATmin with the anaerobic threshold (AnT) (Peric et al., 2016). One of the possibilities of defining these thresholds consists of analyzing expiratory gases. The aerobic threshold is thus described as the ventilator threshold (VT1) while the anaerobic one is defined as the second ventilatory threshold (VT2) (Meyer et al., 2005).
Endurance training should increase the potential of fat utilization in the process of energy production in order to preserve glycogen reserves used during high intensity exercise (breakaways, climbs, sprints) (Peric et al., 2016). Defining an exercise intensity that triggers the highest rates of fat oxidation can help devise training programs aiming to bring about specific adaptive changes in line with individual metabolic reactions (Cerezuela-Espejo et al., 2018). Different approaches to defining the maximal fat oxidation level have been suggested based on indirect calorimetry calculations. One of them consists of a single progressive test (IET) with 2 to 6-min stages (Achten et al., 2002; Marzouki et al., 2014; Nikolovski et al., 2020). Achten et al. (2002) suggest that 3-min stages are optimal to reach a state of equilibrum and define MFO for well-trained athletes. Others recommend four to six longer (60 min) continuous exercise cycles, executed on separate days, at the intensity used in the IET (Meyer et al., 2007; Takagi et al., 2014). The latter approach may, however, be excessively time-consuming and therefore inconvenient in sports training. It appears indispensable to keep searching for reliable methods of adequate and rapid assessment of FATmax, FATmin and MFO.
Researchers’ attention is increasingly drawn to ramp test protocols with linear load increases and no steady-state stages (Michalik et al., 2019a; Zuniga et al., 2013). Previous work by Michalik et al. (2019a) demonstrated that maximal aerobic power and VO2max in youth road cyclists were higher during the ramp test (0.278 W·s-1), but no VT2 differences were registered relative to the incremental test (50 W·3 min-1). Concomitantly, a lower heart rate (HR) and respiratory exchange ratio (RER), pointing to a lower physiological cost, were evidenced in the ramp test during work at submaximal intensity. Takagi et al. (2014) verified the relevance of the RAMP protocol on a mechanical treadmill in establishing FATmax for young males and compared their results with those obtained during 60-min continuous cycling. They concluded that a ramp protocol could constitute a reliable tool in establishing the intensity level which would trigger the highest rate of fat metabolism, although MFO turned out higher than the one measured in the continuous tests. During walking or running, substrate metabolism shifts towards greater fat oxidation and triggers higher MFO rates relative to cycling (Chenevière et al., 2010). Differences in muscle recruitment patterns, especially in the recruitment of type II muscle fibers and lesser participation of the muscle mass in the overall energy production during cycling may account for that fact (Chenevière et al., 2010). A recent study by Filipovic et al. (2021) has proved that different types of exercise (treadmill, elliptical, rowing) influence the MFO value, but not maximum oxygen uptake. Taking into consideration the load increase curve, Michalik et al. (2019b) demonstrated differences in the physiological cost measured through the heart rate between loads of 0.278 W·s-1 and 0.556 W·s-1. However, to date, no research into linear load increase RAMP test protocols on a cycle-ergometer and their expediency in establishing the MFO value in youth cyclists is available.
The authors of the present work set out to define the MFO, FATmax and FATmin levels for a linear load RAMP protocol on a cycle-ergometer and compare them with the values obtained in an incremental test. An additional objective was to determine whether the maximal and minimal fat oxidation levels were correlated with the metabolic thresholds. The following hypotheses were laid out: 1) maximal fat utilization rate – MFO, as defined through a linear RAMP protocol (0.278 W·s-1), would be similar to the one obtained through an incremental test (50 W·3 min-1); 2) FATmax and FATmin intensity levels would not differ between the tests; 3) in the RAMP test, strong correlations would be observed between the maximal fat oxidation rate and the anaerobic threshold (AeT), as well as between the minimal fat oxidation rate and the anaerobic threshold (AnT).
Methods
Participants
Fifty-seven young male road cyclists, students of a Sports Academy, took part in the research project. Participants were aged 17.0 ± 0.9 years, their body height was 178.7 ± 5.8 cm, body mass 67.9 ± 7.2 kg and BMI 21.3 ± 1.4 kg.m-2 (mean ± standard deviation). All had trained for at least three years. Only participants who met the inclusion criteria (no chronic diseases, e.g., allergies, asthma, diabetes; non-use of hormonal and nutrition supplements) were recruited for the study. All agreed in writing to participate in the research project, and all were familiarized with the research procedures. Consent was granted by the parents or legal guardians and the coaches of under aged participants. The experiment was conducted in an exercise physiology laboratory (PN - EN ISO 9001: 2001). The project received approval of the Research Ethics Committee and was carried out in accordance with the amendments of the Declaration of Helsinki.
Study design
The experiment comprised two visits to the laboratory during which anthropometric measurements were followed by progressive tests on a cycle-ergometer with an analysis of expiratory gases and the heart rate. Participants were instructed not to engage in any form of intensive exercise and to discontinue training 24 hours prior to the test. Cyclists were familiarized with the experimental protocol, each of them having previously been tested at our laboratory. A randomly selected half of the participants executed the incremental test first and the ramp test one week later. The other participants proceeded in the reverse order. Both tests were executed at the same time of day (8.00 – 11.00) under laboratory conditions so as to avoid daily variation. Participants were also requested to avoid consuming caffeine 24 hours prior to each experimental session. Cyclists reported to the laboratory after having abstained from eating the whole night (11 ± 1 h). To control the influence of diet on metabolism during exercise, cyclists ate meals provided at the Academies cafeteria. This standardization method entails a significant variability in food intake between the subjects (Jeacocke and Burke, 2010).
Incremental exercise test (IET)
Prior to the test, body mass and height were measured on a medical WPT 200 (RADWAG, Radom, Poland) scale. The incremental exercise test was executed on an Excalibur Sport (Lode BV, Groningen, The Netherlands) cycle-ergometer which was calibrated before every test. The following progressive load exercise protocols were applied (Figure 1), as described by Michalik et al. (2019a):
Figure 1
Incremental exercise test protocols used in the research project (solid line – STEP test, 50 W·3 min–1; dotted line – RAMP test, ~0.278 W·s–1).
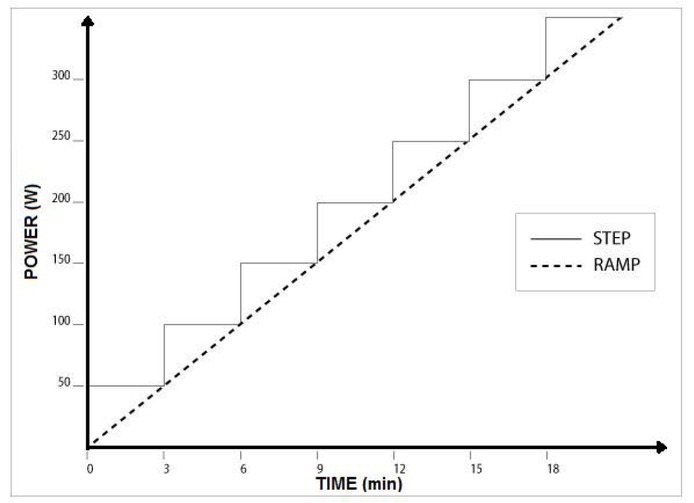
STEP test was initiated at 50 W, with the load increased every three minutes by 50 W (50 W · 3 min-1);
RAMP test was initiated at 0 W, with the load increased every second by ~0.278 W (which corresponded to 50 W · 3 min-1).
The protocol was designed to obtain equivalent power output in succeeding intervals, for example 50 W in 3’, 100 W in 6’, 150 W in 9’, etc. The pedaling frequency remained above 60 rev per minute and the test continued until volitional exhaustion.
Peak power (PPO) in the step test was calculated through the following equation: PPO = Wf + [(t · D-1 · P)], where Wf was the value of the final completed load (W), t was the time (s) of the final uncompleted load, D was the duration (s) of every stage, an P was the difference in initial power between loads (W). PPO in the RAMP was calculated as the product of test duration (s) and the load increase factor (0.278 W·s-1).
Participants breathed through a mask and the expiratory air was analyzed using a Quark b2 device (Cosmed, Milan, Italy) which was calibrated with atmospheric air and a gas mixture composed of CO2 (5%), O2 (16%) and N2 (79%) prior to the commencement of measurements. Respiratory variables were recorded breath by breath. Lung ventilation (VE), oxygen uptake (VO2), and carbon dioxide elimination (VCO2) were measured and the results were averaged every 30 s and converted into minute values to exclude irregular breaths caused by coughing, sigh breathing or swallowing, as reducing “noise” and artifacts may improve the interpretation of data. The oxygen uptake plateau was established using previously defined methods and marked as the period during which VO2 did not deviate ≤1.5 ml·kg-1·min-1 from VO2max (Lucia et al., 2006). VO2max was recorded as the highest mean value from 30 s at the VO2 plateau despite the increasing load or, if at least two of the following criteria were met: (1) volitional exhaustion, (2) highest expected heart rate (HRmax) ≥95% (208 - 0.7 · age), (3) respiratory exchange ratio ≥1.10. The heart rate was measured with a S810 (Polar Electro, Finland) sport tester and recorded by Quark b2 analyzer’s software. For each participant oxygen (VE·VO2-1) and carbon dioxide elimination (VE·VCO2-1) ventilatory equivalents were established relative to power, oxygen uptake and the heart rate.
The ventilatory threshold (AeT) was established based on the increase of VE·VO2-1 and PETO2 without an increase of VE·VCO2-1, while the secondary ventilatory threshold (AnT) was established based on both, the increases of VE·VO2-1 and VE·VCO2-1, and the decrease of PETCO2. The thresholds were defined by two independent observers (Hofmann and Tschakert, 2011).
Substrate utilization
The fat oxidation rate was calculated through a stoichiometric equation (Frayn, 1983) assuming that protein oxidation was inconsequential, and urine nitrogen elimination was negligible:
Fat oxidation rate (g ∙ min–1) = 1.67 ∙ VO2 – 1.67 ∙ VCO2
where VO2 and VCO2 were expressed in liters per minute. The 1.67 value derives from the volumes of VO2 and VCO2 necessary to oxidize 1 g of fat. For each cyclist the rapidity of fat oxidation (MFO) was verified on individual curves, as a function of exercise intensity (power). Those curves were used to define MFO, FATmax and FATmin. MFO was expressed as g·min-1. Data were compared with the corresponding values of ml·kg–1·min–1 and HR (beats·min–1) expressed in absolute and relative terms (% max) in relation to the maximal values recorded in the progressive tests (VO2max i HRmax).
Statistical analysis
Data were statistically processed by means of Statistica 13.3 software (StatSoft Inc., USA). The results were presented as an arithmetic mean ± standard deviation (
Results
The PPO, VO2max and HRmax values were previously presented in the article by Michalik et al. (2019a). Peak power output amounted to 388.0 ± 39.9 W (95% CI 377.4 to 398.6) in the STEP test and 406.1 ± 44.8 W (95% CI 394.1 to 418.0) (p < 0.05, t = 2.28, ES = 0.43) VO2max was significantly higher in the RAMP test relative to the STEP test (64.3 ± 3.6 ml·kg–1·min–1 (95% CI 63.3 to 65.2) vs. 65.8 ± 4.3 ml·kg–1·min–1 (95% CI 64.6 to 66.9)) (p < 0.05, t = 2.04, ES = 0.38). HRmax did not differ between the tests (195 ± 7 beats·min–1 (95% CI 193 to 197) and 197 ± 8 beats·min–1 (95% CI 195 to 199) for STEP and RAMP, respectively).
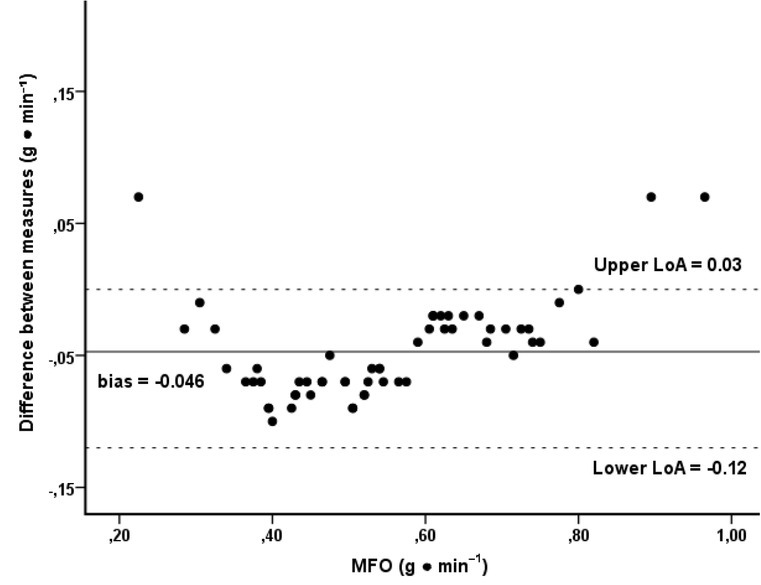
MFO at FATmax ranged between 0.19 and 0.93 g·min-1 in the STEP test and between 0.26 and 1.00 g·min-1 in the RAMP test; no statistically significant differences were observed between the tests (p = 0.12, t = 1.58). Mean differences and limits of agreement are presented in the Bland-Altman plot (Figure 2). Power corresponding to FATmax was significantly higher (p <0.05, t = 2.08, ES = 0.36) in the RAMP test compared to the STEP test. Power output reached at FATmax did not differ significantly between the tests (p = 0.73).
Figure 2
The Bland-Altman plot was used to define standard deviation, precision and limits of agreement between the measurements of MFO from the two tests. The measure differences (y axis) are delineated as a two measure mean function (x axis) at MFO. The horizontal solid line represents the mean difference between two measures (i.e., deviation). The two horizontal dotted lines represent the limit of agreement (1.96·SD) of the mean difference between MFO in STEP and RAMP.
The Student’s t-test showed that power, VO2 and HR at AeT did not differ significantly between RAMP and STEP tests. No statistically significant differences were confirmed for absolute and relative values (compared to maximal values) of VO2 and HR at FATmax and FATmin (Table 1).
Table 1
Maximal fat oxidation, power corresponding maximal and minimal fat oxidation, absolute and relative (in relation to maximal levels) values of oxygen uptake and heart rate, reflecting the points of maximal and minimal fat oxidation in the incremental exercise tests.
[i] Values presented as means ± SD with 95% confidence intervals in brackets. MD – mean difference, CV = coefficient of variation, MFO – maximal fat oxidation, FATmax – maximal fat oxidation, FATmin – minimal fat oxidation, FATmaxVO2 – oxygen uptake at maximal fat oxidation, FATmaxHR – heart rate at maximal fat oxidation, FATminVO2 – oxygen uptake at minimal fat oxidation, FATminHR – heart rate at minimal fat oxidation.
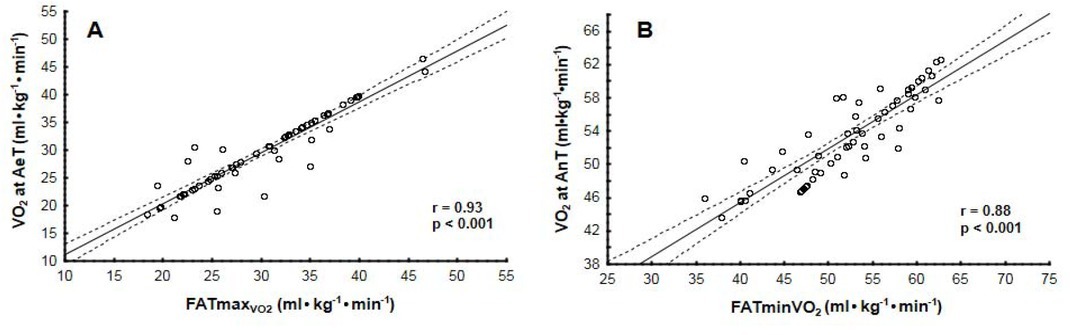
In the RAMP test, very strong correlations were observed between AeT and FATmax for power (r = 0.92, R2 = 0.84, p < 0.001), VO2 (r = 0.93, R2 = 0.87, p < 0.001) and HR (r = 0.93, R2 = 0.86, p < 0.001), as well as between AnT and FATmin for power (r = 0.89, R2 = 0.79, p < 0.001), VO2 (r = 0.88, R2 = 0.78, p < 0.001) and HR (r = 0.87, R2 = 0.76, p < 0.001) (Figure 3).
Discussion
This is the first study which verifies whether the linear protocol of incremental RAMP tests performed on a cycle-ergometer may constitute a reliable assessment method of fat oxidation and exercise intensity at which it occurs at its maximal and minimal rate. The results obtained corroborated the reliability of the RAMP test in measuring MFO in youth road cyclists. The main conclusion reached is the absence of MFO variance between the tests as well as the relative exercise intensities at FATmax and FATmin. In addition, a strong correlation was observed between the FATmax intensity delineated in the RAMP test and AeT for the probed variables which were used in monitoring exercise intensity.
Let us first and foremost mention the low values of coefficients of variation (CV <3%) for most variables between the STEP and RAMP tests. Furthermore, remarkably strong correlations between absolute and relative values of maximum oxygen uptake and heart rate, widely resorted to in assessing training adaptation, were evidenced. Interestingly, power at FATmax was the only variable that differed significantly between the tests: its value was higher in the RAMP protocol. That was accompanied by a higher coefficient of variation relative to the other variables, although the strong (r = 0.92) correlation between the tests for FATmax points to a similar trend among participants. The reason may be related to the initial intensity of the incremental test: 50 W in the STEP and 0 W in the RAMP test. The lower physiological cost described by Michalik et al. (2019a) of the RAMP test, similar to the one used in our work, should also be considered. Surprisingly, no AeT (VT1) differences were observed between the tests, hence the expediency of further investigation into the causes of those discrepancies.
The mean MFO values amounting to 0.5– 0.6 g·min–1 are in line with those observed by Randell et al. (2016) among athletes. Although MFO was slightly lower in the RAMP test, no statistical significance was demonstrated. That corroborates our first hypothesis which assumed that MFO would not differ between the tests and highlights the possibility of measuring this variable through a RAMP test with a linear power output increase, although previous research had assumed that, in order to delineate MFO it was necessary to reach a steady state (in STEP tests) for the respiratory exchange ratio to reflect cellular metabolic gas exchange (Nikolovski et al., 2020). Attention should be drawn to the wide range of fat oxidation (0.2-1.0 g·min–1) observed in youth athletes of similar age, regardless of the type of exercise (test) they perform. Purdom et al. (2018) claim that the fat oxidation rate depends on various factors which may modify cellular expression. The availability of macronutrients in the diet, training status, gender, exercise intensity and duration influence cellular adaptation and fat transport. Other factors include aerobic capacity defined as VO2max, fat content in the body, lean body mass (Randell et al., 2016) and genetic factors (Jeukendrup, 2003). Takagi et al. (2014) implied that MFO delineated through a ramp protocol (with 1-minute stages) on a mechanical treadmill was twice as high as in 60-minute continuous exercise during a steady state. In further research it could be envisioned to verify MFO through a continuous exercise test. Research participants prefer, however, being tested in single sessions and as far as RAMP tests are concerned, they focus on feasibility and direct measurements with restrained load increases (Michalik et al., 2019a; Takagi et al., 2014).
FATmax is usually expressed as a percentage of VO2max; defining VO2max is then a prerequisite to assess MFO/FATmax (Amaro-Gahete et al., 2019). In addition, VO2max and FATmax must be assessed on the same day (Amaro-Gahete et al., 2019). We have previously demonstrated that linear RAMP tests, owing to a gradual load increase and lower physiological cost of submaximal intensity work, allowed for a more direct measurement of physiological variables, resulting in higher VO2max and PPO (Michalik et al., 2019a), but without AnT differences. The intensity of FATmax expressed as a percentage of VO2max amounted to ~45% in the RAMP and ~44% in the STEP test. Those results are comparable to those presented by Peric et al. (2018) and Nikolovski et al. (2020), but lower than the intensity described in similar research projects involving cyclists (Achten et al., 2004; Bircher et al., 2005). The differences may be accounted for the training status, circulatory and respiratory efficiency, and methodological means of FATmax assessment. In our research the FATmin intensity occurred in both tests at ~79%, which does not concord with the findings of Nikolovski et al. (2020) who established it at 68.2 ± 11.3% VO2max in moderately trained male cyclists (VO2max = 47.4 ± 6.4 ml·kg–1·min–1). Higher values were established in highly trained athletes in the research of Peric et al. (2016), with FATmin amounting to 87.6 ± 1.3% VO2max. Those subjects, however, practiced sports characterized by a lower mean aerobic capacity (VO2max).
Several studies prescribed a more personalized approach with training recommendations based on HR values corresponding to the metabolic thresholds defined through IET (Ghosh, 2004; Meyer et al., 2005). That is why for the FATmax and FATmin points we present absolute and relative values of power and HR, as those variables are commonly used in controlling training intensity in cycling (Robinson et al., 2011). Available results suggest that both the metabolic thresholds and the points of fat oxidation are determined by the participants’ physical work capacity. In accordance with Meyer et al. (2005), it can then be concluded that the greater the athlete’s efficiency, the higher the intensity level at which he/she reaches his/her thresholds. The ability to maintain high power output in the long run is related to the capacity of using and maintaining a high percentage of VO2max during that period. In endurance athletes, AnT occurs at the intensity of 75–90% VO2max (Lundby and Robachn, 2015), which was also corroborated in the work of Michalik et al. (2019a), where the percentage of VO2max at AnT amounted to ~81% in the STEP and RAMP tests. The improvement of %VO2max at AnT is thus an important training objective as it can determine the results of athletes with similar levels of VO2max.
In the present work we evidenced strong positive linear dependencies between exercise intensity corresponding to the metabolic thresholds and points of fat oxidation in the RAMP test. Our results are in line with other research findings that established very strong correlations between FATmax and the aerobic threshold (r = 0.80) as well as between FATmin and the anaerobic threshold (r = 0.99) (Nikolovski et al., 2020). Also Peric et al. (2016) evidenced in their research a virtually perfect correlation between FATmin and AnT (r = 0.99) in highly trained subjects, but delineated fat utilization through the Elia and Livesay (1992) formula. In both those works, an incremental exercise test was used and the thresholds were established through an analysis of expiratory gases. Other works defined the invasive thresholds based on blood lactate concentration and evidenced significantly lower correlations within the range r = 0.43 to 0.75 between FATmax and AeT in male cyclists and between FATmin and AnT r = 0.75 (Achten et al., 2004; Bircher et al., 2005). The ventilatory threshold (VT2) or AnT is often considered a transition point from aerobic to anaerobic metabolism and is commonly used as a marker of endurance capacity (Ghosh, 2004). Methodological divergences in conducting progressive tests, the subjects’ capacity or the variety of the stoichiometric equations used may account for those discrepancies. More specific explanations should be sought through distinct analyses.
Despite the interesting findings, some limitations of the study should be mentioned. Further research into MFO, FATmax and FATmin should comprise a dietary analysis and pre-measurement standardization of diet composition. Solely youth male cyclists were tested, and the results are consequently only valid for that group. As in the present work we compared two different loading protocols on a cycle-ergometer, further research could include long-lasting continuous exercise at a steady-state ±10% intensity, in accordance with works available in the literature. In addition, future experiments may pertain to modifications of the linear RAMP protocol with, for example, a steeper load curve, so as to shorten the test’s duration to 8-12 minutes (Michalik et al., 2019b), a 60%VO2max intensity warm-up preceding the test (Danek et al., 2020), or different time intervals taken into account in averaging the analyzed data (Amaro-Gahete et al., 2019).
Conclusions
This has been the first research to demonstrate that an incremental RAMP test with a linear load increase (~0.278 W·s–1) establishes MFO and FATmin as efficiently as the STEP test. The very strong correlations observed in the RAMP protocol between FATmax and AeT, as well as between FATmin and AnT point to the test’s expediency in establishing those variables. The inclusion of the MFO and FATmin intensity into a routine assessment of physical capacity through a RAMP test may contribute to a more accurate adjustment of training intensity and an increased control over specified adaptive changes in youth road cyclists. The FATmax intensity should, however, be interpreted with caution when defining training recommendations.