Abstract
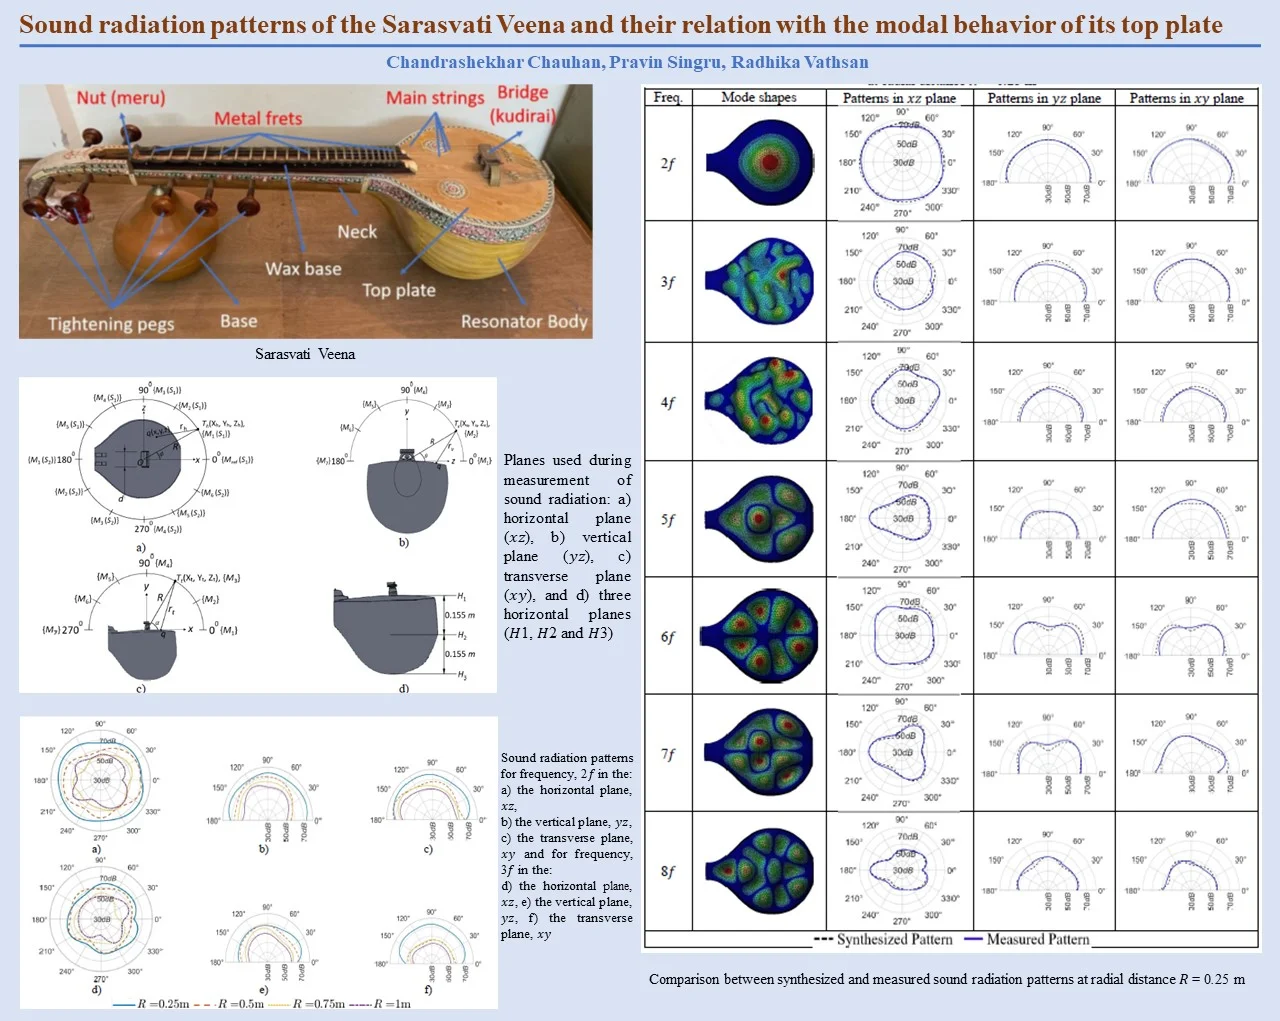
The large wooden resonator of the Sarasvati Veena amplifies and radiates the sound in almost all directions. The directional and spatial dependence of this radiation is studied in conjunction with the mode shapes of the top plate of the resonator. Sound radiation patterns are simulated theoretically using the nodal displacement data obtained from the numerical modal analysis of the resonator. The experimental analysis involves the manual plucking of the Veena string. The radiated sound is recorded by placing microphones around the resonator in circular arrays of different radii in the different planes. These combinations of arrays at different distances and planes provide a thorough knowledge of sound radiating out of the resonator. The intensities of different frequencies in the recorded spectral data as functions of direction and distance from the approximate center of the top plate of the resonator are studied. Experimentally measured patterns show the importance of the top plate over the body of the resonator. Theoretical and experimental radiation patterns for different harmonics of the plucked string are compared and a good match is observed. The behavior of the radiating sound in the different planes at different radial distances from the assumed center is discussed.
Highlights
- Sound radiation of Sarasvati veena is analyzed theoretically and validated experimentally.
- Sound radiation patterns are synthesized and measured in the different directional planes at different set of distances.
- Synthesized patterns are compared with measured patterns to validate the theoretical model.
- Inputs required for the the theoretical model are taken from the existing numerical modal analysis of the resonator of Sarasvati Veena.
- The study establishes the relation between the sound radiation of the Sarasvati Veena and modal behavior of its resonator.
1. Introduction
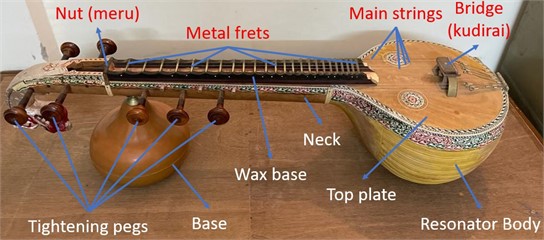
A Sarasvati Veena is a stringed musical instrument with an important place in Indian classical music. It is made up of a wooden body with a resonator and a long-attached neck. An extended bridge mounted on the resonator is subjected to the strings stretched on its surface which are further stretched on the nut at the end of the neck as shown in Fig. 1.
Fig. 1(Color online) The Sarasvati Veena
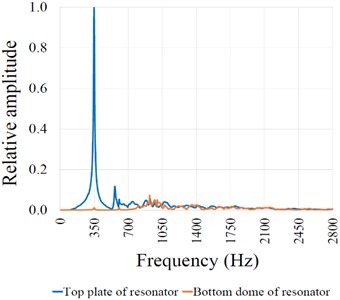
The unique and rich timber of Sarasvati Veena is composed of a combination of multiple harmonic frequencies. The resonator of Veena plays the role of an amplifier to these frequencies generated by its plucked string. The timber of Veena is studied in conjunction with the modal behavior of the resonator in our earlier work [1]. Numerical and experimental modal analyses of the resonator are conducted. The natural frequency of the resonator is found experimentally using the hammer impact test to be 351 Hz. The 3D solid geometry of Sarasvati Veena is modeled using SOLIDWORKS 2016 software. The resonator geometry is separated and modal analysis is performed using ANSYS Workbench 18.1 software, a finite element analysis (FEA) tool. The experimental modal analysis involves the measurement of frequency response functions (FRFs) at numerous grid points on the top plate of the resonator, excited by the roving hammer method. The experimental modal analysis could generate the mode shapes up to the frequency of 1400 Hz, beyond this value sensors are unable to capture readable vibration response from the top plate. The numerical mode shapes are compared with the experimental mode shapes. The modal behavior of the top plate and the rest of the resonator body is studied separately. The vibration responses of these two parts of the resonator are measured experimentally for an impact made on the top plate. The vibration response from the resonator body was found negligible as compared to the top plate [Fig. 2]. It indicates the importance of the top plate over the resonator body. The spectrum of a plucked string tuned at 175 Hz is also studied and dominance of second harmonic 2 is found over the fundamental of the string. This is attributed to the fact that 2 350 Hz is approximately the natural frequency of the resonator. Numerically simulated mode shapes from this study are used to synthesize the sound radiation pattern in the current study.
Fig. 2Vibration response of the top plate and bottom shell of the resonator for the hammer impact made on the top plate
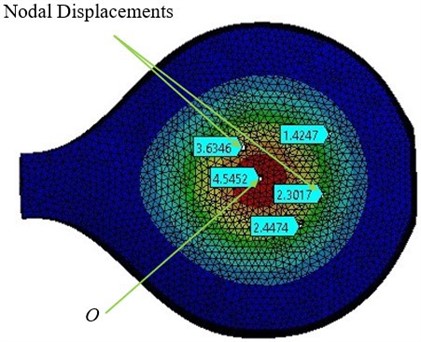
Analyzing the sound radiation at the harmonics of the plucked string of Veena with respect to direction and distance from the resonator is the basis of this study. Polar plots of these sound radiation levels at a given distance from the Veena in a given plane are referred to as sound radiation patterns hereafter. The intensities of the harmonic frequencies in a given direction have a relation with the modal behavior of the resonator to a large extent. To understand this relation, we undertake the theoretical synthesis of the sound radiation patterns with reference to mode-shapes of the top plate of the resonator. Displacements of the nodes from the existing finite elements analysis [1] are treated as point sources and their intensities are calculated using the nodal displacements of a given mode shape. Fig. 3, highlights a few of the auto-scaled nodal displacements used to simulate the radiation pattern for the fundamental frequency of the top plate, 2. The approach is explained in section 2.1. Further sound radiation mapping of plucked string Veena in a semi-anechoic chamber is performed. The theoretical patterns simulated from the mode shapes at respective modal frequencies are validated by the resulting patterns of sound radiation at the harmonic frequencies of plucked string from the sound radiation mapping.
Sound radiation studies are performed on the violin, guitar, harp, and other Western musical instruments in the past [2]-[6]. Sound radiation patterns of plucked and bowed instruments are generated from the acoustic signals recorded using the array of microphones. These arrays have various shapes like icosahedron [7], spherical [8], or circular [9]. Attempts are made to find the acoustic center of the sound source [10, 11]. Some of these instruments like violin and guitar act like moving sound sources during the performance and are subject to moving source radiation analysis [12]-[14]. Directivity and the spectral content of the radiating sound are affected by the body of the musical instrument. The effect of the body geometry and its modal behavior on the resulting radiation is analyzed for the western musical instruments like the clarinet, trombone, piano etc. [15]-[20]. The relation between the modal behavior and the sound radiation is also studied for Western musical instruments like thar, si−thar and Santoor [21], [22]. Sound radiation studies other than those of the musical instruments exist [28], [29]. To the best of our knowledge, such studies are not conducted on the Sarasvati Veena. This is the first attempt to analyze the sound radiation patterns of the Veena and establish their relationship with the modal behavior of its top plate.
Fig. 3(Color online) Mode shape of the top plate for the fundamental mode, 2f= 351 Hz
2. Acoustic radiation analysis
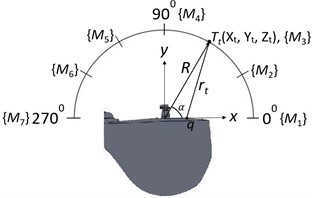
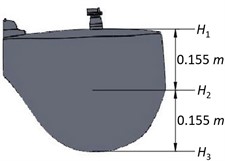
The theoretical synthesis of sound radiation patterns is undertaken, followed by the experimental sound radiation mapping of the resonator in the horizontal (), vertical (), and transverse () planes [Fig. 4]. Additionally, two planes, and [Fig. 4(d)] parallel to plane are also examined experimentally for the sound radiation. Radiation mapping is performed in a circular periphery with radius in the plane while a semicircular periphery of the same radius is employed for mapping in and planes. Semi-circular periphery is used in the and planes as we find out the top plate is a major contributor to the sound radiation rather than the resonator body. Here, the part of the resonator other than the top plate is termed a resonator body.
2.1. Theoretical synthesis of sound radiation patterns
The shape and geometry of the sound source are to be known for the theoretical study of sound radiation. As mentioned, before we keep the resonator at the center of sound radiation mapping. However, our earlier study [1] suggests the timber of the instrument is affected mainly by the top plate of the resonator rather than its body. This phenomenon is also proved in the subsequent section of the current study. It leads to our initial assumption that the top plate is solely considered a sound source and we attempt to simulate the radiation patterns from the mode shapes of the plate. This can be achieved by considering each node on the top plate as a point source and combining [23] the resulting monopoles of different phases and amplitudes to calculate the overall sound pressure at a point, [Figs. 4(a), 4(b), 4(c)]. The sound radiation, due to an omnidirectional point source, at a point, in its surroundings is calculated using Green’s function as [14] Eq. (1):
where, is the radial distance of the point from the point [Fig. 4(a)]. Point O [Fig. 3] is a point of maximum nodal displacement for the first mode of the top plate. We consider , and as inclinations of line in , and planes respectively. The frequency of the th mode is denoted by . is the velocity of the sound in the air and is the sound pressure at the source. The distance between the source and the point is . The value of in the different planes can be calculated using Fig. 4. In the horizontal plane:
Fig. 4Planes used during measurement of sound radiation: a) horizontal plane (xz), b) vertical plane (yz), c) transverse plane (xy), and d) three horizontal planes (H1, H2 and H3)
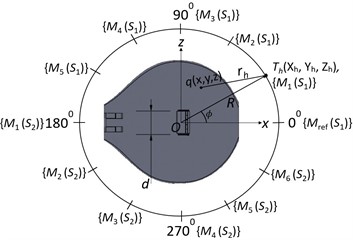
a)
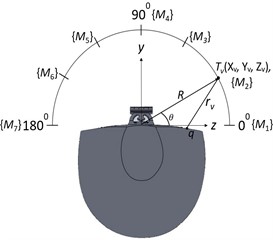
b)
c)
d)
In the vertical plane:
In the transverse plane:
On combining the monopoles in the given plane from number of the sources we get [22]:
The sound pressure emitted from the nodal point source, for a modal frequency, is calculated as [23]:
where, is a relative nodal displacement amplitude of a node, . The auto-scaled nodal displacements [Fig. 3] obtained in the numerical modal analysis of the top plate are converted on the relative scale for a given mode, . Coefficient is a frequency-dependent scaling factor calculated using the experimental data as a ratio of with , which are maximum amplitudes of the sound pressure in the measured and the synthesized patterns respectively for a given modal frequency. denotes the density of the ambient air. Substituting Eq. (6), in the Eq. (5), gives:
2.2. Experimental sound radiation measurement
Fig. 5, shows the experimental setup used for the sound radiation mapping. Sarasvati Veena is placed on the foam of 40 kg/m3 to isolate the vibrations from the floor [25] of the semi-anechoic chamber. Microphones are installed at twelve different locations during the sound radiation mapping in the horizontal plane as shown in Fig. 4(a). An angular distance of 30° is maintained between the adjacent microphones. The resulting circular array has its center on the top plate, at a point , below the bridge. The semicircular array of seven microphones is used for sound mapping in both vertical and transverse planes for the angular span of 180° as shown in Figs. 4(b) 4(c), respectively.
Fig. 5(Color online) Experimental setup for sound radiation mapping of the resonator of Sarasvati Veena
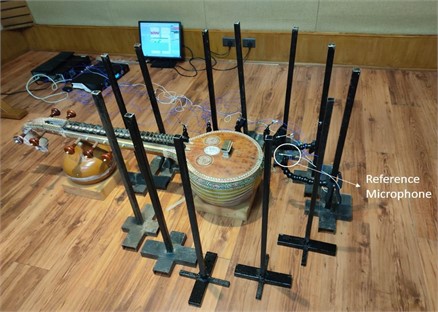
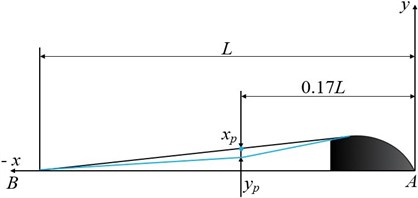
The sound radiation mapping is performed using the scanning technique [26] which uses one reference micro- phone fixed at a location close to the sound source. A scanning microphone is moved to the different locations surrounding the source and sound radiation is recorded. In the current experiment, we use multiple scanning microphones. Here we first map the radiation of the resonator of Veena in the horizontal plane, passing through its top plate [Figs. 4(a), 4(d)]. Mapping is performed in the two sets for this plane, first set, starts by installing microphones at six different locations starting from the 0° () to the angular distance of 150° (M5) as shown in Fig. 4(a). Each microphone is kept at a radial distance, 0.25 m from the point , and is kept at the same location for a complete experiment. The first of the four main strings of Veena close to the auxiliary bridge [Fig. 1] is tuned at 175 Hz, a value exactly half the natural frequency of the resonator top plate, and appears to be optimum to generate harmonically rich (with the presence of several harmonics) timbre [1]. The string is plucked manually with a thin metallic plectrum at a distance of 0.17, standard plucking point [27] preferred by the Veena players. The length, 0.845 m is the distance between the right end of the bridge, , and the nut, for the Veena studied as shown in Fig. 6. Here, plucking involves a vertical displacement of = 5 mm at the point of plucking, .
Fig. 6(Color online) Details of the plucked string
The resulting acoustic signal is recorded for the duration of 5 s with the help of an 8-channel CRYSTAL Instruments SPIDER-81 data acquisition system. The signal is fed to the Engineering Data Management (EDM) software to generate the spectrum in the form of a Fast Fourier Transform (FFT). The acoustic signal and the FFT spectrum from the are saved separately. Standard measurement practices [25] are implemented which involve repeating the experiment several times by maintaining the microphones at the same locations and the same plucking condition as mentioned above. Each recording is observed qualitatively for the consistency of the acoustic signal from . FFT data is accepted if:
where, and are the FFT amplitudes of the tuning frequency, measured by the during first and th recordings respectively. Experiments are repeated till 8 such recordings are accepted. These 8 recordings are averaged to minimize the experimental error. This completes the first set, second set, maps the rest of the arc of the array by shifting the microphones (-) by the angular distance of 150° and placing an additional microphone at 330°. The same radial distance as used in the set is maintained and an attempt is made to replicate the plucking conditions. The same experimental procedure and data processing methods as used in the set follow to complete the second set of recordings in the horizontal plane.
Mapping is also performed in two more horizontal planes and at a radial distance 0.25 m. Further experiments are performed at different radial distances; 0.5 m, 0.75 m and 1 m in the plane . Then sound radiation in the vertical and transverse planes is recorded at 0.25 m followed by the mapping at 0.5 m, 0.75 m, and 1 m in both planes. Experimental recordings in these two planes are restricted to the angular span of 0°-180°, as the top plate is considered the major contributor towards radiation based on modal analysis of the resonator [1]. This is also evident from the comparison of the sound radiations recorded in the three horizontal planes as discussed in the section 3. So, these two planes require only one set of recordings using the seven microphones and a . The sensitivity values of these microphones used for the experiment are presented in Table 1. All these radiation analyses are subjected to the same reference acoustic signal and the FFT spectrum data, measured by , at the beginning of the experiment for the first recording in the horizontal plane. Also, the same experimental practices, the plucking conditions, and the procedure are followed during these analyses. Finally, the averaged spectrum at each microphone location is analyzed and the values of the amplitude of harmonics are extracted to generate the sound radiation pattern for a given frequency and a plane.
Table 1Sensitivity values of microphones used for experimental analysis
Manufacturer | Microphone | Model | Sensitivity (mV/Pa) |
Piezotronics | PCB 125459 | 2.29 | |
PCB 125458 | 2.67 | ||
PCB 125208 | 1.87 | ||
PCB 125209 | 2 | ||
PCB 125456 | 2.23 | ||
PCB 125457 | 2.21 | ||
PCB 125460 | 2.37 | ||
PCB 125210 | 1.71 |
As understood from the experiment, one can complete the recordings for a given plane in one set using a conventional approach of placing the microphones at all the required locations. However scanning technique provides flexibility in the number of microphones required during the sound radiation mapping and so in the required number of sets to complete the mapping.
3. Results and discussion
The sound radiation patterns of the different harmonics of the plucked string in the three horizontal planes are compared. The contribution of the top plate and resonator body towards the sound radiation is analyzed to validate the earlier mentioned (Section 1) importance of the former over the latter. Theoretically synthesized and experimentally measured patterns are compared. Finally, the effect of the radial distance of the microphone on the patterns is analyzed.
3.1. Comparison of sound radiation patterns in the three horizontal planes
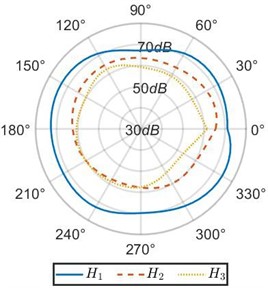
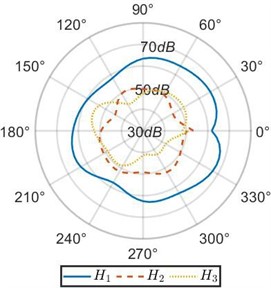
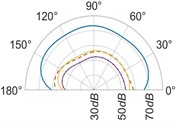
Radiation patterns in the plane, are compared with the patterns in the plane and at 0.25 m for frequencies 2 and 3 as shown in Fig. 7. This study is carried out to prove the importance of the top plate. We observe the radiation patterns in the planes, and have considerably low amplitude in almost all the directions as compared to the plane . As plane passes through the top plate, it is the major contributor to sound radiation from the resonator. This justifies our assumption of the top plate being a major source of sound radiation and thus limiting the study of patterns in the vertical and transverse planes to the angular span of 180° facing the top plate. This also corroborates with our earlier study [1] mentioned in the Section 1, where we highlight the vibroacoustic importance of the top plate over the rest of the resonator body. Hence, a firm basis is established for the theory that the sound radiation of this instrument is largely based on the modal behavior of its top plate.
Fig. 7(Color online) Sound radiation patterns in different horizontal planes at a radial distance R= 0.25 m for frequencies: a) 2f, b) 3f
a)
b)
3.2. Comparison of theoretically synthesized and experimentally measured pat- terns
Sound ration patterns are simulated theoretically at 0.25m in the horizontal plane, , vertical plane, , and transverse plane, for frequencies 2 -8. The same parameters are maintained during the experimental sound radiation measurement. Experimental patterns are plotted with the amplitudes (in dB) of the respective frequencies in the recorded FFT spectra. Fundamental, of the plucked string is ignored during the study as 2, the natural frequency of the resonator top plate which matches the second harmonic of the plucked string suppresses the as discussed in the Section 1. Also, 2 is the lowest mode from the modal analysis of the top plate utilized for the simulation of the theoretical patterns. The purpose is to experimentally validate our algorithm [Section 2.1] of predicting the sound radiation of the instrument from the modal behavior of its top plate.
The radiation patterns are presented in Table 2. The shapes of these patterns are analyzed. The omnidirectional second harmonic with the highest amplitude among the frequencies studied is observed in the plane. The peculiar shapes of the other frequency patterns are seen. The nature of patterns is nearly omnidirectional up to 3 for plane and up to 4 for plane thereafter they start to lose omnidirectional nature. The comparison of theoretically synthesized and experimentally measured patterns shows a good match for the frequencies, 2, 5, 6, 7, and 8 in the plane. However measured patterns deviate slightly from the synthesized patterns for 3 and 4, these modes are associated with the air cavity of the resonator [1].
In fact, 3 is close to the Helmholtz frequency of the resonator cavity, 531 Hz. In the plane good match is observed for 2, 5, and 8 Other frequencies show a slight deviation of measured patterns from the synthesized ones. Plane also has small differences between the measured and synthesized patterns at a few angular positions but the match is good at other positions. The deviation between the measured and synthesized patterns in and planes is mostly observed at the angular position of the 90°. This point directly faces the bridge and suffers the possible alteration of the patterns due to the involvement of the sound directly emitted from the plucked string of the Veena colliding with its bridge. Overall, we observe a good match between the synthesized patterns and the measured patterns.
The match between the theoretically synthesized and experimentally measured patterns is validated by error analysis. First, a deviation is calculated for the experimental recordings. As eight recordings are averaged at each microphone location, all the locations are first analyzed individually, and data are combined later. A percentage deviation from the mean is found for the amplitude of each frequency from the spectra of the 8 recordings at a given location. The combined analysis of all the locations gives a median error of 4.245 % and a standard deviation of 5.235 %. Next, we observe the deviation of the experimental patterns from the theoretical patterns of a given frequency. The data for all the frequency patterns in a plane is combined. Plane is subjected to the median error of 2.489 % and the standard deviation of 1.983 %. The median error in the plane is 1.523 % and the standard deviation is 2.416 %. The values of median error and standard deviation in the plane are 2.599 % and 3.410 % respectively. It is observed that the median errors and standard deviations in all the planes are lesser than the median error and standard deviation of the experimental data. Though experimental errors are inevitable, the use of standard experimental practices provides good results and their deviation from the theoretical results is lesser than the experimental error itself. This validates the match between the two results. As these patterns are synthesized from the mode shapes of the top plate, here we establish a relation between the modal behavior of the top plate and the measured sound radiation patterns of the plucked Veena string in the surrounding of its resonator.
Table 2(Color online) Comparison between synthesized and measured sound radiation patterns at radial distance R= 0.25 m
Freq. | Mode shapes | Patterns in plane | Patterns in plane | Patterns in plane |
2 | 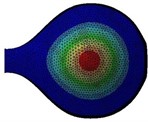 | 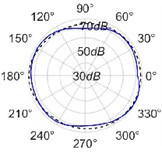 | 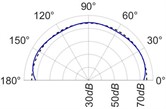 | 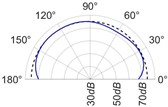 |
3 | 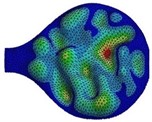 | 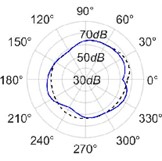 | 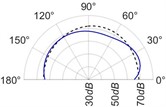 | 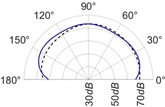 |
4 | 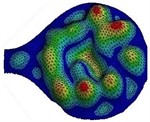 | 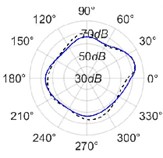 | 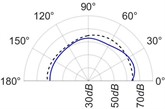 |  |
5 | 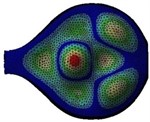 | 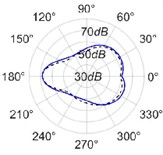 | 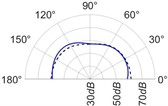 | 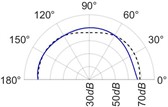 |
6 | 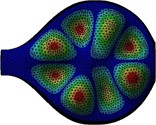 | 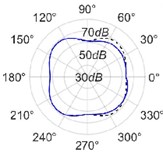 | 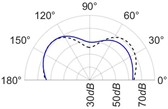 | 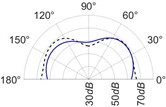 |
7 | 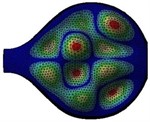 | 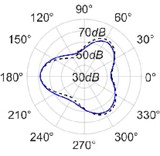 | 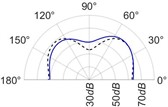 | 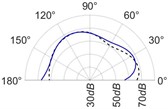 |
8 | 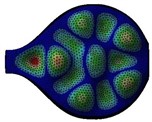 | 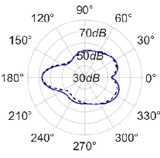 | 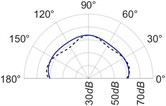 | 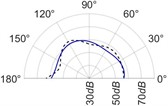 |
 | ||||
3.3. Effect of the radial distance on the sound radiation patterns
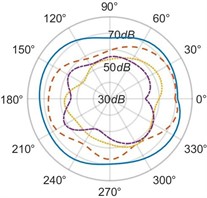
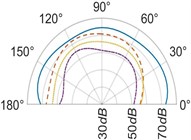
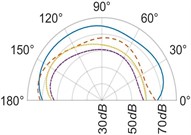
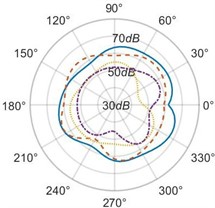
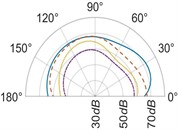
The effect of the radial distance of the microphone on the measured sound radiation patterns at different values of distance is analyzed. It is observed for 2, radiation patterns lose their omnidirectional nature as the distance from the resonator increases in the horizontal plane [Figs. 8(a), 8(d)]. Radiation patterns for 3 also change their shapes with an increase in distance. We assume, at the distances from the resonator acoustic radiation gets affected by the sound emitted directly from the string bridge interaction as mentioned in Section 3.2. However, for vertical and transverse planes [Figs. 8(b), 8(c), 8(e), 8(f)], a nearly omnidirectional nature of patterns is observed irrespective of the value of the radial distance.
Fig. 8(Color online) Sound radiation patterns for frequency, 2f in the: a) the horizontal plane, xz, b) the vertical plane, yz, c) the transverse plane, xy and for frequency, 3f in the: d) the horizontal plane, xz, e) the vertical plane, yz, f) the transverse plane, xy
a)
b)
c)
d)
e)
f)

4. Conclusions
The sound radiation from the resonator of the plucked string Veena is studied. The theoretical attempt is made to simulate the sound radiation patterns followed by a detailed experimental analysis of the radiation to generate the patterns in the different planes at different radial distances. Based on our earlier study, the resonator top plate of Sarasvati Veena is assumed as a major contributor to the radiating sound. So, theoretical patterns are simulated from the nodal displacement values of the top plate modes obtained from its numerical modal analysis. Experimental patterns are recorded using the scanning technique involving a reference microphone, kept at the same location throughout the experiment, till scanning microphones complete the measurements in all the desired planes and the radial distances. Standard measurement practices are implemented to minimize experimental errors. Sound radiation patterns for 2 and 3 are compared at a distance 0.25 m, in the three different planes , , and . The amplitudes of these harmonics are very low in all the directions in the plane and compared to . This proves the top plate is the major contributor to the radiating sound and justifies our initial assumption.
Shapes of these patterns are observed for different harmonics of the string. It is observed that 2 has an omnidirectional nature and the highest amplitude almost in all the directions and planes, among the harmonics studied. This is expected as this is the fundamental frequency of the resonator body. Higher frequency tends to show multi-polar sound radiation patterns.
Theoretical and experimental patterns are compared at a radial distance, 0.25 m, and a good match is observed between the two results. Error analysis is performed to validate the match. A median error of 4.245 % and a standard deviation of 5.235 % are observed in the experimental data, while the median error and standard deviation for the difference between experimental and synthesized patterns are within 5 % and are lesser than the experimental error values. This validates the good match between the two analyses and thus proves the relation between the mode shapes of the top plate and the sound radiation patterns of the plucked Veena string in the surroundings of its resonator. Our method of predicting the sound radiation pattern through the modal analysis of the top plate is validated.
The effect of radial distance, from the resonator on the patterns is studied. An increase in the value of affects the shape of radiation patterns of the harmonics in the horizontal plane. However, radiation patterns of 2 and 3 in vertical and transverse planes have a nearly omnidirectional nature irrespective of the radial distance. The shape of patterns at 2 and 3, being fundamental and Helmholtz frequency of the resonator respectively appear to be unaffected while for higher frequencies shapes are changed.
References
-
C. Chauhan, P. M. Singru, and R. Vathsan, “Vibro-acoustic modeling, numerical and experimental study of the resonator and its contribution to the timbre of Sarasvati veena, a South Indian stringed instrument,” The Journal of the Acoustical Society of America, Vol. 149, No. 1, pp. 540–555, Jan. 2021, https://doi.org/10.1121/10.0003356
-
L. M. Wang and C. B. Burroughs, “Directivity patterns of acoustic radiation from bowed violins,” The Journal of the Catgut Acoustical Society, Vol. 3, No. 7, pp. 9–17, 1999.
-
L. M. Wang and C. B. Burroughs, “Acoustic radiation from bowed violins,” The Journal of the Acoustical Society of America, Vol. 110, No. 1, pp. 543–555, Jul. 2001, https://doi.org/10.1121/1.1378307
-
J.-L. Le Carrou, Q. Leclere, and F. Gautier, “Some characteristics of the concert harp’s acoustic radiation,” The Journal of the Acoustical Society of America, Vol. 127, No. 5, pp. 3203–3211, May 2010, https://doi.org/10.1121/1.3377055
-
J. Pätynen and T. Lokki, “Directivities of symphony orchestra instruments,” Acta Acustica united with Acustica, Vol. 96, No. 1, pp. 138–167, Jan. 2010, https://doi.org/10.3813/aaa.918265
-
M. Pezzoli, A. Canclini, F. Antonacci, and A. Sarti, “A comparative analysis of the directional sound radiation of historical violins,” The Journal of the Acoustical Society of America, Vol. 152, No. 1, pp. 354–367, Jul. 2022, https://doi.org/10.1121/10.0012577
-
P. Cook and D. Trueman, “Database of measured musical instrument body radiation impulse responses, and computer applications for exploring and utilizing the measured filter functions,” in Proceedings of the International Symposium on Musical Acoustics, pp. 303–308, 1998.
-
N. R. Shabtai, G. Behler, M. Vorländer, and S. Weinzierl, “Generation and analysis of an acoustic radiation pattern database for forty-one musical instruments,” The Journal of the Acoustical Society of America, Vol. 141, No. 2, pp. 1246–1256, Feb. 2017, https://doi.org/10.1121/1.4976071
-
T. Ziemer, “Sound radiation characteristic of a shakuhachi with different playing techniques,” in International Symposium on Musical Acoustics (ISMA-14), Apr. 2020, https://doi.org/10.25366/2020.08
-
D. Deboy and F. Zotter, “Acoustic center and orientation analysis of sound-radiation recorded with a surrounding spherical microphone array,” in Symposium on Ambisonics and Spherical Acoustics, 2010.
-
I. Ben Hagai, M. Pollow, M. Vorländer, and B. Rafaely, “Acoustic centering of sources measured by surrounding spherical microphone arrays,” The Journal of the Acoustical Society of America, Vol. 130, No. 4, pp. 2003–2015, Oct. 2011, https://doi.org/10.1121/1.3624825
-
B. Rafaely, “Spatial alignment of acoustic sources based on spherical harmonics radiation analysis,” in 2010 4th International Symposium on Communications, Control and Signal Processing (ISCCSP), p. 2010, Mar. 2010, https://doi.org/10.1109/isccsp.2010.5463367
-
E. Maestre, G. P. Scavone, and J. O. Smith, “State-space modeling of sound source directivity: An experimental study of the violin and the clarinet,” The Journal of the Acoustical Society of America, Vol. 149, No. 4, pp. 2768–2781, Apr. 2021, https://doi.org/10.1121/10.0004241
-
A. Canclini, L. Mucci, F. Antonacci, A. Sarti, and S. Tubaro, “A methodology for estimating the radiation pattern of a violin during the performance,” in 2015 23rd European Signal Processing Conference (EUSIPCO), Aug. 2015, https://doi.org/10.1109/eusipco.2015.7362643
-
E. A. Petersen, T. Colinot, P. Guillemain, and J. Kergomard, “The link between the tonehole lattice cutoff frequency and clarinet sound radiation: a quantitative study,” Acta Acustica, Vol. 4, No. 5, p. 18, 2020, https://doi.org/10.1051/aacus/2020018
-
G. Nief, F. Gautier, J.-P. Dalmont, and J. Gilbert, “External sound radiation of vibrating trombone bells,” The Journal of the Acoustical Society of America, Vol. 123, No. 5_Supplement, pp. 3237–3237, May 2008, https://doi.org/10.1121/1.2933480
-
Z. Liu, Y. Liu, and J. Shen, “Influence of the vibrational properties of the resonance board on the acoustical quality of a piano,” BioResources, Vol. 8, No. 2, Mar. 2013, https://doi.org/10.15376/biores.8.2.2135-2144
-
M. K. Lee, M. Hosseini Fouladi, and S. N. Namasivayam, “Mathematical modelling and acoustical analysis of classical guitars and their soundboards,” Advances in Acoustics and Vibration, Vol. 2016, pp. 1–10, Dec. 2016, https://doi.org/10.1155/2016/6084230
-
L. Tronchin, “Modal analysis and intensity of acoustic radiation of the kettledrum,” The Journal of the Acoustical Society of America, Vol. 117, No. 2, pp. 926–933, Feb. 2005, https://doi.org/10.1121/1.1828552
-
L. Tronchin, M. Manfren, and V. Vodola, “Sound characterization through intensity of acoustic radiation measurement: a study of persian musical instruments,” Applied Sciences, Vol. 10, No. 2, p. 633, Jan. 2020, https://doi.org/10.3390/app10020633
-
L. Tronchin, M. Manfren, and V. Vodola, “The Carabattola-Vibroacoustical Analysis and intensity of acoustic radiation (IAR),” Applied Sciences, Vol. 10, No. 2, p. 641, Jan. 2020, https://doi.org/10.3390/app10020641
-
C. Erkut, T. Tolonen, M. Karjalainen, and V. Välimäki, “Acoustical analysis of tanbur, a Turkish long-necked lute,” in 6th International Congress on Sound and Vibration, pp. 345–352, 1999.
-
J. Escolano, J. J. López, and B. Pueo, “Directive sources in acoustic discrete-time domain simulations based on directivity diagrams,” The Journal of the Acoustical Society of America, Vol. 121, No. 6, pp. EL256–EL262, Jun. 2007, https://doi.org/10.1121/1.2739113
-
Z. Tim, “Psychoacoustic Music Sound Field Synthesis,” in Current Research in Systematic Musicology, Switzerland: Springer, 2020.
-
A. Piersol and T. H. Paez, Shock and Vibration Handbook. New Delhi: McGraw Hill Professional, 2009.
-
D. Fernandez Comesan˜A., T. Takeuchi, S. M. Cervera, and K. Holland, “Measuring musical instruments directivity patterns with scanning techniques,” in 19th International Congress of Sound and Vibration, 2012.
-
A. Sundar, H. P. V., P. Singru, and R. Vathsan, “Study of Sarasvati veena – a South Indian musical instrument using its vibro-acoustic signatures,” Journal of Vibroengineering, Vol. 18, No. 5, pp. 3362–3368, Aug. 2016, https://doi.org/10.21595/jve.2016.16930
-
J. R. Hernández-Juárez, D. A. Serrano, A. López-Villa, and A. Medina, “Acoustic radiation patterns of the silo music phenomenon,” EPJ Web of Conferences, Vol. 249, p. 03018, Jun. 2021, https://doi.org/10.1051/epjconf/202124903018
-
M. Shishlenin, N. Savchenko, N. Novikov, and D. Klyuchinskiy, “Modeling of 2D Acoustic Radiation Patterns as a Control Problem,” Mathematics, Vol. 10, No. 7, p. 1116, Mar. 2022, https://doi.org/10.3390/math10071116
About this article

This research was supported by the Science and Engineering Research Board (DST-SERB) project number EMR/2016/002338.
The datasets generated during and/or analyzed during the current study are available from the corresponding author on reasonable request.
Chandrashekhar Chauhan: data curation, formal analysis, investigation, methodology, software, validation, visualization, writing – original draft preparation. Pravin Singru: conceptualization, funding acquisition, methodology, project administration, resources, supervision, writing – review and editing. Radhika Vathsan: conceptualization, funding acquisition, methodology, project administration, resources, supervision, writing – review and editing
The authors declare that they have no conflict of interest.
