Abstract
In this study, movable steel barrier with grade SB light composite corrugated beam is designed, which addresses the problems of the prior central partition belt portable guardrail in terms of easy mobility, local safety, easy construction, and other indications. This guardrail employs explicit algorithms to conduct a dynamic finite element simulation analysis and a real vehicle crash test, and verifies the guardrails' blocking, guiding, and buffering functions in accordance with the SB level collision conditions listed in the Standard for Safety Performance Evaluation of Highway Barriers (JTG B05-01-2013). According to the results, the safety performance of SB grade lightweight composite corrugated beam movable steel guardrail meets the requirements of the Standard for Safety Performance Evaluation of Highway Barriers (JTG B05-01-2013). In addition, the guardrail can be opened for 12 meters in 1 minute and returned to close in 2 minutes. The opening and restoration of the movable guardrail is superior to the previous central divider movable guardrail. This guardrail has been tried for some high-speed and its safety performance has been verified again in actual high-speed vehicle collisions.
1. Introduction
The current movable guardrail research in China and the United States was studied and regarding the design of movable steel barrier with grade SB light composite corrugated beam. We also consulted the design codes of various years in China.
China's regulations on movable guardrails originated from the first version of the Highway Safety Design Code published in 1994: Specification for Design and Construction of Expressway Safety Appurtenances (JTJ 074-94) [1]. Article 4.2.3 of the specification stipulates that, in principle, movable steel guardrails should be set up at the middle line of the highway and the first-class highway entrances of motor vehicles. However, neither the form, shape nor the protection of the guardrails are specified. With the continuous development of steel barrier protection technology in China, three types of movable steel barriers, plug-in, telescopic and filling, are widely used. The form and shape of movable steel barrier are specified in Design Specifications for Highway Safety Facilities (JTG D81-2006) [2], but the requirement of protection grade is still not clear.
In recent years, with the increasing awareness of the importance of traffic safety protection in the industry and society, some new types of median barrier have emerged. Design Specifications for Highway Safety Facilities (JTG D81-2017) [3] and the Design Guidelines for Highway Safety Facilities (JTG/T D81-2017) [4] clearly specify the steel bar installation principles, protection level requirements and form selection requirements for the median barrier: the median barrier shall not be less than Grade 3 (Am), and its protection level and performance shall meet the requirements of the current Standard for Safety Performance Evaluation of Highway Barriers (JTG B05-01) [5].
The Standard for Safety Performance Evaluation of Highway Barriers (JTG B05-01-2013) [5] specifies the safety performance evaluation indicator for the median barrier, and proposes detailed requirements for the full-scale crash test conditions and crash point location.
In recent years, Scholars from various countries have carried out a series of research on the development of median barrier. These studies provide a reference for the design of the movable steel barrier with grade SB light composite corrugated beam, especially in terms of safety performance testing and ease of opening and closing of guardrails.
Hou et al. [6] developed a movable steel barrier with composite corrugated beam at the median opening according to the actual use requirements of highways. The crash test conditions and safety performance evaluation criteria were determined based on the requirements of the specification, and the finite element software LS-DYNA was adopted to conduct the numerical simulation of the vehicle-movable steel barrier crash process. The real vehicle crash test was carried out to verify the protection ability of the movable steel barrier. However, the embedded depth of the embedded sleeve of the movable steel barrier with composite corrugated beam is not less than 50 cm, which makes it difficult to conduct construction.
Li et al. [7] proposed that the reconstructed expressway needs to be installed with a median opening based on the reconstruction and expansion project of Xiaomenyang- Mohan Highway in Yunnan. While installing the guardrail at the median opening, the designers consulted the pertinent standard specifications, came up with an alternate plan through comparative analysis in accordance with the most recent version of the standard specifications, and gathered comprehensive data on the kinds and capabilities of frequently used median opening barriers.
In light of the possible safety risks associated with movable barriers placed at the median opening of domestic expressways, Sun et al. [8] proposed a type of median movable barrier; however, it still uses the fixed end to directly anchor on the pavement structure, resulting in damage to the pavement and complicating construction.
Li et al. [9] put forward a new design concept of movable barriers based on the problems existing in the present movable barriers set at the median opening, and designed a new anti-crash movable barrier solution with quick opening function. This solution consists of quick opening section, openable section, and end transition section. A finite element simulation model and a real vehicle crash test were used to assess the safety of the newly designed Am-class anti-collision movable guardrail scheme with quick-opening function by Li et al. However, its safety protection ability has not been verified by real vehicle crash test.
Shi et al. [10] investigated the protective effectiveness of the central divider belt opening moveable guardrail under the impact of various vehicle kinds using the display power finite element program LS-DYNA. The moveable guardrail of the center separation belt’s safety performance under the vehicle’s collision was realized, and the changes in the vehicle’s trajectory, acceleration, and velocity during impact were discussed.
Zhao and Zhao [11] combined the operation management experience and safety performance evaluation results of the crash test of the movable guardrail before the reconstruction and expansion of Jiqing Expressway. The original straddle movable guardrail was upgraded and transformed into a SBM frame movable guardrail with short opening time and high protection level, and the tracking and observation were carried out, and the effect was good.
Huang [12] designed a new kind of highway central divider belt opening rotating barrel moveable guardrail that is quick to open and install. This guardrail is based on key technology from different nations. The full-scale crash test results demonstrate that the guardrail’s blocking, guiding, and buffer functions for small passenger cars, as well as the blocking and guidance functions of medium-sized buses and medium-sized trucks, all meet the requirements of the three-level (A) protection level. In addition, they have the advantages of quick opening and closing, minimal dynamic deformation, a positive landscape effect, low material consumption, easy installation, and protection, all of which contribute to enhancing the central separation belt’s level of safety.
Two movable guardrail structures were developed and applied in the United States: SafeGuard® GateSystem and the SafeGuard® Link System, with the protection capacity up to 138 kJ (the crash model is a 2-ton pickup truck with an impact velocity of 100 km/h (NCHRP Report 350, Test Level 3), both of which are only for small vehicles and requires a high cost.
According to the current Design Specifications for Highway Safety Facilities (JTG D81), the highway barriers of median opening shall be easy to open and close and be movable, and shall be opened for a length of 10 m or more within 10 min. Therefore, the structure type of the movable barrier should be determined in consideration of the convenience of opening, the dynamic displacement value, the cost and the protective performance. Although many Chinese researchers have carried out researches on how to improve the existing forms of movable guardrails and developed various forms of movable guardrails and have greatly improved the protection capability of the movable guardrails, there are still some imperfections in the indicators, such as mobility convenience, local safety performance and construction convenience.
This study refers to certain pertinent literature on nonlinear analysis prediction models and nonlinear finite element analysis when discussing simulation calculations. The development research of SB Light Composite Corrugated Beam benefited from a deeper understanding of and application of finite element simulation analysis.
Shishegaran et al. [15] investigated the resistance of reinforced concrete slabs under the explosion load using a proxy model and nonlinear finite element analysis. Gene expression programming models (GAP), multiple linear regression (MLR), multivariate Ln equation regression (MLnER), and their combinations were used to predict the maximum deflection of RCPs. Mean absolute percentage error (MAPE), maximum positive and negative error, and statistical characteristics like coefficient of determination and root mean square error, among others. Model performance was assessed and contrasted using fractional bias and normalized squared error (NMSE). A finite element analysis reference for independent variables is given.
Nonlinear finite element analysis and other techniques were employed by Shishegaran et al. [16] to assess the steel plate shear wall's resistance to the explosion load. Employ multiple statistical metrics and error terms to assess the precision of various proxy models. Alternative techniques including nonlinear finite element analysis were used to determine the maximum deflection of SPSWs under explosion load. The accuracy of various proxy models is evaluated using a number of statistical metrics and error terms. This helps ensure the accurate analysis of finite element simulation analysis.
In order to predict the behavior of the column tree bending moment connection (CTMC) under fire and static loads, Naghsh et al. [17] conducted a nonlinear finite element simulation. Detailed parametric studies were carried out based on five input variables, including applied temperature, number of flange bolts, number of web bolts, beam length, and applied static load.
Eleven models with varying thicknesses and forms, as well as hysteresis loaded on them, were examined, and contrasted by Shishegaran et al. [18]. For every model, various parameters are computed, including the percentage of restrictions, stiffness, strength, position of the plastic hinge, and ductility under cyclic load. A static stress case study is made to ensure that the yield curve in the simulation can be consulted.
Karami et al. [19] researched the parameters and prediction models of beam size, concrete thickness, temperature, and beam length, and predicted the bearing capacity of honeycomb beams by using three regression models, including gene expression programming (GEP), multiple linear regression (MLR), principal component regression (PCR), and multiple Ln equation regression (MLnER), GEP and MLR combination, GEP, MLnER and MLR combination. It is suggested to use a new integrated model to forecast the fire bearing capacity of combined castable steel beams is proposed.
In this paper, a movable steel barrier with grade SB light composite corrugated beam was proposed to ensure that the barrier's dynamic displacement is small and to realize the functions of flexible movement, convenient opening, and convenient construction. The steel barrier can meet protection ability requirements. The existing standard specification served as the basis for determining the crash test parameters and safety performance evaluation standards. Using an actual car crash test and finite element numerical analysis, the protective capacity of movable barriers as well as a number of safety performance indicators were evaluated and confirmed.
2. Structural design
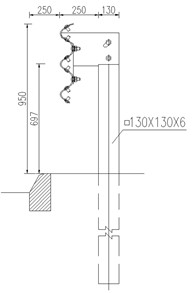
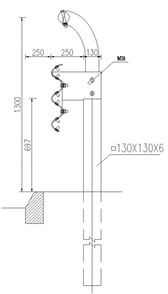
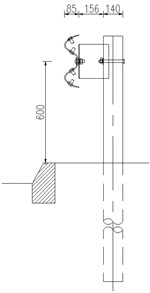
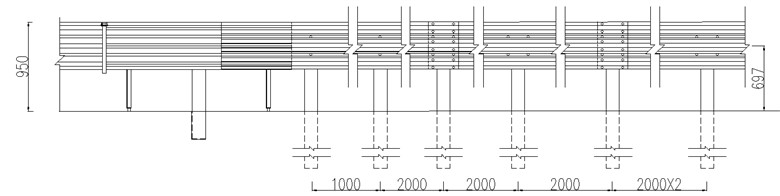
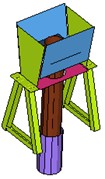
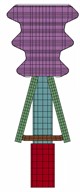
The moveable steel barrier with a grade SB light composite corrugated beam is depicted in Fig. 1 and is made up of all movable components for simple opening and shutting. The movable barrier unit has a length of 2 m / 4 m / 6 m and a column spacing of 2 m. The unit parts are joined to create a whole, and the median opening's length determines the installation's overall length. Its 50-centimeter width allows it to fit through a variety of belt openings, and its 95-centimeter height matches the center median's three-beam steel barrier. Plug-in upright posts are the only connection between the barrier and the road surface; they reduce damage to the surface and are useful for construction. With its universal wheels installed, the caster system can be moved about freely once the plug-in rod and column are removed.
The steel sleeve is embedded in the roadbed in advance, and the upright post is inserted into the steel sleeve from the opening of the top plate to form a firm embedding structure after the movable barrier unit section is assembled and moved above the steel sleeve. After the two adjacent unit segments are in place, the link is inserted and welded into the hinge plate hole at the end part of the movable barrier to complete the assembly.
Fig. 1Structural design drawing of barriers
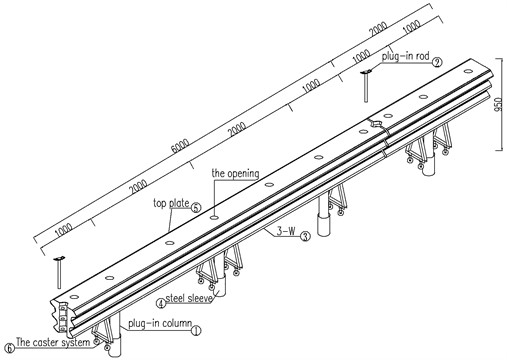
Fig. 2Structure diagram of common corrugated beam barriers
a) W-beam barrier
b) Three-beam barrier
c) Three-beam barrier with reinforced beams
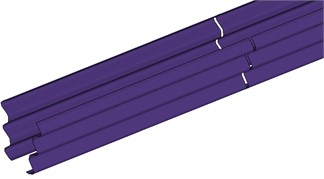
Corrugated beam barrier is the main representative form of semi-rigid barriers, including W-beam barrier, three-beam barrier and three-beam barrier with reinforced beams, as shown in Fig. 2.
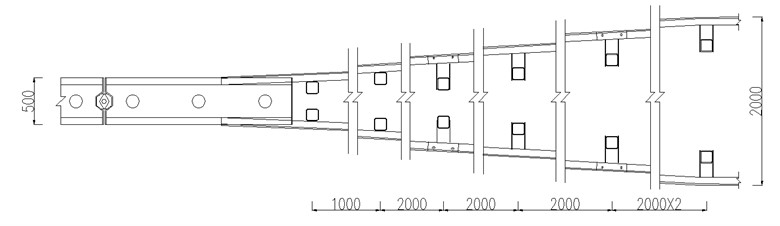
Based on the features of the composite movable barrier and the three-beam barrier, the transition section is made up of three 4,320 mm three-beam sheets, with one end connected to the 2 m-end movable unit of the composite movable barrier. The width of the sheet is increased to 2 m by gradually changing the slope, as shown in Fig. 3.
Fig. 3Structural design of transition section of barriers
3. Evaluation indicators
The Standard for Safety Performance Evaluation of Highway Barriers (JTG B05-01-2013) specifies the safety performance evaluation indicators of median opening barrier as follows:
The blocking function is a requirement for the strength of the barrier so that the median opening barrier is capable of blocking vehicle crossing, climbing, and riding after a vehicle crash. The test barrier members and their detached parts shall not intrude into the vehicle passenger compartment.
The barrier must be flexible in order to perform the cushioning function, which prevents the driver shock velocity’s longitudinal and transverse components from exceeding 12 m/s. The driver's post-crash acceleration cannot have longitudinal or transverse components that add up to more than 200 m/s2.
Driver crash speed is calculated according to Eq. (1):
where, – the driver crash speed in longitudinal direction ( direction) and transverse direction ( direction); – the acceleration at the center of gravity of the vehicle in the longitudinal direction ( direction) and transverse direction ( direction); – the time when the driver’s head moves 0.6 m in the longitudinal direction ( direction) or 0.3 m in the lateral direction ( direction) within the passenger compartment is the hypothetical moment at which it collides with the interior, and it is determined using Eq. (2):
where, 0.6 m; 0.3 m; – the smaller values of and obtained to satisfy the integral equation in and directions; can be calculated from Eq. (2) according to the acceleration data of the center of gravity of the crash test vehicle. The longitudinal component and the transverse component of the driver crash speed can be calculated based on Eq. (1), and the absolute value should be less than or equal to 12 m/s. After the hypothetical driver’s head hits the passenger compartment’s interior during a collision, the longitudinal and transverse components of the acceleration at the vehicle’s center of gravity can be computed. The maximum acceleration value should, in this case, be less than or equal to 200 m/s2.
The barrier must contact the impact surface in order to fulfill the directing function. After a collision, the car must not overturn, and its wheel track must meet the guidelines for the directed exit frame once it leaves the departure point.
The Standard for Safety Performance Evaluation of Highway Barriers (JTG B05-01-2013) proposes specific requirements for the Grade SB full-scale crash test conditions with real vehicles. In this paper, the computer simulation analysis and the full-scale crash test with real vehicles are used to test the protection capability of the movable steel barrier with grade SB light composite corrugated beam according to the SB test conditions determined in Table 1.
Table 1Grade IV (SB) full-scale crash test conditions with real vehicles
Test grade | Test conditions | ||||
Vehicle type | Vehicle weight (t) | Vehicle speed (km/h) | Crash angle (°) | Crash energy (kJ) | |
Grade IV (SB) | Small passenger cars | 1.5 | 100 | 20 | – |
Medium-sized passenger cars | 10 | 80 | 20 | 280 | |
Large freight cars | 18 | 60 | 20 | 280 | |
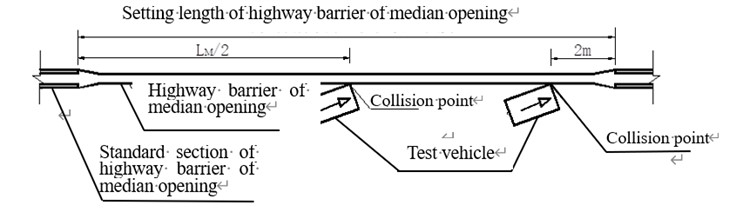
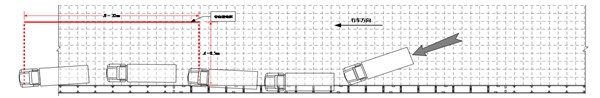
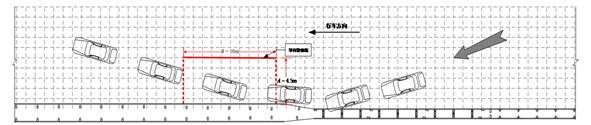
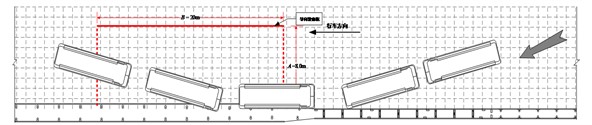
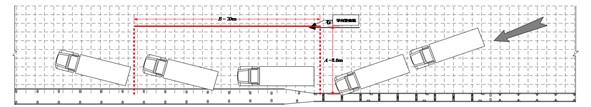
The Standard for Safety Performance Evaluation of Highway Barriers (JTG B05-01-2013) specifies the collision point location of highway barriers of median opening and the position of the impact point of the highway barriers of median opening. According to this standard, it is required to impact the midpoint of the highway barrier of median opening and the position 2 m away from its end along the driving direction of the test vehicle, as illustrated in Fig. 4.
Fig. 4Collision position location of highway barrier of median opening
Auxiliary indicators, such as the maximum lateral dynamic deformation value of the barrier, the maximum lateral dynamic displacement extension value of the barrier, the maximum dynamic camber value VI of the vehicle and the maximum dynamic camber equivalent value of the vehicle, are recorded indicators, and the conformity of the safety performance of the barrier is not evaluated. However, the conformity of the safety performance is an indicator for designers to select specific barrier types.
4. Research on safety protection capability
4.1. Mechanics of materials
At present, the steel barriers commonly used for highway in China are mostly made of Q235 steel specified in Carbon Structural Steels (GB/T 700-2006) [13]. With the implementation of High Strength Low Alloy Structural Steels (GB/T 1591-2018) [14] from February 1, 2019, steel grade Q355 and above has been widely used in engineering construction in China.
Quasi-static mechanical properties of Q355B and Q235B materials were tested at room temperature. The yield strength, elongation and tensile strength of the two materials were studied.
As shown in Table 2, the Q355B material is featured by a yield strength of 422 MPa, a tensile strength of 519.67 MPa and an elongation after fracture of 31.67 %. The Q235B material has a yield strength of 308 MPa, a tensile strength of 471 MPa and an elongation at break of 39 %. The yield strength and tensile strength of Q35B are 37.01 % and 10.33 % higher than those of Q235B. The price of Q35B is only 3.22 % higher than that of Q235B, which is 5,440 yuan/ton and 5,270 yuan/ton, respectively. Therefore, the main force-bearing components such as the side guard plates and columns of the movable steel barrier with grade SB light composite corrugated beam are made of Q355B, and the auxiliary components, such as the top cover plate and caster support system are made of Q235B.
Table 2Quasi-static tensile test results of Q355 steel at room temperature
Materials | (MPa) | (MPa) | Elongation |
Q355B | 422 | 519.67 | 31.67 % |
Q235B | 308 | 471 | 39 % |
4.2. Finite element simulation analysis
Finite Element Analysis (FEA) simulates genuine physical systems (geometry and load instances) using mathematical approximation and simple but interacting elements so that real systems with infinite unknowns can be approximated with a finite number of unknowns. For the dynamic finite element simulation study of the vehicle crash barrier, the explicit algorithm is employed.
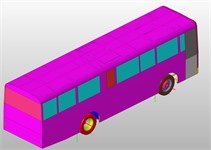
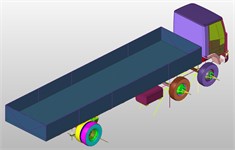
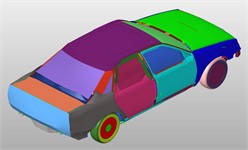
As shown in Fig. 5, the vehicle model is established according to the actual vehicle size. The unit type is mostly the quadrilateral single point integral shell unit, which is good at large deformation, because the body structure is primarily composed of thin-walled metal elements. The minimum feature length should be controlled at approximately 5 mm, the maximum angle should be less than 135 degrees, the minimum angle should be greater than 45 degrees, the number of triangle cells should be within 5 %, and the aspect ratio should be less than 4 to obtain good cells. Spot welding is the primary method used to join each component of the automobile body, and hinge units are used to link the door and the car body. Tests were conducted to determine the vehicle's material qualities, and the strain rate effect of the material was taken into account using the Cowper-Symons model. Tests are used to determine tire pressure. The tiny car's tire pressure is 0.3 MPa, whereas the huge car's tire pressure is 0.8 MPa. Utilize the penalty function method-based Automatic Single Surface contact type. Different feature lengths of the unit are divided for different areas of the vehicle based on the contact between the vehicle and the guardrail. This improves calculating efficiency while maintaining accuracy. The vehicle FEM model is shown in Fig. 5.
Since steel and other elastic-plastic materials make up most corrugated beam barriers, these materials are prone to yielding or breaking after a collision. Material nonlinearity arises because the stress-strain relationship is no longer a linear proportional relationship. A multi-linear, elastoplastic, and isotropic material constitutive model was chosen, with the steel density of 7.85 kg/m3, Poisson's ratio of 0.3, and elastic modulus of 210 GPa. The yield stress of Q235B material was defined as 308 MPa, and that of Q355B as 422 MPa. A finite element simulation model was established, in which each member was a thin-wall structure. Each of them used the key term *MAT_PIECEWISE_LINEAR_PLASTICITY to define the material characteristics.
Fig. 5Finite element model of vehicles
a)
b)
c)
Fig. 6Models of different grid sizes, from left to right, are 80, 60, 40, 20 mm grid size models
a)
b)
c)
d)
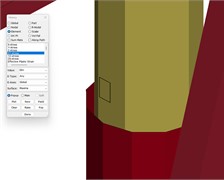
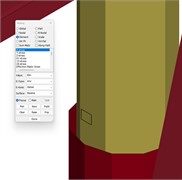
Fig. 7Stress conditions in the same area of wavy beam plates and columns in models of different mesh sizes
a)
b)
c)
d)
e)
f)
g)
h)
The Belytschko-Tsay shell element was chosen to define the various component thicknesses for the section characteristics.
The items will collide and come into touch with one another, causing boundary nonlinearity and an instantaneous discontinuity in velocity at the contact interface. Contact will cause problems for discrete equation time integration. The nonlinear treatment approach of the penalty function boundary was used to build the model's contact algorithm. Every part of the barrier was designed to have one-side contact, and the surface contact algorithm was configured between the barrier and the car.
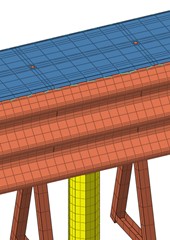
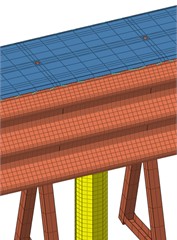
In order to explore the influence of mesh size on simulation fit, this study also explores the mesh sensitivity, as shown in the Fig. 6, according to the original model, different sizes of meshing are divided, and 80, 60, 40, and 20 mm meshes are divided and simulated by LS-Dyna. After calculation, the stress change of the mesh in the same area after the collision simulation is analyzed.
The simulation results of grid sizes of 80, 60, 40, and 20 mm are shown in Fig. 7, respectively. The same area of the corrugated beam plate and column part is taken to analyze the stress restriction.
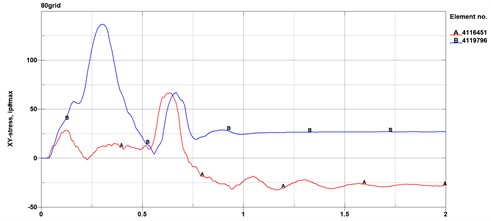
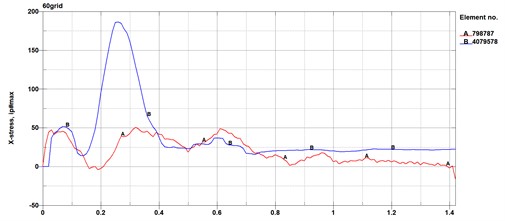
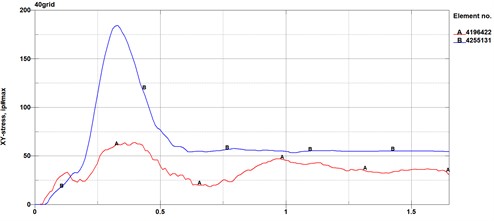
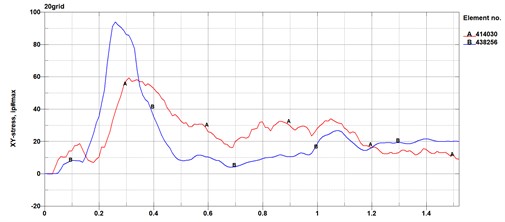
Fig. 8Stress curves for the same area of wavy beams, plates, and columns in models of different mesh sizes
a)
b)
c)
d)
Stress curves in the same area of the wavy beam plate and column in the model of four different mesh sizes are shown in the Fig. 8. Curve A is the stress curve of a certain area on the corrugated beam plate, while curve B is the stress curve of a certain area on the column. From the figure, when the mesh size is not more than 60 mm, the influence of different mesh sizes on stress becomes smaller.
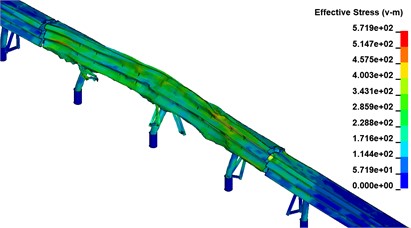
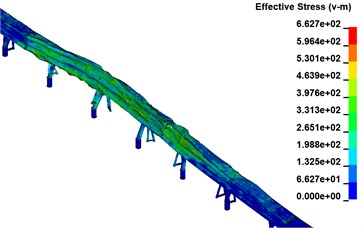
As shown in Fig. 9, the stress cloud is derived from the above four different mesh size calculations. From the cloud map, when the grid size is less than 60 mm, the average stress change gradually decreases, and the average stress is basically stable when the grid size ranges from 40-20 mm.
Based on the stress curve analysis and stress cloud analysis simulated by four different mesh size models, it can be concluded that when the mesh size is less than 60 mm, the effect of mesh size on its sensitivity becomes smaller. Finally, when weighing the calculation time, the model with a mesh size of 15-25 mm is chosen.
Fig. 9Stress clouds in four different mesh sizes
a) Grid size 80 mm
b) Grid size 60 mm
c) Grid size 40 mm
d) Grid size 20 mm
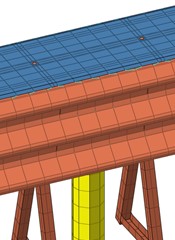
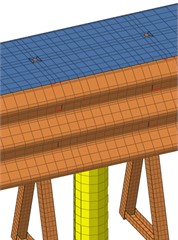
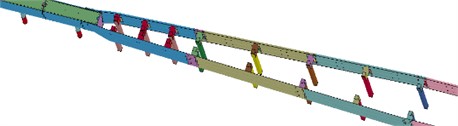
As shown in Fig. 10, the finite element model of each component was established, the mesh size of the finite element model for each component ranged from 15-25 mm. and the whole finite element model of the barrier was formed through assembly and positioning between each component. Then, the boundary conditions and loads of the established model, and constraints 150 mm below the ground were determined, as shown in Fig. 11.
Fig. 10Finite element model of barrier components

a)

b)
c)
d)
Fig. 11The whole finite element model of the barrier
a)
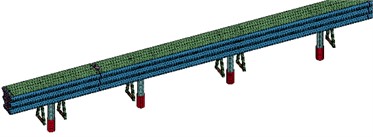
b)
c)
The finite element simulation models of barrier and vehicle were established according to the requirements of the Grade IV (SB) real vehicle crash test conditions, as shown in Fig. 12, for the finite element analysis.
Fig. 12Finite element model of vehicle crashing barrier at the position 2 m from the midpoint to the end
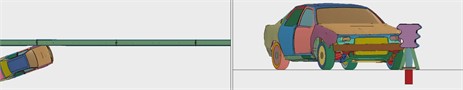
a)
b)
c)
d)
e)
f)
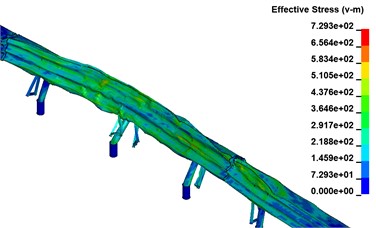
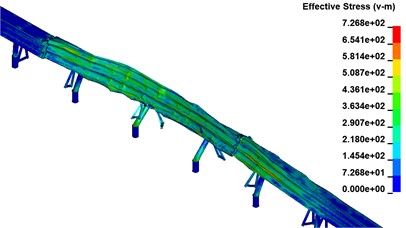
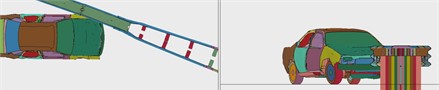
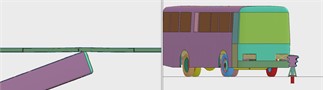
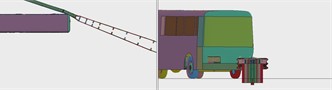
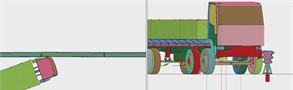
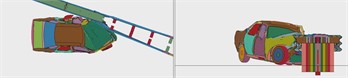
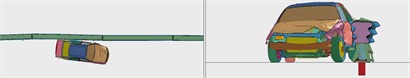
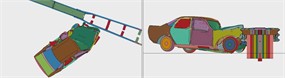
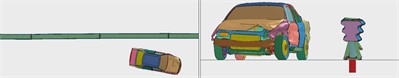
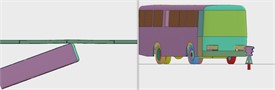
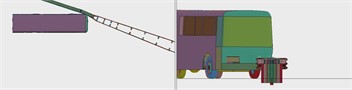
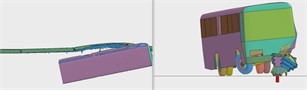
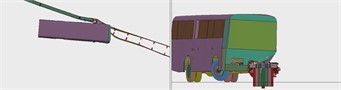
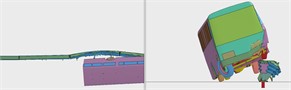
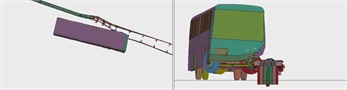
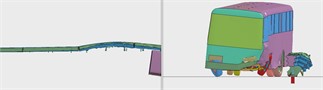
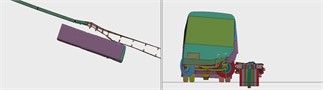
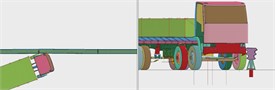
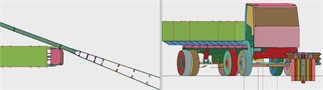
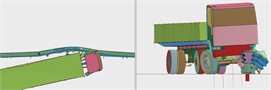
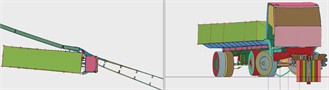
Under the condition of grade SB collision, small passenger cars, medium-sized passenger cars and large freight cars collided with the movable steel barrier with grade SB light composite corrugated beam; none of the vehicles managed to cross, climb over, or ride over the moveable barrier. All the vehicles in the other finite element simulation computations were directed normally, without hopping, except for the little passenger cars that reached a position of 2 m at the end (Figs. 13-15). Eventually, they were able to run smoothly to the normal track. No barrier fittings protruded into the vehicle’s interior during the impact, and no plug-in upright post was pushed out of the intermediate frame or sleeve, proving that the barrier’s blocking and directing capabilities complied with specification.
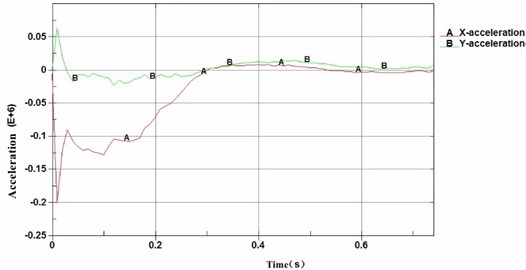
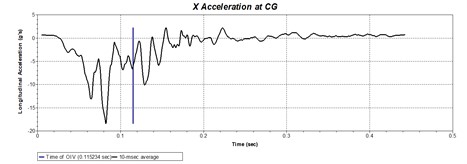
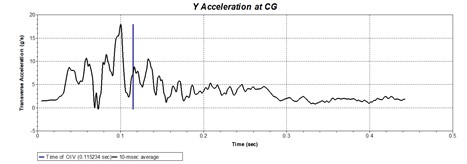
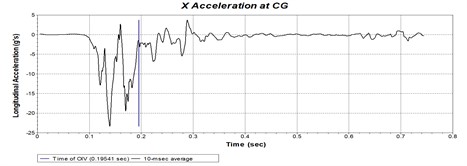
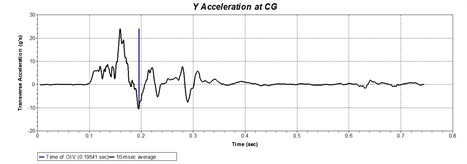
The X-acceleration and Y-acceleration of the small passenger cars after crashing the midpoint of the barrier were 67.2 m/s2 and 54.5 m/s2 respectively, and the X-acceleration and Y-acceleration were 200 m/s2 and 63 m/s2 respectively after crashing the position 2-meter from the end of the barrier, which means that the buffering function of the barrier met the specification requirements (Figs. 16 and 17).
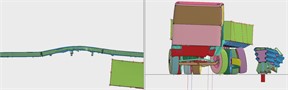
Fig. 13Driving process of a small passenger car colliding with the barrier at the position 2 m from the midpoint to the end
a)
b)
c)
d)
e)
f)
g)

h)
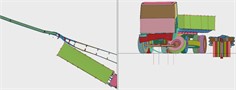
Fig. 14Driving process of a medium-sized passenger car crashing the barrier at the position 2 m from the midpoint to the end
a)
b)
c)
d)
e)
f)
g)
h)
Fig. 15Driving process of a small freight car crashing the barrier at the position 2 m from the midpoint to the end
a)
b)
c)
d)
e)
f)
g)
h)
i)
j)
Fig. 16Simulation analysis of acceleration of small passenger cars crashing barrier at the midpoint
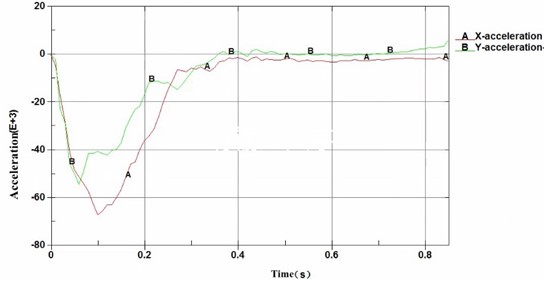
Fig. 17Simulation analysis of acceleration of small passenger cars crashing barrier at the position 2 m from the midpoint to the end
4.3. Real vehicle crash test verification
The movable steel barrier with grade SB light composite corrugated beam was validated by an actual vehicle crash test conducted under identical conditions to those of the computer simulation study, based on the Grade SB crash test described in JTG B05-01-2013.
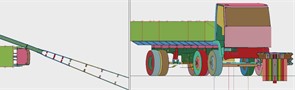
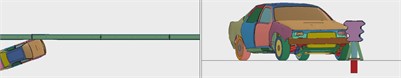
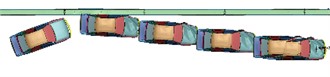
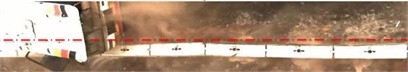
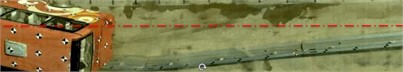
As shown in Figs. 18 and 19, when the vehicle collides with the barrier at the midpoint and 2 meters from the end of the barrier end under the condition of real vehicle collision test, the small and medium-sized passenger cars, large passenger cars and large freight cars all smoothly leave the guardrail after colliding with the guardrail. No phenomenon of riding, crossing, or crossing the guardrail occurs, which indicates that the blocking function of the guardrail meets the requirements.
Fig. 18Schematic diagram for the driving process of a vehicle crashing barrier at the midpoint in the real vehicle crash test (from right to left)
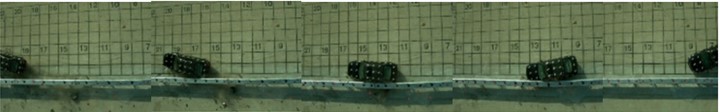
a) A small passenger car
b) A large passenger car
c) A large freight car
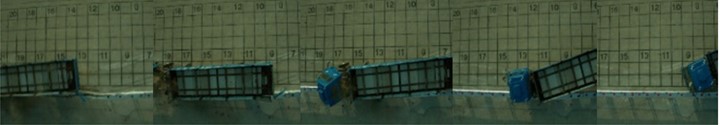
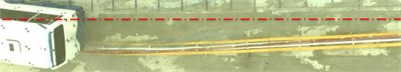
Fig. 19Schematic diagram for the driving process of a vehicle crashing barrier at the position 2 m from the end of the barrier in the real vehicle crash test (from right to left)
a) A small passenger car
b) A large passenger car
c) A large freight car
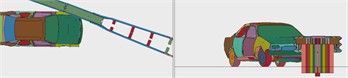
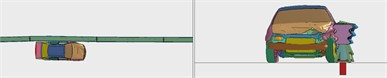
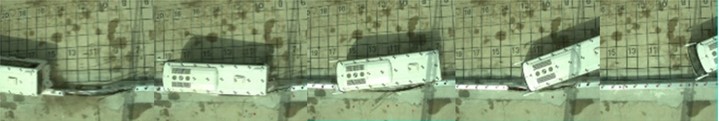
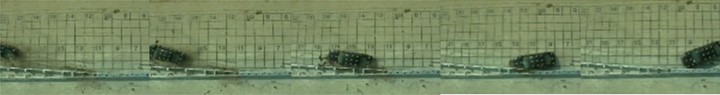
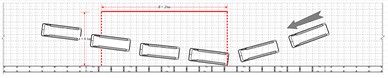
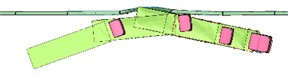
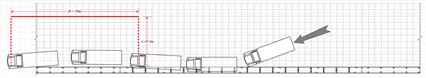
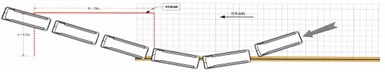
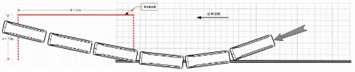
As shown in Figs. 20 and 21, vehicle track of small passenger cars, large passenger cars and large freight cars crashed at the midpoint of the barrier and at a position two meters from the barrier's end under the real vehicle crash test conditions. They met the requirements of the exit frame when leaving the barrier, indicating that the directing function of the barrier complied with the requirements.
Fig. 20Schematic diagram for the driving track of a vehicle crashing barrier at the midpoint in the real vehicle crash test (from right to left)
a) A small passenger car
b) A medium-sized passenger car
c) A large freight car
Fig. 21Schematic diagram for the driving track of a vehicle crashing barrier at the position 2 m from the end of the barrier in the real vehicle crash test (from right to left)
a) A small passenger car
b) A medium-sized passenger car
c) A large freight car
The time-history curves of the longitudinal and transverse components of acceleration at the center of gravity of small passenger cars are shown in Figs. 22 and 23. According to the acceleration data of gravity center, the absolute values of the longitudinal and transverse components of the vehicle crashing the midpoint of the barrier can be calculated as 5.1 m/s and 6.8 m/s, respectively, and 8.2 m/s and 5.8 m/s crashing the position 2-meter from the end of the barrier, both of which are less than 12 m/s, satisfying the standard requirements. The maximum absolute values of the 10 ms interval average values of the longitudinal and transverse acceleration components of small passenger cars after the mid-point collision are 99 m/s2 and 104 m/s2, respectively, and they are 67 m/s2 and 74 m/s2 after the crash at position 2 m from the end of the barrier. All these parameters are less than 200 m/s2, meeting the requirements of evaluation standards and indicating that the buffering function of barrier meet the requirements.
Fig. 22Time history curve of acceleration at the center of gravity when a small passenger care crashing the midpoint of barrier in midpoint real vehicle crash test
a)
b)
Fig. 23Time history curve of acceleration at the center of gravity when a small passenger care crashing the position 2 m from the end of the barrier of barrier in real vehicle crash test at 2 m from the barrier end
a)
b)
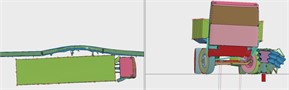
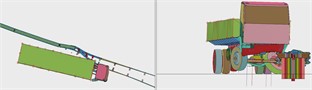
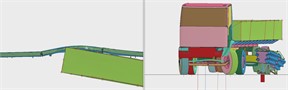
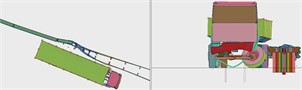
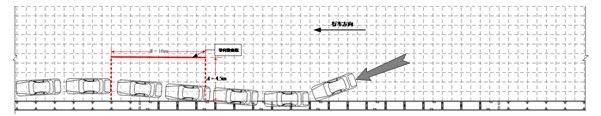
Comparing the vehicle trajectory diagrams from the finite element simulation calculation result and the real vehicle crash test vehicle can reveal, as Fig. 24 illustrates, that both the vehicle trajectory in the finite element simulation calculation result and the vehicle in the real vehicle crash test are successfully derived, and the two trajectories are essentially the same. This finding confirms the safety and dependability of the guardrail and the finite element simulation calculation's reliability.
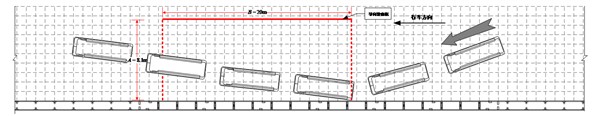
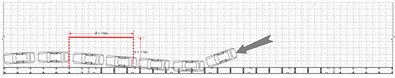
As illustrated in Table 3 and Fig. 25, the maximum lateral dynamic displacement epitaxy value (W) and maximum lateral dynamic deformation value (D) of guardrail were compared to the collision trajectories of grade SB light composite corrugated beam, trapezoidal guardrail, and frame guardrail. It is evident that following a vehicle crash, the grade SB light composite corrugated beam's trajectory outperformed both the trapezoidal and frame guardrails. For grade SB light composite corrugated beam, the smallest values are the maximum lateral dynamic displacement extension value (W) and the maximum lateral dynamic deformation value (D). It demonstrates that grade SB light composite corrugated beam outperforms frame and trapezoidal guardrails in terms of protection.
Fig. 24Comparison of vehicle trajectory diagram in finite element simulation calculation results with vehicle trajectory diagram in real vehicle crash test
a)
b)
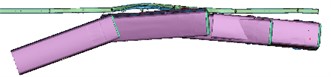
c)
d)
e)
f)
Fig. 25Comparison of collision trajectories of grade SB light composite corrugated beam, trapezoidal guardrail and frame guardrail
a)
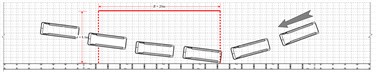
b)
c)
d)
e)
f)
Table 3Comparison of the maximum lateral dynamic deformation value (D) and the maximum lateral dynamic displacement extension value (W) of grade SB light composite corrugated beam, trapezoidal guardrail and frame guardrail
Type | Maximum lateral dynamic deformation value of guardrail (D) | Maximum lateral dynamic displacement epitaxy value of guardrail (W) |
Grade SB light composite corrugated beam | 0.64 | 0.89 |
Trapezoidal guardrail | 3.66 | 4.36 |
Frame guardrail | 1.57 | 2.07 |
5. Application in trial projects
The results of the computer simulation analysis and the real vehicle crash test method demonstrate that every indicator of the grade SB light composite corrugated beam movable steel barrier’s blocking, directing, and buffering functions satisfies the requirements of the Standard for Safety Performance Evaluation of Highway Barriers (JTG B05-01-2013). Additionally, the barrier's protection ability reaches Grade SB, and its maximum dynamic lateral displacement extension value W is only 0.89 meters. These measures can be used to effectively prevent secondary accidents at openings with widths of 1.3 meters and above in the central median.
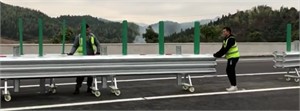
It has been applied in a number of trail projects. Fig. 26 illustrates the implementation result with its lovely line shape and quick construction.
Fig. 26Photo for application of trial project (photos taken by Qianmiao Bu, 2020.8)
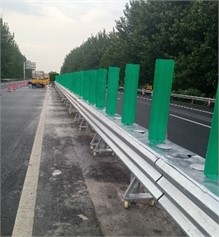
a)
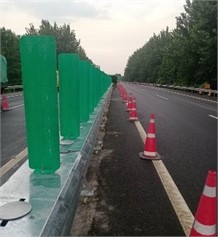
b)
According to the Technical Specifications for Design of Highway Safety Facilities (JTG D81-2017) [3] and the Design Guidelines for Highway Safety Facilities (JTG/T D81-2017) [4], the highway barriers with median openings must be movable, easy to open and close, and able to be opened for a minimum of 10 meters in 10 minutes. Furthermore, the moveable steel barrier with grade SB light composite corrugated beam met the standards by opening 12 meters in one minute and closing in two minutes following a hands-free dismantling test on the highway site by two workers, as shown in Fig. 27.
Fig. 27Disassembly test (photos taken by Qianmiao Bu, 2020.12)
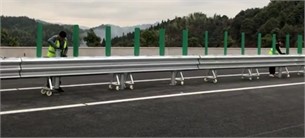
a)
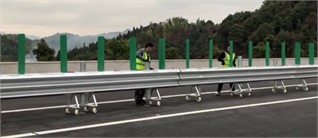
b)
c)

d)
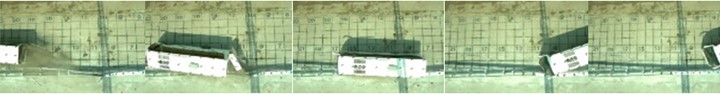
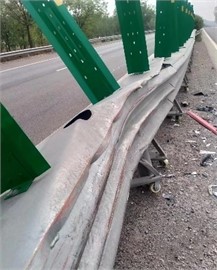
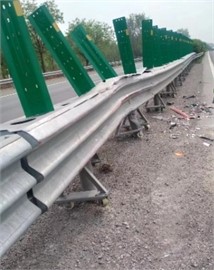
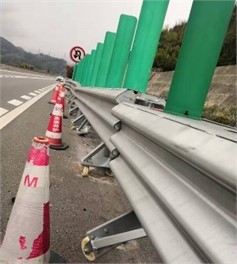
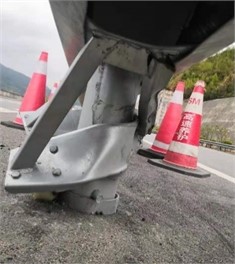
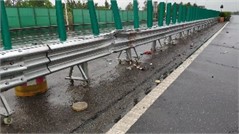
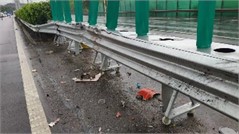
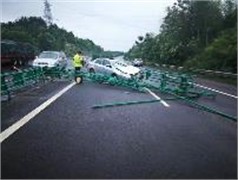
The vehicle crashed at a high rate of speed in a real-world driving environment, but fortunately no one was hurt and it avoided crossing the median, allowing the safety performance to be confirmed once more. It was also easy to maintain after collision, requiring merely the replacement of the broken unit. Fig. 28 depicts the situation following the incident.
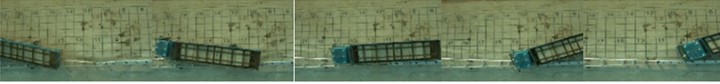
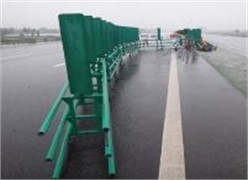
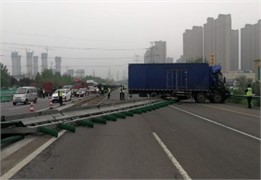
As illustrated in Figs. 28 and 29, when the collision effect in this real-world setting is compared to the protective effect of the previous movable guardrail, the movable steel barrier with grade SB light composite corrugated beam has much better protective performance over the prior movable guardrail, and the vehicle's blocking, buffering, and guiding functions are excellent.
In accordance with the national industrial development policy, the moveable steel barrier with grade SB light composite corrugated beam developed in this study uses low-alloy high-tensile structural steel Q355B as the primary stress component. The highway barriers of median opening with high protection level prevent and minimize traffic accidents and ensure that vehicles can proceed. They also address a number of issues with the current roadway, such as the median movable barrier's inadequate protection capacity and insufficient space for pedestrians.
Fig. 28Vehicle state after crash (photos taken by Highway Manager, 2021.3)
a)
b)
c)
d)
e)
f)
Fig. 29The protective effect of the past movable guardrail (photos taken by Highway Manager, 2018)
a)
b)
c)

d)
6. Conclusions
1) This study used computer finite element simulation analysis and real vehicle crash test analysis to verify the safety protection ability of a light composite movable steel barrier with grade SB corrugated beam and no anchoring unit at its midpoint and two meters from the barrier end under grade SB-crash conditions. The findings demonstrated that the protection level attained grade SB and that the moving steel barrier's blocking, directing, and buffering capabilities with grade SB light composite corrugated beam satisfied the Standard for Safety Performance Evaluation of Highway Barriers (JTG B05-01-2013).
2) To effectively prevent a secondary accident caused by a vehicle straying into the opposite lane after an accident, this study adopted the moveable steel barrier with grade SB light composite corrugated beam with the least amount of deformation and the maximum dynamic lateral displacement extension value W of the barrier was only 0.89 m. This means that the barrier can be applied to provide safety protection at openings in the central median that are 1.3 m or wider.
3) The movable steel barrier with grade SB light composite corrugated beam has been applied in several trail projects. Besides, it could open 12 meters in one minute and return to the closed state in two minutes after two workers’ hands-free disassembly test on the highway site. After the vehicle crashed in the actual driving environment at high speed, no casualties occurred in the crash accident, and the vehicle did not cross the median, so the safety performance was verified again.
References
-
“Specification for Design and Construction of Expressway Safety Appurtenances (JTJ 074-94),” Beijing, China Communications Press, 1994.
-
“Design Specifications for Highway Safety Facilities (JTG D81-2006),” Beijing, China Communications Press, 2006.
-
“Design Specifications for Highway Safety Facilities (JTG D81-2017),” Beijing, China Communications Press, 2017.
-
“Design Guidelines for Highway Safety Facilities (JTG/T D81-2017),” Beijing, China Communications Press, 2017.
-
“Standard for Safety Performance Evaluation of Highway Barriers (JTG B05-01-2013),” Beijing, China Communications Press, 2013.
-
D. Z. Hou, Y. Li, M. J. Yang, Z. W. Zhou, and C. H. Wang, “Development of combined movable steel barrier with corrugated beam for freeway,” (in Chinese), Journal of Highway and Transportation Research and Development, Vol. 28, No. 9, pp. 136–141, 2011.
-
D. M. Li, G. H. Zhang, Z. X. Feng, and C. H. Wang, “Comparative analysis of structure and performance of highway barriers of median opening,” (in Chinese), Journal of Highway and Transportation Research and Development, Vol. 146, No. 2, pp. 245–247, 2017.
-
X. L. Sun, H. Y. Xu, and S. M. Feng, “Impact simulation of easy-opening impact avoidance movable guardrail of expressway median,” (in Chinese), Highway Engineering, Vol. 45, No. 2, pp. 74–79, 2020.
-
X. M. Li et al., “Development on a new type of crashworthiness moveable barriers with rapid opening function,” (in Chinese), Highway Engineering, Vol. 46, No. 2, pp. 125–130, 2021.
-
L. Shi, Y. P. Zhao, P. T. Xue, and F. Hu, “Simulation analysis on median movable opening barrier under vehicle impact and safety assessment,” (in Chinese), Journal of Highway and Transportation Research and Development, Vol. 39, No. 3, pp. 152–182, 2022, https://doi.org/10.3969/j.issn.1002-0268.2022.03.019
-
G. Zhao and X. S. Zhao, “The successful application of SBM class frame movable guardrail in Jiqing expressway,” (in Chinese), Waterway Transport Digest, No. 2, pp. 113–115, 2022, https://doi.org/10.3969/j.issn.1673-8098.2021.02.040
-
B. C. Huang, “Design and safety performance analysis of expressway central divider opening rotating barrel movable guardrail,” (in Chinese), Fujian Transportation Science and Technology, Vol. 10, pp. 112–116, 2021.
-
“Carbon Structural Steels (GB/T 700-2006),” Beijing, Standardization Administration of China, 2006.
-
“High Strengthen Low Alloy Structural Steels (GB/T 1591-2018),” Beijing, Standardization Administration of China, 2018.
-
A. Shishegaran, M. R. Khalili, B. Karami, T. Rabczuk, and A. Shishegaran, “Computational predictions for estimating the maximum deflection of reinforced concrete panels subjected to the blast load,” International Journal of Impact Engineering, Vol. 139, p. 103527, May 2020, https://doi.org/10.1016/j.ijimpeng.2020.103527
-
A. Shishegaran, B. Karami, E. Safari Danalou, H. Varaee, and T. Rabczuk, “Computational predictions for predicting the performance of steel 1 panel shear wall under explosive loads,” Engineering Computations, Vol. 38, No. 9, pp. 3564–3589, Sep. 2021, https://doi.org/10.1108/ec-09-2020-0492
-
M. A. Naghsh et al., “An innovative model for predicting the displacement and rotation of column-tree moment connection under fire,” Frontiers of Structural and Civil Engineering, Vol. 15, No. 1, pp. 194–212, Feb. 2021, https://doi.org/10.1007/s11709-020-0688-2
-
A. Shishegaran, A. Amiri, and M. A. Jafari, “Seismic performance of box-plate, box-plate with UNP, box-plate with L-plate and ordinary rigid beam-to-column moment connections,” Journal of Vibroengineering, Vol. 20, No. 3, pp. 1470–1487, May 2018, https://doi.org/10.21595/jve.2017.18716
-
B. Karami, A. Shishegaran, H. Taghavizade, and T. Rabczuk, “Presenting innovative ensemble model for prediction of the load carrying capacity of composite castellated steel beam under fire,” Structures, Vol. 33, pp. 4031–4052, Oct. 2021, https://doi.org/10.1016/j.istruc.2021.07.005
About this article

The authors have not disclosed any funding.
The datasets generated during and/or analyzed during the current study are available from the corresponding author on reasonable request.
Aling Zhang: Funding Acquisition, Visualization, Data Curation; Qianmiao Bu: Methodology, Conceptualization, Writing – Original Draft Preparation, Writing – Review and Editing, Validation, Project Administration; Wen Zhang: Supervision, Investigation, Formal Analysis; Guomeng He: Investigation, Data Curation; Yong Deng: Investigation, Funding Acquisition.
The authors declare that they have no conflict of interest.
