Abstract
The fractal and multifractal methods are now widely used for analysis and classification of digital images having complex structure. We present the results of the application of such methods to the images of crystallograms obtained by crystallization with additives. This technique was developed for studying images of blood crystals, and now finds increasing use in the analysis of medicines, checking food and soil quality. In this work we study images of crystallograms of various milk dilutions and crystallograms obtained with bean leave extracts. The results show that the proposed mathematical methods seem to be rather perspective both in comparing images of different classes and in obtaining classifying signs.
Highlights
- Digital image may be interpreted as a state of a process.
- To describe the process by using its images we should analyze image structure.
- Methods of fractal and multifractal analysis give numerical characteristics of the structure.
- Perspective trend: estimation of the quality of food, soil, medicine.
1. Introduction
Crystallization (nucleation and growth) of copper chloride () in thin films of aqueous solutions is affected by additive and by interfacial tensions at different interfaces of the system. In addition, the factors concerning experimental set-up (temperature, relative humidity, evaporation rate, convection) have some significant influence. An additive generates various ramification patterns, according to its nature and concentration. Little modifications or alterations of may drastically change the structure of the ramification patterns [1, 2].
Various, chemical or biological (soluble or insoluble) substances may influence crystallization. Generally, slows down the crystal growth and enhances the forks; it competes with the growth unit for the growth at this site. The growth rate is influenced by the respective diffusion rates of and . Thus, as according to the type of additive very large morphological variability in the crystals can be obtained, we can use this property to supplement usual analytical methods [1-3].
For example, the crystallization with additive can be used to check the quality of food (e.g. vegetable, milk), and the incidence of farming or industrial method to conserve it. In the case of milk it is proved that treatments for conservation affect composition and biological properties (digestibility, bioavailability of calcium), which may impair the biological benefit for the consumer. In this case, a clear correlation exists between crystallization picture and biological properties [1, 2].
It has been shown that if is human blood the crystallographic variables are correlated with groups of pathologies and are predictive of a worsening pneumoconiosis. Otherwise the results obtained reinforce the hypothesis that the method enables visualization of the risk indicators of pathologies manifesting in general practice (risk of cancer appearing) or occupational health (early diagnosis of occupational diseases in various industrial contexts) [1, 4-6].
Normalized operating conditions obtaining reproducible results and homogenous morphologies were described in [7, 8]. Visual perception of crystallograms obtained with the same class of still may be difficult because images have complex structures. It is the reason why we propose quantitative analysis of the crystallograms which may open up new perspectives of this technique.
In the investigation of many processes digital images which show the states of the process at various moments of time are often used. Records of electroencephalograms and electrocardiograms, images of clusters appearing in diffusion processes, the distribution of the magnetic fields intensity in a given area may be considered as examples of such images. As a rule, the study and analysis of digital images begin from their visual perception. Our vision usually marks differences in the image structure by revealing “topological invariants” (substructures which may slightly change their metric properties but be recognizable under some metric transformations, e.g. circle and ellipse) or objects which may be considered as the specific peculiarities of the image.
Frequently the knowledge of the expert is his ability to find the features of the images and construct associative chains of it to represent the results of the observation as the description of the image structure. Using mathematical methods for the analysis of digital images, we also tend to reveal such peculiarities that may be considered as characteristics of the structure. Thus, mathematical methods are often based on the formalization of our visual perception, and in this sense, the formalization of the knowledge of the expert. Hence the choice of an appropriate formalization of topological invariants may lead to reliable results.
While working with a colour image we may choose one of existing methods of the image representation, which is called colour model. Any model defines a coordinate system, where every colour is given by the unique point. In practice Red-Green-Blue model (RGB) is widely used in colour monitors. The model Hue Saturation Intensity (HSI) fits the colour perception of human better. It separates luminance (grayscale) and colour information of the image and allows the application of many methods for grayscale image processing. The detailed description of colour models and formulas for the transformation of images from one model to another may be found in [9]. In obtaining classifying signs the choice of colour model is rather important. The using RGB may prove ineffective in demonstrating the peculiarities of complex structures, whereas monochrome or HSI palette may reveal subtle difference in structures of images.
In this work we present 3 methods of image analysis based on the calculation of fractal dimensions and multifractal spectra. All of them may be applied to analyse high resolution images with complex structure and obtain a vector of numerical values (classifying sign) which describes the structure of an image. The signs based on calculation fractal type characteristics were successfully applied for classification of images of histological preparations in [10].
The paper is organized as follows. Section 2 describes the types of crystallograms that were analysed. Section 3 is devoted to the description of 3 mathematical methods of digital image analysis. In the section 4 the results of the application of these methods to the images given are presented. In conclusion, we discuss the possibilities and perspectives of these methods for analysis and classification of crystallization images.
2. Material and methods
Products, crystallization apparatus and operating protocol are described in [4, 5]. The crystallograms are obtained by evaporating 6 ml of a mixture poured in a cylindrical dish (diameter 10 cm), made up of an diluted or suspended in an aqueous solution. The crystallization apparatus used realizes isotropic conditions; the aqueous vapour resulting of evaporation is wiped out by a controlled air flow (HR %, °C, speed) across the crystallization apparatus.
2.1. Crystallograms obtained with milk
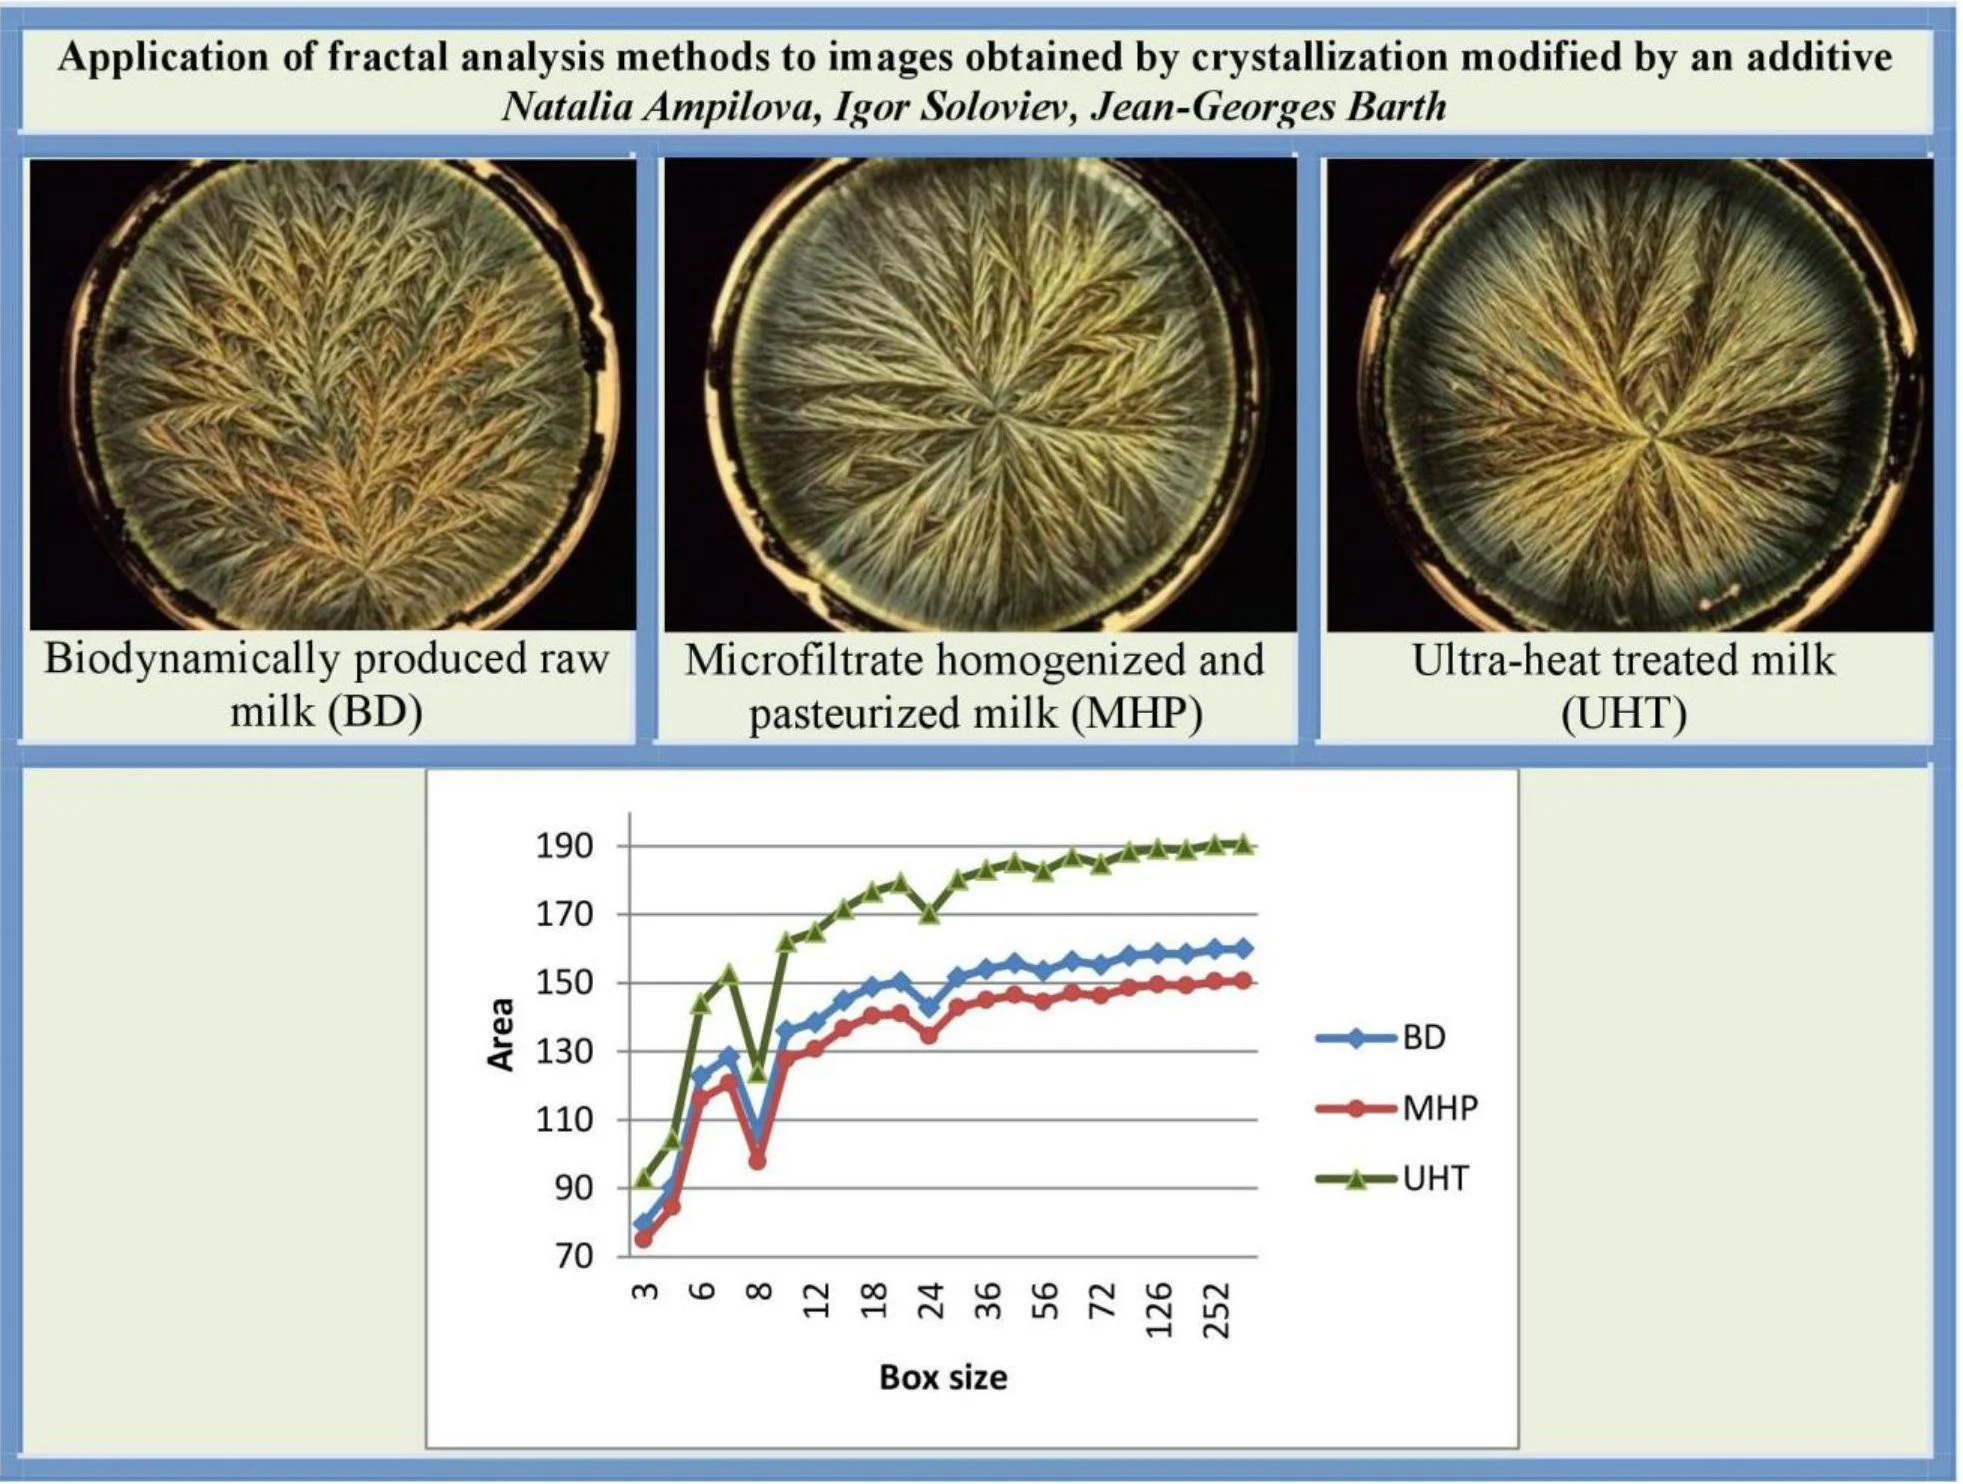
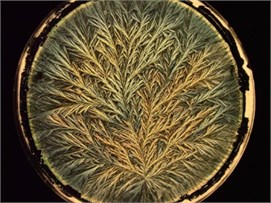
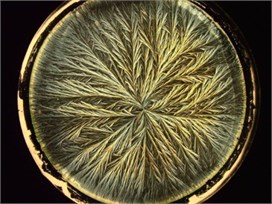
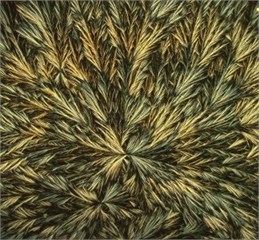
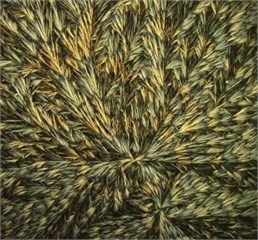
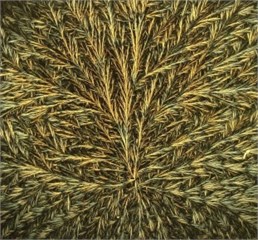
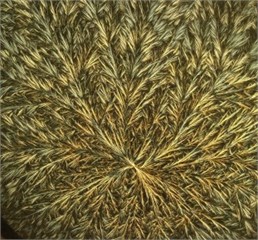
The mixture to be evaporated has the following composition: 6 ml of milk dilution (6.25 μl∙ml-1) in an aqueous solution (55 μmolml-1). Three sorts of milk were analysed: a) biodynamically produced raw milk (Sennerei Bachtel-Damalis AG, CH 8342 Wernetshausen; denoted as BD milk); b) milk from organic production microfiltrate homogenized and pasteurized (Molkerei Biedermann CH 9220 Bischofszell; denoted as MHP milk); ultra-heat treated milk (Coop, CH Basel; denoted as UHT milk).The obtained results are shown on Fig. 1.
All the images have size 2016×1512 and were obtained in RGB colour model.
Fig. 1Crystallograms obtained with a) BD milk, b) MHP milk, c) with UHT milk
a)
b)
c)
2.2. Crystallograms obtained with beans
The crystallograms obtained with bean leave extracts are shown on Fig. 2. They were obtained by evaporating 6 ml of an aqueous solution of copper chloride (24.5 μmolml-1) containing beans leave extract (130 µlml-1).
Bush bean seeds (cv. SAXA from Bingenheimer Saatgut AG, Kronstraße 24, D-61209 Echzell) are sown on the 18th of May, in 4 planters containing a soil mixture available of the shelf (Ökohum GmbH, Ebertingen – D – 88518; terriccio universale bio; characteristics: N2: 65 mg/L (40-90); P2O5: 100 mg/L (60-140); K20: 760 mg/L; pH (CaCl2): 6.3 (5.9-6.7; salts (KCl) 1.4 g/L (0.85-1.95 g/L; organic substances 20 % (15-25 %).
Fig. 2Crystallograms obtained with bean extracts. Beans were cultivated as mentioned above and sprayed with distilled water (B1) or with the suspension of silica (B2), or with two 501 preparations C10 and C11 (B3 and B4 respectively)
a) B1
b) B2
c) B3
c) B4
At 2-nod stage (cotyledons felt down, 2 opposite leaves, and 1 trifoliate leave), the beans were sprayed with approximately 20 ml water or suspension of silica or of 501 preparations (C10 and C11; [11]) after dynamization.
Additive preparation: in 5 days after spraying, 1 of the opposite leaves and the trifoliate leave from the next nod were harvested from different plants to make up 21 g; the leaves were crushed and suspended with 600 ml of distilled water and filtered after agitation for 10 min; the filtrate being additive ().
All the images have size 1750×1500 and were obtained in RGB. By visual perception the images are rather similar. Hence, they may have close structures and thereby close numerical characteristics.
3. The description of mathematical methods
To reveal the details of complex structures of crystallograms methods of texture analysis may be applied, in particular the methods based on calculation of various kinds of fractal dimensions. If a given image is considered as multifractal, i.e. a union of fractal sets, being each of them has its own fractal dimension then a set of these dimensions is called multifractal spectrum. As a rule, the subsets of a multifractal set are interlaced and to divide the set on subsets we have to divide all the points of the initial image into groups in accordance with a sign. Depending on the choice of the sign one may obtain different multifractal spectra, but all of them characterise mutual arrangement of domains with different intensities, i.e. reflect a distribution of a measure defined on the image. Hence multifractal spectrum is natural vector description of the structure of an image.
We use here three methods. The fractal signature method calculates fractal dimension of the image (or its part) by constructing a special surface. The second method allows us to calculate multifractal spectrum by using so called density function to divide an image into fractal subsets. And the last method allows us to obtain the multifractal spectrum in a parametrized form by using generalized statistical sum.
3.1. Fractal signature method
The method described is used to obtain fractal dimension of the image by calculating the approximate area of a special gray level surface for a given image. The method (blanket technic) was described in [12], and used for solving various application problems in [13-15]. We applied this method in different variants to analyse biomedical preparation images [16, 17]. Here we present brief description of the method.
Let be a gray level image and be the intensity of the th pixel. For the points with coordinates , where , we assume that . In a certain measure range the surface of function can be viewed as fractal. In image processing this surface is a nonempty bounded set in . Surface area may be calculated using the volume of a special -parallel body (“blanket”) with thickness .
For 1, 2, …, the blanket surfaces (upper) and (bottom) are defined iteratively as follows:
We assume that Volume of the blanket is:
The formulas for the calculation of the surface area are:
Fractal dimension of the image is calculated as:
Note that Eq. (3) is more preferable for pure fractal objects, whereas Eq. (4) is used for both fractal and non-fractal surfaces. The application of Eq. (4) is necessary if depends on all lesser scale features: the subtracting isolates the features that change from scale to . In our calculations we use Eq. (4).
One of useful modification of the method is to divide the image on boxes and for each box calculate area of the corresponding surface by the described method. Thus, to obtain area of the whole surface we sum up by . If we repeat this procedure for several values of the box size we obtain the dependence of the surface area on the size of a partition box, i.e. a vector characteristic. The values may be also applied to obtain a segmentation of the image.
It should be noted that we operate with integer numbers in calculations, and values may be large enough: from 103 to 105. Because of this, on graphs values are given in the normalized form, so the maximal result be less than 103. The box size is measured in pixels.
3.2. Calculation of multifractal spectrum by using density function
We calculate the characteristic of every pixel which the authors in [18] proposed to call density function. Then we combine all the pixels with close values of density function into the subset, which results in the partition of the image on the subsets. They are called level sets. For each level set we calculate its fractal dimension.
Let be a measure defined by pixel intensities. In our experiments for any we assume that is equal to the sum of intensities of pixels from . For we denote as the square of length with its center . For a given digital image let , where is called local density function of , and is some constant. Taking several values for we have:
The density function measures the non-uniformity of the intensity distribution in square. The set of all points with local density is level set . In practice, not to increase the number of level sets, nonintersecting sets are considered, such that
For each set we calculate its fractal (capacity) dimension (denoted by for brevity) using well-known Least Square Method. These dimensions form multifractal spectrum As it follows from Eq. (5), the values of are real numbers. The values of fractal dimensions for the subsets in plane are in interval [0, 2]. On graphs obtained in examples numerical values on axis left ends of intervals are marked
It should be noted that for each image we obtain an interval for values of density function, and these intervals are different for different images: the greater interval the more complex structure we reveal. That means that graphs of multifractal spectra have different domains of definition, and it is difficult to bring them to one start point.
3.3. Multifractal spectrum versus generalized statistical sum
Consider set and its finite partition consisting from boxes. Let box size and box measures be given. In [19] the authors offer to calculate the dimension of measure support of as:
For the fact that measure depends on the box size, and , Eq. (6) is equivalent to:
The last formula is the information dimension of the subset on which measure is defined, in other words we calculate the information dimension of measure support.
The authors also described the method for the calculation of multifractal spectrum which is based on the usage of direct multifractal transform of a given initial normed measure and computing the information dimensions of the subsets that are the supports of the initial measure and its multifractal transforms.
This method was described more fully in [20], and here we give only the short description. In what follows we assume that , then . Consider the generalized statistical sum , where is a real number. Given initial distribution we construct the sequence of measures obtained by direct multifractal transform as:
For each measure the information dimension of its support can be calculated by Eq. (7) and set (dimensions of supports) is obtained as follows:
We also calculate the average value of exponents with respect to measure as:
Hence Eqs. (8) and (9) define the set of dimensions (parametrized multifractal spectrum) and the set of the average values of exponents as the functions of parameter . Excluding one may obtain the relation between and . In other words the last formulas give a parametrized representation of multifractal spectrum.
4. Results
4.1. Experiments with milk
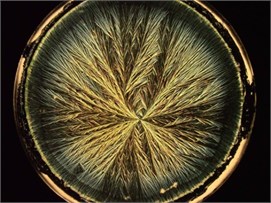
1. Application of fractal signature method.
Initial images were obtained in RGB colour model. In experiments we used representations in grayscale and HSV. The transition from RGB to grayscale as a rule results in averaging of an image structure and the loss of some peculiarities, whereas the analysis on H-component of HSV allows us to reveal the texture of an image and show the difference between images.
If the milk images studied are represented in grayscale, graphs do not show clear separation between the images (Fig. 3(a)). At the same time, calculating surface area using H-component we obtain a numerical characteristic that differs UHT milk from BD and MHP (Fig. 3(b)). The result coincides with visual perception. Hence the choice of the colour model may influence results considerably.
As was mentioned in section 3.1, on graphs the box size is given in pixels, and the values of the surface area are given in normalized form, such that maximal value be less than 103.
Fig. 3Calculation of surface area for different milk crystalograms: a) in grayscale, b) using H-component
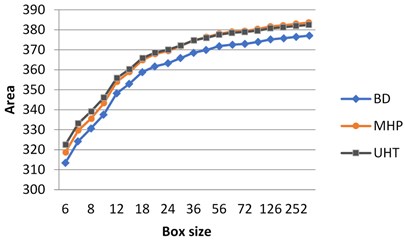
a)
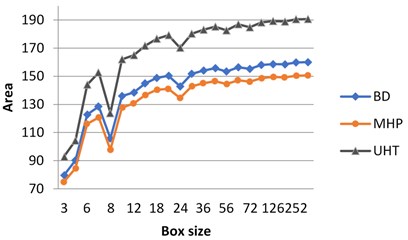
b)
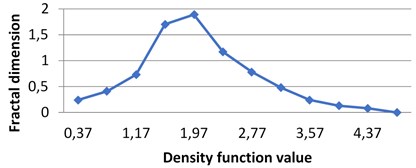
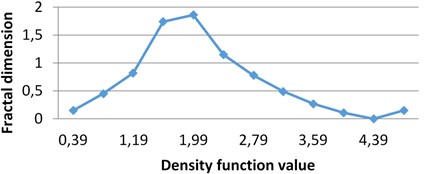
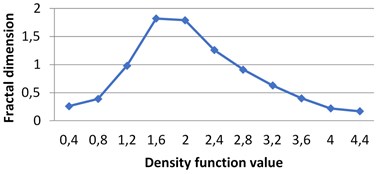
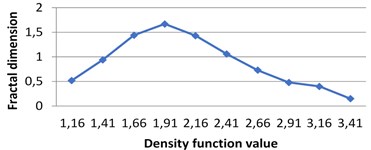
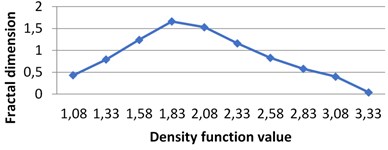
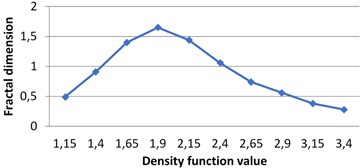
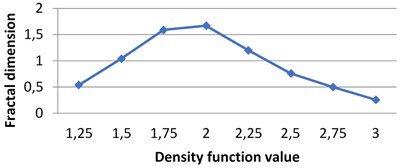
2. Density function method.
By applying the second (density function) method we calculate multifractal spectra for the given images. The calculations were performed in grayscale.
In all these experiments 0.4. It means that for the obtained diapason of level sets are calculated with 0.4 beginning from . As it was mentioned above, different images have different diapasons of density function values, which reflects the peculiarities of image textures.
Fig. 4Multifractal spectra calculated for different milk crystallograms. The graph for UHT milk, c) differs from two others a), b)
a) BD milk
b) MHP milk
c) UHT milk
The following graphs show multifractal spectra for 3 sorts of milk. On axis the values of density function are shown, the values of fractal dimensions of the corresponding level sets are on axis. As the level sets are represented as binary images, we calculate their capacity dimensions. To make the reading of pictures clear, on Fig. 4(a) and Fig. 4(b) values on axis are shown with gaps 0.8.
3. Generalized statistical sum.
For each image we obtain two spectra as the functions of real parameter . The calculations were performed using H-component, [7, 0] by step 0.5. The values of are on axis, the graphs singularity power and multifractal spectra are shown for BD (a), MHP (b) and UHT (c) milk on Fig. 5. All pairs of the graphs are different, which points to the fact that the structures of the images given are distinct.
Fig. 5The graphs of singularity and multifractal spectra for 3 images of milk: a) BD milk, b) MHP milk and c) UHT milk
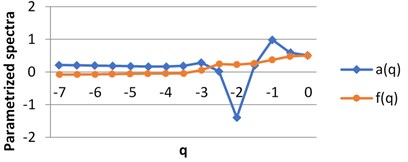
a) BD milk
b) MHP milk
c) UHT milk
4.2. Experiments with beans
1. Fractal signature method.
These experiments were performed in grayscale. Fractal signature method applied to the analysis of the images gives the following graphs presenting the dependence of the surface area on a box size.
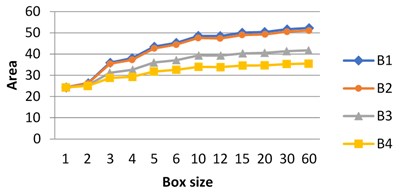
Fig. 6The dependence of the surface area on box size: graphs for images B3 and B4 differ from B1, B2 and from each other. Graphs for B1 and B2 are close
2. Density function method.
In all the experiments 0.25. The graphs below illustrate the difference between intervals for density function.
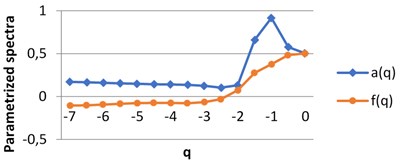
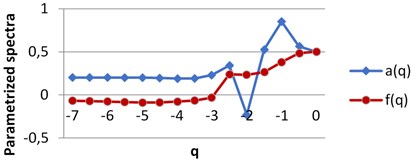
3. Multifractal spectrum versus generalized statistical sum.
For each image we obtain two spectra as the functions of real parameter . The calculations were performed using H component, [–7, 0] by step 0.5.
The graphs for images B1-B4 are shown on Fig. 8.
We see that all the pairs of graphs are different, and this method allows us to reveal small differences in the structure of the images.
Fig. 7The graphs of multifractal spectra for images B1, B2, B3 and B4
a) B1
b) B2
c) B3
d) B4
Fig. 8The graphs of singularity and multifractal spectra for images B1-B4, q∈ [–7, 0]
![The graphs of singularity and multifractal spectra for images B1-B4, q∈ [–7, 0]](https://static-01.extrica.com/articles/20436/20436-img21.jpg)
a) B1
![The graphs of singularity and multifractal spectra for images B1-B4, q∈ [–7, 0]](https://static-01.extrica.com/articles/20436/20436-img22.jpg)
b) B2
![The graphs of singularity and multifractal spectra for images B1-B4, q∈ [–7, 0]](https://static-01.extrica.com/articles/20436/20436-img23.jpg)
c) B3
![The graphs of singularity and multifractal spectra for images B1-B4, q∈ [–7, 0]](https://static-01.extrica.com/articles/20436/20436-img24.jpg)
d) B4
5. Conclusions
Biological properties of various foodstuffs may be studied by analysing their crystallograms. To reveal the structure of images of crystallograms we applied three mathematical methods based on calculation of various fractal characteristics. Our experiments show that the choice of a colour model may be important for the differentiation of images. Using H-component of HSI colour model helps to find some peculiarities in the images with complex structure. The fractal signature method gives reliable results both for milk and beans. The difference in graphs of multifractal spectra obtained by using density function seems to be not very considerable. At the same time for all the images investigated the graphs of parametrized spectra demonstrated good separability of the images. The choice of method depends on the class of the image analysed. To obtain more reliable results several methods in different colour models should be applied.
One of advantage of the approach proposed is obtaining vectors of numerical values, which are “coded” representations of the image structure and may serve as feature vectors in proper computer classifying tools. The methods demonstrated may be used for calculation of numerical characteristics which are used as reliable classifying signs. They allow easier and objective differentiation of crystallograms obtained with the same kind of , especially with plant extracts or in general with foodstuffs.
References
-
Barth J. G. Cuperchloride crystallization with additive and its applications. Elemente der Naturwissenschaft, Vol. 81, 2004, p. 23-49.
-
Cocude M. Une Méthode Pour Évaluer La Qualité Des Produits Alimentaires Et La Santé Des Hommes: Les Cristallisations Sensibles. Saint Marc P & Janet J. L’écologie Au Secours De La Vie, 2004.
-
Reiter G., Barth J. G. Some general remarks on crystallization in the presence of additives. Elemente der Naturwissenschaft, Vol. 92, 2010, p. 30-61.
-
Cocude M., Barth J. G., Bruyet Et François B. P. La pneumoconiose des houilleurs et son suivi médical. La méthode des cristallisations sensibles au banc d’essai. Mines Et Carriers, Vol. 74, 1992, p. 41-47.
-
Shibata T., Tanaka A., Kogure M., Iguchi T., Et Ogawa T. Configuration Cristallographique De Cristaux De Chlorure Cuivrique Hydraté Avec Une Petite Quantité De Sang De Diabétiques. Colloque Cristallisations Sensibles, Paris, 1998.
-
Piva M. T., Lumbroso S., Sieso V., Monnin E., Mion H., Blanc F., Magnan de Bornier B. Cupric chloride crystallization with human blood. Study of pictures obtained in different pathologies. Elemente der Naturwissenschaft, Vol. 61, 1994, p. 25-39.
-
Barth J. G., Roussaux J., Suppan K., Rosa dos Santos S. Crystallization of a film of copper chloride in the presence of additives. Preliminary study on the experimental conditions and criteria of quality. Elemente der Naturwissenschaft, Vol. 94, 2011, p. 69-99.
-
Barth J. G., Roussaux J., Wilkens A., Jacobi M. Techniques for washing the supports used for copper chloride crystallization with additive. Elemente der Naturwissenschaft, Vol. 98, 2013, p. 5-19.
-
Gonzalez R. C., Woods R. E. Digital Image Processing. 3rd Edition, Prentice-Hall, 2007.
-
Sergeev V. The digital image classification based on calculation of Renyi divergence. 13th International Conference on Communications, Electromagnetics and Medical Applications, Sofia, Bulgaria, 2018.
-
Masson P., Masson V. Landwirtschaft, Garten- und Weinbaubiodynamisch. AT Verlag, München, 2013.
-
Falconer K. J. Fractal Geometry: Mathematical Foundations and Application. John Wiley and Sons, 1990.
-
Peleg S., Naor J., Hartley R., Avnir D. Multiple resolution texture analysis and classification. Transactions on Pattern Analysis and Machine Intelligence, Vol. PAMI-6, Issue 4, 1984, p. 518-523.
-
Tang Y. Y., Hong Ma, Dihua Xi, Xiaogang Mao, Suen C. Y. Modified fractal signature (MFS): a new approach to document analysis for automatic knowledge acquisition. IEEE Transactions on Knowledge and Data Engineering, Vol. 9, Issue 5, 1997, p. 747-762.
-
Malamou A., Pandis C., Frangos P., Stefaneas P. SAR image terrain classification using the modified fractal signature (MFS) method. 9th International Conference on Communications, Electromagnetics and Medical Applications, Sofia, Bulgaria, 2014.
-
Gurevich E., Ampilova N., Soloviev I. On a natural-science investigation of the ultralow doses effect, 8th International Conference on Communications, Electromagnetics and Medical Applications, Sofia, Bulgaria, 2013.
-
Ampilova N., Kulikov E, Sergeev V., Soloviev I. Fractal analysis methods in investigation of biomedical preparation images. E-Journal Differential Equations and Control Processes, Vol. 1, 2018, p. 109-125, (in Russian), https://www.math.spbu.ru/diffjournal/pdf/ampilova3.pdf.
-
Yong Xu, Hui Ji, Fermuller C. Viewpoint invariant texture description using fractal analysis. International Journal of Computer Vision, Vol. 83, Issue 1, 2009, p. 85-100.
-
Chabra A., Meneveau C., Jensen R., Sreenivasan K. Direct determination of the f(α) singularities spectrum and its application to fully developed turbulence. Physical Review A, Vol. 40, Issue 9, 1989, p. 5284-5294.
-
Ampilova N., Soloviev I. Entropies in investigation of dynamical systems and their application to digital image analysis. Journal of Measurements in Engineering, Vol. 6, Issue 2, 2018, p. 107-118.
About this article

