Publicado
Análisis de la confusión producida por la creatinina y la edad en la correlación entre los niveles del receptor soluble 1 del factor de necrosis tumoral α (sTNFR1) y la tasa de filtración glomerular estimada (TFGe) en pacientes colombianos con diabetes mellitus tipo 2
Analysis of confounding caused by creatinine and age in the correlation between soluble tumor necrosis factor α receptor 1 (sTNFR1) levels and estimated glomerular filtration rate (eGFR) in Colombian patients with type 2 diabetes
DOI:
https://doi.org/10.15446/revfacmed.v71n3.107190Palabras clave:
Diabetes Mellitus tipo 2, Nefropatía, Receptores del Factor de Necrosis Tumoral, Regresión Lineal (es)Diabetes Mellitus, Type 2, Diabetic nephropathy, Receptors, Tumor Necrosis Factor, Linear Regression (en)
Descargas
Introducción. El factor de necrosis tumoral α (TNF-α) es una citoquina involucrada en los procesos inflamatorios de la diabetes mellitus tipo 2 (DM2). Aunque la correlación entre los niveles del receptor soluble 1 del TNF-α (sTNFR1) y la tasa de filtración glomerular estimada (TFGe) ya ha sido descrita previamente en población colombiana con DM2, la influencia del sTNFR1 en la TFGe en un modelo ajustado a edad y creatinina no ha sido evaluada.
Objetivos. Identificar y evaluar las correlaciones lineales entre los niveles del sTNFR1, las variables clínicas de uso rutinario y la TFGe en pacientes colombianos con DM2.
Materiales y métodos. Estudio transversal realizado en marzo de 2020 en 69 pacientes con DM2 que estaban inscritos en el Programa para la prevención de las complicaciones de la diabetes y las dislipidemias de la Facultad de Medicina de la Universidad Nacional de Colombia. Los datos sociodemográficos, antropométricos y clínicos se recolectaron a partir de la revisión de las historias clínicas. Los niveles séricos del sTNFR1 se determinaron mediante prueba de ELISA. Se realizó un modelo de regresión lineal múltiple (regresión paso a paso) para evaluar las correlaciones entre el sTNFR1, las variables clínicas y la TFGe.
Resultados. El modelo final de regresión lineal múltiple, que incluye niveles de creatinina, niveles del sTNFR1 y edad, explica el 72% de la varianza de la TFGe (p=0.023); además, los niveles del sTNFR1 explican el 20% de la varianza de la TFGe de forma independiente (coeficiente β estandarizado: -0.2; IC95%: [-0.008]-[-0.001]; p=0.02).
Conclusión. En el modelo final de regresión lineal múltiple se encontró una correlación lineal inversamente proporcional y estadísticamente significativa entre los niveles del sTNFR1 y la TFGe, independientemente de los niveles séricos de creatinina y la edad. Comparado con la edad, los niveles del sTNFR1 tienen un efecto superior en términos de cambios en la TFGe.
Introduction. Tumor necrosis factor α (TNF-α) is a cytokine involved in inflammatory processes associated with type 2 diabetes mellitus (DM2). Although the correlation between soluble TNF-α receptor 1 (sTNFR1) levels and estimated glomerular filtration rate (eGFR) has been already described in Colombian population with DM2, the influence of sTNFR1 on eGFR in a model adjusted for age and creatinine level has not yet been evaluated.
Objectives. To identify and evaluate the linear correlations between sTNFR1 levels, routine clinical variables, and eGFR in Colombian patients with DM2.
Materials and methods. Cross-sectional study conducted in March 2020 in 69 patients with DM2 who were enrolled in the Program for the Prevention of Diabetes Complications and Dyslipidemias of the Faculty of Medicine of the Universidad Nacional de Colombia. Medical records were reviewed in order to obtain sociodemographic, anthropometric and clinical data. Serum sTNFR1 levels were determined by means of an ELISA test. A multiple linear regression model (stepwise regression) was performed to evaluate correlations between sTNFR1, clinical variables, and eGFR.
Results. The final multiple linear regression model, which includes creatinine levels, sTNFR1 levels, and age, explained 72% of the variance of eGFR (p=0.023). Furthermore, sTNFR1 levels explained 20% of the variance of eGFR independently (standardized β coefficient: -0.2; 95%CI: [-0.008]-[-0.001]; p=0.02).
Conclusion. In the final multiple linear regression model, an inversely proportional and statistically significant linear correlation was found between sTNFR1 levels and eGFR, independent of serum creatinine levels and age. Compared with age, sTNFR1 levels have a superior effect in terms of changes in eGFR.
Original research
Analysis of confounding caused by creatinine and age in the correlation between soluble tumor necrosis factor α receptor 1 (sTNFR1) levels and estimated glomerular filtration rate (eGFR) in Colombian patients with type 2 diabetes
Análisis de la confusión producida por la creatinina y la edad en la correlación entre los niveles del receptor soluble 1 del factor de necrosis tumoral α (sTNFR1) y la tasa de filtración glomerular estimada (TFGe) en pacientes colombianos con diabetes mellitus tipo 2
Alejandro Poveda1![]() Nicolás Gómez-Banoy2
Nicolás Gómez-Banoy2![]() Ismena Mockus1
Ismena Mockus1![]()
1 Universidad Nacional de Colombia - Bogotá Campus - Faculty of Medicine - Lipid and Diabetes Laboratory - Bogotá D.C. - Colombia.
² Weill Center for Metabolic Health - Cardiovascular Research Institute - Division of Cardiology - Department of Medicine - Weill Cornell Medicine - New York - United States of America.Open access
Received: 08/12/2022
Accepted: 27/05/2023
Corresponding author: Alejandro Poveda. Laboratorio de Lípidos y Diabetes, Facultad de Medicina, Universidad Nacional de Colombia. Bogotá D.C. Colombia.
Email: jalejop@hotmail.com.
Keywords: Diabetes Mellitus, Type 2; Diabetic nephropathy; Receptors, Tumor Necrosis Factor; Linear Regression (MeSH).
Palabras clave: Diabetes mellitus tipo 2;
Nefropatía; Receptores del factor de necrosis tumoral; Regresión lineal (DeCS).
How to cite: Poveda A, Gómez-Banoy N, Mockus I. Analysis of the confounding produced by creatinine and age in the correlation between soluble tumor necrosis factor α receptor 1 (sTNFR1) levels and estimated glomerular filtration rate (eGFR) in Colombian patients with type 2 diabetes. Rev. Fac. Med. 2023;71(3):e107190. English. doi: https://doi.org/10.15446/revfacmed.v71n3.107190.
Cómo citar: Poveda A, Gómez-Banoy N,
Mockus I. [Análisis de la confusión producida por la creatinina y la edad en la correlación entre los niveles del receptor soluble 1 del factor de necrosis tumoral α (sTNFR1) y la tasa de filtración glomerular estimada (TFGe) en pacientes colombianos con diabetes mellitus tipo 2]. Rev. Fac. Med. 2023;71(3):e107190. English. doi: https://doi.org/10.15446/revfacmed.v71n3.107190.
Copyright: Copyright: ©2023 Universidad Nacional de Colombia. This is an open access article distributed under the terms of the Creative Commons Attribution License, which permits unrestricted use, distribution, and reproduction in any medium, as long as the original author and source are credited.
Abstract
Introduction. Tumor necrosis factor α (TNF-α) is a cytokine involved in inflammatory processes associated with type 2 diabetes mellitus (DM2). Although the correlation between soluble TNF-α receptor 1 (sTNFR1) levels and estimated glomerular filtration rate (eGFR) has been already described in Colombian population with DM2, the influence of sTNFR1 on eGFR in a model adjusted for age and creatinine level has not yet been evaluated.
Objectives. To identify and evaluate the linear correlations between sTNFR1 levels, routine clinical variables, and eGFR in Colombian patients with DM2.
Materials and methods. Cross-sectional study conducted in March 2020 in 69 patients with DM2 who were enrolled in the Program for the Prevention of Diabetes Complications and Dyslipidemias of the Faculty of Medicine of the Universidad Nacional de Colombia. Medical records were reviewed in order to obtain sociodemographic, anthropometric and clinical data. Serum sTNFR1 levels were determined by means of an ELISA test. A multiple linear regression model (stepwise regression) was performed to evaluate correlations between sTNFR1, clinical variables, and eGFR.
Results. The final multiple linear regression model, which includes creatinine levels, sTNFR1 levels, and age, explained 72% of the variance of eGFR (p=0.023). Furthermore, sTNFR1 levels explained 20% of the variance of eGFR independently (standardized β coefficient: -0.2; 95%CI: [-0.008]-[-0.001]; p=0.02).
Conclusion. In the final multiple linear regression model, an inversely proportional and statistically significant linear correlation was found between sTNFR1 levels and eGFR, independent of serum creatinine levels and age. Compared with age, sTNFR1 levels have a superior effect in terms of changes in eGFR.
Resumen
Introducción. El factor de necrosis tumoral α (TNF-α) es una citoquina involucrada en los procesos inflamatorios de la diabetes mellitus tipo 2 (DM2). Aunque la correlación entre los niveles del receptor soluble 1 del TNF-α (sTNFR1) y la tasa de filtración glomerular estimada (TFGe) ya ha sido descrita previamente en población colombiana con DM2, la influencia del sTNFR1 en la TFGe en un modelo ajustado a edad y creatinina no ha sido evaluada.
Objetivos. Identificar y evaluar las correlaciones lineales entre los niveles del sTNFR1, las variables clínicas de uso rutinario y la TFGe en pacientes colombianos con DM2.
Materiales y métodos. Estudio transversal realizado en marzo de 2020 en 69 pacientes con DM2 que estaban inscritos en el Programa para la prevención de las complicaciones de la diabetes y las dislipidemias de la Facultad de Medicina de la Universidad Nacional de Colombia. Los datos sociodemográficos, antropométricos y clínicos se recolectaron a partir de la revisión de las historias clínicas. Los niveles séricos del sTNFR1 se determinaron mediante prueba de ELISA. Se realizó un modelo de regresión lineal múltiple (regresión paso a paso) para evaluar las correlaciones entre el sTNFR1, las variables clínicas y la TFGe.
Resultados. El modelo final de regresión lineal múltiple, que incluye niveles de creatinina, niveles del sTNFR1 y edad, explica el 72% de la varianza de la TFGe (p=0.023); además, los niveles del sTNFR1 explican el 20% de la varianza de la TFGe de forma independiente (coeficiente β estandarizado: -0.2; IC95%: [-0.008]-[-0.001]; p=0.02).
Conclusión. En el modelo final de regresión lineal múltiple se encontró una correlación lineal inversamente proporcional y estadísticamente significativa entre los niveles del sTNFR1 y la TFGe, independientemente de los niveles séricos de creatinina y la edad. Comparado con la edad, los niveles del sTNFR1 tienen un efecto superior en términos de cambios en la TFGe.
Introduction
One of the main causes of morbidity and mortality in patients with type 2 diabetes mellitus (DM2) is diabetic nephropathy. This disease, according to Thomas,1 in 2017 had an overall prevalence of 15.48 cases per 1 000 men and 16.5 cases per 1 000 women, caused about 50% of end-stage kidney disease cases, and accounted for 34% and 36% of all chronic kidney disease (CKD) deaths in men and women, respectively.
Patients with DM2 often experience increased glycation, oxidative stress and chronic inflammation, as well as systemic hypertension and dyslipidemia, factors that are determinants for the development and progression of CKD.2,3
DM2 is a proinflammatory disease. In vitro studies, such as that of González et al.,4 have demonstrated that high concentrations of glucose stimulate the secretion of tumor necrosis factor α (TNFα) in human monocytes. TNFα together with other cytokines, as proposed by Tanase et al.,5 promotes a pro-oxidative state; moreover, on its own, it binds to two specific receptors: TNF-α receptor 1 (TNFR1, CD120a, p55) and TNF-α receptor 2 (TNFR2, CD120b, p75).6
In the kidney, TNFR1 expression occurs in the proximal tubule, collecting duct system, vascular endothelium, and vascular smooth muscle.7 It has also been reported that this receptor has a strong expression in endothelial cells of the glomerulus, a moderate expression on the surface of endothelial cells of small arterioles and peritubular capillaries, and a weak or null expression in epithelial cells of the distal convoluted tubule.8 High expression of TNFR1 and TNFR2 is thought to be associated with hyperactivation and dysregulation of the immune system, leading to chronic systemic inflammation.9
The pathophysiology leading to the development of diabetic nephropathy is associated with increased advanced glycation end products, secretion of growth factors, and hemodynamic and hormonal changes (typical of DM2) that induce glomerular hyperfiltration, glomerular hypertension, renal hypertrophy, and altered glomerular composition, which manifest clinically as albuminuria and hypertension.10 Similarly, oxidative stress can cause direct damage to podocytes, mesangial cells and endothelial cells, resulting in proteinuria and tubulointerstitial fibrosis.11
It has been reported that the TNF-α-converting enzyme (TACE) in mice is responsible for the proteolytic release or “shedding” of several cell surface proteins, including TNF, TNFR1, and TNFR2.12 Consequently, TNFR1 and TNFR2 are released into the circulation in their soluble form (sTNFR1 and sTNFR2, respectively). Moreover, in vitro studies in human cells show that TACE is activated upon contact with reactive oxygen species,13,14 and in obese mice an association between insulin resistance and increased levels of TNF-α in adipose tissue has been demonstrated.15
In a review, Radcliffe et al.16 found that, of all potential inflammatory markers, sTNFR1 and sTNFR2 receptors may be the most promising, as several researchers have reported that they are independently associated with both decreased eGFR and the occurrence of stage 3 CKD or end-stage renal disease. Previous studies have shown that subjects with DM2 and poor glycemic control have elevated circulating levels of sTNFR1, which is relevant since it has also been established that sTNFR1 predicts early kidney failure, as elevated levels of this receptor are observed in patients with decreased eGFR.17-19
On the other hand, regarding the use of anti-TNF-α therapy in patients with impaired kidney function, it has been reported that the benefits of using TNFα inhibitors could be limited due to their capacity to induce autoimmunity by altering the normal immune regulation of that factor. Therefore, their implementation in clinical practice would require surveillance for possible complications.20
It should be noted that the correlation between sTNFR1 levels and eGFR has been previously described in the Colombian population with DM2 by Gómez-Banoy et al. 21 However, the influence of sTNFR1 on eGFR in a model adjusted for age and creatinine levels has not been evaluated. In view of the above, the objectives of the present study were to identify and evaluate the linear correlations between sTNFR1 levels, routinely used clinical variables, and eGFR in Colombian patients with DM2.
Materials and methods
Study type and population
Cross-sectional study. The study population consisted of all the patients included in the study by Gómez-Banoy et al.21 (N=98) and the following inclusion and exclusion criteria were considered for sample selection:
Inclusion: being a user of Unisalud medical services as of the date of data collection (March 2020), participating in the Program for the Prevention of Complications of Diabetes and Dyslipidemias of the Faculty of Medicine of the Universidad Nacional de Colombia, having a diagnosis of DM2 according to the current criteria of the American Diabetes Association,22 and agreeing to participate in the study, including the performance of the necessary laboratory tests.
Exclusion: having active neoplastic disease, active autoimmune disease, and/or psychiatric disorders under pharmacological treatment.
Once these eligibility criteria were verified, a sample of 69 patients was obtained.
Procedures
Data collection and variables considered
Based on a medical record review (completed between January and March 2020), data were collected from the 69 participants on the following explanatory variables, which were selected because of their proven validity in previous studies:23-28 age, sex, blood pressure (systolic and diastolic), body mass index (BMI; normal weight: 18.5-24.9kg/m2, overweight: 25.0-29.9kg/m2, and obesity: ≥30kg/m2), waist circumference, type of antidiabetic therapy (dietary measures only, oral antidiabetics only, and insulin therapy alone or in combination), type of antihypertensive therapy, serum values of creatinine, glycated hemoglobin (HbA1c), triglycerides, total cholesterol, HDL cholesterol and LDL cholesterol, urine albumin and albumin‐to‐creatinine ratio, and eGFR calculated using the CKD-EPI equation.
It is worth pointing out that antihypertensive drugs were classified as follows, taking into account the total number of types of antihypertensive drugs used (renin-angiotensin system blockers, calcium channel blockers, alpha 1 adrenergic receptor antagonists, beta adrenergic receptor antagonists, and diuretics): none, use of 1 type of antihypertensive drugs, use of 2 types of antihypertensive drugs, use of 3 types of antihypertensive drugs, and use of 4 types of antihypertensive drugs.
sTNFR1 concentrations
To determine circulating levels of sTNFR1, in February 2020 5mL of blood of each participant, who were fasting at the time of this procedure, was collected by venipuncture from an antecubital vein. Samples were centrifuged at 3 500rpm for 5 minutes and the sera obtained were stored at -80°C until sTNFR1 levels were established. sTNFR1 was measured by ELISA according to the manufacturer’s instructions (R&D Systems Inc, Minneapolis, USA).
Statistical analysis
A descriptive analysis of the data was performed by calculating relative and absolute frequencies for categorical variables and means (x̄) or medians (Md) and standard deviations (SD) or interquartile ranges (IQR) for quantitative variables, according to the distribution of the data as determined using the Kolmogorov-Smirnov test.
To determine the correlations between sTNFR1 concentrations and the other variables, and between eGFR and the other variables, bivariate analyses were performed by calculating Pearson’s correlation coefficient (r) for quantitative variables with a normal distribution of the data, and Spearman’s coefficient (rho) for those that did not have a normal distribution, with a statistical significance level of p<0.05. The influence of biological sex on eGFR was assessed using the Student’s t-test and on sTNFR1 levels using the Mann-Whitney U test. All analyses were performed using SPSS software version 25.
In addition, a multiple linear regression analysis was performed in which variables that showed a significant correlation with eGFR in the bivariate analysis were considered as potential regressors, and variables that are clinically relevant to eGFR were also taken into account. This linear regression analysis was used to determine which variables best explained the eGFR values.
This regression method, according to Szklo & Nieto,29 assesses whether a given variable (x1) is linearly associated with the outcome (y) after controlling for a certain number of covariates; thus, such a model measures the association between the outcome and the independent variables. The stepwise linear regression model (forward selection) starts with no variables, then tests each variable as it is added, and keeps those considered statistically significant, repeating the process until the model results are optimal. Therefore, in this regression method, the β coefficient is initially found and its statistical significance is evaluated for each variable included in the model, eliminating those with values that are not statistically significant (p>0.05) and selecting them based on their level of statistical significance.
Subsequently, the model assumptions are evaluated: the non-collinearity assumption is evaluated by means of the variance inflation factor (VIF) (values <10 are accepted), the “tolerance” (values >0.2 are accepted), and the condition index (values <15 are accepted, and in higher results the variable with a higher proportion of variance in the model is adjusted). Then, the variables that are positive in the diagnosis of collinearity are removed or adjusted; afterwards, in the final model, the Durbin Watson statistic is used to evaluate the assumption of independence of the residuals (values between 1.5 and 2.5 are accepted). Next, the assumption of normality of the residuals is evaluated by means of the Kolmogorov-Smirnov test (values >0.05 are accepted) and by means of normal probability plots (Q-Q plot; the distribution of the residuals should follow the diagonal line pattern). Finally, the homoscedasticity assumption is evaluated by means of a scatter plot of standardized predictions by standardized residuals (the variance of the residuals should be uniform over the entire range of predicted values).
Once the significant correlations were identified with the stepwise regression method, the integrated model hypothesis could be proposed to explain the variance of eGFR.29-32
Ethical considerations
The research was approved by the ethics committee of the Faculty of Medicine of the Universidad Nacional de Colombia according to Minutes No. 015-183 of August 15, 2019. Also, the ethical principles for biomedical research involving human subjects established in the Declaration of Helsinki33 and the scientific, technical and administrative standards for health research in Resolution 8430 of 1993 issued by the Colombian Ministry of Health were taken into account in its preparation.34 All participants signed an informed consent.
Results
Clinical and demographic characteristics of the participants
The mean age of the participants was 69.35 years (SD: 7.32), with ages ranging from 45 to 85 years, and all were of Hispanic ethnicity. The clinical and demographic characteristics, as well as the mean values of sTNFR1 concentrations and laboratory test results considered are presented in Tables 1 and 2.
Table 1. Clinical characteristics (continuous variables).
|
Variables |
Kolmogorov Smirnov |
Median |
Interquartile range |
Mean |
Standard deviation |
|
Age (years) |
0.200 |
70.00 |
10.00 |
69.35 |
7.32 |
|
HbA1c (%) |
0.046 |
7.10 |
1.30 |
7.36 |
1.04 |
|
Triglycerides (mg/dL) |
0.001 |
138.00 |
72.00 |
148.98 |
72.04 |
|
Total cholesterol (mg/dL) |
0.003 |
151.00 |
39.00 |
154.52 |
39.20 |
|
HDL cholesterol (mg/dL) |
0.023 |
42.80 |
15.00 |
43.82 |
10.15 |
|
LDL Cholesterol (mg/dL) |
0.001 |
82.70 |
28.00 |
86.09 |
27.89 |
|
Systolic blood pressure (mmHg) |
0.025 |
125.00 |
19.00 |
126.20 |
14.80 |
|
Diastolic blood pressure (mmHg) |
0.001 |
75.00 |
10.00 |
75.68 |
8.40 |
|
Body mass index (kg/m2) |
0.017 |
27.35 |
7.68 |
27.43 |
4.35 |
|
Waist circumference (cm) * |
0.200 |
94.40 |
12.47 |
94.93 |
9.66 |
|
Urine albumin-creatinine ratio (mg/g) † |
0.001 |
21.05 |
30.23 |
87.85 |
236.04 |
|
Creatinine in blood (mg/dL) |
0.001 |
0.96 |
0.26 |
1.03 |
0.28 |
|
Urine albumin (mg/L) † |
0.001 |
21.05 |
30.23 |
87.85 |
238.04 |
|
eGFR (ml/min/1,73m2) |
0.200 |
68.46 |
16.76 |
68.05 |
14.84 |
|
sTNFR1 (pg/ml) |
0.001 |
1559.35 |
580.10 |
1749.02 |
672.98 |
HbA1C: glycated hemoglobin; eGFR: estimated glomerular filtration rate; sTNFR1: soluble tumor necrosis factor α receptor type 1.
* 1 record was not found for this variable.
† 2 records were not found for this variable.
Source: Own elaboration.
Table 2. Clinical and demographic characteristics (discrete variables).
|
Variables |
n |
% |
|
|
Sex |
Male |
36 |
52.20 |
|
Female |
33 |
47.80 |
|
|
Body mass index |
Normal weight |
24 |
34.78 |
|
Overweight |
21 |
30.43 |
|
|
Obesity |
24 |
34.78 |
|
|
Use of antidiabetic therapy |
Dietary measures only |
6 |
8.69 |
|
Oral antidiabetics only |
40 |
57.97 |
|
|
Insulin therapy alone or in combination |
23 |
33.33 |
|
|
Use of antihypertensives |
None |
20 |
28.98 |
|
Use of 1 type of antihypertensive drug |
17 |
24.64 |
|
|
Use of 2 types of antihypertensive drugs |
20 |
28.98 |
|
|
Use of 3 types of antihypertensive drugs |
9 |
13.04 |
|
|
Use of 4 types of antihypertensive drugs |
3 |
4.35 |
|
Source: Own elaboration.
The bivariate analysis of sTNFR1 showed a very weak statistically significant correlation between sTNFR1 levels and age (rho=0.296; p=0.025), HbA1c (rho=0.284; p=0.018), systolic blood pressure (rho=0.259, p=0.032), and the use of antihypertensives (rho=0.292; p=0.015); a statistically significant weak correlation between sTNFR1 levels and diastolic blood pressure (rho=0.318, p=0.008) and the use of antidiabetic drugs (rho=0.346; p=0.004); and a statistically significant moderate correlation between sTNFR1 levels and creatinine levels (rho=0.479; p=0.001) (Table 3). Regarding biological sex, no significant differences in sTNFR1 levels were observed between males (Md=1581.6; IQR=752.5) and females (Md=1591; IQR=539.8) (U=549, p=0.589).
Table 3. Correlations between soluble tumor necrosis factor α receptor 1 levels and the clinical variables considered.
|
Variables |
sTNFR1 |
|
|
rho |
p-value |
|
|
Age (years) |
0.296 |
0.025 |
|
HbA1c (%) |
0.284 |
0.018 |
|
Triglycerides (mg/dL) |
0.082 |
0.501 |
|
Total cholesterol (mg/dL) |
0.085 |
0.487 |
|
HDL cholesterol (mg/dL) |
0.022 |
0.859 |
|
LDL cholesterol (mg/dL) |
0.036 |
0.770 |
|
Systolic blood pressure (mmHg) |
0.259 |
0.032 |
|
Diastolic blood pressure (mmHg) |
0.318 |
0.008 |
|
Body mass index |
0.127 |
0.299 |
|
Waist circumference |
0.205 |
0.093 |
|
Urine albumin-creatinine ratio (mg/g) |
0.184 |
0.137 |
|
Creatinine in blood (mg/dL) |
0.479 |
0.001 |
|
Urine albumin (mg/L) |
0.184 |
0.137 |
|
Use of antihypertensives |
0.292 |
0.015 |
|
Use of antidiabetic drugs |
0.346 |
0.004 |
|
eGFR (ml/min/1.73m2) |
-0.577 |
0.001 |
sTNFR1: soluble tumor necrosis factor α receptor type 1; HbA1C: glycated hemoglobin; eGFR: estimated glomerular filtration rate.
Source: Own elaboration.
In the bivariate analysis of eGFR, a statistically significant negative weak correlation was observed between eGFR and age (r=-0.351; p=0.003) and antihypertensive use (rho=-0.319; p=0.008), as well as a statistically significant negative moderate correlation between eGFR and sTNFR1 levels (rho=-0.577; p=0.001) (Table 4). Concerning biological sex, no significant differences in eGFR values were observed between men (x̄=67.8; SD=15.5) and women (x̄=67.38; SD=14.25) (t=0.117; p=0.907).
Table 4. Correlations between the estimated glomerular filtration rate values and the clinical variables considered.
|
Variables |
Coefficient |
eGFR |
p-value |
|
Age (years) |
r |
-0.351 |
0.003 |
|
HbA1c (%) |
rho |
0.020 |
0.871 |
|
Triglycerides (mg/dL) |
rho |
-0.081 |
0.510 |
|
Total cholesterol (mg/dL) |
rho |
-0.104 |
0.393 |
|
HDL cholesterol (mg/dL) |
rho |
0.017 |
0.887 |
|
LDL cholesterol (mg/dL) |
rho |
-0.073 |
0.549 |
|
Systolic blood pressure (mmHg) |
rho |
-0.121 |
0.323 |
|
Diastolic blood pressure (mmHg) |
rho |
-0.137 |
0.261 |
|
Body mass index |
rho |
0.008 |
0.949 |
|
Waist circumference |
r |
-0.076 |
0.540 |
|
Urine albumin-creatinine ratio (mg/g) |
rho |
0.043 |
0.728 |
|
Creatinine in blood (mg/dL) |
rho |
-0.753 |
0.001 |
|
Urine albumin (mg/L) |
rho |
-0.043 |
0.728 |
|
Use of antihypertensives |
rho |
-0.319 |
0.008 |
|
Use of antidiabetic drugs |
rho |
-0.215 |
0.076 |
|
eGFR (mL/min/1.73m2) |
rho |
-0.577 |
0.001 |
eGFR: estimated glomerular filtration rate; r: Pearson correlation coefficient; rho: Spearman correlation coefficient; HbA1C: glycated hemoglobin; sTNFR1: soluble tumor necrosis factor α type 1 receptor.
Source: Own elaboration.
The following variables were included in the initial multiple regression model: number of types of antihypertensive drugs used, albumin‐to‐creatinine ratio, age, blood creatinine, and sTNFR1 levels. Subsequently, the number of types of antihypertensive drugs used was discarded because it did not have a significant β coefficient (p=0.159). Regarding the collinearity assessment, the urine albumin‐to‐creatinine ratio variable showed confidence intervals for β including 0, so it had to be removed manually. The age variable showed high collinearity with the variables creatinine levels and sTNFR1 levels due to the elevation of the condition number to 23.47, so it was decided to change the values expressed in this variable to categorical data, grouping them in 5-year age intervals starting at 45 and up to 85, thus reaching the current model.
To learn whether creatinine and sTNFR1 levels and age explained eGFR values, stepwise regression (forward selection) was performed. Table 5 shows that all significance indices and assumptions of model 3, which includes blood creatinine, sTNFR1 and age, are adequate and together explain 73.3% of eGFR. When the variables creatinine levels, sTNFR1 levels and age were incorporated sequentially, the final model (model 3) was found to have greater explanatory power for eGFR values.
Likewise, indicators of the non-collinearity assumption, VIF values <10 and tolerance values >0.20 indicated that there were no high correlations between the factors in the model. The value of the Durbin–Watson statistic was 2.127, which allowed us to determine the assumption of independence of the residuals and, therefore, the generalization of the data.
Table 5. Summary of the model.
|
Variables |
Coefficients |
Collinearity diagnostics |
||||||||||||||||||||
|
Model |
R |
R² |
αR² |
Syx |
Statistics of change |
Unstand coef |
Stand coef |
Sig. |
95%CI for B |
Correlations |
Collinearity statistics |
Condition index |
Proportions σ² (entering alters the parameter by more than 20%) |
|||||||||
|
Change in R² |
Change in F |
Sig. Change in F |
B |
Σ |
β |
Lower Lim |
Upper Lim |
Zero order |
Tolerance |
VIF |
K |
Crea |
Age int |
sTNFR1 2020 |
||||||||
|
1 |
K |
0.818a |
0.670 |
0.660 |
8.563 |
0.668 |
135.03 |
0 |
111.420 |
3.909 |
0 |
103.620 |
119.223 |
7.450 |
1 |
0.98 |
||||||
|
Crea |
-42.290 |
3.639 |
-0.818 |
0 |
-49.560 |
-35.028 |
-0.818 |
1 |
1 |
|||||||||||||
|
2 |
K |
0.843b |
0.710 |
0.700 |
8.064 |
0.042 |
9.544 |
0.003 |
120.510 |
4.713 |
0 |
111.100 |
129.923 |
10.159 |
1 |
0.34 |
0.43 |
|||||
|
Crea |
-39.940 |
3.511 |
-0.772 |
0 |
-46.950 |
-32.932 |
-0.818 |
0.953 |
1.049 |
|||||||||||||
|
Age int |
-2.138 |
0.692 |
-0.210 |
0 |
-3.520 |
-0.756 |
-0.377 |
0.953 |
1.049 |
|||||||||||||
|
3 |
K |
0.856 c |
0.730 |
0.720 |
7.807 |
0.022 |
5.417 |
0.023 |
120.380 |
4.564 |
0 |
111.260 |
129.492 |
12.633 |
0.7 |
0.72 |
0.18 |
0.3 |
||||
|
Crea |
-33.330 |
4.431 |
-0.644 |
0 |
-42.180 |
-24.477 |
-0.818 |
0.561 |
1.783 |
|||||||||||||
|
Age int |
-1.954 |
0.675 |
-0.192 |
0.010 |
-3.302 |
-0.607 |
-0.377 |
0.940 |
1.064 |
|||||||||||||
|
sTNFR1 2020 |
-0.004 |
0.002 |
-0.200 |
0.020 |
-0.008 |
-0.001 |
-0.669 |
0.558 |
1.793 |
|||||||||||||
|
E |
AntiAHT |
-0.103 |
0.159 |
-0.179 |
0.782 |
1.279 |
||||||||||||||||
|
+ Alb/Crea |
0.862 |
0.744 |
0.727 |
7.695 |
0.018 |
4.267 |
0.043 |
0.009 |
0.004 |
0.148 |
0.04 |
0.000 |
0.018 |
-0.219 |
0.833 |
1.200 |
11.106 |
|||||
|
Age + Crea |
0.840 |
0.706 |
0.696 |
8.114 |
0.039 |
8.528 |
0.005 |
23.470 |
||||||||||||||
K: constant; Crea: creatinine; Int: interval; αR²: adjusted R-squared; Syx: standard error of the estimate; Unstand coef: unstandardized coefficients; Stand coef: standardized coefficient; Sig: significance value; Lower Lim: lower limit; Upper Lim: upper limit; VIF: variance inflation factor; σ²: variance; sTNFR1: soluble tumor necrosis factor type 1 receptor α; E: excluded; AntiAHT: use of antihypertensive drugs; Alb/Crea: albumin‐to‐creatinine ratio.
Source: Own elaboration.
By verifying the assumption of normality of the residuals for the final model using the Kolmogorov-Smirnov test (with Lilliefors correction) a p-value of p=0.200 was found, which reaffirmed the normal distribution of the residuals. The Q-Q plot in Figure 1 shows a distribution that follows a pattern of normality.
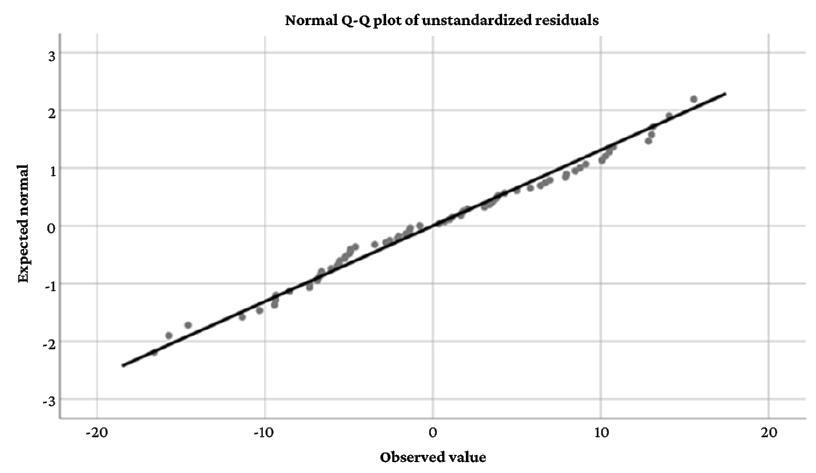
Figure 1. Normal Q-Q plot of unstandardized residuals.
Source: Own elaboration.
Finally, the homoscedasticity assumption was evaluated using the scatter plot of standardized predictions by standardized residuals. It was found that the residuals were evenly distributed against the predictions, as shown in Figure 2.
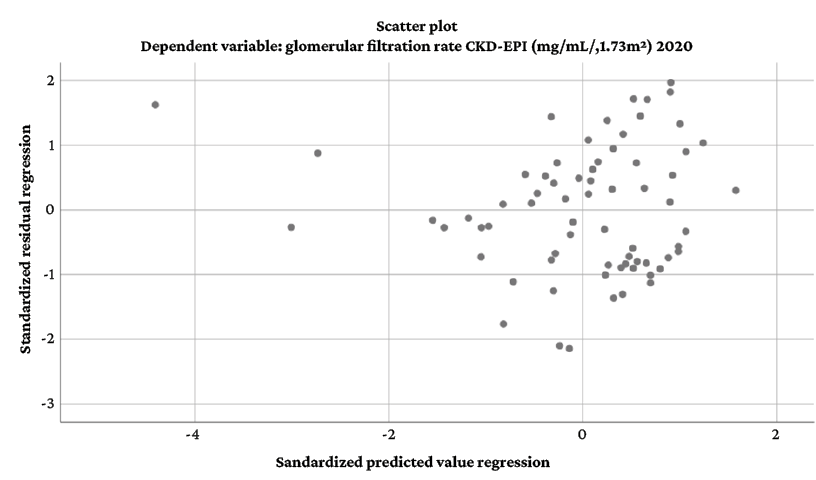
Figure 2. Scatter plot of standardized predictions by standardized residuals.
Source: Own elaboration.
Thus, it was found that the combination of variables associated with eGFR behavior with the best statistical power and explanatory power for eGFR values included creatinine levels, sTNFR1 levels, and age. Biological sex was not taken into account in the statistical analysis due to its dichotomous nature. With this combination of variables, the final equation of the model was generated:
Predicted equation for eGFR values = 120.378 - 33.326 * CREAT - 1.954 * AGE interval - 0.004 * sTNFR1, where it is shown that, in the presence of constant creatinine levels and constant age, for every unit increase in sTNFR1 levels (expressed in pg/mL) a 0.004 mL/min/1.73m2 reduction in eGFR is expected, which would explain a change of up to 20% of the eGFR SD.
Discussion
In the present study, a moderate and statistically significant correlation (rho=0.479; p=0.001) was observed between sTNFR1 levels and creatinine levels, as well as a very weak and statistically significant correlation between sTNFR1 levels and age (rho=0.296; p=0.025), the values of the latter being similar to or lower than those reported in other studies.35-37 The correlation between sTNFR1 levels and age could be explained by an aging-associated dysregulation of the immune system,37 whereas the observed correlation between sTNFR1 levels and creatinine levels may be related to the activation of the TNF-α system that comes with kidney damage in patients with DM2.35
In the present study, the correlations between sTNFR1 levels and blood pressure (systolic: rho=0.259; p=0.032 and diastolic: rho=0.318; p=0.008) and antihypertensive therapy (rho=0.292; p=0.015) were weak. The correlation between sTNFR1 levels and arterial pressure and stiffness had already been described in other articles with similar results. For example, González-Clemente et al.,38 in a study conducted in Spain with 112 patients with a diagnosis of type 1 diabetes mellitus seen in primary care units, found that sTNFR1 correlated significantly with pulse pressure (r: 0.215; p=0.030). In turn, Kim et al.,39 in a study of 117 patients with suspected coronary artery disease seen at a Medical Center in Seoul, Korea, found that the correlation between sTNFR1 levels and brachial-ankle pulse wave velocity was significant positive (r: 0.483; p<0.001). Importantly, despite the frequency of this finding, it is impossible to deduce whether changes in sTNFR1 levels are what cause alterations in blood pressure, or whether changes in blood pressure cause the increase in sTNFR1 concentrations.
As for the correlations of eGFR, in the present study they were found to be significant with age (r: -0.351; p=0.003) and creatinine levels (rho: -0.743; p=0.001). These variables are taken into account in the formulas for calculating eGFR in the American Diabetes Association guidelines,40 and in the present study they were confounding factors in the correlation between sTNFR1 and eGFR in the multiple linear regression model.
The correlation between eGFR and the use of antihypertensive drugs was also significant in the present study (rho: -0.319; p=0.008). This is similar to the findings of Iwao et al.,41 who in a study of 33 patients with CKD treated at Oita University Hospital, Japan, found that the weight-corrected intensity of antihypertensive treatment score showed a significant correlation with eGFR (r: -0.472; p=0.006), postulating vascular injury, associated with hypertension and kidney damage, as a trigger for vascular insufficiency.
For their part, Gómez-Banoy et al.21 reported a significant negative linear correlation between sTNFR1 levels and eGFR (r: -0.448; p=0.001), which was also observed in the present study with the same strength (rho: -0.577; p=0.001). This correlation had already been reported in other studies with a range of moderate to strong correlation.42-44 In this sense, the present study confirms the association between chronic inflammation and the development of diabetic nephropathy and reinforces the hypothesis that chronic inflammation plays a role in regulating TNFα-associated kidney damage.
The multiple linear regression model performed in the present study demonstrated a decrease in eGFR of 0.004 mL/min/1.73m2 for each unit change in pg/mL of sTNFR1, suggesting a close correlation between sTNFR1 levels and eGFR. According to this model, patients in the same age range and with the same creatinine level can show changes of up to 20% in eGFR SD explained only by sTNFR1 (2.95 mL/min/1.73m2 per 679.87 pg/mL sTNFR1). These results elucidate the confounding effect of creatinine and age on eGFR calculation and describe the linear correlations between sTNFR1 levels and eGFR in a Hispanic population with a diagnosis of DM2 and age older than 45 years.
This correlation between sTNFR1 and CKD and eGFR had already been reported in bivariate analyses performed in patients with CKD and in older adults.43-46 Furthermore, several articles involving models adjusted for multiple demographic characteristics have shown an increased risk of decreased eGFR at higher concentrations of sTNFR1.17,47,48
In the present study, sTNFR1 concentrations performed better in explaining eGFR SD than age (standardized coefficient eGFR: -0.2 vs. standardized coefficient age: -0.192), which allows us to question the influence of age on the estimation of eGFR. In this regard, in a cohort study comparing outcomes associated with CKD defined by a fixed eGFR threshold with an age-adapted one, Liu et al.49 established that current criteria for CKD using the same eGFR threshold for all ages may result in overestimation of the burden of CKD, overdiagnosis, and unnecessary interventions in an aging population. In this sense, it is possible that the use of sTNFR1 in the calculation of eGFR offers more precise measures of glomerular filtration rate; therefore, studies that evaluate the correlation between sTNFR1 levels and eGFR using more specific methods, such as inulin clearance,50 and that discriminate demographic
characteristics would be useful to further investigate this finding.
Other confounding factors in the correlation between sTNFR1 and eGFR are patient sex and race. In the present study, race was not a confounding factor because all participants were Hispanic, and with respect to sex, no significant differences in sTNFR1 levels were observed (U=549, p=0.589). This was also reported by Pulido-Pérez et al.,51 who conducted a study in 265 patients (111 men and 154 women) with a diagnosis of DM2 or at risk for this disease treated at a Medical Unit of the Social Security Institute of Puebla, Mexico, establishing that there are no significant differences for sTNF and sTNFR1 between women and men with DM2.1
Based on the above, it can be assumed that the correlation between sTNFR1 levels and eGFR depends on other related factors, such as atherosclerosis,39 the intensity of antihypertensive therapy (which according to Iwao et al.41 may reflect the state of vascular insufficiency), or the degree of histological lesion associated with diabetic nephropathy. Regarding the latter factor, Fernandez-Real et al.,35 in a prospective cross-sectional study evaluating TNF-α activity in association with renal histology in 22 patients with DM2, found a correlation between sTNFR1 levels and the degree of “mesangial expansion” (r: 0.59;
p=0.004) and “interstitial fraction” (r: 0.58; p=0.005).
The main limitation of the present study is its cross-sectional nature and that it was conducted in a specific cohort of individuals who were enrolled in a program to control the complications associated with DM2, which means that it is not a representative sample of this population in Colombia or even in Bogotá and, therefore, the cause-effect relationships reported here cannot be generalized. Consequently, further studies with larger and more representative samples of these patients in the city and the country are required to confirm these correlations.
Conclusions
In the final multiple linear regression model, an inversely proportional and statistically significant linear correlation was found between sTNFR1 levels and eGFR. This correlation is independent of serum creatinine levels and patient age. Compared with age, sTNFR1 has a superior effect on changes in eGFR.
It is possible that increased circulating levels of sTNFR1 may be the result of renal damage events and impaired glomerular filtration that are not detected in routine tests. Therefore, it is recommended to carry out new studies with a representative sample of the Colombian population with DM2 in order to reach conclusions applicable to the national level. Likewise, the findings of the present study suggest the need to develop new instruments that allow the early detection of kidney damage in patients with DM2.
Conflicts of interest
None stated by the authors.
Funding
This research was funded by the Call for the support of research and artistic creation projects of the Bogotá Campus of the Universidad Nacional de Colombia - 2019 through code 48047.
Acknowledgments
To the “Prevention of Diabetes and Dyslipidemia Complications” program of the Lipids and Diabetes Division of the Department of Physiological Sciences of the Faculty of Medicine of the Universidad Nacional de Colombia, including all its staff; to the Universidad Nacional de Colombia, which through this program allows the development of research projects; to Juan Camilo Mendoza, who explained to each patient the purpose of this study; to Yamile Vargas, for her work in the logistics of the research; and to María Camila Garzón López, who provided guidance on biostatistics.
References
1.Thomas B. The global burden of diabetic kidney disease: Time Trends and Gender Gaps. Curr Diab Rep. 2019;19(4):18. https://doi.org/jbrx.
2.Rabbani N, Thornalley PJ. Protein glycation - biomarkers of metabolic dysfunction and early-stage decline in health in the era of precision medicine. Redox Biol. 2021;42:101920. https://doi.org/jbrz.
3.Donate-Correa J, Luis-Rodríguez D, Martín-Núñez E, Tagua VG, Hernández-Carballo C, Ferri C, et al. Inflammatory Targets in Diabetic Nephropathy. J Clin Med. 2020;9(2):458. https://doi.org/gg99j5.
4.Gonzalez Y, Herrera MT, Soldevila G, Garcia-Garcia L, Fabián G, Pérez-Armendariz EM, et al. High glucose concentrations induce TNF- a production through the down-regulation of CD33 in primary human monocytes. BMC Immunol. 2012;13:19. https://doi.org/f33dsf.
5.Tanase DM, Gosav EM, Anton MI, Floria M, Seritean-Isac PN, Hurjui LL, et al. Oxidative Stress and NRF2/KEAP1/ARE Pathway in Diabetic Kidney Disease (DKD): New Perspectives. Biomolecules. 2022;12(9):1227. https://doi.org/jmtc.
6.Varfolomeev E, Vucic D. Intracellular regulation of TNF activity in health and disease. Cytokine. 2018;101:26-32. https://doi.org/gcrx2m.
7.Mehaffey E, Majid DSA. Tumor necrosis factor-α, kidney function, and hypertension. Am J Physiol Renal physiol. 2017;313(4):F1005-8. https://doi.org/gb39vf.
8.Al-Lamki RS, Wang J, Skepper JN, Thiru S, Pober JS, Bradley JR. Expression of tumor necrosis factor receptors in normal kidney and rejecting renal transplants. Lab Invest. 2001;81(11):1503-15. https://doi.org/jbr2.
9.Alshevskaya A, Koneva O, Belomestnova I, Lopatnikova J, Evsegneeva I, Zhukova J, et al. Ligand-Regulated Expression of TNF Receptors 1 and 2 Determines Receptor-Mediated Functional Responses. Int Arch Allergy Immunol. 2021;182(11):1077-88. https://doi.org/jbr3.
10.Umanath K, Lewis JB. Update on Diabetic Nephropathy: Core Curriculum 2018. Am J Kidney Dis. 2018;71(6):884-95. https://doi.org/gdnts9.
11.Samsu N. Diabetic Nephropathy: Challenges in Pathogenesis, Diagnosis, and Treatment. Biomed Res Int. 2021;2021:1497449. https://doi.org/gnhbcp.
12.Reddy P, Slack JL, Davis R, Cerretti DP, Kozlosky CJ, Blanton RA, et al. Functional analysis of the domain structure of tumor necrosis factor-alpha converting enzyme. J Biol Chem. 2000;275(19):14608-14. https://doi.org/b76z2m.
13.Zhang Z, Oliver P, Lancaster JR Jr, Schwarzenberger PO, Joshi MS, Cork J, et al. Reactive oxygen species mediate tumor necrosis factor alpha-converting, enzyme-dependent ectodomain shedding induced by phorbol myristate acetate. FASEB J. 2001;15(2):303-5. https://doi.org/cxjrr6.
14.Zhang Z, Kolls JK, Oliver P, Good D, Schwarzenberger PO, Joshi MS, et al. Activation of tumor necrosis factor- alpha -converting enzyme-mediated ectodomain shedding by nitric oxide. J Biol Chem. 2000;275(21):15839-44. https://doi.org/cjzrhd.
15.Berbudi A, Rahmadika N, Tjahjadi AI, Ruslami R. Type 2 Diabetes and its Impact on the Immune System. Curr Diabetes Rev. 2020;16(5):442-9. https://doi.org/gjt28j.
16.Radcliffe NJ, Seah JM, Clarke M, MacIsaac RJ, Jerums G, Ekinci EI. Clinical predictive factors in diabetic kidney disease progression. J Diabetes Investig. 2017;8(1):6-18. https://doi.org/f9krmk.
17.Bhatraju PK, Zelnick LR, Shlipak M, Katz R, Kestenbaum B. Association of Soluble TNFR-1 Concentrations with Long-Term Decline in Kidney Function: The Multi-Ethnic Study of Atherosclerosis. J Am Soc Nephrol.
2018;29(11):2713-21. https://doi.org/gfmh6p.
18.Chang LH, Hwu CM, Lin YC, Huang CC, Won J, Chen HS, et al. Soluble Tumor Necrosis Factor Receptor Type 1 Levels Exhibit A Stronger Association With Renal Outcomes Than Traditional Risk Factors in Chinese Subjects With Type 2 Diabetes Mellitus. Endocr Pract. 2020;26(10):1115-24. https://doi.org/jbr5.
19.Barr ELM, Barzi F, Hughes JT, Jerums G, Hoy WE, O’Dea K, et al. High Baseline Levels of Tumor Necrosis Factor Receptor 1 Are Associated With Progression of Kidney Disease in Indigenous Australians With Diabetes: The eGFR Follow-up Study. Diabetes Care. 2018;41(4):739-47. https://doi.org/jcd6.
20.Lousa I, Reis F, Santos-Silva A, Belo L. The Signaling Pathway of TNF Receptors: Linking Animal Models of Renal Disease to Human CKD. Int J Mol Sci. 2022;23(6):3284. https://doi.org/kz4v.
21.Gómez-Banoy N, Cuevas V, Higuita A, Aranzález LH, Mockus I. Soluble tumor necrosis factor receptor 1 is associated with diminished estimated glomerular filtration rate in colombian patients with type 2 diabetes. J Diabetes Complications. 2016;30(5):852-7. https://doi.org/f8t52q.
22.American Diabetes Association. 2. Classification and Diagnosis of Diabetes: Standards of Medical Care in Diabetes—2021. Diabetes Care. 2021;44(Suppl 1):S15-33. https://doi.org/fvp7.
23.Faselis C, Katsimardou A, Imprialos K, Deligkaris P, Kallistratos M, Dimitriadis K. Microvascular Complications of Type 2 Diabetes Mellitus. Curr Vasc Pharmacol. 2020;18(2):117-24. https://doi.org/gkgshj.
24.Zhang XX, Kong J, Yun K. Prevalence of Diabetic Nephropathy among Patients with Type 2 Diabetes Mellitus in China: A Meta-Analysis of Observational Studies. J Diabetes Res. 2020;2020:2315607. https://doi.org/gpzxpb.
25.Vijan S. Type 2 Diabetes. Ann Intern Med. 2019;171(9):ITC65-80. https://doi.org/gghps5.
26.Ueki K, Sasako T, Okazaki Y, Miyake K, Nangaku M, Ohashi Y, et al. Multifactorial intervention has a significant effect on diabetic kidney disease in patients with type 2 diabetes. Kidney Int. 2021;99(1):256-66. https://doi.org/gh5xjh.
27.Pugliese G, Penno G, Natali A, Barutta F, Di Paolo S, Reboldi G, et al. Diabetic kidney disease: new clinical and therapeutic issues. Joint position statement of the Italian Diabetes Society and the Italian Society of Nephrology on “The natural history of diabetic kidney disease and treatment of hyperglycemia in patients with type 2 diabetes and impaired renal function”. J Nephrol. 2020;33(1):9-35. https://doi.org/gr77vw.
28.Zou Y, Zhao L, Zhang J, Wang Y, Wu Y, Ren H, et al. Development and internal validation of machine learning algorithms for end-stage renal disease risk prediction model of people with type 2 diabetes mellitus and diabetic kidney disease. Ren Fail. 2022;44(1):562-70. https://doi.org/kz7p.
29.Szklo M, Nieto FJ. Epidemiología Intermedia: conceptos y aplicaciones. Madrid: Ediciones Díaz de Santos; 2003.
30.Celis-de la Rosa AdJ, Labrada-Martagón V. Bioestadística. 3th ed. México D.C.: Manual Moderno; 2014.
31.Londoño JL. Metodología de la investigación epidemiológica. 6th ed. Bogotá D.C.: Manual Moderno; 2017.
32.Pardo-Merino A, Ruiz-Díaz MA. Análisis de datos con SPSS 13 Base. McGraw-Hill; 2005.
33.World Medical Association (WMA). WMA Declaration of Helsinki – Ethical principles for medical research involving human subjects. Fortaleza: 64th WMA General Assembly; 2013.
34.Colombia. Ministerio de Salud. Resolución 8430 de 1993 (octubre 4): Por la cual se establecen las normas científicas, técnicas y administrativas para la investigación en salud. Bogotá D.C.; October 4, 1993.
35.Fernández-Real JM, Vendrell J, García I, Ricart W, Vallès M. Structural damage in diabetic nephropathy is associated with TNF-α system activity. Acta Diabetol. 2012;49(4):301-5. https://doi.org/bnk3h7.
36.Safranow K, Dziedziejko V, Rzeuski R, Czyzycka E, Wojtarowicz A, Bińczak-Kuleta A, et al. Plasma concentrations of TNF-alpha and its soluble receptors sTNFR1 and sTNFR2 in patients with coronary artery disease. Tissue Antigens. 2009;74(5):386-92. https://doi.org/bpgznh.
37.Denollet J, Vrints CJ, Conraads VM. Comparing Type D personality and older age as correlates of tumor necrosis factor-α dysregulation in chronic heart failure. Brain Behav Immun. 2008;22(5):736-43.
https://doi.org/cjn5wj.
38.González-Clemente JM, Giménez-Pérez G, Richart C, Broch M, Caixàs A, Megia A, et al. The tumour necrosis factor (TNF)-alpha system is activated in accordance with pulse pressure in normotensive subjects with type 1 diabetes mellitus. Eur J Endocrinol. 2005;153(5):687-91. https://doi.org/cckp4b.
39.Kim HL, Lee JP, An JN, Kim JH, Lim WH, Seo JB, et al. Soluble Tumor Necrosis Factor Receptors and Arterial Stiffness in Patients With Coronary Atherosclerosis. Am J Hypertens. 2017;30(3):313-8. https://doi.org/jb9t.
40.American Diabetes Association. Standards of Medical Care in diabetes - 2020. Diabetes Care. 2020;43(Suppl 1):S1-S212.
41.Iwao M, Tanaka R, Suzuki Y, Nakata T, Aoki K, Fukuda A, et al. Association between MR-proADM concentration and treatment intensity of antihypertensive agents in chronic kidney disease patients with insufficient blood pressure control. Sci Rep. 2021;11(1):21931. https://doi.org/jcd4.
42.Mokhtar ER, M E, Hassan MA, Abou-ELHassan HA, Alanany MG, Hasuna MA. Association of sTNFR1 and BNP Levels with Diminished Estimated Glomerular Filtration Rate in Type 2 Diabetic Egyptian Patients. Egypt J Immunol. 2018;25(1):57-69.
43.Moreira JM, da Silva AN, Marciano Vieira ÉL, Teixeira AL, Kummer AM, Simões E Silva AC. Soluble tumor necrosis factor receptors are associated with severity of kidney dysfunction in pediatric chronic kidney disease. Pediatric Nephrol. 2019;34(2):349-52. https://doi.org/jb9p.
44.Harkin C, Cobice D, Brockbank S, Bolton S, Johnston F, Strzelecka A, et al. Biomarkers for Detecting Kidney Dysfunction in Type-2 Diabetics and Diabetic Nephropathy Subjects: A Case-Control Study to Identify Potential Biomarkers of DN to Stratify Risk of Progression in T2D Patients. Front Endocrinol (Lausanne). 2022;13:887237. https://doi.org/jb9q.
45.Xun C, Zhao Y. Potential Role of Soluble TNF-α Receptors in Diagnosis of Patients with Chronic Kidney Disease. Ann Clin Lab Sci. 2017;47(3):310-4.
46.Carlsson AC, Östgren CJ, Nystrom FH, Länne T, Jennersjö P, Larsson A, et al. Association of soluble tumor necrosis factor receptors 1 and 2 with nephropathy , cardiovascular events , and total mortality in type 2 diabetes. Cardiovasc Diabetol. 2016;15:40. https://doi.org/f3m3jc.
47.Chang LH, Hwu CM, Chu CH, Lin YC, Huang CC, You JY, et al. The combination of soluble tumor necrosis factor receptor type 1 and fibroblast growth factor 21 exhibits better prediction of renal outcomes in patients with type 2 diabetes mellitus. J Endocrinol Invest. 2021;44(12):2609-19. https://doi.org/jcd5.
48.Barr ELM, Barzi F, Hughes JT, Jerums G, Hoy WE, O’Dea K, et al. High Baseline Levels of Tumor Necrosis Factor Receptor 1 Are Associated With Progression of Kidney Disease in Indigenous Australians With Diabetes : The eGFR Follow-up Study. Diabetes Care. 2018;41(4):739-47. https://doi.org/jcd6.
49.Liu P, Quinn RR, Lam NN, Elliott MJ, Xu Y, James MT, et al. Accounting for Age in the Definition of Chronic Kidney Disease. JAMA Intern Med. 2021;181(10):1359-66. https://doi.org/gpxx8v.
50.White CA, Allen CM, Akbari A, Collier CP, Holland DC, Day AG, et al. Comparison of the new and traditional CKD-EPI GFR estimation equations with urinary inulin clearance: A study of equation performance. Clin Chim Acta. 2019;488:189-95. https://doi.org/kz7r.
51.Pulido-Perez P, Torres-Rasgado E, Pérez-Fuentes R, Rosales-Encina JL, Rodríguez-Antolín J, Romero JR. Disordered glycemic control in women with type 2 diabetes is associated with increased TNF receptor-2 levels. J Diabetes Complications. 2021;35(9):107974. https://doi.org/jcd3.
Referencias
Thomas B. The global burden of diabetic kidney disease: Time Trends and Gender Gaps. Curr Diab Rep. 2019;19(4):18. https://doi.org/jbrx.
Rabbani N, Thornalley PJ. Protein glycation - biomarkers of metabolic dysfunction and early-stage decline in health in the era of precision medicine. Redox Biol. 2021;42:101920. https://doi.org/jbrz.
Donate-Correa J, Luis-Rodríguez D, Martín-Núñez E, Tagua VG, Hernández-Carballo C, Ferri C, et al. Inflammatory Targets in Diabetic Nephropathy. J Clin Med. 2020;9(2):458. https://doi.org/gg99j5.
Gonzalez Y, Herrera MT, Soldevila G, Garcia-Garcia L, Fabián G, Pérez-Armendariz EM, et al. High glucose concentrations induce TNF- a production through the down-regulation of CD33 in primary human monocytes. BMC Immunol. 2012;13:19. https://doi.org/f33dsf.
Tanase DM, Gosav EM, Anton MI, Floria M, Seritean-Isac PN, Hurjui LL, et al. Oxidative Stress and NRF2/KEAP1/ARE Pathway in Diabetic Kidney Disease (DKD): New Perspectives. Biomolecules. 2022;12(9):1227. https://doi.org/jmtc.
Varfolomeev E, Vucic D. Intracellular regulation of TNF activity in health and disease. Cytokine. 2018;101:26-32. https://doi.org/gcrx2m.
Mehaffey E, Majid DSA. Tumor necrosis factor-α, kidney function, and hypertension. Am J Physiol Renal physiol. 2017;313(4):F1005-8. https://doi.org/gb39vf.
Al-Lamki RS, Wang J, Skepper JN, Thiru S, Pober JS, Bradley JR. Expression of tumor necrosis factor receptors in normal kidney and rejecting renal transplants. Lab Invest. 2001;81(11):1503-15. https://doi.org/jbr2.
Alshevskaya A, Koneva O, Belomestnova I, Lopatnikova J, Evsegneeva I, Zhukova J, et al. Ligand-Regulated Expression of TNF Receptors 1 and 2 Determines Receptor-Mediated Functional Responses. Int Arch Allergy Immunol. 2021;182(11):1077-88. https://doi.org/jbr3.
Umanath K, Lewis JB. Update on Diabetic Nephropathy: Core Curriculum 2018. Am J Kidney Dis. 2018;71(6):884-95. https://doi.org/gdnts9.
Samsu N. Diabetic Nephropathy: Challenges in Pathogenesis, Diagnosis, and Treatment. Biomed Res Int. 2021;2021:1497449. https://doi.org/gnhbcp.
Reddy P, Slack JL, Davis R, Cerretti DP, Kozlosky CJ, Blanton RA, et al. Functional analysis of the domain structure of tumor necrosis factor-alpha converting enzyme. J Biol Chem. 2000;275(19):14608-14. https://doi.org/b76z2m.
Zhang Z, Oliver P, Lancaster JR Jr, Schwarzenberger PO, Joshi MS, Cork J, et al. Reactive oxygen species mediate tumor necrosis factor alpha-converting, enzyme-dependent ectodomain shedding induced by phorbol myristate acetate. FASEB J. 2001;15(2):303-5. https://doi.org/cxjrr6.
Zhang Z, Kolls JK, Oliver P, Good D, Schwarzenberger PO, Joshi MS, et al. Activation of tumor necrosis factor- alpha -converting enzyme-mediated ectodomain shedding by nitric oxide. J Biol Chem. 2000;275(21):15839-44. https://doi.org/cjzrhd.
Berbudi A, Rahmadika N, Tjahjadi AI, Ruslami R. Type 2 Diabetes and its Impact on the Immune System. Curr Diabetes Rev. 2020;16(5):442-9. https://doi.org/gjt28j.
Radcliffe NJ, Seah JM, Clarke M, MacIsaac RJ, Jerums G, Ekinci EI. Clinical predictive factors in diabetic kidney disease progression. J Diabetes Investig. 2017;8(1):6-18. https://doi.org/f9krmk.
Bhatraju PK, Zelnick LR, Shlipak M, Katz R, Kestenbaum B. Association of Soluble TNFR-1 Concentrations with Long-Term Decline in Kidney Function: The Multi-Ethnic Study of Atherosclerosis. J Am Soc Nephrol.
;29(11):2713-21. https://doi.org/gfmh6p.
Chang LH, Hwu CM, Lin YC, Huang CC, Won J, Chen HS, et al. Soluble Tumor Necrosis Factor Receptor Type 1 Levels Exhibit A Stronger Association With Renal Outcomes Than Traditional Risk Factors in Chinese Subjects With Type 2 Diabetes Mellitus. Endocr Pract. 2020;26(10):1115-24. https://doi.org/jbr5.
Barr ELM, Barzi F, Hughes JT, Jerums G, Hoy WE, O’Dea K, et al. High Baseline Levels of Tumor Necrosis Factor Receptor 1 Are Associated With Progression of Kidney Disease in Indigenous Australians With Diabetes: The eGFR Follow-up Study. Diabetes Care. 2018;41(4):739-47. https://doi.org/jcd6.
Lousa I, Reis F, Santos-Silva A, Belo L. The Signaling Pathway of TNF Receptors: Linking Animal Models of Renal Disease to Human CKD. Int J Mol Sci. 2022;23(6):3284. https://doi.org/kz4v.
Gómez-Banoy N, Cuevas V, Higuita A, Aranzález LH, Mockus I. Soluble tumor necrosis factor receptor 1 is associated with diminished estimated glomerular filtration rate in colombian patients with type 2 diabetes. J Diabetes Complications. 2016;30(5):852-7. https://doi.org/f8t52q.
American Diabetes Association. 2. Classification and Diagnosis of Diabetes: Standards of Medical Care in Diabetes—2021. Diabetes Care. 2021;44(Suppl 1):S15-33. https://doi.org/fvp7.
Faselis C, Katsimardou A, Imprialos K, Deligkaris P, Kallistratos M, Dimitriadis K. Microvascular Complications of Type 2 Diabetes Mellitus. Curr Vasc Pharmacol. 2020;18(2):117-24. https://doi.org/gkgshj.
Zhang XX, Kong J, Yun K. Prevalence of Diabetic Nephropathy among Patients with Type 2 Diabetes Mellitus in China: A Meta-Analysis of Observational Studies. J Diabetes Res. 2020;2020:2315607. https://doi.org/gpzxpb.
Vijan S. Type 2 Diabetes. Ann Intern Med. 2019;171(9):ITC65-80. https://doi.org/gghps5.
Ueki K, Sasako T, Okazaki Y, Miyake K, Nangaku M, Ohashi Y, et al. Multifactorial intervention has a significant effect on diabetic kidney disease in patients with type 2 diabetes. Kidney Int. 2021;99(1):256-66. https://doi.org/gh5xjh.
Pugliese G, Penno G, Natali A, Barutta F, Di Paolo S, Reboldi G, et al. Diabetic kidney disease: new clinical and therapeutic issues. Joint position statement of the Italian Diabetes Society and the Italian Society of Nephrology on “The natural history of diabetic kidney disease and treatment of hyperglycemia in patients with type 2 diabetes and impaired renal function”. J Nephrol. 2020;33(1):9-35. https://doi.org/gr77vw.
Zou Y, Zhao L, Zhang J, Wang Y, Wu Y, Ren H, et al. Development and internal validation of machine learning algorithms for end-stage renal disease risk prediction model of people with type 2 diabetes mellitus and diabetic kidney disease. Ren Fail. 2022;44(1):562-70. https://doi.org/kz7p.
Szklo M, Nieto FJ. Epidemiología Intermedia: conceptos y aplicaciones. Madrid: Ediciones Díaz de Santos; 2003.
Celis-de la Rosa AdJ, Labrada-Martagón V. Bioestadística. 3th ed. México D.C.: Manual Moderno; 2014.
Londoño JL. Metodología de la investigación epidemiológica. 6th ed. Bogotá D.C.: Manual Moderno; 2017.
Pardo-Merino A, Ruiz-Díaz MA. Análisis de datos con SPSS 13 Base. McGraw-Hill; 2005.
World Medical Association (WMA). WMA Declaration of Helsinki – Ethical principles for medical research involving human subjects. Fortaleza: 64th WMA General Assembly; 2013.
Colombia. Ministerio de Salud. Resolución 8430 de 1993 (octubre 4): Por la cual se establecen las normas científicas, técnicas y administrativas para la investigación en salud. Bogotá D.C.; October 4, 1993.
Fernández-Real JM, Vendrell J, García I, Ricart W, Vallès M. Structural damage in diabetic nephropathy is associated with TNF-α system activity. Acta Diabetol. 2012;49(4):301-5. https://doi.org/bnk3h7.
Safranow K, Dziedziejko V, Rzeuski R, Czyzycka E, Wojtarowicz A, Bińczak-Kuleta A, et al. Plasma concentrations of TNF-alpha and its soluble receptors sTNFR1 and sTNFR2 in patients with coronary artery disease. Tissue Antigens. 2009;74(5):386-92. https://doi.org/bpgznh.
Denollet J, Vrints CJ, Conraads VM. Comparing Type D personality and older age as correlates of tumor necrosis factor-α dysregulation in chronic heart failure. Brain Behav Immun. 2008;22(5):736-43.
González-Clemente JM, Giménez-Pérez G, Richart C, Broch M, Caixàs A, Megia A, et al. The tumour necrosis factor (TNF)-alpha system is activated in accordance with pulse pressure in normotensive subjects with type 1 diabetes mellitus. Eur J Endocrinol. 2005;153(5):687-91. https://doi.org/cckp4b.
Kim HL, Lee JP, An JN, Kim JH, Lim WH, Seo JB, et al. Soluble Tumor Necrosis Factor Receptors and Arterial Stiffness in Patients With Coronary Atherosclerosis. Am J Hypertens. 2017;30(3):313-8. https://doi.org/jb9t.
American Diabetes Association. Standards of Medical Care in diabetes - 2020. Diabetes Care. 2020;43(Suppl 1):S1-S212.
Iwao M, Tanaka R, Suzuki Y, Nakata T, Aoki K, Fukuda A, et al. Association between MR-proADM concentration and treatment intensity of antihypertensive agents in chronic kidney disease patients with insufficient blood pressure control. Sci Rep. 2021;11(1):21931. https://doi.org/jcd4.
Mokhtar ER, M E, Hassan MA, Abou-ELHassan HA, Alanany MG, Hasuna MA. Association of sTNFR1 and BNP Levels with Diminished Estimated Glomerular Filtration Rate in Type 2 Diabetic Egyptian Patients. Egypt J Immunol. 2018;25(1):57-69.
Moreira JM, da Silva AN, Marciano Vieira ÉL, Teixeira AL, Kummer AM, Simões E Silva AC. Soluble tumor necrosis factor receptors are associated with severity of kidney dysfunction in pediatric chronic kidney disease. Pediatric Nephrol. 2019;34(2):349-52. https://doi.org/jb9p.
Harkin C, Cobice D, Brockbank S, Bolton S, Johnston F, Strzelecka A, et al. Biomarkers for Detecting Kidney Dysfunction in Type-2 Diabetics and Diabetic Nephropathy Subjects: A Case-Control Study to Identify Potential Biomarkers of DN to Stratify Risk of Progression in T2D Patients. Front Endocrinol (Lausanne). 2022;13:887237. https://doi.org/jb9q.
Xun C, Zhao Y. Potential Role of Soluble TNF-α Receptors in Diagnosis of Patients with Chronic Kidney Disease. Ann Clin Lab Sci. 2017;47(3):310-4.
Carlsson AC, Östgren CJ, Nystrom FH, Länne T, Jennersjö P, Larsson A, et al. Association of soluble tumor necrosis factor receptors 1 and 2 with nephropathy , cardiovascular events , and total mortality in type 2 diabetes. Cardiovasc Diabetol. 2016;15:40. https://doi.org/f3m3jc.
Chang LH, Hwu CM, Chu CH, Lin YC, Huang CC, You JY, et al. The combination of soluble tumor necrosis factor receptor type 1 and fibroblast growth factor 21 exhibits better prediction of renal outcomes in patients with type 2 diabetes mellitus. J Endocrinol Invest. 2021;44(12):2609-19. https://doi.org/jcd5.
Barr ELM, Barzi F, Hughes JT, Jerums G, Hoy WE, O’Dea K, et al. High Baseline Levels of Tumor Necrosis Factor Receptor 1 Are Associated With Progression of Kidney Disease in Indigenous Australians With Diabetes : The eGFR Follow-up Study. Diabetes Care. 2018;41(4):739-47. https://doi.org/jcd6.
Liu P, Quinn RR, Lam NN, Elliott MJ, Xu Y, James MT, et al. Accounting for Age in the Definition of Chronic Kidney Disease. JAMA Intern Med. 2021;181(10):1359-66. https://doi.org/gpxx8v.
White CA, Allen CM, Akbari A, Collier CP, Holland DC, Day AG, et al. Comparison of the new and traditional CKD-EPI GFR estimation equations with urinary inulin clearance: A study of equation performance. Clin Chim Acta. 2019;488:189-95. https://doi.org/kz7r.
Pulido-Perez P, Torres-Rasgado E, Pérez-Fuentes R, Rosales-Encina JL, Rodríguez-Antolín J, Romero JR. Disordered glycemic control in women with type 2 diabetes is associated with increased TNF receptor-2 levels. J Diabetes Complications. 2021;35(9):107974. https://doi.org/jcd3.
Cómo citar
APA
ACM
ACS
ABNT
Chicago
Harvard
IEEE
MLA
Turabian
Vancouver
Descargar cita
Licencia
Derechos de autor 2022 Revista de la Facultad de Medicina

Esta obra está bajo una licencia Creative Commons Reconocimiento 3.0 Unported.
Derechos de autor
Los autores deben aceptar transferir a la Revista de la Facultad de Medicina los derechos de autor de los artículos publicados. La editorial tiene el derecho del uso, reproducción, transmisión, distribución y publicación en cualquier forma o medio. Los autores no podrán permitir o autorizar el uso de la contribución sin el consentimiento escrito de la revista. Estos archivos están disponibles en https://goo.gl/EfWPdX y https://goo.gl/6zztk4 y deben cargarse en el paso 4 del envío OJS (archivos complementarios).
La carta de cesión de derechos de autor y la de responsabilidad de autoría deben ser entregadas junto con el original.
Aquellos autores/as que tengan publicaciones con esta revista, aceptan los términos siguientes:
- Los autores/as conservarán sus derechos de autor y garantizarán a la revista el derecho de primera publicación de su obra, el cuál estará simultáneamente sujeto a la Licencia de reconocimiento de Creative Commons que permite a terceros compartir la obra siempre que se indique su autor y su primera publicación esta revista.
- Los autores/as podrán adoptar otros acuerdos de licencia no exclusiva de distribución de la versión de la obra publicada (p. ej.: depositarla en un archivo telemático institucional o publicarla en un volumen monográfico) siempre que se indique la publicación inicial en esta revista.
- Se permite y recomienda a los autores/as difundir su obra a través de Internet (p. ej.: en archivos telemáticos institucionales o en su página web) antes y durante el proceso de envío, lo cual puede producir intercambios interesantes y aumentar las citas de la obra publicada. (Véase El efecto del acceso abierto).