
. Introduction
Loess-paleosol sequences (LPS) are terrestrial archives containing information about paleoenvironmental conditions during the Quaternary (see e.g. Antoine et al., 2009; Bösken et al., accepted; Frechen, 2003; Muhs et al., 2008; Sun et al., 2006; and Zeeden et al., in press). In Southeastern Europe, LPS can be several tens of meters thick representing well preserved and high-resolution archives (see e.g. Marković et al., 2008, 2015; Obreht et al., 2014; Stevens et al., 2011 and Zeeden et al., 2016). In contrast to extensively studied LPS along the Danube River, deposits further to the south in the Central Balkan region have been poorly investigated so far (Kostić and Protić, 2000; Basarin et al., 2011 and Obreht et al., 2014). The studied section Stalać is located in this region south of the typical loess distribution area of the Carpathian Basin (Middle Danube Basin) and the Lower Danube Basin, and it is especially important for an integral view on paleoenvironments in the yet poorly investigated interior of the Balkans. This region was under much stronger influence of the Mediterranean climate in the past, suggesting a very dynamic climatic evolution of this region. Thus, the area where the Stalać section is located seems to be potentially extraordinary sensitive to past and present climatic changes (Bösken et al., 2014).
Dating of the sediments is crucial to place the climatic information of a loess-paleosol record into a temporal context. The most commonly used dating technique in LPS is luminescence dating. Loess samples consisting of fine grains of quartz are thought to be the ideal material for optically stimulated luminescence (OSL) dating (Roberts, 2008), but recent studies indicate that this is not necessarily correct. Timar-Gabor et al. (2012, 2015b) found varying dose response curve (DRC) shapes for different grain sizes of quartz that led to age discrepancies. Moreover, disagreements between natural and laboratory-induced DRCs (e.g. Chapot et al., 2012; Timar-Gabor et al., 2015a) raise questions about the reliability of equivalent dose (De) estimates within the high dose range, as natural DRCs saturate earlier than expected from the D0-value (cf. Wintle and Murray, 2006).
Especially for older samples, the application of infrared stimulated luminescence (IRSL) of (coarse-grained) feldspars or (fine-grained) polyminerals is an alternative technique for dating loess deposits. In particular, post-infrared-IRSL methods (pIRIR) are interesting, as these only show negligible fading rates in contrast to conventional IRSL methods (Buylaert et al., 2012; Murray et al., 2009; Thiel et al., 2011; Thomsen et al., 2008; Vasiliniuc et al., 2012 and Zhang et al., 2015). For protocols with elevated preheat and stimulation temperatures fading rates <1%/decade are observed (Zhang et al., 2015), which were suggested to be a laboratory artifact (Vasiliniuc et al., 2012).
The major aim of this study is to construct a reliable luminescence chronology for the Stalać section in the Central Balkan region as a cornerstone for paleoenvironmental investigations (cf. Obreht et al., 2016) by focusing on polymineral pIR50IR290 and quartz OSL dating of fine grains (4-11μm).
. Regional Setting
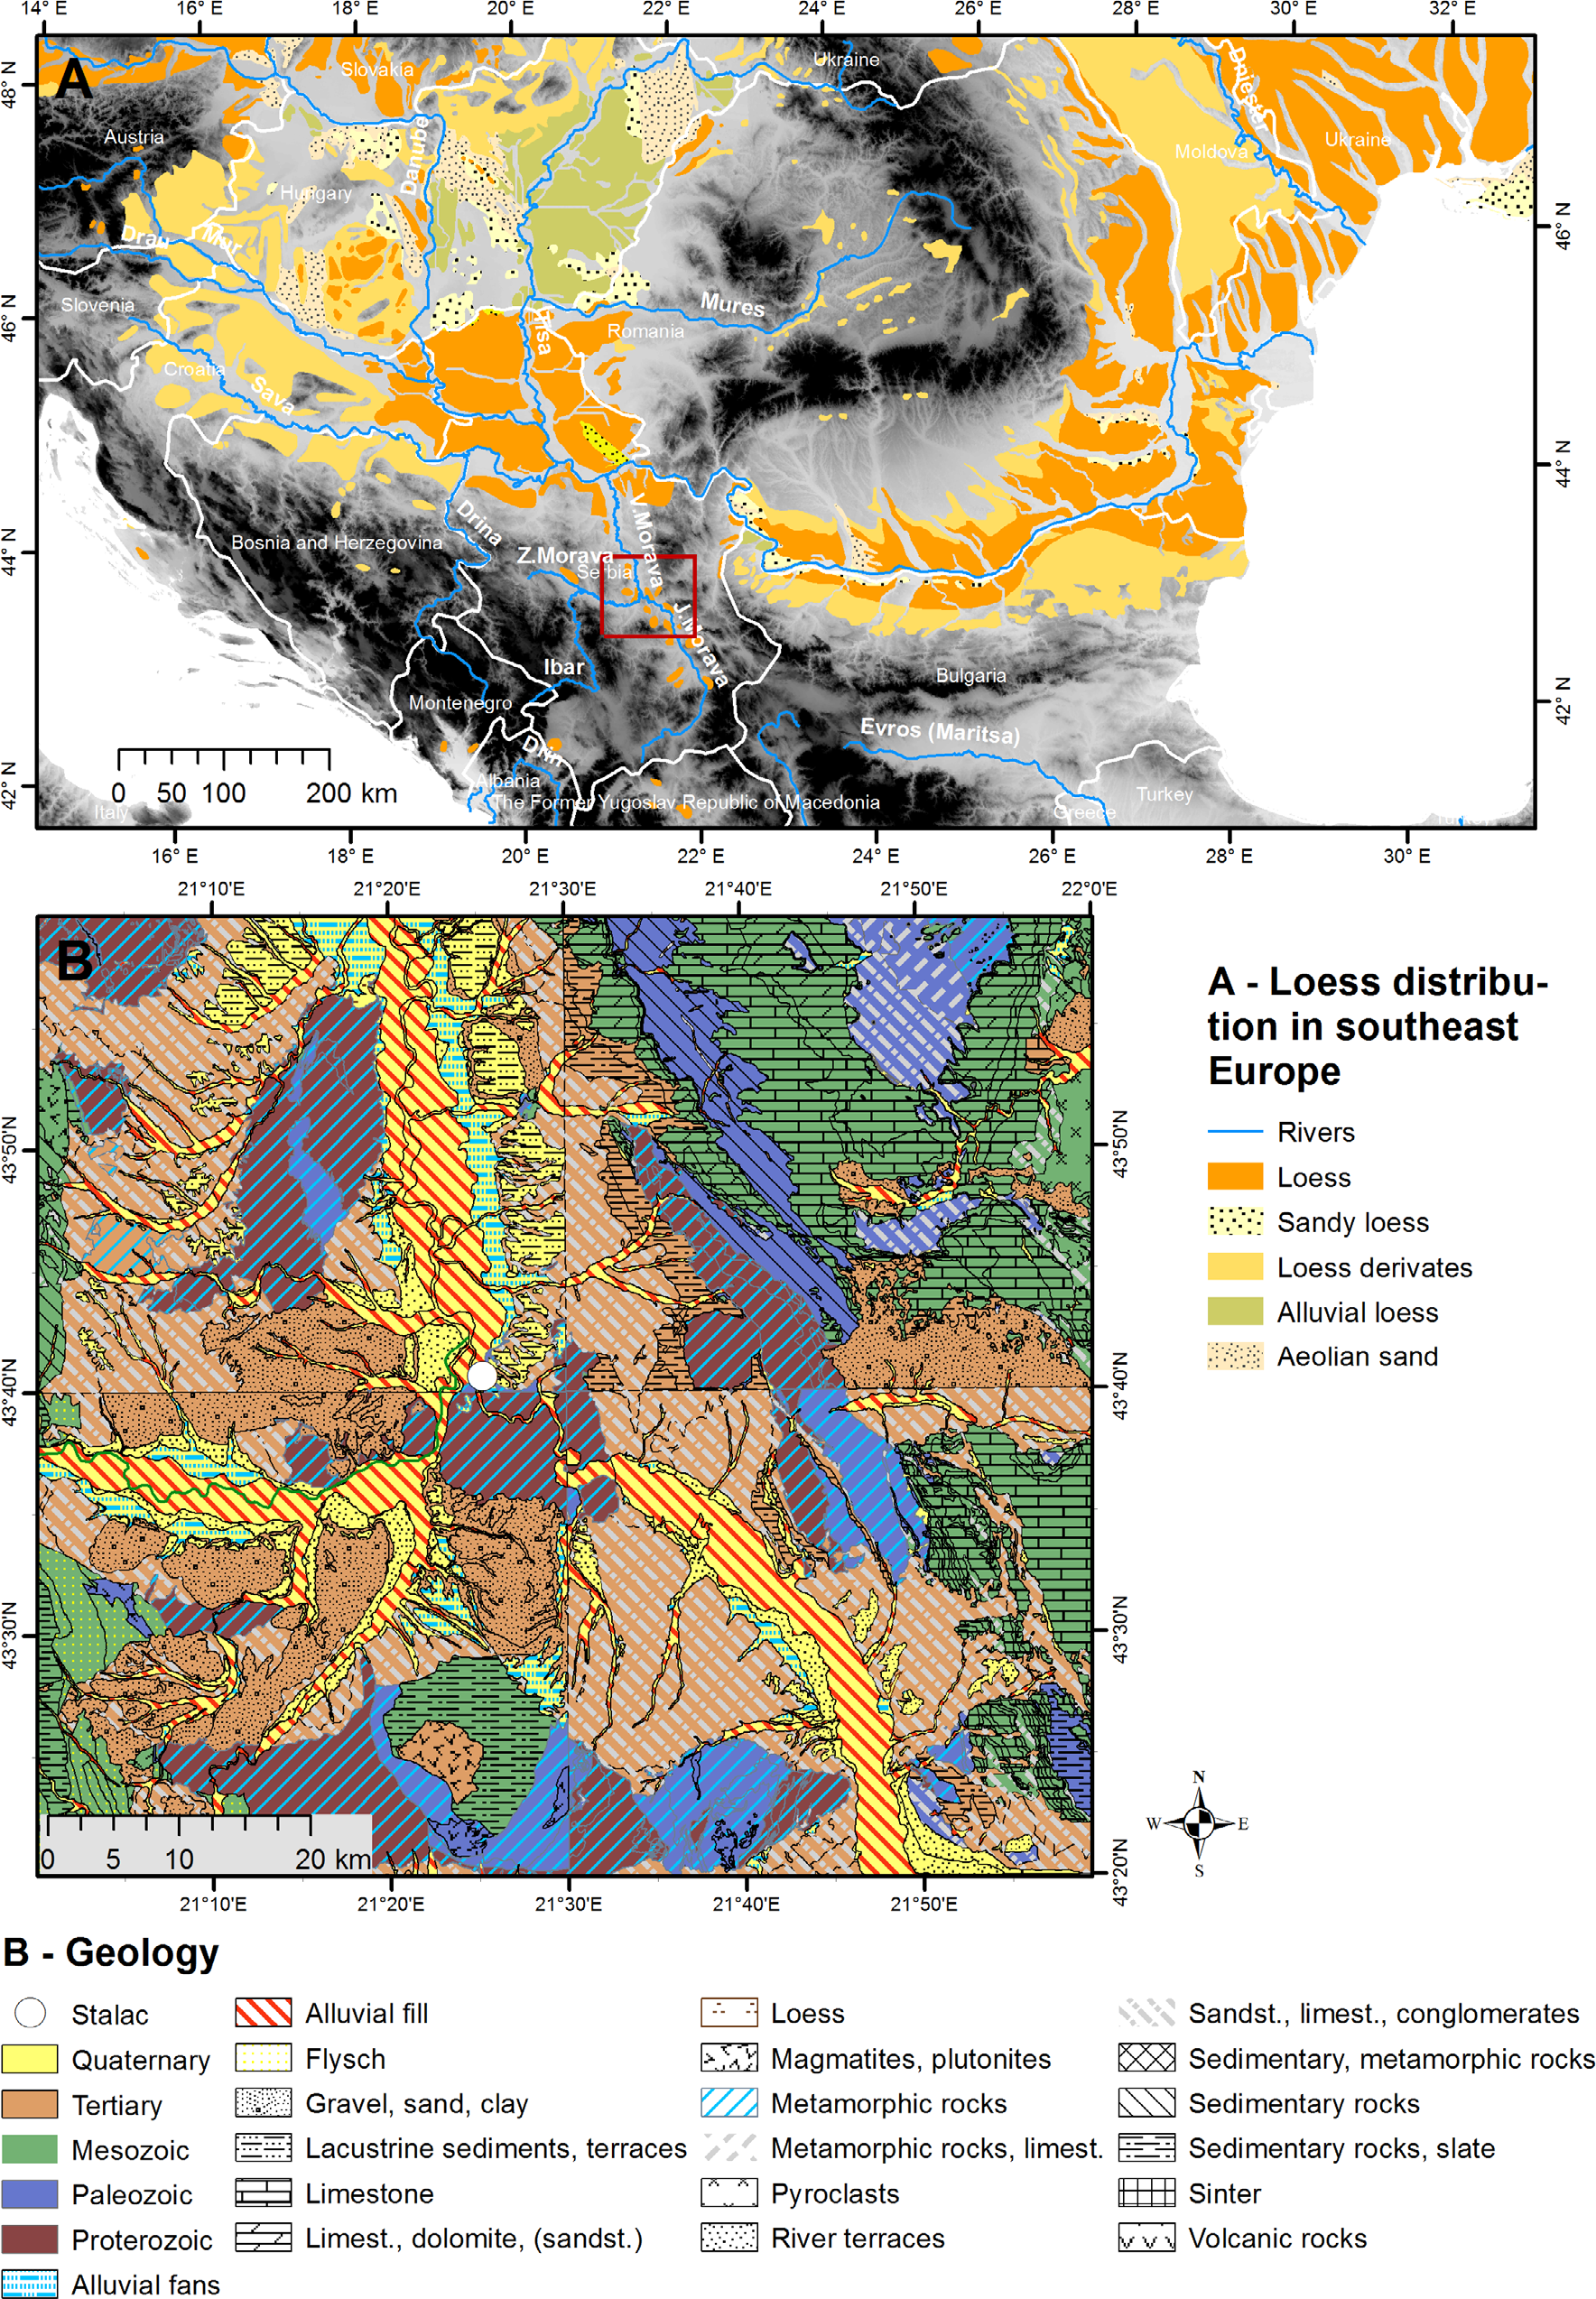
The Stalać section is located in central Serbia (43°40.64812’N, 21°25.06967’E), close to the city of Kruševac (Fig. 1). It is exposed in an active brickyard at the village of Stalać on the east side of the Južna (South) Morava River, ca. 3 km from the confluence of the Južna Morava and the Zapadna (West) Morava Rivers into the Velika (Great) Morava River. Due to the geological setting of those river catchments, transported sediments contain large amounts of igneous and metamorphic detritus, as reported from the Belotinac section located ca. 80 km south of Stalać (Basarin et al., 2011; Obreht et al., 2014). This is also reflected in the geophysical characteristics and geochemistry of the section, showing extraordinary high magnetic susceptibility and several times higher values of Ni and Cr (Obreht et al., 2016) when compared to other LPS in Southeastern Europe (e.g. Buggle et al., 2009, 2008; Marković et al., 2015; Obreht et al., 2015; Újvári et al., 2008 and Zeeden et al., 2016, in press). This clearly points to a mainly local source of the material from the surrounding rivers at the Stalać section.
Figure 1
Distribution of loess and loess derivates modified after Haase et al. (2007), Lindner et al, (2017), and Vandenberghe et al. (2014) (A). Red square indicates the extent and location of map B. Map B shows a simplified geological map (Boljevac, 1968; Dolić et al., 1980; Krstić et al., 1978; and Rakić et al., 1975). The location of the Stalać section is indicated by a white circle.
The loess deposits at Stalać are formed as a plateau-like structure covering the eastern slopes of the tectonically controlled Morava-floodplain-basin. Geomorphology and present day land-use-patterns indicate that wide spread and thick Middle and Late Pleistocene loess is restricted to the eastern slopes of this basin north of the confluence of the Južna Morava and the Zapadna (West) Morava Rivers indicating prevailing north-western winds. Southeast to northwest trending 2 to 3 km long valleys are cut into the plateau. The depositional pattern of the loess-paleosol-sequence argues for their potentially constant activity throughout the time of loess deposition. Shorter maximum 1 km long valleys occur as tributaries of the main valleys and seem to be formed as gullies during single and dramatic erosional events and later filled up with eolian loess. The northwest trending depth line of such a structure is presently located just 200 m to the South of the sampled outcrop wall and might form the base-level of the observed erosional surface in the loess sequence.
The current climatic conditions are characterized with moderate continental conditions. From 1981 to 2010, the mean annual temperature (with a high interannual variability) was 11.4°C at a nearby climate station in Kruševac; the mean annual precipitation was 628 mm and exhibits precipitation maxima in June and November (RHMS of Serbia, 2016).
Fig. 1 Shows the loess distribution of Southeastern Europe and the location of the section. Moreover, it displays a simplified geological map. The geological map (Boljevac, 1968; Dolić et al., 1980) indicates Cenozoic clays, sandstones, conglomerates, slates; Mesozoic lime-stones, sandstones, marls, and dolomites; and Proterozoic slates, shales and schists exposed in the mountains and a Holocene fluvial landscape development in the valleys. Also, Quaternary sediments formed by erosional processes and alluvial fans are present. The location of the Stalać brickyard is mapped as Pleistocene lake sediments on top of Miocene clay, sandstones, and conglomerates; moreover, proterozoic hornfels, schists and migmatite are exposed. The sampled loess deposits are not indicated in the regional geological maps.
Kostić and Prostić (2000) undertook a first paleopedological and mineralogical investigation at the Stalać section. Based on their grain-size, clay minerology and carbonate content result, they showed that the climatic dynamics of this region gradually shifted from a dominated Mediterranean climate towards a more continental climate. This was characterized with decreasing precipitation and possible overall cooling from the Middle to Late Pleistocene. However, no numerical dating was applied, thus their interpretation is based on solely correlative stratigraphy, and will be evaluated by our geochronological investigations.
. Sampling and Stratigraphy
The section is exposed in a northeast to south-westward direction. Fig. S1 shows photos of the site. The section contains a compacted profile in the northeast (not shown in photos), and four dipping profiles on the slope in the southwest. It is possible to track the sediment layers between the profiles. For this study the four profiles on the slope were sampled, as this allowed sampling in a higher stratigraphic resolution. The profiles were carefully cleaned. Sediment, paleosol and tephra layers including their characteristics were recorded and correlated within the individual sub-profiles. Six luminescence samples were taken by hammering and extracting 15 cm long metal tubes into the previously cleaned sediment wall, and by collecting the surrounding material in a radius of 30 cm for dose rate determination.
For a better overview, a composite profile was made out of the four individual profiles using the paleosol and tephra layers (Fig. 2). Stratigraphic labeling followed the scheme proposed by Marković et al. (2015), in which the loess and paleosol stratigraphic units were designated as ‘L’ and ‘S’ and numbered in order of increasing age.
Figure 2
Sketch of composite profile, showing the nomenclature of paleosols and loess (after Marković et al., 2015) and the investigated luminescence samples.
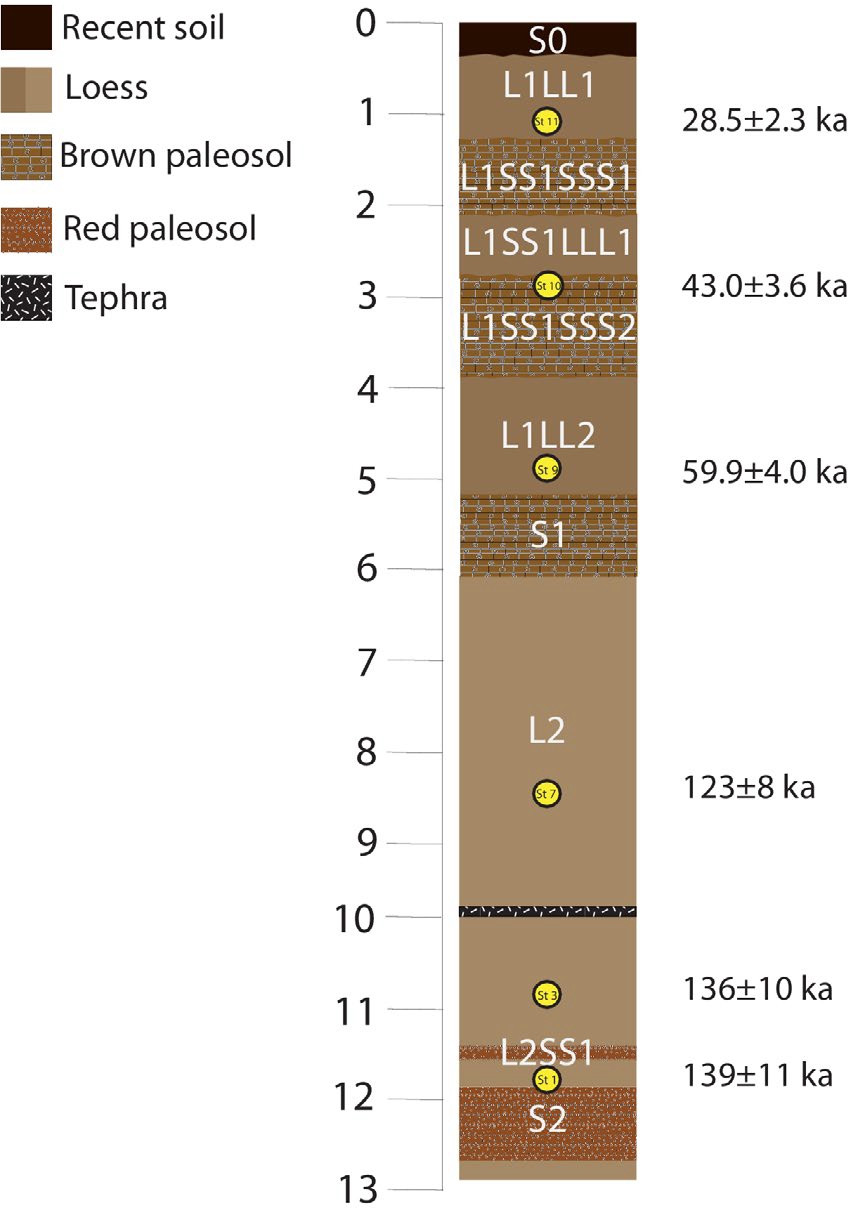
The bottom of the profile starts with a 20 cm thick loess layer. On top, a reddish cambisol (11.9–12.7 m), and a 2 m thick pale yellow loess layer (L2) is exposed. The loess layer is intercalated by a deep-red vertic (11.4511.6 m, L2SS1) and two weak brown humic horizons (10.8–10.9 m, 10.43–10.55 m). At ca. 10 m depth on the composite profile a tephra with a thickness of ca. 5 cm is exposed. Above the tephra follows a thick loess layer (ca. 3.85 m, L2) containing some carbonate concretions in the lower part. The loess layer is intercalated by clearly visible organic layers at ca. 6.6–6.7 m and 7.05–7.15 m. This layer is overlain by a kastanozem-like pedocomplex (S1) with calcareous root channels (5.2–6.05 m). Above, another loess layer (3.9–5.2 m) is exposed, which contains a few darker layers at 4.7–4.85 m and around 4.4 m. On top of this loess layer a second kastanozem-like paleosol (L1SS1SSS2) with a thickness of 1.1 m can be found (2.8–3.9 m). At a depth of 2.1–2.8 m a loess layer (L1SS1LLL1) is located, on top of which a third 80 cm thick kastanozem-like paleosol developed (1.3–2.1 m, L1SS1SSS1). Physical and chemical proxy data (Obreht et al., 2016) revealed the existence of a crypto tephra mixed within the L1SS1LLL1 loess layer at ca. 2.4–2.8 m. Above, a brown loess layer (0.3–1.3 m, L1LL1) is located. On top, the recent soil (S0) is exposed. A more detailed stratigraphy is presented in Obreht et al. (2016).
. Methodology
De Equivalent Dose Measurements
Samples for equivalent dose (De) determination were extracted from the metal tubes under subdued red light conditions; the outer 2 cm of sediment were removed. Samples were oven dried (50°C), the water content was determined (water content over dry mass) and samples were then treated with 10% hydrochloric acid, 10% hydrogen peroxide and 0.01 N sodium oxalate to remove carbonates, organic matter, and to dissolve aggregates. Where needed, 30% hydrogen peroxide was used. After thoroughly removing the chemicals, samples were separated into the 4–11 μm fraction. One part of each fraction was etched in 34% hexafluorosilicic acid for one week to extract fine-grained quartz minerals. The other part remained as a polymineral fraction.
Continuous wave optically stimulated luminescence measurements (CW-OSL) were carried out on a Risø TL/OSL DA 20 reader. The reader is equipped with a 90Sr/90Y β source, blue light emitting diodes (LEDs), emitting at 470 nm (FWHM = 20 nm), and IR LEDs, emitting at 870 nm (FWHM = 40 nm). Signals of quartz were detected through a Hoya U-340 filter and signals of polymineral fine grains were detected through a 410 nm interference filter. A single aliquot regenerative dose (SAR) protocol (cf. Murray and Wintle, 2000, 2003) was applied for quartz. Sensitivity changes, recycling ratios and recuperation were monitored by the SAR protocol (Murray and Wintle, 2000). A preheat plateau test (e.g. Murray and Wintle, 2000) and a dose recovery test (e.g. Murray and Wintle, 2003) were performed on sample C-L3787 prior to De measurements to assess the proper measurement settings. This sample was used for testing after preliminary geochemical results were available. These showed similarities between samples C-L3780 and C-L3787, which is why the tests were done on one sample only. Preheat plateau tests (PHTs) with different preheat and cutheat temperatures between 160°C and 280°C were carried out. Cutheat temperatures were always 20°C lower than preheat temperatures. Dose recovery tests (DRTs) included optical stimulation for 100 s and laboratory irradiation to create a known laboratory dose. The chosen irradiation dose was equal to the expected De. We used an early background subtraction for equivalent dose calculation (Ballarini et al., 2007). The signal was integrated from the first 0.48 s of the 40 s stimulation minus a background of the following 1.28 s.
For polymineral fine grain measurements the pIR50IR290 SAR protocol was used (Thiel et al., 2011). A prior IR stimulation temperature test was performed (cf. Buylaert et al., 2012). Furthermore, a DRT using bleached samples (24 h Hönle Sol2 solar simulator) with the favorable prior IR stimulation temperature was applied. These tests were carried out on C-L3780, C-L3784 and C-L3787. These three samples were chosen based on preliminary sedimentological results indicating different units in the profiles. Finally, the equivalent dose was determined on a minimum of ten aliquots per sample using the arithmetic mean. Polymineral feldspar measurements used a late background subtraction for the dose response curve fitting (e.g. Banerjee et al., 2000). The signal was integrated using the first 2.4 s minus a background of the last 25.6 s (total stimulation length was 200 s). Residual doses were assessed after bleaching the aliquots for 24 hours in a solar simulator. Fading tests were conducted on samples C-L3780 and C-L3787. For these, doses of 650 Gy and 187 Gy were given and the normalized luminescence signals were measured after different storage times between 100 and 800 minutes.
Dose Rate Measurements
Samples for dose rate determination were oven dried (50°C); the water content was determined, and samples were homogenized and packed into plastic cylinders for radionuclide measurements. After a resting period of four weeks to compensate for radon emanation during pretreatment, radionuclide concentrations were measured on a high-purity germanium gamma-ray spectrometer. The dose rates and ages were calculated using DRAC, v.1.2 (Durcan et al., 2015). Conversion factors of Guerin et al. (2011) and the measured water content (W) were included. In order to cover possible fluctuations in water content a wide error range of ±0.5*W was assumed. The internal β dose rate contribution of the polymineral samples was calculated by assuming a potassium content of 12.5 ± 0.5% (Huntley and Baril, 1997). Beta attenuation factors of Brennan (2003) and Mejdahl (1979) were used. The cosmic dose rate was calculated following Prescott and Hutton (1994) considering the geographical position, altitude and sample depth. A value of 0.036 ± 0.003 (Kreutzer et al., 2012a) was assumed for α-efficiency of the fine grain quartz samples. The α-efficiency for the polymineral samples was determined by bleaching the aliquots thermally by heating to 480°C and administering α-doses <200 Gy in a Freiberg Instruments Lexsyg Research device; afterwards the laboratory dose of the samples was determined using β-irradiation in a Risœ reader (pIRIR protocol); the α-efficiency is the ratio of the measured β-dose divided by the given α-dose (cf. Kreutzer et al., 2014). A linear function was used for fitting.
After the age calculation, ages bracketing the paleosols and the tephra were combined to one density function per layer, of which an estimate for the ages of the layers themselves including uncertainties was calculated. This was done conservatively by determining 1- and 2- sigma uncertainties of the combined densities.
. Results and Discussion of Luminescence Data
Investigation of Quartz Samples
Preheat Dependency and Dose Recovery Tests
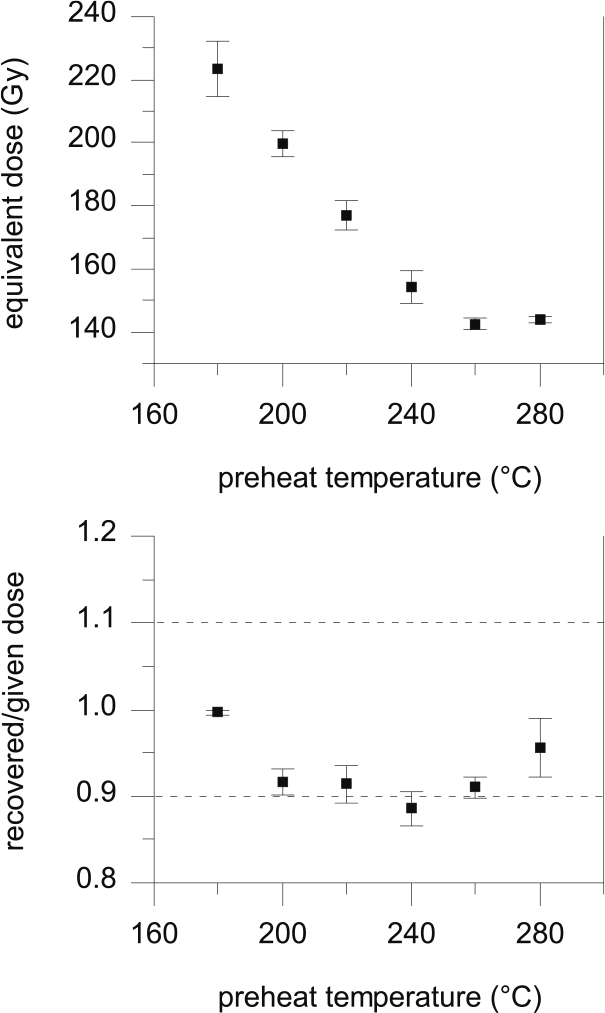
First, we investigated the dependency of the equivalent dose on the preheat temperature and the ability to recover a given dose (Fig. 3). Equivalent doses are decreasing with increasing preheat temperature and no plateau was observed. Several aliquots showed sensitivity changes (recycling ratios between 1.11 and 1.13; see Fig. 4 for more detail), but recuperation was negligible (values below 0.77%). All De-values are smaller than 2×D0 and do not depend on the signal integration interval (see De(t)-plot in Fig. S2). Laboratory doses were recovered within 10% of unity for all preheat temperatures except for a preheat temperature of 240°C (see Fig. 3 bottom). IR depletion ratios of 1.06 ± 0.05 (PHT) and 1.00 ± 0.04 (DRT) indicated that the quartz fraction was not contaminated by feldspar. Examples of DRCs can be viewed in Figs. S3A and S3B.
Figure 3
Top shows a plot of De as a function of preheat temperature for five aliquots per temperature of the quartz fraction of sample C-L3787. The standard error is shown. Bottom shows a dose recovery test of the same sample using different preheat temperatures. Aliquots were bleached and given a dose of ~150 Gy. Area between dashed lines displays the desired ratio. Error bars show standard deviation.
Natural and Regenerated Luminescence Signals
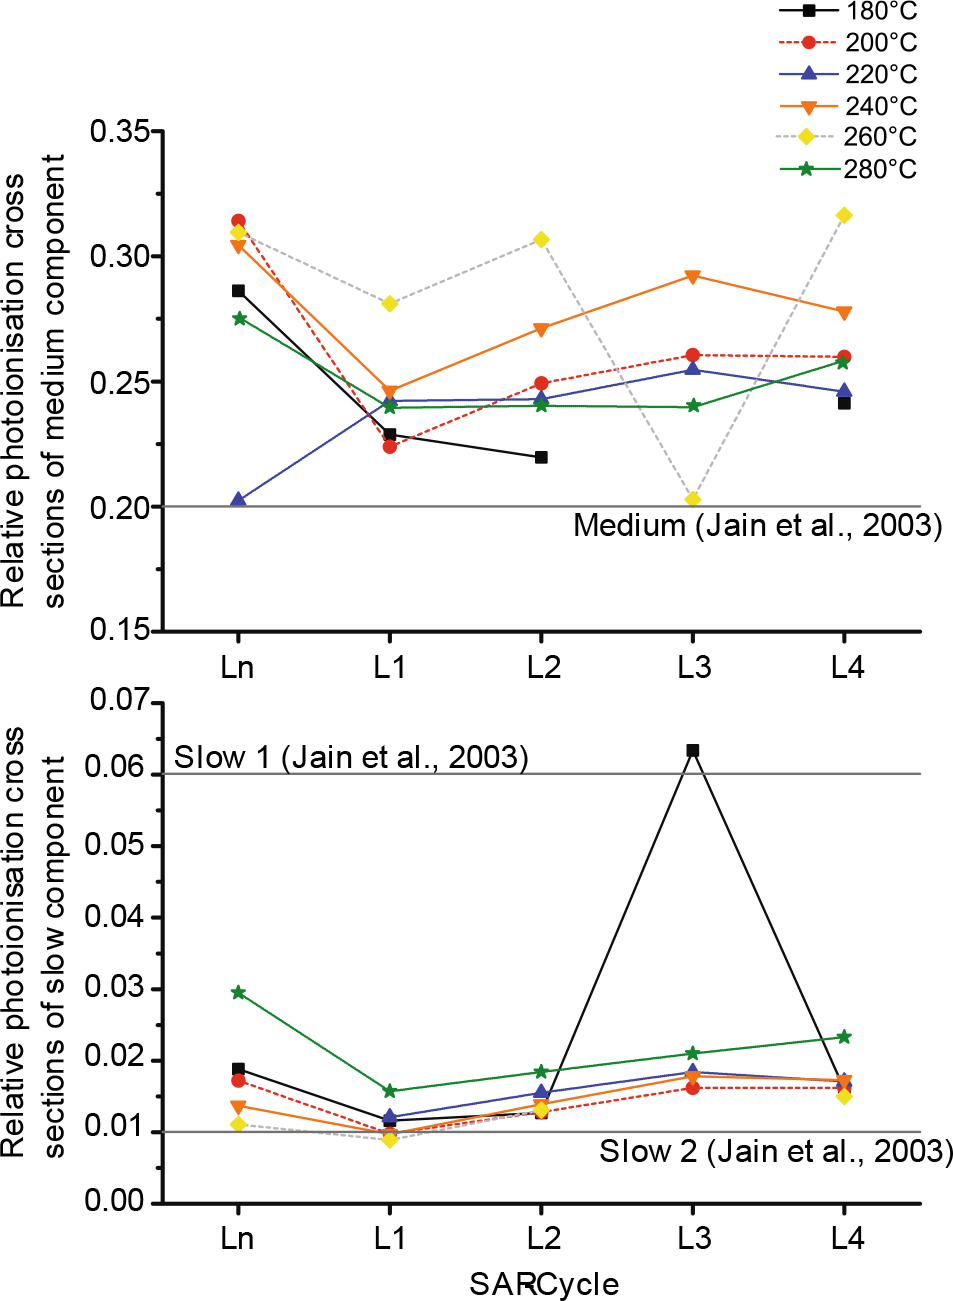
To further investigate the quartz luminescence behavior, the OSL signal components were fitted (e.g. Fig. S4). The signal of quartz is known to consist of several components, each having different thermal and optical properties (Bailey, 1997, 2010; Jain et al., 2003 and Singarayer and Bailey, 2003). Each component is characterized by a specific photoionization cross section, saturation dose and thermal stability (Bailey, 2010). Using the fit_CWCurve-function in the R luminescence package (Kreutzer et al., 2012b) showed that most OSL signals consist of the fast, medium, and slow 2 components (cf. Jain et al., 2003). The fast component contributes with 70-80% to the total signal in the analyzed sample (Analyst version 4.31.7, Duller, 2015). The relative contribution of the signals is shifting throughout the SAR-cycle, and is also not similar between aliquots or preheat temperatures. Fig. 5 shows the ratios of medium and slow components to the fast component: σmedium/σfast and σslow/σfast; and the expected values by Jain et al. (2003). While σmedium/σfast is greater than expected in most signals (independent of preheat temperature or SAR-cycle step), there are also some signals that do not exhibit a medium component at all (e.g. L3 180°C in Fig. 5). Sometimes also a slow 1 component is present (see L3 180°C in Fig. 5). In general, most differences can be seen between the natural and the regenerated signals.
Figure 5
Relative photoionisation cross sections of medium (top) and slow (bottom) components with regard to the fast component at different preheat temperatures during the PHT of C-L3787. Note that only one aliquot per preheat temperature is shown and that aliquots do not behave equally. Horizontal lines show the values observed by Jain et al. (2003).
This difference becomes also evident in the NR(t) plots in Fig. S5 (following the example of Steffen et al., 2009; using the plotNRt-function in the R luminescence package, Burow et al., 2016). To create these plots the natural OSL signal (N) is divided by the regenerated OSL signal (R) and scaled to 1. A N/R ratio below 1, therefore, indicates that the natural signal is decaying faster than the regenerated one. This is the case for all preheat temperatures.
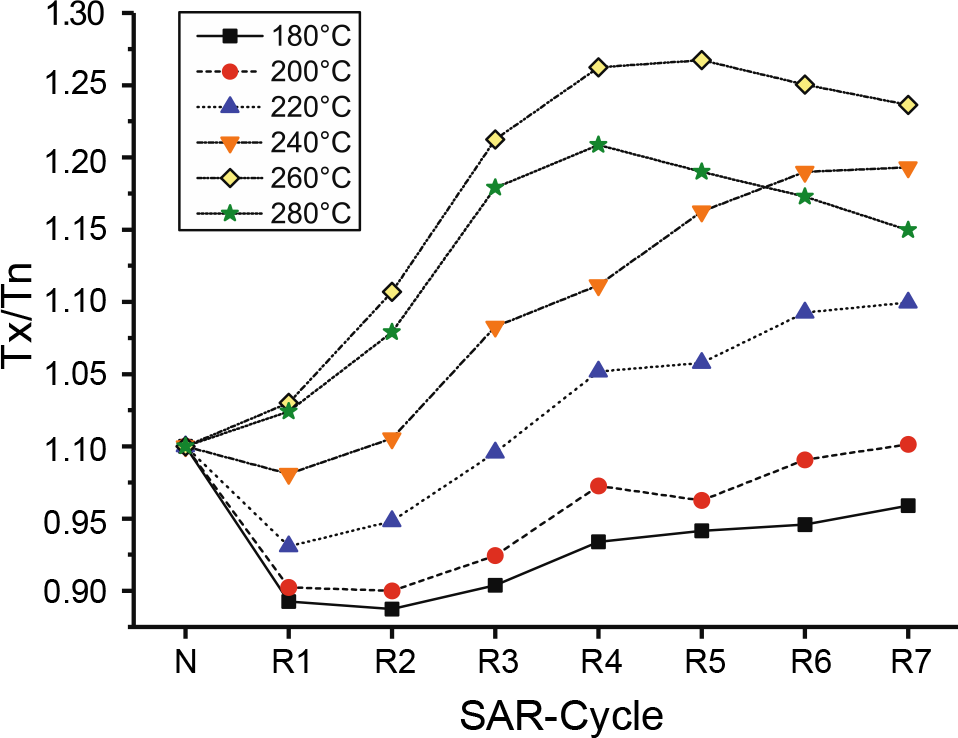
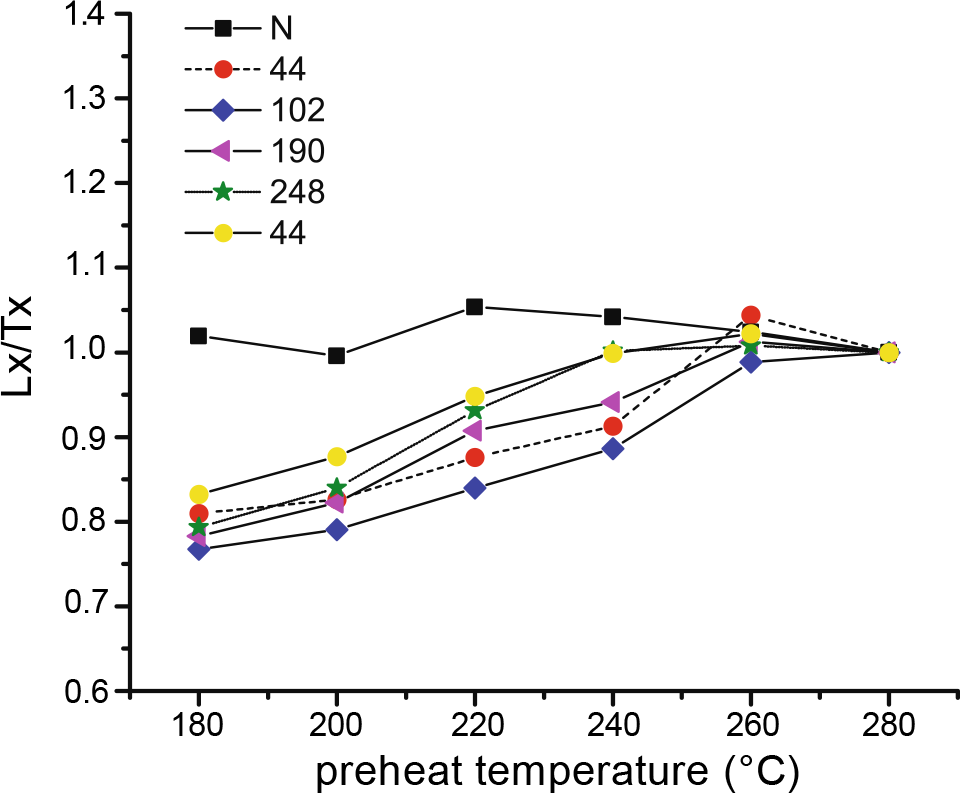
Furthermore, the observed difference between natural and regenerated signals is also visible in Fig. 6, which presents the normalized luminescence signal (Lx/Tx) plotted against the preheat temperature (cf. Roberts, 2006): while the natural signal (Ln/Tn) remains constant, the regenerated signal (Lx/Tx) is increasing with higher preheat temperatures (with regard to the 280°C dose point). A steeper dose response curve results in lower De values, which were evident in the preheat plateau test (Fig. 3).
Evaluation of the Quartz Characteristics
The variation within the contribution of different signal components and the sensitivity changes are not very large (<30%), and the SAR-protocol was able to correct for this at least partially (recycling ratios within 0.9–1.1 for most aliquots). Part of the preheat temperature dependency of the equivalent dose can be explained by the fact that the fast component contributes to the signal with only 70–80 %, but it remains unclear if this is the reason for the quartz behavior. Similar observations with decreasing preheat plateaus were also observed by Roberts (2006) and interpreted as thermal transfer of charge from a trap between cutheat and preheat temperatures into the OSL trap. Moreover, their study showed that falling preheat plateaus are particularly problematic for older loess samples, although the signal is not saturated. We observed the same behavior for the Stalać sample, which has equivalent doses between 140–220 Gy depending on the preheat temperature used. This might also hint towards another process within quartz OSL measurements, which is not yet understood. Especially considering the differences between grains sizes (Timar-Gabor et al., 2015b; Timar-Gabor and Wintle, 2013) and differences between natural and laboratory growth curve shapes (e.g. Chapot et al., 2012; Timar-Gabor et al., 2015a), which both seem to start around 100–150 Gy, this problem becomes evident. Until the underlying processes are better understood, it is advisable to investigate the quartz OSL signal thoroughly, apply preheat plateau tests routinely, and abandon the dating of samples that show a preheat dependency, especially for samples with high paleodoses. Therefore, we do not report quartz OSL ages from this profile at Stalać.
Investigation of Polymineral Samples
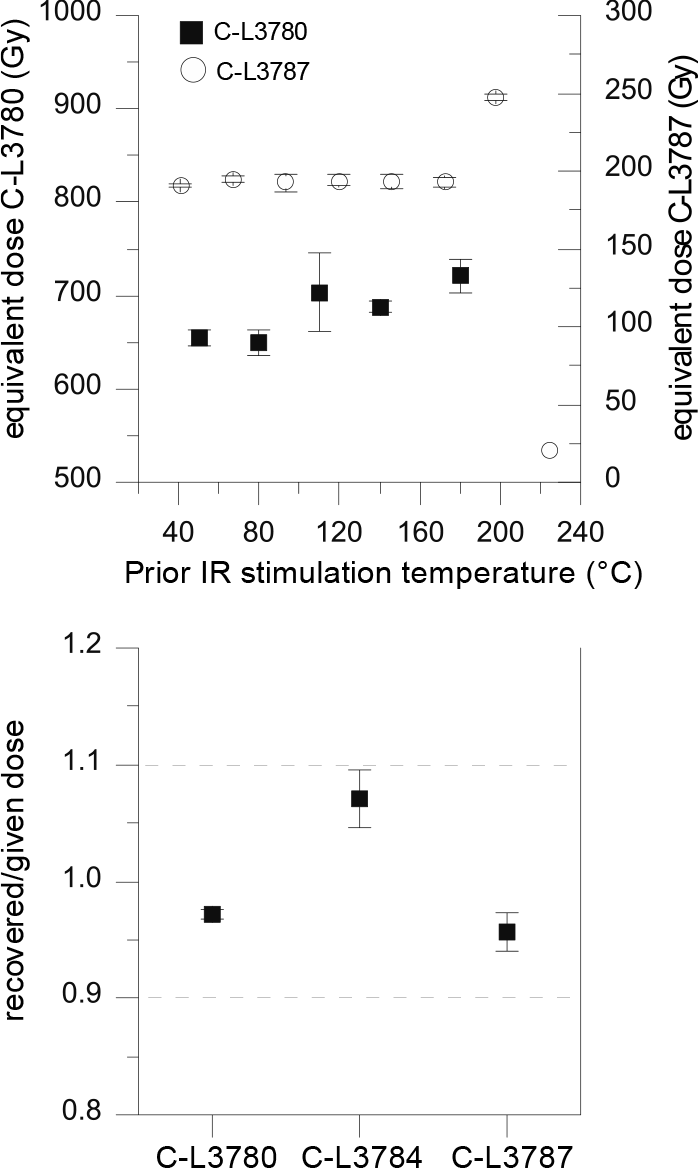
First, the dependency of the temperature of prior IR stimulation on the equivalent dose was investigated: the De is independent from prior IR stimulation temperatures for sample C-L3780 between 50 and 110°C, for sample C-L3784 between 50 and 140°C, and for sample C-L3787 between 50 and 170°C (Fig. 7 top). Accordingly, we continued the measurements with a first IR stimulation temperature of 50°C, which exhibit higher signal intensities. We applied test doses of ~ 30% of the equivalent dose. DRTs gave recovered/given dose ratios of 0.97 ± 0.004 (C-L3780), 1.07 ± 0.02 (C-L3784), and 0.96 ± 0.02 (C-L3787) as depicted in Fig. 7. For these ratios the residual doses were subtracted.
Figure 7
Top shows prior IR stimulation temperature plotted against measured dose. Dose of C-L3787 can be viewed at the right hand axis, while dose of C-L3780 can be viewed at the left hand axis. Standard errors are shown. Bottom shows dose recovery tests of C-L3780, C-L3784 and C-L3787. Recovered to given doses are shown as mean and standard error of at least three aliquots per sample. Given doses were 194 Gy for C-L3787, 617 Gy for C-L3784 and 645 Gy for C-L3780. Residual doses, after bleaching for 24h in a solar simulator, were subtracted.
De measurements were carried out on at least ten aliquots per sample and all aliquots passed the SAR quality checks. No residual doses were subtracted for De calculations, as suggested by Kars et al. (2014). Figs. S3 and S6 show examples of a growth and decay curves, while Fig. S7 depicts abanico plots of the De distributions. Table 1 summarizes the De and age data. Recycling ratios were between 0.96–1.06 and recuperation was smaller than 1.6%. Residual doses were generally low, ranging from 4–7 Gy, i.e. less than 2.5% of the equivalent dose. Also, fading rates were determined for samples C-L3780 and C-L3787. Fading rates (g-values) vary greatly and also negative g-values are observed, which is why no age correction was undertaken. The average g-value of C-L3780 and C-L3787 are g2days = 1.99 ± 0.73% and g2days = −1.56 ± 2.4% (see Fig. S8).
Table 1
Summary of the De, dose rate and age data. Water content is the one obtained in the laboratory. For alpha efficiency a 10% error was applied when standard deviation was smaller than 10%, otherwise standard deviation was used. Dose rates are calculated as described in Section 5 - Dose Rate and Age Calculation. Standard errors are indicated. Ages are expressed with a 1-sigma error range.
In fact, the measurements show optimal performance: all SAR criteria were met, dose recovery ratios were within 10% of unity and prior IR stimulation temperature plateaus were present for all samples tested. Therefore, we used the equivalent doses of the pIR50IR290 measurements of the polymineral samples for the final age assessment.
Dose Rate and Age Calculation
Table 1 shows a summary of the dose rate measurements, equivalent doses and age estimates of the studied section. We used the measured water content to calculate the total (wet) dose rate. Ages are based on the polymineral samples using the pIR50IR290 protocol. The α-efficiency was determined giving values between 0.102 ± 0.013 (C-L3786) and 0.149 ± 0.015 (C-L3784). Ages are all in stratigraphic order, ranging from 28.5 ± 2.3 ka to 139 ± 11 ka. These ages might be considered as falling in Marine Isotope Stages (MIS) 2, 3, 4 and 6. The ages of samples C-L3778 (139 ± 11 ka), C-L3780 (136 ± 10 ka), and C-L3784 (123 ± 8 ka) highlight a presumably high accumulation rate in this time range (although the slope position should not be disregarded).
Probability density functions of the ages of over- and underlying samples were combined to assess the ages of paleosol and tephra layers. This results in an age of 127 and 148 ka at a 1σ confidence level for L2SS1 (116— 159 ka, 2σ); and an age of 118–141 ka at 1σ (109-152 ka, 2σ) for the tephra. Although the samples bracketing the tephra are not in close stratigraphic distance, the difference in age is small. We restrain from this calculation for S1 because of the age differences between samples C-L3784 and C-L3786. Combining the probability density functions for the L1 paleosols gives ages of 41–62 ka 1σ (37–66 ka, 2σ) for L1SS1SSS2 and 27–45 ka 1σ (25–49 ka, 2σ) for L1SS1SSS1.
. Stratigraphical Implications
Generally, LPS have been investigated intensively in Southeastern Europe, but only some were OSL-dated in high-resolution (Constantin et al., 2014; Fitzsimmons and Hambach, 2014; Fuchs et al., 2008; Marković et al, 2014; Murray et al., 2014; Schmidt et al., 2010; Stevens et al., 2011; Zeeden et al., in press); mainly data concerning physical/chemical properties have been reported. Marković et al. (2015) give an extensive overview. Most sections are located in the Carpathian Basin and Lower Danube Basin, in contrast to Stalać being situated south of the common loess distribution, giving it special importance due to its distinct geochemical character (see Section 2).
The previous investigation at the Stalać section has established a correlative age model (Kostić and Protić, 2000). They correlated the cambisol (S2) to the Riss/Würm interglacial (MIS 5), while three weaker kastanozem-like paleosols above were correlated to the last glacial soil developments (S1, L1SS1SSS2, L1SS1SSS1). However, our investigation demonstrates that such a correlation is challenging and in this case very likely incorrect. Based on the luminescence data (Table 1), we show that the two younger kastanozem-like paleosols developed during MIS 3 (C-L3787 and C-L3780) and the oldest kastanozem-like paleosol (S1, see Fig. 2) formed during MIS 5, while the cambisol (S2) probably developed during the penultimate interglacial (C-L3778, C-L3784, C-L3786). This fundamentally changes the conclusion from the Kostić and Protić (2000) study. It furthermore reveals that the environmental conditions during the last two interglacials were remarkably different. Adapting the data by Kostić and Protić (2000) with respect to the new age-model suggests stronger weathering during the formation of the S2 paleosol and an upward trend of decreasing precipitation. A trend of gradual aridization was also discussed by Buggle et al. (2013) for the Lower and Middle Danube Basins. They furthermore suggested a westward expansion of the Eurasian Steppe belt since the Early Pleistocene. Moreover, physical similarities in the S1 pedocomplex and the two paleosols L1SS1SSS2 and L1SS1SSS1 indicate relatively similar environmental conditions during their formation, which is in contrast to the sections in the Carpathian Basin (e.g. Antoine et al., 2009; Buggle et al., 2008; and Marković et al., 2008, 2015), where the soil development during L1SS1 is clearly weaker. This might indicate a generally different environmental and climatic evolution of the Central Balkan and the Carpathian Basin during the last glacial, also suggested by Obreht et al. (2016).
Geochemical analyses of glass shards found in the L1SS1LLL1 layer indicate the existence of cryptotephra layer (Obreht et al., 2016), which is related to the Campanian Ignimbrite / Y-5 tephra. This tephra is 40Ar/39Ar dated to 39.28 ± 0.11 ka (De Vivo et al, 2001), which fits well to the age of 43.0 ± 3.6 ka (C-L3787) below this loess layer.
Another tephra was dated to 109–152 ka (118–141 ka, 1σ) by means of samples C-L3780 and C-L3784. Though samples bracketing the L2 tephra were not closely spaced in the profile, their ages overlap within 1-σ errors. Wacha and Frechen (2011) dated a tephra in Croatian loess to 139 ± 9 ka (above) and 145 ± 12 ka (below), which is consistent with the L2 tephra found at Stalać. Moreover, a tephra in Lake Ohrid with an 40Ar/39Ar-age of 133.5 ± 2 ka (Leicher et al, 2016; Satow et al., 2015) might correlate to this L2 tephra. Unfortunately, the glass shards from this layer were weathered, and consequently this tephra cannot be identified geochemically. However, the consistency between the tephra ages gives further confidence in the pIRIR ages obtained in this study.
Finally, the lowermost sample (C-L3778) places the beginning of the L2 loess accumulation phase at 139 ± 11 ka. However, the top of the S2 soil in Eurasian loess is usually placed at ~190 ka (e.g. Basarin et al., 2014). This suggests that either this pIRIR age might be underestimated, or that the correlative stratigraphy may need adjustment.
Additionally, we dated a pedogenic horizon (L2SS1) at 11.45–11.6 m within the L2 loess to 126–148 ka (1σ, C-L3778 and C-L3780). Also several other Balkan LPS reveal a weakly developed pedogenic layer within the L2 (Marković et al., 2009, 2015), fitting our interpretation of a brief period of soil formation. To our knowledge, this ‘embryonic paleosol’ has not been dated before. However, the possibility of an age underestimation suggested for sample C-L3778, which is based on regional correlative stratigraphy, might also affect this age estimate. This issue needs to be further studied in the future, e.g. by dating a sample below the S2 soil, or by comparison to independent age control or other proxy data.
. Conclusion
In contrast to earlier views, fine quartz grains with high equivalent dose values are not always the ideal material for OSL dating, as was also shown in this study. The importance of a thorough investigation was demonstrated, underlining the necessity of a preheat plateau test and the usefulness of a plot of normalized luminescence signal versus preheat temperature. High-dosed quartz with falling preheat plateaus remains unsuitable for OSL dating until the underlying processes that cause these problems are better understood.
A reliable chronology of the Stalać LPS covering the last two glacial cycles was established by dating the polymineral fine-grain fraction. The good behavior of the polymineral samples made them ideal for measurements with the pIR50IR290 protocol and support the validity of the obtained ages. The wide time range enhances our understanding on the timing of LPS south of the typical loess distribution. Moreover, the previous chronology by Kostić and Protić (2000) was corrected by means of the new ages, highlighting the importance of luminescence dating to contribute to chronological questions in LPS. This revealed a quite different paleoenvironmental evolution of the Carpathian Basin and the Central Balkan region during the last interstadial, which shows stronger pedogenesis at Stalać. Finally, the tephra found in L2 was dated to 118–142 ka (1σ), contributing to the establishment of a reliable loess chronology of the penultimate glaciation in Southeastern Europe.