Article Text

Abstract
Background Our previous study showed that transmembrane tumor necrosis factor alpha (tmTNF-α) is overexpressed in primary breast cancers including triple-negative breast cancers (TNBCs). Chimeric antigen receptor engineered-T (CAR-T) cells have been successfully used mainly in B-cell malignancies.
Methods We generated CAR-T cells targeting tmTNF-α but not secreted tumor necrosis factor alpha and assessed the antitumor effect of the CAR-T cells on tmTNF-α-expressing breast cancer cells in vitro and in vivo.
Results Our tmTNF-α CAR-T cells showed potent cytotoxicity against tmTNF-α-expressing breast cancer cells but not tmTNF-α-negative tumor cells with increased secretion of interferon gamma (IFN-γ) and interleukin (IL)-2 in vitro. In tmTNF-α-overexpressing TNBC-bearing mice, the tmTNF-α CAR-T therapy induced evident tumor regression, prolonged survival and increased serum concentrations of IFN-γ and IL-2. However, we found thattmTNF-α induced programmed death-ligand 1 (PD-L1) expression through the p38 pathway via TNF receptor (TNFR) and through the NF-κB and AKT pathways via outside-to-inside (reverse) signaling, which might limit the efficacy of the CAR-T cell therapy. Blockage of the PD-L1/programmed death-1 (PD-1) pathway by PD-1 monoclonal antibody significantly enhanced the antitumor effect of the tmTNF-α CAR-T cell therapy in vitro and in vivo, and the combination was effective for antiprimary tumors and had a tendency to increase the antimetastasis effect of the CAR-T cell therapy.
Conclusion Our findings suggest a potent antitumor efficacy of the tmTNF-α CAR-T cells that can be enhanced by anti-PD-L1/PD-1 because high PD-L1 expression in TNBC was induced by the tmTNF-α signaling, indicating a promising individual therapy for tmTNF-α-positive breast cancers including TNBC.
- Immunotherapy
- Breast neoplasms
- Chimeric antigen receptor
- Transmembrane tumor necrosis factor-alpha
- Programmed death-1 monoclonal antibody
Data availability statement
Data are available upon reasonable request.
This is an open access article distributed in accordance with the Creative Commons Attribution Non Commercial (CC BY-NC 4.0) license, which permits others to distribute, remix, adapt, build upon this work non-commercially, and license their derivative works on different terms, provided the original work is properly cited, appropriate credit is given, any changes made indicated, and the use is non-commercial. See http://creativecommons.org/licenses/by-nc/4.0/.
Statistics from Altmetric.com
- Immunotherapy
- Breast neoplasms
- Chimeric antigen receptor
- Transmembrane tumor necrosis factor-alpha
- Programmed death-1 monoclonal antibody
Background
Chimeric antigen receptor engineered-T (CAR-T) cell therapy has achieved outstanding results in treating hematological malignancies, such as chronic lymphocytic leukemia and acute lymphoblastic leukemia.1–4 Chimeric antigen receptors (CARs) recognize antigens in the non-major histocompatibility complex (MHC) context and prevent the immune escape of tumor cells due to the reduced MHC-dependent antigen presentation. Although the clinical efficacy of CAR-T therapy in solid tumors has been much less effective, new targets for solid tumors are being tested for CAR-T therapy in preclinical and clinical trials. For breast cancer, there are several clinical trials of CAR-T cells targeting HER-2 in progress,5 6 and ongoing clinical trials of CAR-T therapy targeting other antigens, such as a phase I study targeting cMET (cellular-mesenchymal to epithelial transision factor) in metastatic breast cancer and newly diagnosed operable triple-negative breast cancer (TNBC) (NCT03060356) and a phase I study targeting mesothelin in metastatic HER2-negative breast cancer (NCT02580747). As the antigen recognition unit of CAR is a single-chain variable fragment (scFv) that binds to target antigens expressed on the cell surface, only a few solid tumor antigens are available. Therefore, it is very important to explore new target antigens.
WHAT IS ALREADY KNOWN ON THIS TOPIC
Although there are several clinical trials of chimeric antigen receptor engineered-T (CAR-T) cells targeting HER-2 and other antigens for treatment of breast cancers, the available antigens are limited. Previously, we reported that transmembrane tumor necrosis factor alpha (tmTNF-α) was expressed in breast cancer, including triple-negative breast cancer, and positively correlated with tumor size, metastasis and chemoresistance, indicating a possible treatment target for breast cancer.
WHAT THIS STUDY ADDS
tmTNF-α CAR-T cells exhibited significant antitumor effect both in vitro and in vivo, not only on primary tumor but also on experimental metastatic tumors. However, tmTNF-α induced PD-L1 expression through the p38 pathway via TNFR and through the NF-κB and AKT pathways via outside-to-inside (reverse) signaling, and blockage of the PD-L1/PD-1 pathway enhanced the efficacy of tmTNF-α CAR-T cell therapy.
HOW THIS STUDY MIGHT AFFECT RESEARCH, PRACTICE OR POLICY
This study demonstrated that tmTNF-α is a good target candidate for CAR-T cell therapy, and the combination of tmTNF-α CAR-T therapy with blockade of PD-1/PD-L1 may enhance the immunotherapeutic efficacy.
Transmembrane tumor necrosis factor alpha (tmTNF-α) is a type II membrane protein that can be cleaved by the metalloproteinase tumor necrosis factor alpha-converting enzyme (TACE) to generate secreted tumor necrosis factor alpha (sTNF-α), leaving an N-terminal fragment (NTF) of tumor necrosis factor alpha (TNF-α) on the cell surface.7 In a previous study, we found that tmTNF-α is expressed in breast cancer and, to a lesser extent, in hyperplasia and atypical hyperplasia, but not in paratumor breast tissues.8 Over 60% of patients with ductal breast cancer express high levels of tmTNF-α, which is positively correlated with tumor size and lymph node metastasis. Importantly, tmTNF-α not only confers protumor activity but also leads to doxorubicin (DOX) chemoresistance in breast cancer cells, as the knockdown of tmTNF-α expression significantly inhibits tumor cell proliferation, colony formation, migration, and invasion and increases the sensitivity of breast cancer cells to DOX. Notably, 84% (21/25) of cases with TNBC also express tmTNF-α at high levels.7 TNBC, defined by the absence of expression of the estrogen receptor/progesterone receptor and the amplification of the human epidermal growth factor receptor 2 gene, is associated with a particularly aggressive phenotype, a higher incidence of recurrence and shorter survival following the first metastatic event, accounting for 10%–20% of invasive breast cancers.9 10 Due to the lack of targets, there are no standard treatment options available for TNBC. Therefore, tmTNF-α may be a possible marker and treatment target for breast cancer, especially for TNBC.
Previously, we developed a monoclonal antibody (mAb) against tmTNF-α that is not cross-reactive to sTNF-α. This antibody has been demonstrated to effectively induce tumor regression in tmTNF-α-positive breast cancer by antibody-dependent cellular cytotoxicity and complement-dependent cytotoxicity.8 In this study, we fused scFv from the aforementioned antibody to the cytoplasmic signaling domains of 4-1BB and CD3ζ to generate tmTNF-α CAR and found that tmTNF-α CAR-T cells had potent antitumor activity against tmTNF-α-expressing TNBC tumors.
Methods
Cell culture
The MDA-MB-231-shTNF-α, MCF-7-TNF-α, MCF-7-tmTNF-NTF, and HEK 293T-TNF-α cells were established as described previously.8 11 The MDA-MB-468 cell line was a gift from Procell Life Science & Technology (Wuhan, China). The MDA-MB-231 and MDA-MB-231- shTNF-α cells were cultured in an RPMI-1640 medium (Life Technologies, USA), the MDA-MB-468 cells in an L15 medium (Life Technologies), and the MCF-7, MCF-7-TNF-α, MCF-7-tmTNF-α-NTF, HEK 293T, and HEK 293T-TNF-α cells in Dulbecco’s Modified Eagle Medium (Life Technologies) at 37°C in a humidified atmosphere of 5% CO2. All media were supplemented with 10% heat-inactivated (56°C, 30 min), pyrogen-free fetal calf serum (FCS, Sijiqing, Hangzhou, China), 1.0 mmol/L sodium pyruvate, 2.0 mmol/L L-glutamine, 100 U/mL penicillin, and 100 mg/mL streptomycin.
Construction of a tmTNF-α CAR-containing lentiviral vector and lentivirus production
The sequence of tmTNF-α CAR was synthesized by TSINGKE Biological Technology (Beijing, China). It comprised a human GM-CSF signal peptide, scFv of anti-tmTNF-α antibody, human CD8α hinge and transmembrane domains, and 4-1BB and CD3ζ cytoplasmic domains. The tmTNF-α CAR gene was cloned into the pHAGE-CMV-MCS-PGK puro vector at the BamH I and Xho I sites following PCR amplification. The construct was verified by DNA sequencing (TSINGKE Biological Technology). To produce lentiviral particles, the HEK 293 T cells were transfected with the tmTNF-α CAR lentiviral expression vector, a packaging vector psPAX2, and an envelope vector pMD2G11 using polyethylenimine (PEI) Max, linear, MW 40 000 (PolyScience, Illinois, USA) according to the manufacturer’s instructions. The viral supernatants were collected 72 hours after transfection, filtered through a 0.45 µm filter (Millipore, Darmstadt, Germany), and concentrated by ultracentrifugation (Beckman Coulter, Miami, Florida, USA) through a 20% sucrose cushion at 25 000 rpm 4°C for 2 hours. Viral titers were determined in the HEK 293 T cells after infection with serial dilutions of virus by flow cytometry using an APC-conjugated anti-F(ab’)2 fragment of murine IgG (Jackson ImmunoResearch, West Grove, Pennsylvania, USA).
Generation of the tmTNF-α CAR-T cells
Discarded umbilical cord blood (UCB) was obtained from the Department of Obstetrics and Gynecology Center, Tongji Hospital, Tongji Medical College, Huazhong University of Science and Technology in Wuhan. After lysis of the red blood cells in a 1× RBC lysis solution (Boster Biological Technology, Wuhan, China) on ice for 10 min, the mononuclear cells were isolated from the hUCB using Ficoll-Hypaque (TBD, Tianjin, China) gradient centrifugation, and the T cells were then separated with CD3 MicroBeads (Miltenyi Biotec GmbH, Bergisch Gladbach, Germany).
The T cells were transferred into a 12-well plate that had been precoated with OKT3 (1 mg/mL) (Ortho Biotech, Bridgewater, New Jersey, USA) and anti-CD28 (1 mg/mL) (Becton Dickinson & Co., Mountain View, California, USA) and cultured in OpTmizer CTS (Gibco; Invitrogen, Paisley, UK) supplemented with 50 IU/mL recombinant human IL-2 (rhIL-2; PeproTech, Rocky Hill, New Jersey, USA). On day 3 post OKT3/anti-CD28 activation, 1×10⁶ activated T cells were mixed with lentivirus (MOI=25) and 6 µg/mL polybrene (Sigma-Aldrich, St. Louis, Missouri, USA) and centrifuged at 2000×g for 2 hours.12 Virus-transduced UCB T cells and non-transduced T (NT) cells were expanded using OKT3/anti-CD28 in a T-cell medium supplemented with IL-2 for 14 days.
ELISA
To detect the specificity of scFv from the tmTNF-α mAb (VH and VL linked with a (G4S)3 linker), we cloned the scFv into the pFUSE-hIgG1-Fc2 vector (InvivoGen, San Diego, California, USA) at EcoR I and Nco I. The primers were synthesized by TSINGKE Biological Technology. The construct was verified by DNA sequencing (TSINGKE Biological Technology). The plasmid was transfected into 293 T cells using PEI Max. The culture supernatant was collected after transfection for 48 hours, and the scFv-CH2/CH3 was purified with HiTrap Protein G (Amersham Pharmacia, GE, USA). The protein concentration was determined with a bicinchoninic acid assay kit (Boster Biological Technology).
A fragment from the signal peptide of tmTNF-α that contained an epitope recognized by the tmTNF-α mAb8 was conjugated to bovine serum albumin (BSA) (Qiangyao Biological Technology, Shanghai, China). ELISA plates were coated with the peptide–BSA complex at a concentration of 1 µg/mL. After overnight coating, the plates were blocked with phosphate-buffered saline (PBS) solution containing 1% BSA, followed by the addition of 0.5 µg of tmTNF-α mAb or scFv-CH2/CH3 for a 2-hour incubation at 37°C. For the inhibitory competitive assay, the coated plate was preincubated for 2 hours with 0.5 µg of tmTNF-α mAb and washed, followed by incubation for 2 hours with 0.5 µg of scFv-CH2/CH3, and vice versa. After washing, antimurine or antihuman IgG conjugated with horseradish peroxidase (HRP) (Boster Biological Technology) was added to each well. After a 1-hour incubation, the plates were washed, and the substrate 3,3′,5,5′-tetramethylbenzidine (Boster Biological Technology) was added. Absorbance at a wavelength of 450 nm was read in a microplate reader (BioTek, Wuxi, China).
TNF-α, IL-2 and interferon gamma (IFN-γ) released in the culture supernatants and serum were measured using commercial ELISA kits according to the manufacturer’s instructions (eBioscience, San Diego, California, USA).
Flow cytometry
The blood of the retro-orbital plexus was taken from the mice using capillaries at different time points. White blood cells from the peripheral blood and single-cell suspensions from the spleen were prepared as previously described.13 The expression of tmTNF-α and tmTNF-α CAR on the cell surface, the binding of scFv-CH2/3 and tmTNF-α mAb to tmTNF-α, and the T cell subsets were analyzed by flow cytometry. Cells were incubated for 1 hour on ice with tmTNF-α mAb, scFv-CH2/3, anti-F(ab′)2 of IgG-APC (Jackson ImmunoResearch); anti-CD3-percp-cy5.5, anti-CD4-FITC, anti-CD8-PE, anti-CD45RO-Pe-cy7, anti-CD62L-FITC, anti-CCR7-PE, and anti-PD1) (online supplemental table 1). For the binding analysis, after washing with PBS, the cell staining was carried out with another 1-hour incubation with FITC-labeled antimurine or antihuman IgG (FeiYi, Wuhan, China). The stained cells were analyzed on a FACS Calibur 440E (Becton Dickinson & Co.) using Cell Quest software (BD Biosciences–Immunocytometry Systems).
Supplemental material
For the inhibitory competitive assay of both antibodies, the cells were preincubated at 4°C for 30 min with tmTNF-α mAb and washed several times, followed by incubation with scFv-CH2/3 for another 30 min, and vice versa.
Tumoricidal assays
The tumor-killing efficiency of the tmTNF-α CAR-T cells was determined by the calcein release assay. The tmTNF-α-positive or tmTNF-α-negative breast cancer cell lines were labeled with 25 µM calcein for 30 min (YeaSen, Shanghai, China), washed with Hanks balanced salt solution (HBSS), and cocultured for 8 hours with the tmTNF-α CAR-T cells or the NTs at different effector:target (E:T) ratios in 5% FBS-HBSS. The spontaneous and maximal release of calcein was measured in the culture of only target cells in medium or lysis buffer (50 mM sodium borate, 0.1% Triton X-100, pH 9.0), respectively. All assays were seeded in triplicate. The supernatants of the cocultures were transferred to new 96-well plates after centrifugation, and the released calcein was measured with a microplate reader (BioTek) at an excitation wavelength of 485 nm and an emission wavelength of 530 nm. The tumor-killing efficiency was calculated according to the following formula: lysis%=(Fexperimental release−Fspontaneous release)/(Fmaximal release−Fspontaneous release)×100%.
For safety evaluation of the CAR-T cells, monocytes from UCB were purified by their adherence to 24-well plates in a 10% FCS RPMI-1640 medium for 1 hour, and the T cell-deleted non-adherent mononuclear cells were collected after T-cell isolation with CD3 MicroBeads (Miltenyi Biotec GmbH) for the CAR-T cell preparation. The monocytes and CD3-negative non-adherent mononuclear cells, as target cells, were labeled with calcein and cocultured for 8 hours with tmTNF-α CAR-T cells or NT cells at different E:T ratios.
The cytotoxicity of tmTNF-α CAR-T cell affected by PD-1 mAb in vitro was detected using the LDH Assay Kit (Beyotime Biotechnology, Shanghai, China). The CAR-T or NT cells were cocultured with the MDA-MD-231 cells in serum-free ex vivo cell culture medium (Lonza, USA) at different E:T ratios in the presence of PD-1 mAb (20 µg/mL) for 12, 24 and 48 hours. The lysis buffer was added to the maximum-release group of target cells at 45 min before the end of the experiment. After centrifugation at 400×g for 5 min, the activity of released LDH in the supernatants was detected at 490 nm following an incubation for 30 min with the substrate.
Xenotransplantation of MDA-MB-231 cells into the NOD/SCID mice
Six-week-old female NOD/SCID mice were purchased from Beijing HFK Bioscience Company (Beijing, China). The mice were bred in a specific pathogen-free barrier facility. The MDA-MB-231 (2×10⁶) cells were subcutaneously injected into the mammary fat pads of mice. When the tumor size reached ≥50 mm3, 5×10⁶ tmTNF-α CAR-transduced or NT cells were intravenously transfused on days 7 and 14 after tumor cell inoculation.
For combination therapy, PD-1 mAb (Innovent, Suzhou, China) was intraperitoneally injected (200 µg per mouse) 2 hours prior to the first transfusion of the tmTNF-α CAR-T cells. Treatment with PD1 mAb was repeated every 3 days and lasted 6 weeks. The tumor size was measured every 3 days using a microcaliper in a blinded manner and calculated as follows: length×width2×π/6. Body weight was monitored every 3 days and tumor weight was measured at the experimental endpoints.
For the experimental tumor metastasis mouse model, MDA-MB-231 cells were transduced with lentivirus (MOI=10; DesignGene, Shanghai, China) encoding firefly luciferase and 2 µg/mL polybrene for 48 hours and selected with 2 µg/mL puromycin for 2 weeks. A total of 5×10⁵ luciferase-labeled MDA-MB-231 cells were injected into the tail vein of each NOD-SCID mouse (day 0). The NT or CAR-T cells (5×10⁶) were intravenously transfused on days 1 and 8 after tumor cell inoculation. The PD-1 mAb was intraperitoneally injected (200 µg per mouse) every 3 days, starting at 2 hours prior to the first transfusion of the tmTNF-α CAR-T cells. After intraperitoneal injection of d-luciferin (Abcam; 150 mg/kg) on day 22, each mouse was imaged for 20–30 s with the Lago/Lago X Next Generation Preclinical Optical Imaging Systems (Spectral Instruments IMaging, USA). Bioluminescence signals were quantified in units of maximum photons per second per square centimeter per steradian (photons/s/cm2/sr).
Immunohistochemistry, indirect immunofluorescence and histology
All the NOD/SCID mice were sacrificed at the experimental endpoints, and heart, liver, lung, kidney, and brain tissues were fixed in 10% buffered formalin and embedded in paraffin. Four-micrometer sections were dewaxed with xylene and rehydrated in graded ethanol. Antigen retrieval was performed using Antigen Unmasking Solution (Boster Biological Technology). The tmTNF-α expression in different organs was detected by the avidin–biotin complex method. The sections were incubated for 2 hours with a tmTNF-α antibody (homemade) at room temperature, followed by another 1-hour incubation with a biotin-labeled antimurine IgG antibody (Boyao Biotechnology, Shanghai, China), and then incubation with peroxidase-labeled streptavidin for 20 min. Immunostaining was visualized using an ImmPACT DAB peroxidase substrate (Boster Biological Technology).
The infiltration of T cells and the expression of CD3, PD-L1 and tmTNF-α in tumor tissue sections were detected by indirect immunofluorescence as described previously.14 Briefly, tumor sections were incubated with an anti-hCD3 antibody (Abclonal, Wuhan, China), anti-PD-L1 (Invitrogen, USA), and anti-tmTNF-α (homemade) at 37°C for 2 hours, followed by incubation with a Cy3-conjugated antirabbit IgG antibody (Servicebio, Wuhan, China), a Dylight 488-conjugated antirabbit IgG antibody, and a FITC-conjugated antimurine IgG antibody (Servicebio, Wuhan, China). The sections were counterstained with 4′,6-diamidino-2-phenylindole (Sigma-Aldrich). Images were viewed and captured by a laser scanning confocal microscope (Nikon D-Eclipse CI, Tokyo, Japan).The positive cells were analyzed at ×200 magnification in five random fields with the Image-Pro Plus V.6.0 software (Media Cybernetics, Bethesda, Maryland, USA).
Lung samples from the mice with tumor metastasis were deparaffinized and stained with H&E.
Cell viability and apoptosis
Cell viability was determined by a Cell Counting Kit-8 (Vazyme Nanjing, China), and cell apoptosis was detected by an FITC Annexin V Apoptosis Detection Kit (Vazyme Nanjing) according to the manufacturer’s instructions.
Western immunoblotting
Total protein was extracted from the cultured cells in an ice-cold lysis buffer (Beyotime Biotechnology) containing a protease inhibitor cocktail (Calbiochem, San Diego, California, USA) on ice for 15 min. Twenty micrograms of protein was subjected to electrophoresis on 12.5% sodium dodecyl sulfate-polyacrylamide gels and transferred to a polyvinylidene fluoride (PVDF) membrane (Bio-Rad, Hercules, California, USA). The membrane was then probed with antibodies specific to PD-L1, p-p65/p65, IκBα, pAKT/AKT, pp38/p38, or β-actin (online supplemental table 1), followed by HRP-conjugated secondary antibodies (online supplemental table 1). The protein bands were visualized using an ECL Plus Western Blotting Reagent (Yeasen), quantified by a calibrated imaging densitometer (GS-710, Bio-Rad), and analyzed by Quantity One software (Bio-Rad).
Exogenous tmTNF-α and sTNF-α stimulation and gene transfer
The HEK 293 T cells overexpressing tmTNF-α on the cell surface11 were fixed in 1% paraformaldehyde and used as the source of exogenous tmTNF-α as previously described.15 To remove receptor-bound sTNF-α, cells were treated with an acid glycine buffer (Gly-NaCl, pH 3.0) for 15 min after fixation. sTNF-α (100 ng/mL, PeproTech) or tmTNF-α on the 293 T cells was added to MDA-MB-468 cells at a ratio of 10:1 and incubated for 30 min or 24 hours. For neutralization, the fixed tmTNF-α overexpressing 293 T cells were treated with a TNF-α antibody (R&D Systems, Minneapolis, Minnesota, USA) for 30 min prior to the addition to the tumor cells.
To explore tmTNF-α-mediated reverse signaling, the MDA-MB-468 cells were transfected with plasmids containing genes encoding human TNF-α or tmTNF-α-NTF8 by PEI max for 48 hours.
Statistical analysis
Student’s t-test and one-way or two-way analysis of variance followed by Tukey’s post hoc test were used for comparing data of two or multiple groups with GraphPad Prism V.6.0 software (GraphPad Software, San Diego, California, USA). P values less than 0.05 were considered statistically significant.
Results
Generation and characterization of tmTNF-α CAR-T cells
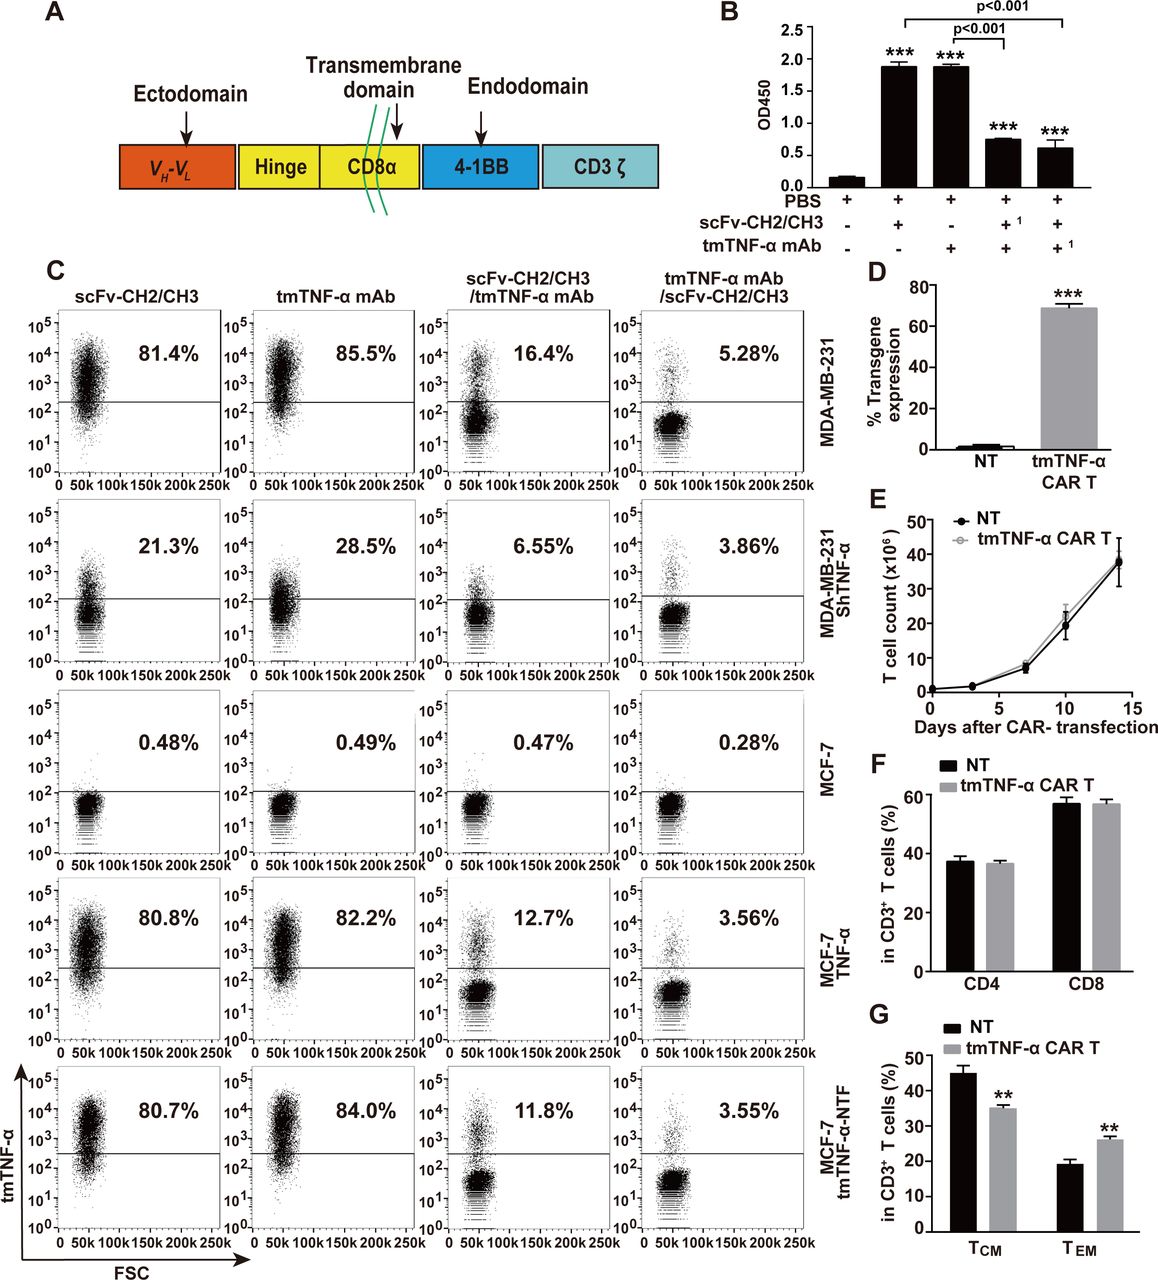
To target the tmTNF-α positive breast cancer, we used our developed specific mAb that recognizes the NTF of tmTNF-α8 to engineer a second-generation of tmTNF-α CAR. This CAR consisted of a human tmTNF-α-specific scFv plus 4-1BB/CD3ζ signaling moieties (figure 1A). To identify the specificity of the scFv from the tmTNF-α mAb, we cloned scFv into a pFUSE-hIgG1-Fc2 vector that was transfected into 293 T cells. The scFv-CH2/CH3 was purified from the supernatant, and its specificity was detected by ELISA and flow cytometry. We found that scFv-CH2/CH3 could also bind to a coated tmTNF-α peptide (figure 1B) and to tmTNF-α on the surface of the TNBC cell line MDA-MB-231 that expressed the transmembrane molecule at high levels, and ectopically expressed full-length tmTNF-α or its NTF mutant on the MCF-7 cells (figure 1C), similar to its parental mAb. However, both antibodies detected significantly reduced tmTNF-α expression that had been knocked down by shRNA in the MDA-MB-231 cells and did not detect tmTNF-α expression in the TNF-α-negative MCF-7 cells. Furthermore, both scFv-CH2/CH3 and its parental antibody could competitively inhibit the binding of the tmTNF-α-peptide or tmTNF-α on the cell surface to each other (figure 1B,C), although the tmTNF-α mAb showed a stronger competitive ability. We transduced the tmTNF-α CAR gene into T cells from four donors, and the expression of tmTNF-α CAR on the T cell surface ranged from 65.6% to 70.8% (figure 1D and online supplemental figure S1A). The tmTNF-α CAR-transduced T cells and NT cells had similar proliferative capacity in response to the anti CD3/CD28 antibodies, and the similar percentages of CD4+ and CD8+ cells (figure 1E,F, and online supplemental figure S1B). Interestingly, more than 98% of the CD3+ cells were CD45RO+ for both the NT and CAR-T cells in the presence of OKT3/anti-CD28 and IL-2 at 2 weeks after CAR transduction. In the CD3+CD45RO+ cells, the percentages of CD45RO+CD62L+CCR7+ central memory T cells (TCM) were greater than those of the CD45RO+CD62L−CCR7− effector memory T cells (TEM) for both tmTNF-α CAR-T and NT cells; however, the percentage of TEM cells was higher, but the percentage of TCM was lower in the CAR-T cells than those in the NT cells (figure 1G and online supplemental figure S1C).
Supplemental material

Construction of tmTNF-α CAR gene and characterization of tmTNF-α CAR-T cells. (A) Schematic illustration of tmTNF-α CAR gene construct. Comparison of binding capacity between scFv-CH2/CH3 antibody and mAb to tmTNF-α peptide by ELISA (B,1 as preincubated antibody) and to tmTNF-α or tmTNF-α-NTF on the cell surface by flow cytometry (C). (D,F,G) CD3+ T cells isolated from UCB were transduced with tmTNF-α CAR gene-containing lentivirus and further cultured for 14 days in the presence of anti-CD3/anti-CD28 and IL-2. NT cells served as a control. F(ab’)2 antibody was used to detect the transduction efficiency of tmTNF-α CAR by flow cytometry (D). Analysis of CD4+ and CD8+ T-cell subsets (F), and the expression of CD45RO, CD62L and CCR7 in CD3-positive T cells by flow cytometry (G). (E) Expansion of tmTNF-α CAR-T cells. tmTNF-α CAR-T cells and NT cells were cultured in medium supplemented with IL-2 (50 IU/mL) in plates coated with anti-CD3/anti-CD28. The number of T cells was counted at indicated time points. All quantitative data represent means±SEM of three independent experiments. **P<0.01, ***P<0.001 versus PBS for B versus NT for D–G. CAR-T, chimeric antigen receptor engineered-T; FSC, forward scatter; IL, interleukin; mAb, monoclonal antibody; NT, non-transduced T; PBS, phosphate-buffered saline; scFv, single-chain variable fragment; tmTNF-α, transmembrane tumor necrosis factor alpha.
Cytotoxicity of tmTNF-α CAR-T cells toward breast cancer cells in vitro
To test the cytotoxicity of the tmTNF-α CAR-T cells in vitro, we cocultured the CAR-T cells with breast cancer cells at different E:T ratios for 8 hours. The tmTNF-α CAR-T cells showed marked cytotoxicity against the MDA-MB-231 cells expressing high levels of tmTNF-α (figure 2A) and against the TNF-α- or tmTNF-α-NTF-transfected MCF-7 cells (figure 2C,D) in an E:T ratio-dependent manner. The highest cytotoxicity of the tmTNF-α CAR-T cells reached approximately 80% at an E:T ratio of 10:1, and tmTNF-α expression in the target MDA-MB-231 cells was approximately 80% (figure 2A); conversely, shTNF-α reduced tmTNF-α expression to 28% in the MDA-MB-231 cells, and the cytotoxicity of tmTNF-α CAR-T cells was approximately 30% (figure 2B), indicating the potent efficacy of the tmTNF-α CAR-T cells. In addition, the tmTNF-α CAR-T cells did not have a specific cytotoxic effect on the tmTNF-α-negative MCF-7 cells (figure 2E) but had a reduced effect on the shTNF-α-transfected MDA-MB-231 cells (figure 2B), suggesting the targeting specificity of the tmTNF-α CAR-T cells. We collected supernatants from a 24-hour coculture of the tmTNF-α CAR-T cells with the breast cancer cells at an E:T ratio of 5:1 for the detection of cytokines. In line with the cytotoxic activity of the CAR-T cells, the secretion of IL-2 and IFN-γ was significantly increased in the supernatants from the coculture of the tmTNF-α CAR-T cells with the tmTNF-α- or NTF-positive breast cancer cells, and slightly enhanced from the coculture with the shTNF-α-transfected MDA-MB-231 cells, but remained unchanged from the coculture with the tmTNF-α-negative breast cancer cells compared with that from the coculture of NT cells with the above breast cancer cells (figure 2F–I).
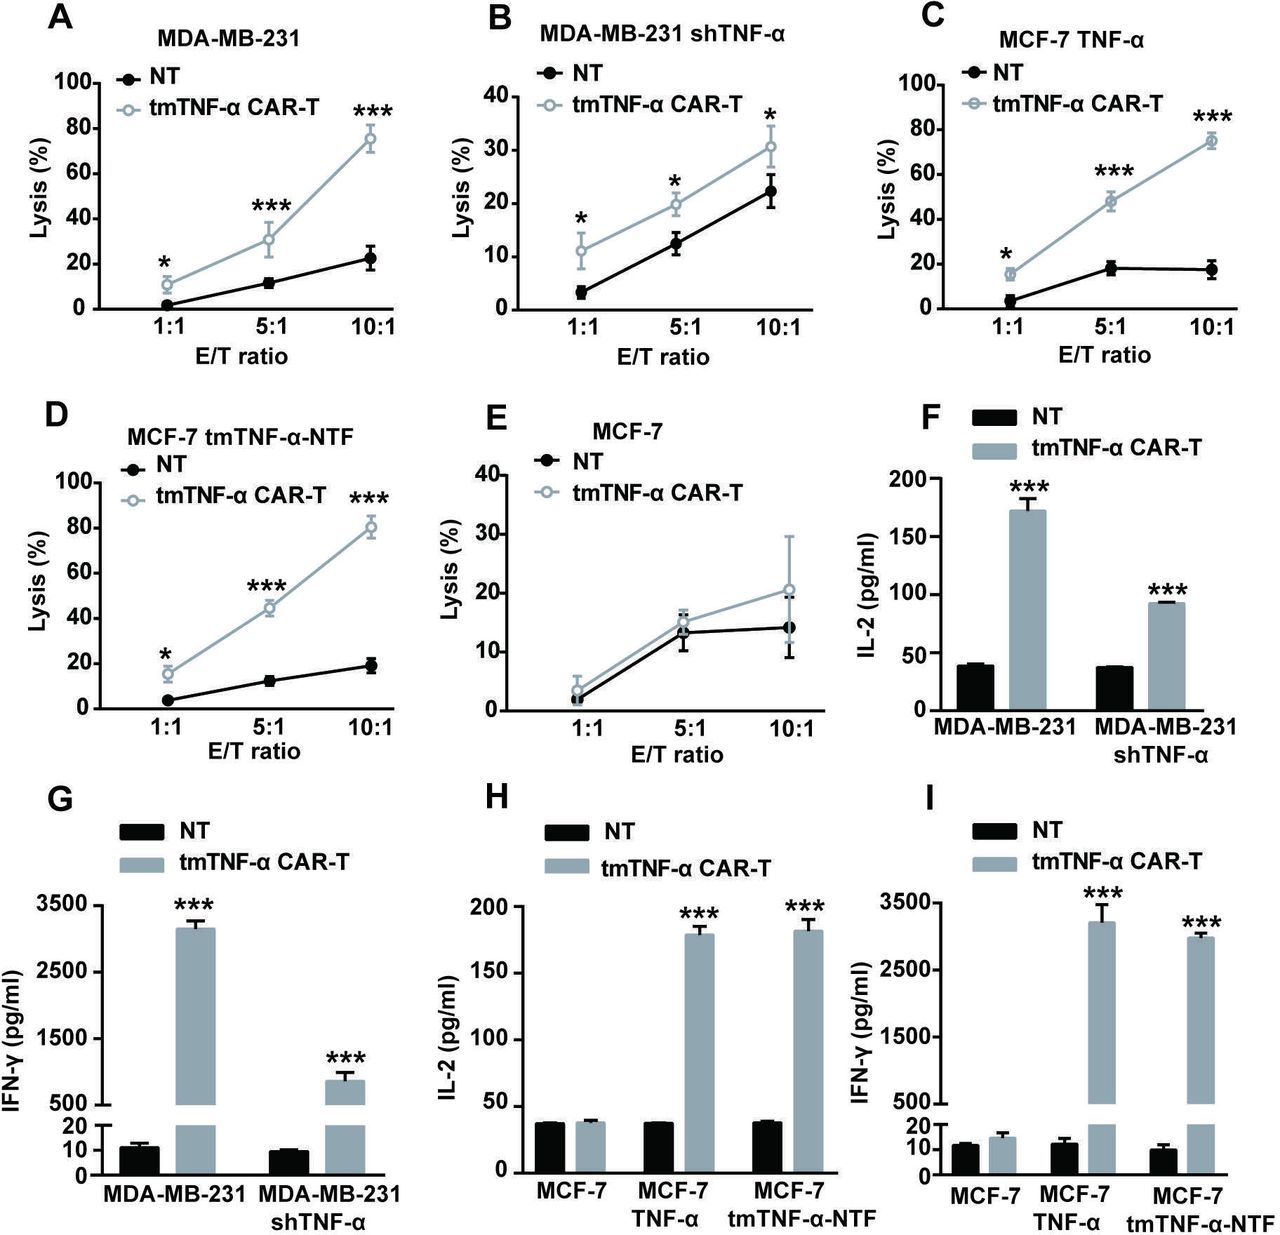
tmTNF-α CAR-T cells specifically kill tmTNF-α-expressing breast cancer cells. The CAR-T cells and NT cells were cocultured with parental or tmTNF-α-knockdown MDA-MB-231 cells, TNF-α-transfected or TNF-NTF-transfected and parental MCF-7 cells at different E:T ratios for 8 hours (for the lysis assay) or at an E:T ratio of 5:1 for 24 hours (for the cytokine release). The cytotoxicity of CAR-T cells was detected by the Cam-release assay (A–E), and the concentrations of IL-2 and IFN-γ in the culture supernatants were measured by ELISA (F–I). NT cells served as a control. All data represent means±SEM of three independent experiments. *P<0.05, ***P<0.001 versus NT. CAR-T, chimeric antigen receptor engineered-T; E:T, effector:target; IFN-γ, interferon gamma; IL, interleukin; MDA-MB-231, MD Anderson-Metastatic Breast-231; NT, non-transduced T; NTF, N-terminal fragment; tmTNF-α, transmembrane tumor necrosis factor alpha.
Antitumor activity of tmTNF-α CAR-T cells in a TNBC tumor-bearing mouse model
To investigate the antitumor effect of the tmTNF-α CAR-T cells in vivo, MDA-MB-231 cells (2×10⁶ cells/mouse) were subcutaneously inoculated into immunocompromised NOD/SCID mice to establish a xenograft tumor model. The average tumor volumes were approximately 50 mm3 on day 7 post tumor cell inoculation, when the NOD/SCID mice were intravenously administered tmTNF-α CAR-T cells or NT cells at a dose of 5×10⁶ cells or saline and the infusion was repeated on Day 14. The tumor size was significantly reduced 2 weeks after the CAR-T therapy and kept at the minimum for nearly 1 month, and then the tumors gradually grew back (figure 3A). Tumor weight was also significantly decreased on Day 21 by treatment with the CAR-T cells (figure 3B). Notably, the CAR-T-therapy significantly increased and prolonged the survival of the tumor-bearing mice (figure 3C). These findings indicated a potent antitumor effect of the tmTNF-α CAR-T cells. Moreover, the tmTNF-α CAR-T cells induced splenomegaly (figure 3D). The number of CD3+ T cells in the blood and tumors of the mice treated with CAR-T therapy was significantly higher than that of the NT group and peaked on day 21. Although the number of tmTNF-α CAR-T cells in the blood and tumors was gradually reduced on day 42, they were still present on day 80 in the tumors (figure 3E,F, and online supplemental figure S2). This indicated that the tmTNF-α CAR-T cells were activated and proliferated by tmTNF-α-expressing tumors in vivo. Of note, the tumors expressed tmTNF-α at higher levels throughout the period, although tmTNF-α expression by the tumors was significantly suppressed on day 21 after the CAR-T therapy (figure 3G). In addition, serum levels of IL-2 and IFN-γ were significantly higher in the mice treated with tmTNF-α CAR-T cells than in the mice treated with NT cells (figure 3H,I). These findings strongly indicated a potent antitumor effect of the tmTNF-α CAR-T cells in the xenograft mouse model.
Supplemental material

tmTNF-α CAR-T cells suppress the tumor growth in NOD/SCID mice. NOD/SCID mice were inoculated subcutaneously with 2×10⁶ MDA-MB-231 cells on the right mamma pat (day 0) and intravenously administered with 5×10⁶ tmTNF-α CAR-T cells or NT cells on days 7 and 14 (n=6 each group). (A) Tumor growth curve and (B) tumor weight on day 21. (C) Kaplan-Meier survival curves of mice (n=6). (D) Spleen weight/body weight. (E) Human CD3+ T cells in the peripheral blood were analyzed at indicated time points by flow cytometry. Representative images of CD3+ T cells (F) and tmTNF-α expression (G) in tumor tissues (magnification ×200) determined at indicated time points by indirect immunofluorescence and their quantitative data. The data of NT treatment group on day 80 were missing due to the death of mice. (H,I) Serum levels of IL-2 and IFN-γ were measured by ELISA on day 21. All quantitative data represent means±SEM. *P<0.05, **P<0.01, ***P<0.001 versus NT. CAR-T, chimeric antigen receptor engineered-T; DAPI, 4′,6-diamidino-2-phenylindole; E:T, effector:target; IFN-γ, interferon gamma; IL, interleukin; NT, non-transduced T; tmTNF-α, transmembrane tumor necrosis factor alpha.
Safety evaluation of the tmTNF-α CAR-T cells
To evaluate the safety of the tmTNF-α CAR-T therapy, we checked tmTNF-α expression on hemocytes and observed the cytotoxicity of CAR-T cells to them. Our results showed that the monocytes and CD3-negative non-adherent mononuclear cells (CD3− NM, including neutrophils, B cells and NK cells) from UCB expressed a small amount of tmTNF-α; however, tmTNF-α expression was increased when the monocytes were stimulated for 24 hours with 12 hours of culture supernatants of the MDA-MB-231 cells (figure 4A). The cytotoxicity of the tmTNF-α CAR-T cells against the unstimulated monocytes and CD3-NM was less than 10%~20% at E:T ratios of 5:1 and 10:1, respectively, similar to that of the NT cells. However, the toxic effect of the tmTNF-α CAR-T cells was increased on conditioned medium-activated monocytes at higher E:T ratios, although the lysis rates were less than 15% (figure 4B–D). To exclude the possibility that the tmTNF-α expressing activated T cells could be attacked by the tmTNF-α CAR-T cells, we detected the tmTNF-α expression on unactivated T, activated T and CAR-T cells. We found that unactivated T cells expressed a trace amount of tmTNF-α, and NT and CAR-T cells activated by OKT3/anti-CD28 and IL-2 expressed a small amount of tmTNF-α and secreted a certain amount of sTNF-α (figure 4E and online supplemental figure S3A). Interestingly, the tmTNF-α CAR-T cells had no specific lysis of the NT cells (figure 4F). The viability of the CAR-T cells was similar to that of the NT cells at different culture time points (figure 4G), similar to the proliferation curves of both types of T cells, indicating that there was no potential fratricide of the CAR-T cells. To further confirm this, we detected cell apoptosis using annexin V and found that the tmTNF-α CAR-T and NT cells had similar apoptotic rates (figure 4H, online supplemental figure S3B), suggesting activation-induced cell death in both types of T cells because of OKT3/anti-CD28 activation for 14 days, rather than fratricide by the CAR-T cells. Finally, the tmTNF-α expression was detected in five vital organs, including the heart, liver, lung, kidney, and brain. The tmTNF-α staining was weak or negative in these murine tissues (figure 4I), similar to that in human counterparts previously reported by us.16 These results suggest that the tmTNF-α CAR-T cells would not have significant side effects on vital organs.
Supplemental material

Estimation for the safety of tmTNF-α CAR-T therapy. (A) tmTNF-α expression in MDA-MB-231, CD3-negative non-adherent mononuclear cells (CD3− NM cells), monocytes and Act. monocytes with conditioned medium (supernatants from 12 hours’ culture of MDA-MB-231 cells) was detected by flow cytometry. The cytotoxicity of tmTNF-α CAR-T cells toward MDA-MB-231 (B), CD3− NM cells (C) and monocytes (D) at different E:T ratios was determined by Cam-release assay. (E) tmTNF-α expression and sTNF-α release by Unact. T cells, NT and CAR-T cells were detected by flow cytometry and ELISA, respectively. (F) Lysis of NT cells (as target cells) by CAR-T and NT cells at different E:T ratios. (G,H) tmTNF-α CAR-T and NT cells were cultured in medium supplemented with IL-2 (50 IU/mL) in plates coated with anti-CD3/anti-CD28. Viability and apoptosis of NT and CAR-T cells were analyzed at indicated time points by CCK8 and annexin V/PI, respectively. (I) Representative immunohistochemical images of tmTNF-α staining for tissue sections of heart, liver, lung, brain and kidney (magnification ×200) from NOD/SCID mice. The quantitative data represent means±SEM of three independent experiments. *P<0.05, **P<0.01, ***P<0.001 versus NT, except E (vs Unact. T cells). Act., activated; CAR-T, chimeric antigen receptor engineered-T; E:T, effector:target; IL, interleukin; NT, non-transduced T; sTNF-α, secreted tumor necrosis factor alpha; tmTNF-α, transmembrane tumor necrosis factor alpha; Unact., unactivated
tmTNF-α induced PD-L1 expression on breast cancer cells through dual signaling
The PD-L1/PD-1 checkpoint plays an important role in immune evasion. We found that the expression of PD-1 in the CAR-T and NT cells was gradually increased after infusion, even reaching 80% on day 80, while the expression levels of PD-L1 in tumors remained stable, although the CAR-T therapy had a tendency to reduce PD-L1 expression, compared with NT group (online supplemental figure S4A,B). sTNF-α has been reported to induce PD-L1 expression in cancer cells.16 17 However, the effect of tmTNF-α on PD-L1 expression remains unclear. tmTNF-α functions not only as a ligand but also as a receptor in tmTNF-α-expressing cells. Therefore, we stably transfected 293 T cells with tmTNF-α and fixed the cells as effector cells. The tmTNF-α-overexpressing cells were added to the TNBC cell line MDA-MB-468 to detect the role of tmTNF-α as a ligand. We found that tmTNF-α evidently enhanced the production of PD-L1 and especially elevated surface expression levels of PD-L1, and the stimulatory effect of tmTNF-α could be completely blocked by a TNF-α antibody (figure 5A,B). In addition, we found that tmTNF-α increased the phosphorylation of p38 but decreased the phosphorylation of NF-κB p65 and had no effects on the AKT pathway. In contrast, sTNF-α significantly activated all of these pathways except AKT (figure 5C) and induced PD-L1 expression. Blockage of p38 phosphorylation by SB203580 (figure 5D) partially inhibited sTNF-α- but completely blocked tmTNF-α-induced PD-L1 expression (figure 5E), indicating that either tmTNF-α or sTNF-α, as ligands, induced PD-L1 expression through the p38 pathway. Since IFN-γ was significantly increased by the CAR-T therapy and can be able to upregulate PD-L1 expression,18 19 IFN-γ and tmTNF-α may have a synergistic effect on the PD-L1 expression. As expected, tmTNF-α significantly promoted IFN-γ-induced PD-L1 expression via forward signaling (online supplemental figure S4C).
Supplemental material
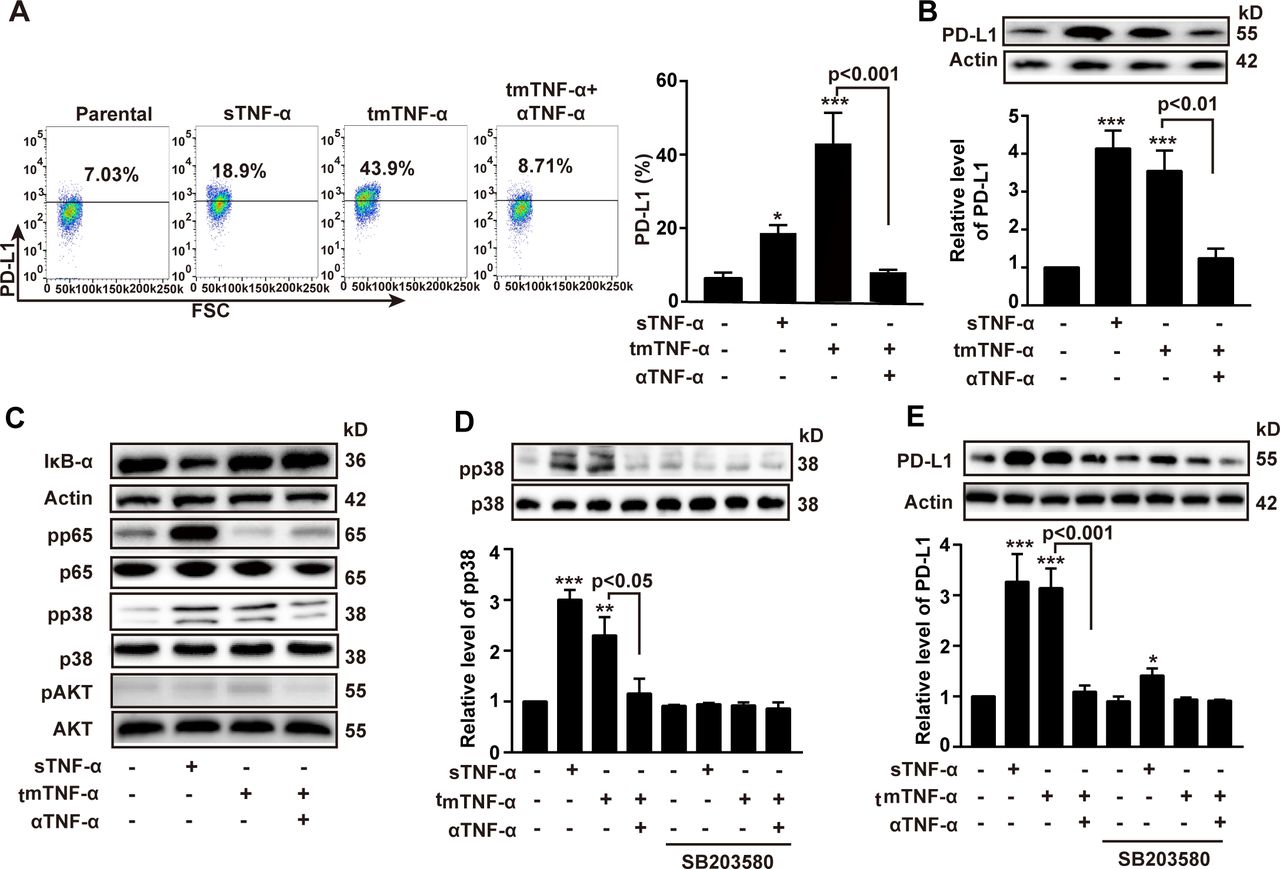
tmTNF-α as a ligand increases the expression of PD-L1. MDA-MB-468 cells as target cells were cocultured with 100 ng/mL sTNF-α or tmTNF-α stably transfected, fixed 293 T cells at an E:T ratio of 10:1. A neutralizing antibody against human TNF-α was added to fixed tmTNF-α-expressing 293 T cells for 30 min prior to addition to target cells. After stimulation for 24 hours, PD-L1 expression was detected by flow cytometry (A) and western blot (B), and their quantitative data. (C) Representative images of western blot for the degradation of IκΒα and the phosphorylation of the p65, p38 and AKT in MDA-MB-468 cells after stimulation with both forms of TNF-α for 30 min. (D,E) MDA-MB-468 cells were pretreated with or without a p38 inhibitor SB203580 (0.6 M) for 1 hour, followed by stimulation with both forms of TNF-α for 30 min (for signal pathways) or 24 hours (for PD-L1 expression). Representative images of western blot for the p38 phosphorylation (D) and the PD-L1 expression (E) from three independent experiments and quantitative data. All quantitative data represent means±SEM of three independent experiments. *P<0.05, **P<0.01, ***P<0.001 versus control. E:T, effector:target; sTNF-α, secreted tumor necrosis factor alpha; tmTNF-α, transmembrane tumor necrosis factor alpha; TNF-α, tumor necrosis factor alpha.
Next, we transferred the human TNF-α gene or tmTNF-α-NTF mutant into MDA-MB-468 cells to detect the role of tmTNF-α as a receptor that delivers outside-to-inside (reverse) signals to tmTNF-α-bearing tumor cells. The transfectants overexpressed tmTNF-α and tmTNF-α-NTF on the cell surface (figure 6A). The tmTNF-α-NTF mutant can’t bind to TNFR due to lack of extracellular sTNF-α fragment but contains the intact cytoplasmic part of tmTNF-α, which makes it capable of transducing reverse signaling but not forward signaling. The expression of either tmTNF-α or tmTNF-α-NTF significantly enhanced PD-L1 expression (figure 6A,B), suggesting that tmTNF-α-mediated reverse signaling also enhanced PD-L1 expression. Interestingly, the transfection of tmTNF-α-NTF markedly increased IκBα degradation and phosphorylation of the NF-κB p65, AKT (figure 6B), and p38 (online supplemental figure S5A) pathways, as the transfection of the full-length TNF-α did, indicating that tmTNF-α-mediated reverse signaling activated the NF-κB, AKT, and p38 pathways. Suppression of either the NF-κB pathway by PDTC (Pyrrolidinedithiocarbamate) or the AKT pathway by LY294002 significantly blocked tmTNF-α reverse signaling-induced PD-L1 expression (figure 6C,D), but blocking the p38 pathway by SB203580 had no effect on PD-L1 expression (online supplemental figure S5B). In contrast, the MDA-MD-231 cells constitutively expressed not only tmTNF-α (figure 1C) but also PD-L1,20 21 and the knockdown of TNF-α expression by the stable transfection of shRNA (figure 1C) reduced PD-L1 expression accompanied by decreased activation of the NF-κB, AKT, and p38 pathways (online supplemental figure S5C–E). Blocking the NF-κB and AKT pathways further suppressed tmTNF-α-induced PD-L1 expression in the MDA-MD-231 cells (online supplemental figure S5C,D). However, blockage of the p38 pathway had no effect (online supplemental figure S5E). These data suggested that tmTNF-α, as a ligand, induced PD-L1 expression through the p38 pathway and, as a receptor, enhanced PD-L1 expression via the NF-κB and AKT pathways (figure 6E). In addition, tmTNF-α showed a significant synergistic effect with IFN-γ on the PD-L1 expression via reverse signaling (online supplemental figure S5F).
Supplemental material
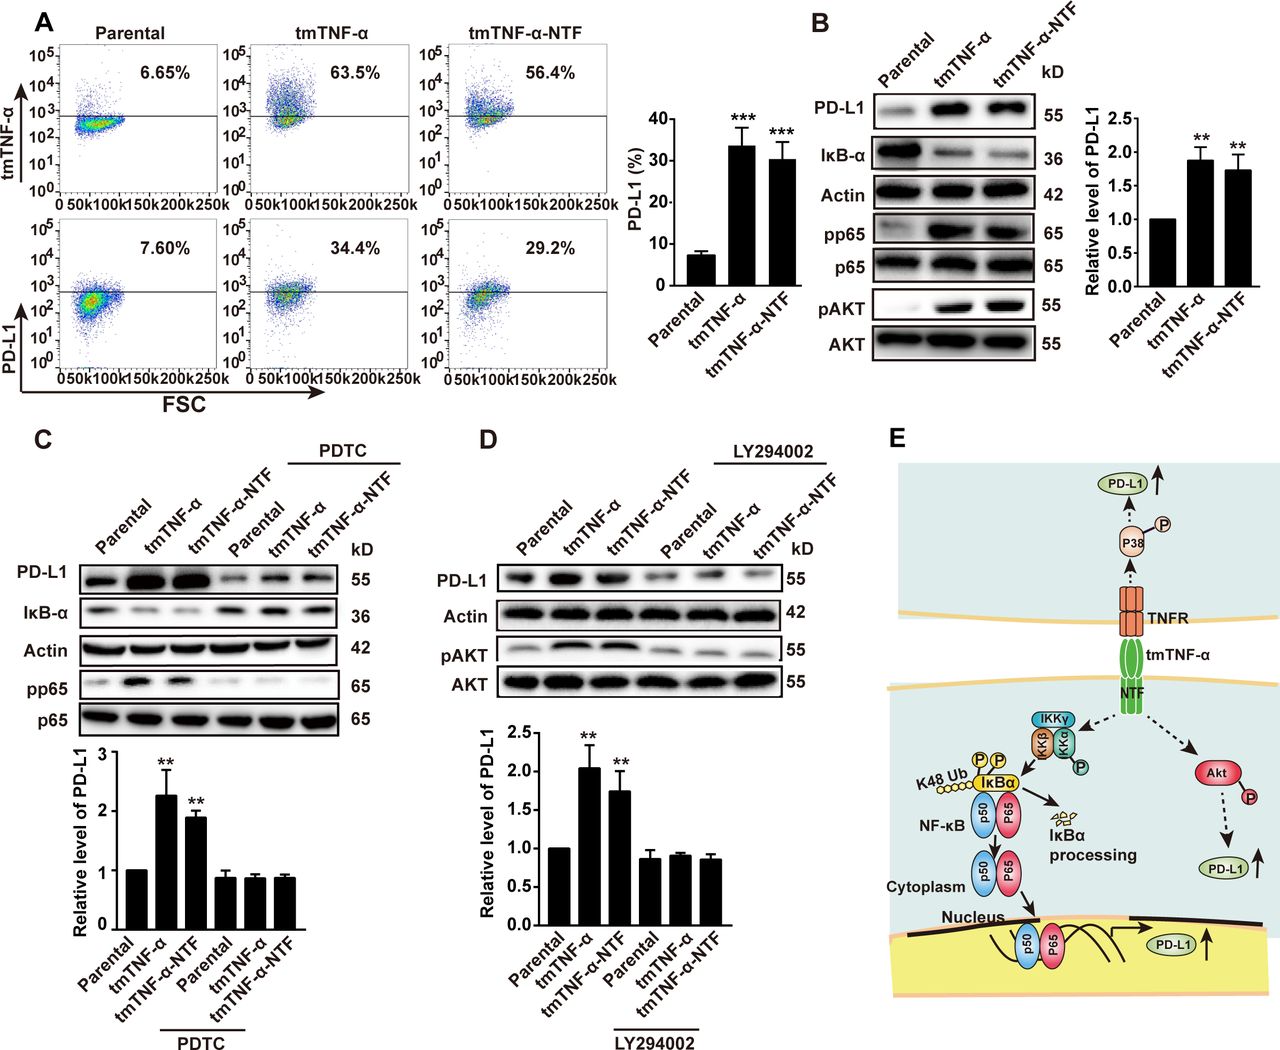
tmTNF-α increases PD-L1 expression via reverse signaling. MDA-MB-468 cells were transfected with TNF-α or tmTNF-α-NTF for 48 hours. The expression of tmTNF-α, tmTNF-α-NTF and PD-L1 on the cell surface was detected by flow cytometry (A), and representative images of western blot for PD-L1 production, degradation of IκΒα and phosphorylation of p65 and AKT in the transfectants (B) and quantitative data. (C,D) The transfectants were treated with or without a nuclear factor-kappa B (NF-κΒ) inhibitor, 100 µM of PDTC, or an AKT inhibitor, 50 µM of LY294402 for another 24 hours, respectively, following 24 hours of the transfection. Representative images of western blot for PD-L1 expression, IκΒα degradation and phosphorylation of p65 and AKT, and quantitative data. All quantitative data represent means±SEM of three independent experiments. **P<0.01, ***P<0.001 versus parental. (E) Schematic illustration of mechanisms for tmTNF-α-induced PD-L1 expression in breast cancer cells. tmTNF-α, as a ligand, promotes PD-L1 expression through p38 pathway via TNFR, and as a receptor, enhances PD-L1 expression through NF-κΒ and AKT pathways. NTF, N-terminal fragment; tmTNF-α, transmembrane tumor necrosis factor alpha.
PD-1 mAb enhances tmTNF-α CAR-T cell therapy
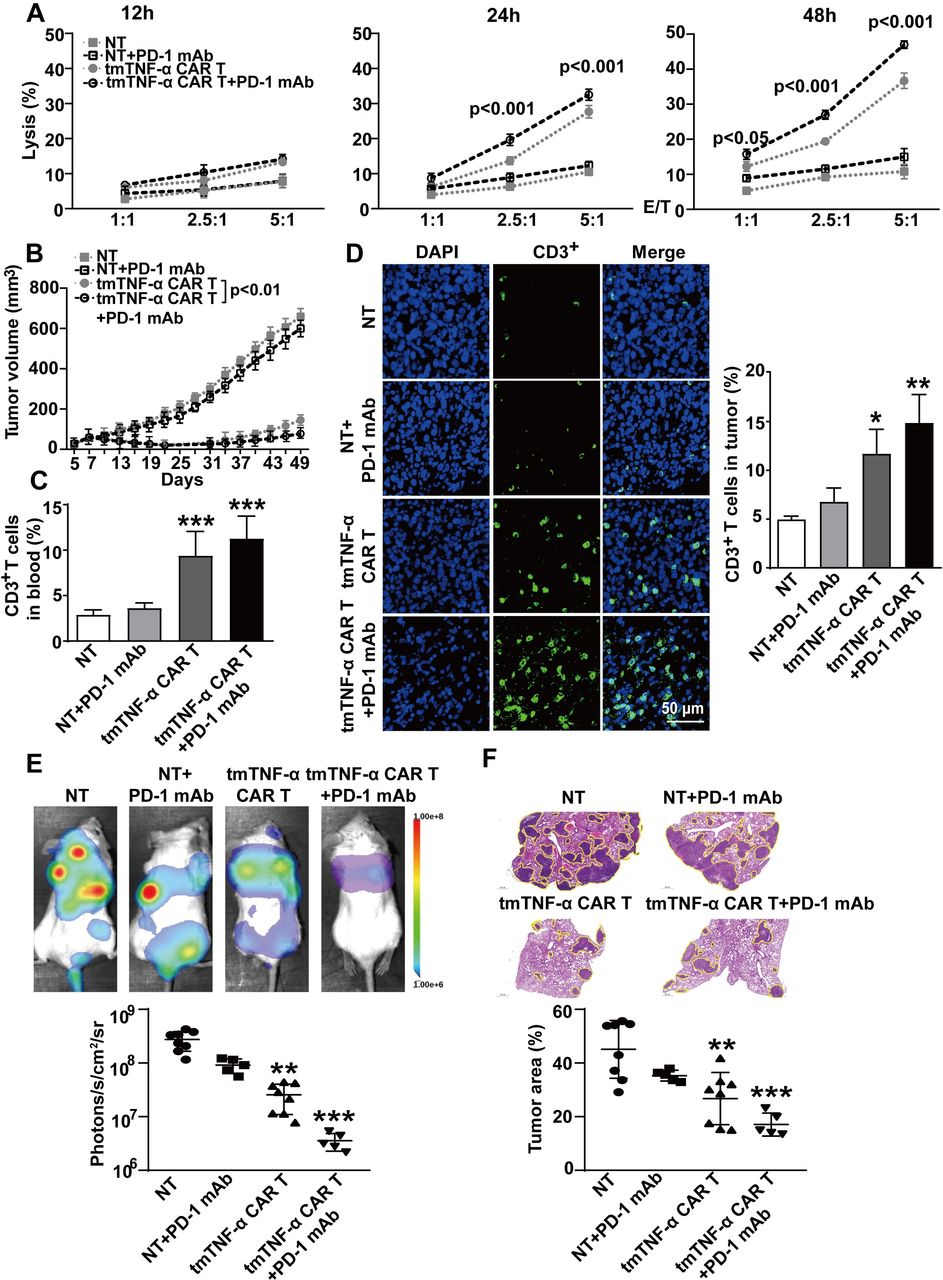
Our aforementioned results indicated that tmTNF-α promoted PD-L1 expression, which may affect the activities of CAR-T cell therapy. Therefore, we used PD-1 mAb to block PD-L1/PD-1 signaling and observed whether the CAR-T cell therapy could be enhanced. In vitro, the PD-1 mAb did not significantly increase the lysis rate of the CAR-T cells for 12 hours at lower E:T ratios but significantly increased cytotoxicity for 24 hours at E:T ratios of 2.5:1 and 5:1, and for 48 hours even at an E:T ratio of 1:1 (figure 7A). In vivo, the NOD/SCID mice were intraperitoneally administered 200 µg of PD-1 mAb prior to the first infusion of 5×10⁶ tmTNF-α CAR-T cells or NT cells on day 7 post inoculation of the TNBC MDA-MD-231 cells. The treatment with PD-1 mAb was repeated every 3 days. The second infusion of the CAR-T cells was on day 14. As expected, the CAR-T therapy induced tumor regression as tumor size was significantly reduced, and PD-1 mAb promoted markedly the antitumor effect of CAR-T therapy (figure 7B) and increased CAR-T therapy-induced splenomegaly (online supplemental figure S6A). In addition, PD-1 mAb had a tendency to enhance the number of CD3+ T cells in the blood, spleen and tumor tissue of the mice treated with CAR-T cells (figure 7C,D, and online supplemental figure S6B,C), and promote IL-2 and IFN-γ secretion (online supplemental figure 6D,E). We further investigated the effect of the tmTNF-α CAR-T therapy and PD-1 mAb on experimental tumor metastasis. The infusion of CAR-T cells was performed on days 1 and 8 after intravenous injection of the MDA-MD-231 cells in the NOD/SCID mice and the PD-1 mAb treatment was the same as previously mentioned. As expected, the CAR-T cell monotherapy significantly suppressed tumor metastasis, and PD-1 mAb had a tendency to enhance the efficacy of the CAR-T therapy (figure 7E,F). Collectively, our results demonstrate the potent antitumor effect of the tmTNF-α CAR-T cells that can be enhanced by PD-1 mAb.
Supplemental material

Effect of a PD-1 antibody combined with CAR-T therapy on primary tumors and metastasis. (A) CAR-T or NT cells were incubated with MDA-MB-231 cells at different E:T ratios for indicated time points. The lysis rate was detected by the LDH (lactate dehydrogenase)-release assay and represent means±SEM of three independent experiments. (B–D) NOD/SCID mice were inoculated subcutaneously with 2×10⁶ MDA-MB-231 cells on the right mamma pat (day 0). Intravenous infusion of 5×10⁶ tmTNF-α CAR-T cells or NT cells was on days 7 and 14. PD-1 mAb (200 µg) was intraperitoneally injected every 3 days, starting on day 7 prior to CAR-T cell infusion (n=6 each group). (B) Tumor growth curve. (C) Human CD3+ T cells in the blood were analyzed by flow cytometry. (D) Representative images of CD3+ T cells in tumor tissues (magnification ×200) detected by indirect immunofluorescence and quantitative data. The quantitative data represent means±SEM. *P<0.05, **P<0.01, ***P<0.001 versus NT. (E,F) NOD/SCID mice were intravenously injected with 5×10⁵ luciferase-labeled MDA-MB-231 cells (day 0). 5×10⁶ tmTNF-α CAR-T cells or NT cells were infused on days 1 and 8. PD-1 mAb was intraperitoneally injected every 3 days, starting on day 1 prior to infusion of T cells (n=5–8, each group). (E) A representative mouse for each group for firefly luciferase imaging of pulmonary metastases and quantitative data. (F) Representative H&E staining pictures of lung sections and the percentage of tumor area was calculated using Image J software (National Institutes of Health, Bethesda, Maryland, USA). The quantitative data represent median±SD. **P<0.01, ***P<0.001 versus NT. CAR-T, chimeric antigen receptor engineered-T; DAPI, 4′,6-diamidino-2-phenylindole; E:T, effector:target; mAb, monoclonal antibody; NT, non-transduced T; tmTNF-α, transmembrane tumor necrosis factor alpha.
Discussion
In the present study, we fused the scFv from tmTNF-α mAb to the cytoplasmic signaling domains of 4-1BB and CD3ζ to generate a second generation of tmTNF-α CAR. The tmTNF-α CAR-T cells showed a strong antitumor effect on tmTNF-α-positive breast cancer cells, including TNBC cells. This was supported by the following lines of evidence:
The tmTNF-α CAR-T cells were highly cytotoxic to the tmTNF-α-positive MDA-MB-231 TNBC and to MCF-7 breast cancer cells ectopically overexpressing tmTNF-α in vitro. However, the tmTNF-α CAR-T cells had a markedly reduced killing effect on TNF-α shRNA-transfected MDA-MB-231 cells and no effect on tmTNF-α-negative MCF-7 cells. Furthermore, the levels of secreted IFN-γ and IL-2 increased with the enhancement of the cytotoxicity of the tmTNF-α CAR-T cells when targeting tmTNF-α-expressing tumor cells. These results indicate the specificity of the tmTNF-α CAR-T cells.
The tmTNF-α CAR-T therapy induced significant regression of tmTNF-α-expressing MDA-MB-231 TNBC tumors in NOD/SCID mice and increased survival, with enhanced secretion of IFN-γ and IL-2. Notably, our results revealed that in the CAR-T cells, the percentage of TCM was higher than TEM but lower than that in the NT cells in vitro. This is not in line with the study by Li et al,22 demonstrating that 4-1BB as a costimulator in CAR favors the TCM phenotype, which is associated with the persistence of CAR-T cells in vivo.23 The difference may be due to our T cells from UCB, not from the peripheral blood. Tammana et al reported that the UCB T cells transduced with CD19 CARs with CD28, 4-1BB or both costimulatory signaling domains were CD45RAhigh, ROhigh, CD62Llow and CCR7−, suggesting that 4-1BB did not favor the TCM phenotype in UCB T cell-derived CAR-T cells.24
Furthermore, tmTNF-α CAR-T cells have the following features. First, sTNF-α has been reported to increase in many tumors,25–28 which cannot buffer tmTNF-α CAR-T cells, and thus the efficacy of the CAR-T cells is unaffected. Because the epitope that tmTNF-α CAR recognizes is not in the amino acide sequence of sTNF-α. Second, tmTNF-α can be cleft by TACE, leaving NTF on the cell surface. However, our results revealed that the tmTNF-α CAR-T cells could bind to NTF in addition to full-length tmTNF-α and exert cytotoxicity. This suggests that after the cleavage of tmTNF-α, the tmTNF-α CAR-T cells could still target NTF prior to its further intramembrane cleavage to the intracellular domain by signal peptide peptidase-like proteases.29 Third, our previous work demonstrated that tmTNF-α antibodies compete with TACE to increase tmTNF-α expression and decrease sTNF-α release.11 It is possible that the tmTNF-α CAR-T cells also increased the density of tmTNF-α expression on the cell surface, which in turn enhanced their cytotoxicity. This may also be a reason why the tumors persistently expressed tmTNF-α at higher levels after the CAR-T therapy, although tmTNF-α expression was significantly suppressed in a short time. Fourth, as shown in our previous study and studies from other researchers, tmTNF-α promotes suppressive activities of MDSCs30 and induces activation and expansion of Tregs.31 In theory, lysis of tmTNF-α-expressing tumor cells by CAR-T cells facilitates the immune response by blocking the activation and accumulation of immunosuppressive cells in the tumor microenvironment (TME). Fifth, our results showed the relative safety of the tmTNF-α CAR-T therapy. We did not find markedly adverse effects of the tmTNF-α CAR-T cells on human monocytes and CD3-negative NM cells, including neutrophils, B cells and NK cells, and activated T cells, although we found that tmTNF-α was expressed at low levels on these types of cells, consistent with our previous work.16 Given tmTNF-α expression possibly affected by TME, we used tumor cell culture medium to stimulate monocytes and found that tmTNF-α expression was increased and the tmTNF-α CAR-T cells showed a slight specific lysis. This might be beneficial for the antitumor response, as tumor-associated macrophages in the TME would be killed by the tmTNF-α CAR-T cells. In addition, the tmTNF-α expression in five important vital organs of mice was weak or negative, which is also in line with that in human counterparts.16 Further evaluations of the safety of tmTNF-α CAR-T therapy are necessary for future studies.
PD-L1 is overexpressed in breast cancers, especially in TNBC,32 and PD-L1/PD-1 signaling plays a very important role in maintaining immunosuppression in the TME. Our original results revealed that tmTNF-α is an inducer of PD-L1 in breast cancer cells, as MDA-MB-231 TNBC cells express high levels of PD-L1,20 21 but silencing TNF-α by shRNA significantly reduced PD-L1 expression. Conversely, ectopic overexpression of tmTNF-α in MDA-MB468 TNBC cells significantly enhanced PD-L1 expression. In addition, we found that the addition of exogenous tmTNF-α (as a ligand) to MDA-MB-468 cells led to PD-L1 expression through the p38 pathway, as inhibition of the p38 pathway completely blocked tmTNF-α-induced PD-L1 expression. In contrast, sTNF-α activated both the NF-κB and p38 pathways. NF-κB is known to be required for sTNF-α-induced PD-L1 expression,17 33 and our results revealed that the p38 pathway also mediated sTNF-α-induced PD-L1 expression. tmTNF-α functions not only as a ligand to deliver signals via TNFR but also as a receptor to transduce reverse signals into tmTNF-α-bearing cells. The transfection of TNF-α or TNF-NTF (lack of sTNF-α and TNFR binding but retention of the intracellular fragment of tmTNF-α to transduce reverse signaling) into the MDA-MB-468 cells significantly increased PD-L1 expression via activation of the NF-κB and AKT pathways because tmTNF-α- or NTF-induced PD-L expression could be blocked by suppressing activation of the NF-κB and AKT pathways but not the p38 pathway. Our data indicate that tmTNF-α upregulated PD-L1 expression through the p38 pathway activated by forward signaling (via TNFR) and through the NF-κB and AKT pathways activated by reverse signaling. Furthermore, CAR-T therapy-induced secretion of IFN-γ is also a strong inducer of PD-L1,34 and we found that tmTNF-α exhibited a significant synergistic effect with IFN-γ on PD-L1 expression through its dual signaling. Meanwhile, our results also showed that the CAR-T cells expressed PD-1 at high levels, especially on days 42 and 80, indicating that the CAR-T cells became exhaustive, which may be one of the reasons why the tumor grew back. It was highly likely that PD-1/PD-L1 pathway limited the efficacy of the tmTNF-α CAR-T therapy.
Therefore, we combined CAR-T therapy with a PD-1 antibody, showing a stronger antitumor effect, in vitro and in vivo, on primary tumors. In addition, anti-PD-1 had a tendency to promote the suppression of experimental tumor metastasis by the tmTNF-α CAR-T therapy. Although PD-1 mAb tended to increase the number of tmTNF-α CAR-T cells in the blood, spleen and tumor tissues and the secretion of IL-2 and IFN-γ, compared with the tmTNF-α CAR-T monotherapy, it still suggests a benefit from blocking the PD-1/PD-L1 pathway for promotion of activation and proliferation of CAR-T cells. In addition, the tmTNF-α CAR-T therapy may also sensitize breast cancer to PD-1 blockade. Employing immune checkpoint inhibitors has drastically improved clinical outcomes in different tumors, certain poorly immunogenic tumors, such as breast cancer, have a low response to PD-1/PD-L1 blockade monotherapy from early-phase trials.35–37 However, TNF blockade prevents anti-PD-1-induced TIL cell death as well as PD-1 and TIM-3 expression and overcomes the resistance to anti-PD-1 in experimental melanoma.38 It should be reasonable to assume that the tmTNF-α CAR-T cells may also overcome the resistance to anti-PD-1 by destroying TNF-producing breast cancer cells, and both therapies reinforce each other. However, the effect of PD-1 mAb on the tmTNF-α CAR-T therapy against TNBC was limited, which suggests that other factors in the TME affected the tmTNF-α CAR-T therapy, which should be further investigated in future studies.
In summary, our study demonstrated a potent antitumor effect of tmTNF-α CAR-T cells on tmTNF-α-expressing breast cancer cells, including TNBC cells. However, tmTNF-α induces PD-L1 expression via dual signaling. Blockade of PD-1 enhances the antitumor effect of the tmTNF-α CAR-T cell therapy, suggesting a combination of tmTNF-α CAR-T therapy with anti-PD-1 as a promising individual therapy for tmTNF-α-positive breast cancer and other tumors.
Data availability statement
Data are available upon reasonable request.
Ethics statements
Patient consent for publication
Ethics approval
Human UCB T cells were used in the present study with approval by the ethics committee of Tongji Medical College, Huazhong University of Science and Technology (ID number S142). Mouse experiments were approved by the Animal Care and Ethics Committee of Tongji Medical College, Huazhong University of Science and Technology (ID number S2453).
Acknowledgments
We appreciate the assistance of Dr Yaqi Duan (Department of Pathology, Tongji Hospital, Tongji Medical College, Huazhong University of Science and Technology) in the histological analysis.
References
Supplementary materials
Supplementary Data
This web only file has been produced by the BMJ Publishing Group from an electronic file supplied by the author(s) and has not been edited for content.
Footnotes
Twitter @bhpsky
Contributors HB, ZZ, PZ, ZD, and XZ planned and performed the experiments. HB, ZD, and ZZ analyzed the data. ZL, BY, and JW initiated the project and designed the study. XZ and ZL drafted and wrote the manuscript, supervised the entire study and were guarantors of this publication. All authors approved the manuscript.
Funding This study was supported by National Natural Science Foundation of China (general program 81272520 and 3167080495 to ZL) and by China Postdoctoral Science Foundation (2018M642852 to HB).
Competing interests None declared.
Provenance and peer review Not commissioned; externally peer reviewed.
Supplemental material This content has been supplied by the author(s). It has not been vetted by BMJ Publishing Group Limited (BMJ) and may not have been peer-reviewed. Any opinions or recommendations discussed are solely those of the author(s) and are not endorsed by BMJ. BMJ disclaims all liability and responsibility arising from any reliance placed on the content. Where the content includes any translated material, BMJ does not warrant the accuracy and reliability of the translations (including but not limited to local regulations, clinical guidelines, terminology, drug names and drug dosages), and is not responsible for any error and/or omissions arising from translation and adaptation or otherwise.