Article Text

Abstract
Objective To describe national rates of sexually transmitted infection (STI) testing and education overall and among patient subgroups in US outpatient physician offices from 2009 to 2016.
Design This was a cross-sectional study of the Centers for Disease Control and Prevention’s National Ambulatory Medical Care Survey from 2009 to 2016. Data weights were applied to extrapolate to national estimates.
Setting Data were collected from a systematic random sample of outpatient physician office visits throughout USA. Physician office types include free standing clinics, private or group setting practices, centres offering community and mental health services, family planning clinics and health maintenance organisations/other prepaid clinics.
Participants All sampled patient visits were eligible for inclusion and were assessed for the provision of STI prevention education and STI testing for chlamydia, gonorrhoea, hepatitis, human papillomavirus (HPV) and HIV.
Results Of 7.6 billion total visits, 123 million included an STI test. Hepatitis was the most commonly tested STI (9.12 per 1000), followed by chlamydia (6.67 per 1000), gonorrhoea (6.00 per 1000), HIV (5.40 per 1000) and HPV (5.03 per 1000). Testing rates for the three STIs measured for the entire 8-year period increased over time and peaked in 2015 compared with 2009: chlamydia (R2=0.36), HPV (R2=0.28) and HIV (R2=0.51). Testing was highest among women (21.93 per 1000), 15–24-year olds (46.04 per 1000), non-Hispanic blacks (37.33 per 1000) and those seen by obstetrics/gynaecology specialists (103.75 per 1000). STI prevention education was provided to 4.89 per 1000 patients and remained relatively unchanged from 2013 to 2016.
Conclusion STI testing in outpatient physician offices increased over the study period but varied by patient characteristics and site of care. Few patients received STI prevention education, highlighting a potential gap in resource utilisation in these settings.
- epidemiology
- HIV
- family health
- health services research
Data availability statement
Data are available in a public, open access repository. Data for this research is freely available through the Centres for Disease Control and Prevention repository for Ambulatory Health Care Data via the National Center for Health Statistics and was accessed and used within their terms and conditions. Information regarding the collection of this data has been cited in the text and it also available through the CDC repository.
This is an open access article distributed in accordance with the Creative Commons Attribution Non Commercial (CC BY-NC 4.0) license, which permits others to distribute, remix, adapt, build upon this work non-commercially, and license their derivative works on different terms, provided the original work is properly cited, appropriate credit is given, any changes made indicated, and the use is non-commercial. See: http://creativecommons.org/licenses/by-nc/4.0/.
Statistics from Altmetric.com
Key points
Question: to describe national rates of sexually transmitted infection testing and education overall and among patient subgroups in US outpatient physician offices from 2009 to 2016.
Finding: outpatient physician offices are providing more testing and education for sexually transmitted infections in recent years, but care varies by patient population and practice setting.
Meaning: outpatient physician offices might be underutilised in sexual healthcare and can fill a critical gap in the prevention and testing of sexually transmitted infections. Standardised practices for testing and prevention education should be encouraged in these settings.
Introduction
Sexually transmitted infections (STIs) are the most common infectious diseases in the USA. An estimated 20 million new cases occur each year1 and approximately one in two sexually active persons will contract an STI by the age of 25.2 While all sexually active persons are at risk, STIs disproportionately affect young individuals, racial and ethnic minorities, and men who have sex with men (MSM). People between the age of 15 and 24 years account for 50% of all new STI cases.1 In addition, cases of STIs have been rising in the USA with an increase in the incidence of the three most common reportable STIs from 2017 to 2018: chlamydia rates increased 2.9%, from 524.6 to 539.9 cases per 100 000 population, gonorrhoea rates among women increased from 37.2% to 145.8 cases per 1 00 000 women and syphilis increased 13.3% from 101 584 total cases to 115 045 total cases.3 At the same time, funding for STI prevention and treatment programmes has declined, resulting in a reduction in the number of clinicians involved in STI diagnosis and treatment.4 5
Primary care physicians (ie, those trained in family medicine, general internal medicine or general paediatrics) are front-line providers for those needing STI screening/testing, education and intervention; however, they remain an underutilised resource.6 Outside of sexually transmitted disease (STD)-specific clinics and clinics that focus on sexual health, screening rates are particularly low, leaving a gap in care that can be filled through primary care visits.7 Primary care settings may be underutiliing opportunities to provide STI prevention education and counselling, as a 2020 study showed that other specialties (such as obstetrics and gynaecology (OB/GYN)) provided STI education counselling three times as often as family medicine physicians (OR=3.28; p=0.035).8
A comprehensive understanding of STI resource utilisation in US physician offices could help inform potential barriers to laboratory testing and future preventative efforts. Thus, the objective of this study was to describe national rates of STI testing and education overall and among patient subgroups in US outpatient physician offices from 2009 to 2016.
Methods
Study design and data collection
This was a cross-sectional study using data obtained from the Centers for Disease Control and Prevention’s (CDC) National Ambulatory Medical Care Survey (NAMCS) from 2009 to 2016. NAMCS data methodologies and sample design have been previously described.9 Briefly, the NAMCS, a component of the National Healthcare Surveys distributed by the CDC, includes patient visits to nonfederally employed, office-based physicians, including providers who may be involved in STI care, such as women’s reproductive health physicians in OB/GYN. The survey excludes anesthesiology, pathology and radiology specialties. Physician office types may include free standing clinics, private or group setting practices, centres offering community and mental health services, family planning clinics and health maintenance organisations/other prepaid clinics. The NAMCS was approved by the National Center for Health Statistics Ethics Review Board (protocol number 2016-03).
STI testing for chlamydia, gonorrhoea, hepatitis, human papillomavirus (HPV) and HIV is captured as part of the standard NAMCS data collection tool. Data abstractors are instructed to select all laboratory tests ordered or provided to the patient as documented in the clinical record. Of note, the hepatitis panel includes hepatitis A, B and C and does not distinguish between the three. For the included study years, testing for HPV, HIV and chlamydia was available for all study years (2009–2016) and hepatitis and gonorrhoea testing were available from 2014 to 2016. STI prevention education, also part of the standard NAMCS data collection tool, was defined as an encounter in which the patient was educated about transmission, safe sex practices including proper condom use, offered and encouraged to participate in laboratory testing and offered partner notification.10 STI prevention education was only collected from 2013 to 2016. STI testing and education were estimated by age group, sex, race and ethnicity, geographic region and insurance type. Age group was categorised according to the NAMCS as <15 years, 15–24 years, 25–44 years, 45–64 years, 65–74 years and 75+ years. Sex was coded as female or male. Race and ethnicity were coded in the NAMCS data set as four categories: Hispanic, non-Hispanic Black, non-Hispanic white and non-Hispanic other (including Asian, Native Hawaiian/Other Pacific Islander, American Indian or Alaska Native and Multiple races). Geographic region was defined by the US Census Bureau as Northeast, Midwest, South and West. Insurance types included Medicaid, Medicare, private, self-pay and other (Children's Health Insurance Program (CHIP), other state-based programmes, no charge, charity, other, unknown and worker’s compensation).
Data analysis
Data weights were applied as frequency weights to extrapolate sampled patient visits to national estimates for all analyses. Data weights were derived by a multistage estimation procedure that includes inflation by reciprocals of the probabilities of selection, adjustment for nonresponse, a ratio adjustment for fixed totals and weight smoothing. Testing for HIV, HPV, chlamydia, hepatitis and gonorrhoea was presented per 1000 total visits overall, by survey year and by subgroups. Subgroup analyses were performed for age group, sex, insurance type, geographic region and provider specialty by STI test and by receipt of prevention education. Testing trends for those tests available over the entire 8-year period (chlamydia, HPV, HIV) were calculated using the coefficient of determination (R2) value. We also conducted a sensitivity analysis excluding the year 2015 from trend analyses. All analyses were conducted using JMP Pro V.14 (SAS, Cary, North Carolina).
Results
STI testing overall
Of 7.6 billion total visits, 123 178 600 included any STI laboratory test. Hepatitis was the most tested STI (9.12 per 1000), followed by chlamydia (6.67 per 1000), gonorrhoea (6.00 per 1000), HIV (5.40 per 1000) and HPV (5.03 per 1000). Testing rates for the three STIs measured for the entire 8-year period increased over time and peaked in 2015 compared with 2009 (figure 1): chlamydia (R2=0.36), HPV (R2=0.28) and HIV (R2=0.51). In the sensitivity analysis excluding 2015, testing trends also increased over time: chlamydia (R2=0.19), HPV (R2=0.50) and HIV (R2=0.53). Characteristics of patient visits for any STI test and individual STI tests are provided in online supplemental table 1.
Supplemental material

STI laboratory testing rates over time. HPV, human papillomavirus; STI,sexually transmitted infection.
Individual STI testing by subgroup
Overall, patients age 15–24 years had the highest rate of receiving any STI test (46.04 per 1000), followed by patients 25–44 years old (35.83 per 1000) (figure 2). Individual STI testing also varied slightly by age group: patients age 15–24 years had the highest rates of chlamydia (31.93 per 1000), gonorrhoea (28.73 per 1000) and HIV tests (15.78 per 1000), and patients age 25–44 years had the highest rates of HPV (11.29 per 1000) and hepatitis tests (15.88 per 1000). Hepatitis testing was also common among patients 45–64 years old (13.28 per 1000).
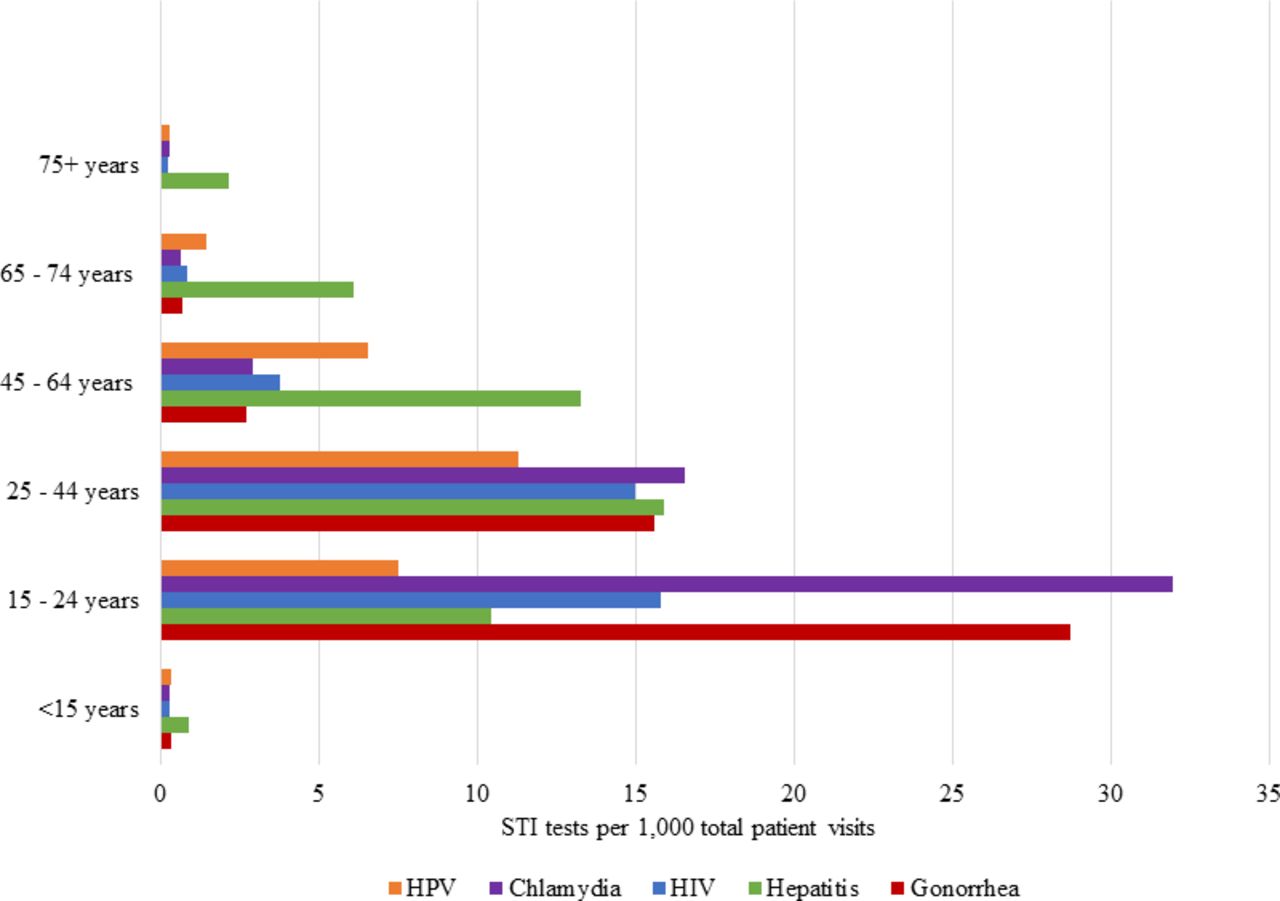
STI testing rates by age group. HPV,human papillomavirus; STI, sexually transmitted infection.
Women were tested at a higher rate for all individual STIs compared with men: any STI test (21.93 vs 8.04 per 1000), chlamydia (9.52 vs 2.68 per 1000), gonorrhoea (8.37 vs 2.69 per 1000), hepatitis (10.34 vs 7.43 per 1000), HIV (6.30 vs 4.15 per 1000) and HPV (7.83 vs 1.13 per 1000).
STI testing also varied by geographic region. The South region had overall highest testing rate (23.90 per 1000), followed by the Northeast (18.48 per 1000), West (16.03 per 1000) and Midwest (14.88 per 1000). The South also had the highest testing rates for gonorrhoea (7.47 per 1000), hepatitis (12.17 per 1000), HIV (7.22 per 1000) and HPV (6.81); however, the Northeast had the highest rate of chlamydia testing (7.25 per 1000) (figure 3).

STI testing rates by geographic region. HPV,human papillomavirus; STI, sexually transmitted infection.
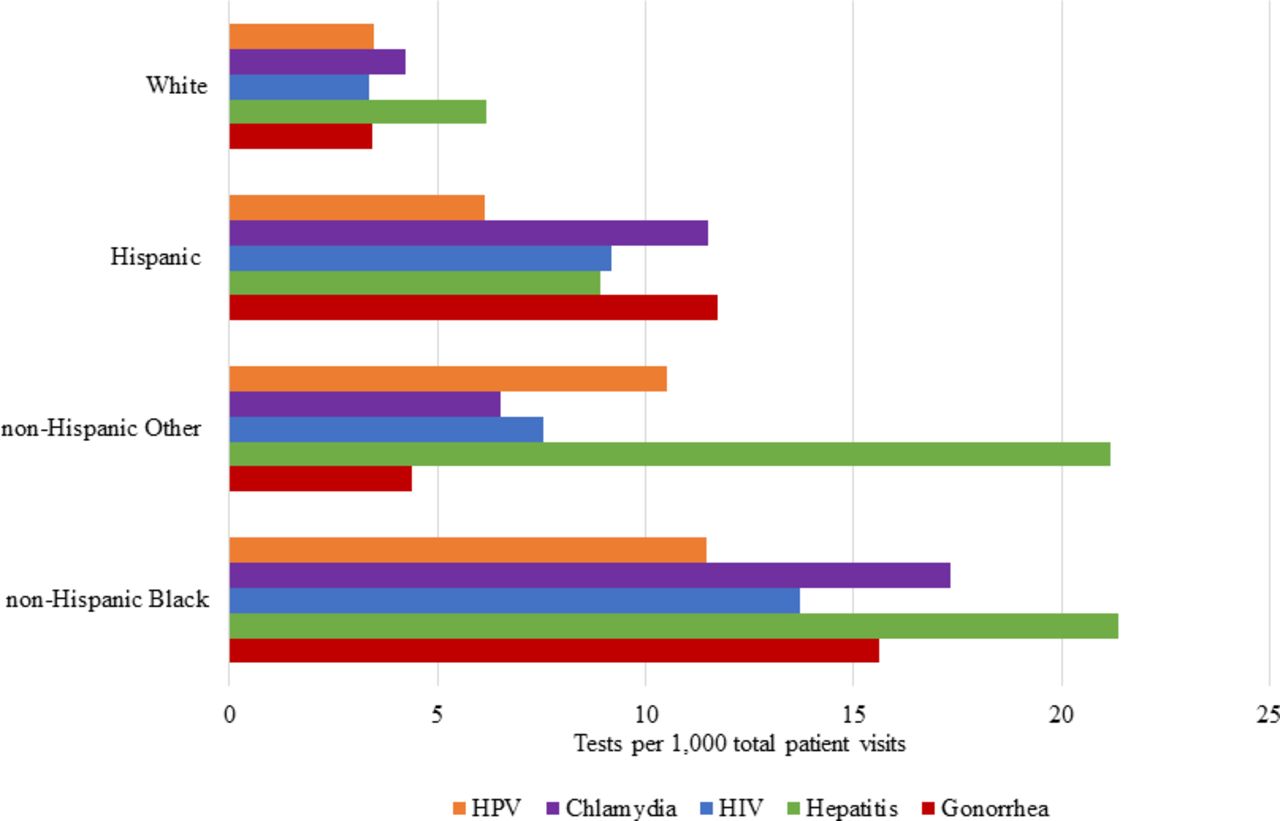
Regarding race and ethnicity, non-Hispanic black patients were tested at the highest rate overall and for all individual STIs: any STI test (37.33 per 1000), chlamydia (17.34 per 1000), gonorrhoea (15.61 per 1000), hepatitis (21.37 per 1000), HIV (13.72 per 1000) and HPV (11.48 per 1000) (figure 4). Notably, patients of white race had the lowest rates of STI testing overall (10.71 per 1000) and all for individual STI tests.
STI testing rates by race and ethnicity. HPV,human papillomavirus; STI, sexually transmitted infection.
STI testing by insurance group was variable. The ‘other’ insurance group had the highest testing rates for gonorrhoea (12.64 per 1000), chlamydia (12.52 per 1000), HIV (10.79 per 1000) and HPV (7.31 per 1000). Hepatitis testing was highest among private insurers (11.70 per 1000) (online supplemental figure 5).
OB/GYN specialists provided the most testing overall (103.75 per 1000), followed by general/family practice (20.83 per 1000), internal medicine (13.15 per 1000), paediatrics (4.68 per 1000) and other specialties (3.56 per 1000). OB/GYN specialists also have the highest testing rates for all individual STI tests (online supplemental figure 6).
Testing trends by subgroups followed overall trends with most groups peaking in 2015. Specifically, the peak in 2015 for overall STI testing was driven by peaks in testing for the following subgroups: patients age 15–24 years (86.57 per 1000), females (46.16 per 1000), patients in the South (58.46 per 1000), non-Hispanic black patients (82.76 per 1000), patients with ‘other’ insurance (69.14 per 1000) and those seen by OB/GYN physicians (153.02 per 1,000).
STI prevention education overall and by subgroup
Overall, STI prevention education was provided to 4.89 per 1000 patients and remained relatively unchanged from 2013 to 2016 (range 4.57–5.08 per 1000). Among those who received an STI test, prevention education was much higher (74.37 per 1000). Prevention education was provided to the 15–24-year olds at the highest rate (22.91 per 1000), while all other age groups received prevention education at rates less than 10 per 1000. More women received education compared with men (5.72 vs 3.72 per 1000). While Hispanics did not receive the highest level of any STI test, they received more prevention education than any other group (9.62 per 1,000), while non-Hispanic blacks and non-Hispanic other had comparable rates (7.40 and 7.32 per 1000, respectively). Prevention education by geographic region was relatively well distributed: Northeast (6.84 per 1000), West (5.08 per 1000), South (4.23 per 1000) and Midwest (3.79 per 1000). Most patients receiving prevention education either did not have, or did not file through insurance, or otherwise received a free or charitable service (8.35 per 1000), with private insurers otherwise receiving most education services (5.69 per 1000). OB/GYN specialists provided the most prevention education (21.94 per 1000), followed by paediatrics (11.51 per 1000), general/family practice (5.54 per 1000) and internal medicine (3.08 per 1000).
Discussion
In this nationally representative study of outpatient physician offices, few patient visits included an STI test (approximately 16 per 1000 total visits). This study is the first, to our knowledge, to assess STI laboratory testing trends in ambulatory care settings for all five STIs currently captured in the NAMCS as well as provide an assessment of STI prevention education offered in these settings. The results of this study show a promising upward trend in laboratory testing for STIs, consistent with other literature showing a 1.5-fold increase in visits involving chlamydia testing along with a 2-fold increase in visits involving gonorrhoea testing.11 Despite this, the provision of STI prevention education was lower than the rate of STI laboratory testing and remained unchanged over the study period.
This study noted substantial variation in STI testing and education by various patient populations. First, patients age 15–24 years received the most testing, which is in line with prior findings that 15–24-year olds account for 50% of all new STD cases1; however, this age group did not receive the majority of hepatitis and HPV STI testing. This could be due to the chronic nature of hepatitis and HPV outcomes that are not addressed until later in the life course; however, prevention at a young age should be a major focus of reducing the incidence of these infections; therefore, it is encouraging to see the highest rate of prevention education being provided to this age group. Further compounding this discrepancy, there are differing recommendations regarding testing for these STIs, as the US Preventive Services Taskforce recommends HPV screening at 21 years of age for women,12 while the American Cancer Society recommends 25 years of age.13 Additionally, hepatitis guidelines differ in that all adults of 18–79 years should be screened for hepatitis C,14 while hepatitis B screening is only recommend for those clinically assessed to be at risk.15 Earlier screening recommendations are made for those who meet at-risk clinical standards, which should be stressed to healthcare providers as they consider risk during patient evaluation; as well, screening recommendations should be further standardised for STIs, as these differences can exacerbate testing and prevention education disparities.
While young adults are tested at higher rates for more common STIs, such as gonorrhoea, the overall testing rates may be low compared with the need for testing. This is worrisome, as gonorrhoea is the second most commonly reported notifiable disease3 (and second most common bacterial STI)16 worldwide, is known to increase the transmission of HIV17 and has resulted in many treatment failures from extended-spectrum cephalosporin resistance.17 Additionally, given that molecular diagnostics are standard of care and most commercial vendors offer a Chlamydia trachomatis and Neisseria gonorrhoeae combination assay, it is unclear why there was a large difference in testing rates for chlamydia and gonorrhoea; however, this difference is similar to the difference seen in annual incidence rates of these two STIs. Future NAMCS surveys would benefit from the collection of type of laboratory test used, as this information can be easily incorporated into patient medical records once reviewed by the healthcare provider.
A significant spike in testing rates for all five STIs was observed in 2015 (figure 1), then rates levelled off in 2016 to rates similar to previous years. The authors suspect that this is due to the 2015 release of updated STI guidelines, replacing Sexually Transmitted Diseases Treatment Guidelines, 2010.18 The release of updated guidelines likely influenced an increase in healthcare provider screening and testing behaviours in their at-risk or suspected patient populations before normalising to trends seen in other years.
Next, higher rates of STI testing were consistently seen in women, which can likely be attributed to the high rate of laboratory testing provided by OB/GYN specialists. Prior literature has not only shown higher rates of testing among women but also higher rates of STIs among black women, as they are estimated to be at an 8.7 times increased risk of contracting chlamydia as well as at a 20.5 times increased risk of contracting gonorrhoea as compared with white women.19 STIs also disproportionately affect the Hispanic population, as they experience double the risk of contracting chlamydia and gonorrhoea as the white population.19 While our results highlight that non-Hispanic black patients are receiving the highest rate of individual STI testing overall, followed by Hispanic patients, we expected to see even higher rates in these groups as compared with white patients considering their increased risk of STIs. The finding that the South region had the highest rates of STI testing are also likely reflected in the larger Black and Hispanic populations in the South and the disproportionally higher rates of STIs in this region. Finally, despite HPV molecular assay testing not typically encouraged for men, about 9% of HPV tests in this study were for men. The authors suspect that testing in this population is driven largely by professional guidelines and as cotesting for positive or suspected partners rather than societal factors.
In addition to higher STI testing rates, OB/GYN specialists provided the majority of STI prevention education. The provision of STI education was considerably lower among other providers; thus, there is room for improvement regarding providing this service in general, family and paediatric practices, as prevention education is a useful primary intervention to reduce the incidence of STIs. Rates of STI prevention education were slightly diversified among provider specialties but varied in comparison to actual STI testing rates, suggesting that (1) prevention education is not tied to patients receiving laboratory testing and (2) testing may be referred out by primary care providers instead of offering the services themselves.
Public health surveillance is critical for monitoring trends and patterns of disease, risk factors and potential agents for transmission in STIs. The STI National Strategic Plan was approved in 2019 through the Department of Health and Human Services. The goals of this plan include preventing new STIs, improving outcomes of those with STIs, accelerating research, technology and innovation, reducing disparities and inequities and coordinating overall efforts to positively alter the STI epidemics.20 Screening recommendations are currently in place by the CDC in regards to men, women, pregnant persons and other key populations (MSM, HIV+); however, these recommendations and the proposed national strategic plan to address STIs do not have set expectations for testing goals in the US population. Despite a lack of clear numerical goals for testing and education, current data show that there is large room for improvement in primary care settings, as shown by this study, and others stating that low screening rates are seen among sexually active young adults,21 22 even in key subpopulations with enhanced screening recommendations.22 While previous studies have shown that lack of insurance coverage is a barrier to receiving screening,23 public (eg, Medicare, Medicaid) and private health plans in the USA cover most STI testings and there are many public-supported clinics and programmes that make STI testing available to uninsured individuals. This healthcare safety net likely contributed to higher testing rates among patients underinsured or uninsured in our study. Barriers to testing and education have been previously documented, including lack of provider knowledge and testing options,24 25 patient anonymity24 and insufficient time for providers to spend with patients.25 26
The CDC recently released recommendations for providing quality STI clinical services, of which, the five STIs used in this study, along with syphilis, cervical cancer as an outcome of HPV infection, and trichomoniasis are listed as focus STIs in primary care settings27 These recommendations include a comprehensive layout for STI care in the primary care setting, including taking sexual histories, performing physical examinations, laboratory testing, prevention education and specialty referral services. If implemented, primary care and outpatient care settings could become leaders in sexual healthcare, reducing transmission of infections and administering care to those in need in a timely manner. Future research should investigate barriers to accessing STI resources in primary care, setting national goals for STI testing in primary care settings27 as well as identifying STI risk and responding with comprehensive STI education. Additional programmes, such as the implementation of opt-out STI laboratory testing should also be considered, as approximately 88% of patients in this study used some form of insurance in which STI laboratory testing would be partially or completely covered in their care plan.
This study has potential limitations. First, the cross-sectional design only captures information from a single patient visit; therefore, prior history or future laboratory testing or education is not available. STI prevention health education/counselling is part of the NAMCS standard data collection form completed by physicians. These data are primarily obtained from the health record and may be subjected to misclassification due to lack of documentation. Next, gonorrhoea and hepatitis laboratory testing were only available for survey years 2014–2016, and the hepatitis panel did not distinguish between types A, B and C. In addition, other potentially common STIs (eg, syphilis) and site of collection (eg, penis, vagina, rectum, pharynx) were not collected as part of NAMCS. Notably, the presence of patient symptoms consistent with the need for STI testing compared with STI screening without symptoms could not be distinguished with the available data nor were the specific testing platforms specified. This makes it difficult to draw conclusions as to whether fewer patients received STI testing and education compared with those who needed it. Comparative statistics were not applied and reported due to the large sample size that results in significantly overpowered comparisons (all p<0.0001). Prior research has shown that particular groups are at increased risk of STIs, specifically MSM, however, information regarding sexual orientation or specific sexual behaviours were not available for this study. Finally, the exclusion of federal clinics and certain specialties may affect the generalisability of these results.
Conclusions
In this nationally representative study, STI testing increased among patients seen in outpatient physician offices in the USA over the study period. STI testing and provision of prevention education varied by age, sex, geographic region, race/ethnicity and provider specialty. Future public health campaigns should promote STI testing and education in primary and outpatient care settings, particularly in underserved populations. Additionally, future research should further evaluate STI testing health disparities and the factors that influence testing rates and the provision of STI education (eg, access to care).
Data availability statement
Data are available in a public, open access repository. Data for this research is freely available through the Centres for Disease Control and Prevention repository for Ambulatory Health Care Data via the National Center for Health Statistics and was accessed and used within their terms and conditions. Information regarding the collection of this data has been cited in the text and it also available through the CDC repository.
Ethics statements
Ethics approval
This research did not involve human subjects or animal research and was conducted in accordance with the ethical requirements of the University of Texas at Austin and the University of Texas Health San Antonio.
References
Supplementary materials
Supplementary Data
This web only file has been produced by the BMJ Publishing Group from an electronic file supplied by the author(s) and has not been edited for content.
Footnotes
Contributors ARZ serves as first author and contributed overall study conception and design, majority written content, design of tables/figures and majority statistical analyses. KS contributed content for the literature review, citations, and design themes. MNV contributed content for the literature review, citations, and design themes. KRR serves as corresponding author and contributed final editing, table/figure design and review of statistical analyses.
Funding The authors have not declared a specific grant for this research from any funding agency in the public, commercial or not-for-profit sectors.
Competing interests None declared.
Provenance and peer review Not commissioned; externally peer reviewed.
Supplemental material This content has been supplied by the author(s). It has not been vetted by BMJ Publishing Group Limited (BMJ) and may not have been peer-reviewed. Any opinions or recommendations discussed are solely those of the author(s) and are not endorsed by BMJ. BMJ disclaims all liability and responsibility arising from any reliance placed on the content. Where the content includes any translated material, BMJ does not warrant the accuracy and reliability of the translations (including but not limited to local regulations, clinical guidelines, terminology, drug names and drug dosages), and is not responsible for any error and/or omissions arising from translation and adaptation or otherwise.