Article Text

Abstract
Objective To examine trends in number and seriousness of major injuries in the National Football League (NFL) over seasons 2010–2019 and the effect of rule changes to injuries to the leg, back, arm and head.
Methods We calculated, from publicly available weekly injury reports, the number of players that were injured and playing time missed, that is, the number of weeks on average that an injured player had to sit out, as a function of injury to a specific body part. Using classical time series analysis techniques, we fitted injury data with linear and non-linear functions.
Results The number of major injuries to the leg, back, arm and head has not declined over the last 10 years. During this time period, time missed because of injuries to the head has shown a significantly increasing trend. Rule changes designed specifically to protect arm or head have, respectively, succeeded in shortening the time that the injured player misses, but the impact lasts only over a single season.
Conclusions Overall, our data support the argument that new, well-intentioned rules adopted every season by the NFL have been proven to be too weak to make the NFL game safer. Broad-based management of brain and orthopaedic injuries and adoption of preventative measures to reduce the number of players injured and the seriousness of their injuries are required in the modern NFL.
- American football
- concussion
- contact sports
- injuries
This is an open access article distributed in accordance with the Creative Commons Attribution Non Commercial (CC BY-NC 4.0) license, which permits others to distribute, remix, adapt, build upon this work non-commercially, and license their derivative works on different terms, provided the original work is properly cited, appropriate credit is given, any changes made indicated, and the use is non-commercial. See: http://creativecommons.org/licenses/by-nc/4.0/.
Statistics from Altmetric.com
What are the findings
There has been no reduction in the number of orthopaedic or brain injuries in the National Football League (NFL) over the last 10 years.
Over the same time period, injuries to the head have led to increasingly more time spent being unable to play.
Targeted rule changes tailored to protect the arm and head from injury reduce time missed but the effects are not long-lasting.
Overall, NFL’s rule changes have not had a positive long-term impact on player safety.
How might it impact on clinical practice in the future?
The NFL season is associated with a significant risk of injury (5.7% of player weeks lost due to injury in 2018). Player safety has not improved over the last decade.
Risk factors for orthopaedic injury should be identified, extant modern technologies to measure and test impacts in the game must be used, and risk management strategies and clinically informed approaches developed and tested in order to reduce the risk of injury, particularly severe injuries.
Concussions or time missed because of concussion have not gone down in number . Medical staff, the NFL and team officials combined can institute preventative measures based on diagnosing changes in cognition occurring from multiple subconcussive hits in a game, and planning appropriate player management such as prophylactically resting the affected, but not yet clinically concussed, player if found to be at greater risk.
Introduction
American football has slipped in terms of its popularity as compared with nearly a decade ago1 and one reason could be the negative publicity football has received regarding injuries in general and concussions in particular.2 As a result, a bright spotlight has been placed in recent years on steps the National Football League (NFL)—the premier professional association of American football—has taken to enhance player safety.
The NFL tweaks its rules every year to enhance player safety but also to make the game more exciting, thereby increasing TV viewership and live audiences. Online supplementary material highlights some of the key safety related changes made each season over the last ten years. On the basis of these health and safety related rule changes, we would expect sharp declines in the number of players who suffered injuries over the years and, when injuries do occur, less serious or severe injuries now than in seasons past. In this context, it is imperative to analyse measures and develop new metrics that will examine the efficacy of these rules and/or changes in technology in terms of limiting player injuries and enhancing player safety.
Supplemental material
A number of studies have analysed the impact of various injuries on player performance, overall short-term and long-term health,3–6 the player’s postinjury level of performance7 8 and even the league’s bottom line.9 10 However, these aforementioned reports do not discuss the effectiveness of preventative measures such as rule changes on the number and extent of injuries (there has been a seminal study demonstrating that concussions are managed more conservatively now as compared with 15 years ago, but in collegiate football).11 The NFL has published a now-dated study that gives the total number of concussions and ACL and MCL injuries in years 2012–2015, but no details have been provided, such as how many players were injured, whether or not they had to sit out any games because of the injuries, and, if they were out of action, for how many weeks.12
Our study is among the first to address using up-to-date, publicly available data the following question: do rule changes reduce injury? In particular, we examined if rule changes instituted by the NFL over the past 10 years have succeeded in (1) reducing the number of players who suffered injuries and (2) affecting the number of games the injured player missed.
Materials and Methods
Data collection
We collected data on the number of major injuries in the NFL from the past 10 full NFL seasons: 2010–2019. Data from regular and postseason playoff games were combined. For a given season, we obtained the weekly injury report of each of the 32 NFL teams (see Ref. 13 for an example. There are 17 such injury reports for each NFL regular season, and 4 injury reports for the NFL playoffs) for all of our analyses. We did not include the preseason in the data because so doing would not cast an accurate picture. Teams use the preseason as a warm up to the regular season. NFL players, especially starters, do not play at all, play as much or play as hard in the preseason as in the regular or post season. Moreover, if the idea of a rise in conservative player management is correct, it would especially hold true for the preseason which would artificially deflate injury numbers, especially for later seasons.
Analysis and statistics
All analyses and statistics were performed on MATLAB (Mathworks). In all our analyses, we focused on injury to four critical parts of the body—leg, back, arm and head—in order to see if and how rule changes differentially impacted injuries to different body parts. Leg injuries included injuries to the knee, calf, ankle, hamstring, thigh and fibula; back injuries included injuries to the back, spine and skeleton; arm injuries included injuries to the shoulder, forearm and elbow and head injuries included injuries to the head and eye.
We studied the most serious injury grade—out, namely the injured player having to sit out the next game. First, we counted the number of players across the league who suffered an injury that caused them to miss at least one game of the regular season. Note that irrespective of how many weeks a given player remains out because of a given injury, he counts as one towards the first measure. This measure informs on how many individual players suffer a serious injury in a given NFL season. Second, we calculated the number of games the injured player had to miss, representing the time a player was sidelined. Note that the NFL does not use existing technology to measure the impact of hits; note also that teams in the NFL do not provide access to medical reports of any of their players and furthermore, medical injuries and illnesses are typically scaled and discretised by healthcare providers for convenience, that is, the severity of an injury is a continuous variable but is often discretised. Therefore, in this context, one interpretation of the number of games missed is as a proxy for severity of injury, although we will discuss alternative interpretations in the Discussion below.
For both measures, we fitted the time series data (2010–2019) with a straight line and determined its slope, then tested whether the slope was significantly different from zero using a two-tailed t-test. This set of analyses addresses long-term injury trends in the game. In supplementary analysis, we compared a linear model with a non-linear step function model, with the location of the step a free parameter, for a statistically better fit of the injury data (2010–2019; see online supplementary material).
In a complementary analysis, we looked at the rule changes to improve player safety that the NFL adopted prior to the beginning of every season, and marked each rule for whether it was designed to protect the leg, back, arm or head (see online supplementary material). For instance, the new rule (2013) that requires players to wear knee and thigh pads clearly protected the leg, whereas the rule (2013) that expanded the list of ‘defenseless players’ protected the player as a whole and therefore, the entire body. We could not judge the efficacy of each rule individually but rather counted the number of rule changes adopted each season to protect each different part of the body. Then, we subtracted from the number of injuries that occurred during a season, the number of injuries that occurred in the season immediately before, and used that as a measure of short-term change in the number of injuries (eg, ΔNumber of leg injuriesyear = Number of leg injuriesyear - Number of leg injuriesyear –1). Finally, we correlated the two variables– ΔNumber of injuriesyear and Number of rule changesyear– and checked the significance of the correlation (two-tailed t-test). We correlated the second measure –ΔNumber of games missed– with Number of rule changesyear as well.
In a related analysis of short-term impact of rule changes, we focused only on rules that were designed to protect a specific part of the body from injury. For instance, the NFL rule banning helmet on helmet contact targets head injuries. There were seasons in which rules were adopted that were designed to protect players from injury to specific part(s) of the body, and seasons in which no such rules were adopted (or rules were adopted that did not target specifically that particular body part). For example, rules were adopted prior to the start of the 2018 season to protect the head (see asterisk above 2018 season in figure 4A), whereas no rules were adopted to specifically protect the head prior to the start of the 2015 season (no asterisk above 2015 season in figure 4A; note that rules were passed in 2015 that protected all of the player). We calculated the difference between each season and its previous one the number of injured players and number of games missed on average (the same measure as described in the paragraph above) for each body part. We statistically compared (paired two-tailed t-test) these season-to-season differences between seasons before which body part specific rules were adopted and seasons in which they were not. Note that alpha was set at 0.05 prior to all our statistical analyses.
Finally, we checked if the two measures, namely number of players injured and the number of games the player missed on average owing to injury, were correlated across the last decade for injuries to the parts of the body investigated here.
Results
Figure 1A,B, respectively, shows the number of players whose leg injuries were severe enough that the injured player had to miss at least one regular season game, and the mean number of games the injured players missed for each of the last 10 NFL seasons (2010–2019). There was no noticeable trend—increase or decrease—in the number of players missing at least one game of the regular season owing to injury to the leg—the slope (m=2.879±4.852) of the linear fit did not significantly differ from zero (t(8)= 0.593, p=0.569). In terms of the number of games the injured player missed, the slope (m=0.091±0.066) of the linear fit was not significant as well (t(8)= 1.366, p=0.209).
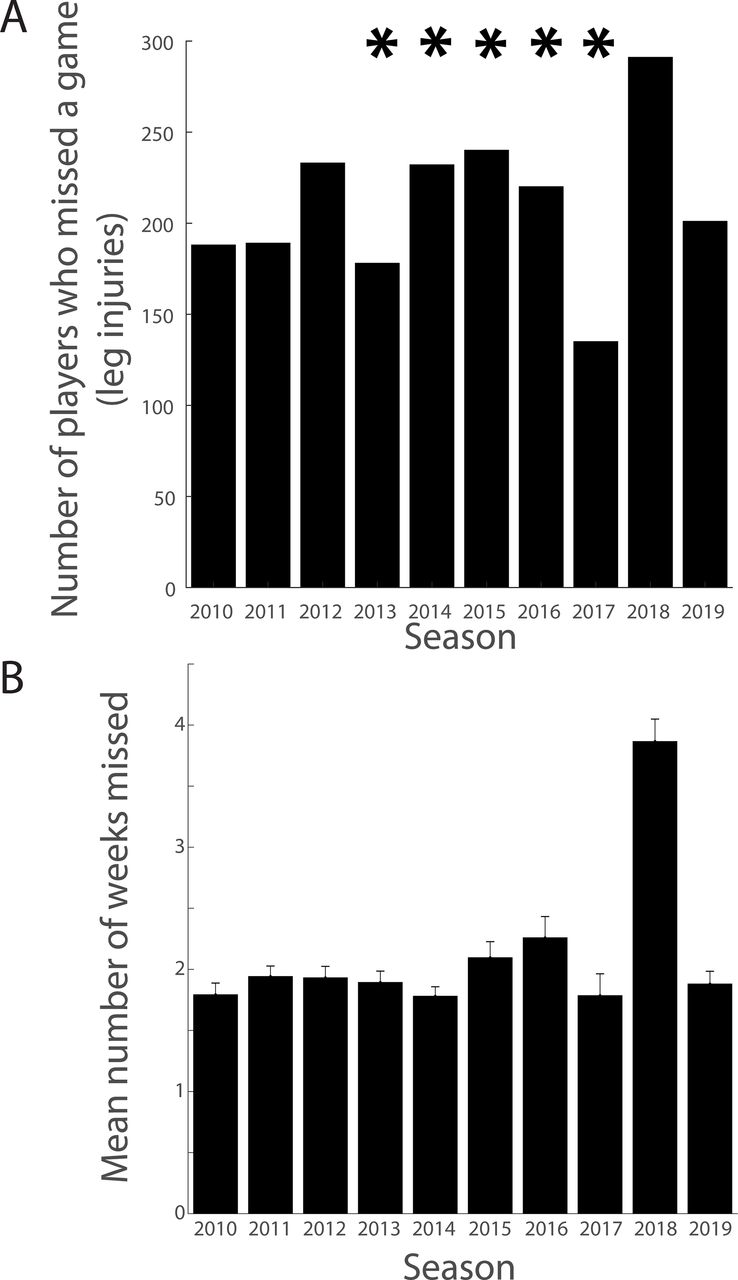
Number of most serious leg (ankle/knee) injuries and resultant games missed (years 2010–2019). (A) shows a bar graph of the total number of players who missed at least one game because of a leg injury (ordinate) as a function of NFL season (abscissa; 2010–2019). Asterisks indicate rule changes adopted before the corresponding season to specifically protect players from leg injuries. (B) shows a bar graph of the number of weeks of game time that the injured player missed on average (ordinate) as a function of NFL season (abscissa; 2010–2019). NFL, National Football League.
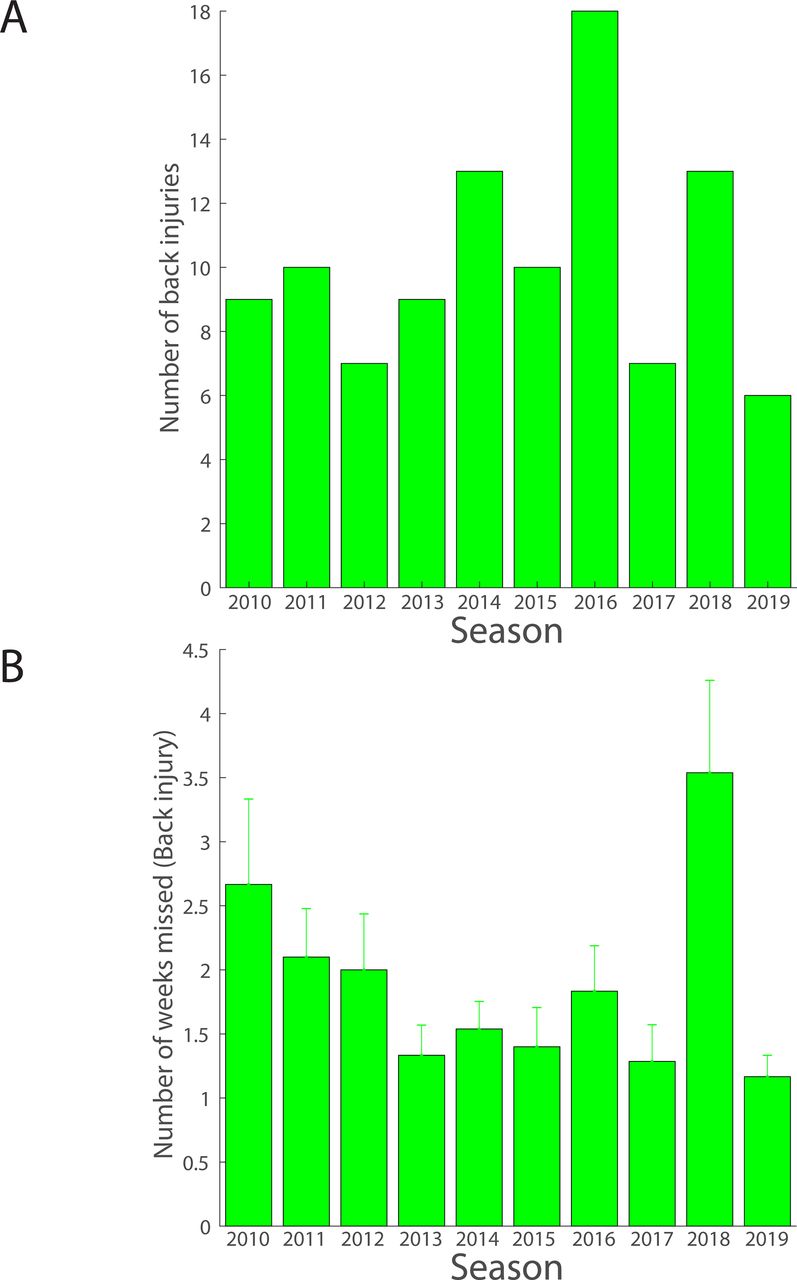
The number of players who missed game time owing to injuries to the back (spine) did not vary much (slope—m=0.109± 0.420) over the last decade, as confirmed by the lack of statistical significance of the trend (t(8) = 0.260, p=0.802; figure 2A). The linear trend in game time missed (figure 2B; m=−0.034± 0.086) because of injury to the back was not significant either (t(8) = –0.399, p=0.700).

Number of most serious back (spine/back/skeleton) injuries and resultant games missed (years 2010–2019). (A) shows a bar graph of the total number of players who missed at least one game because of injury to the back (ordinate) as a function of NFL season (abscissa). There are no asterisks, as there have not been any rule changes adopted in the last decade to specifically protect players from back injuries. (B) shows a bar graph of the number of weeks of game time that the injured player missed on average (ordinate) as a function of NFL season (abscissa; 2010–2019). NFL, National Football League.
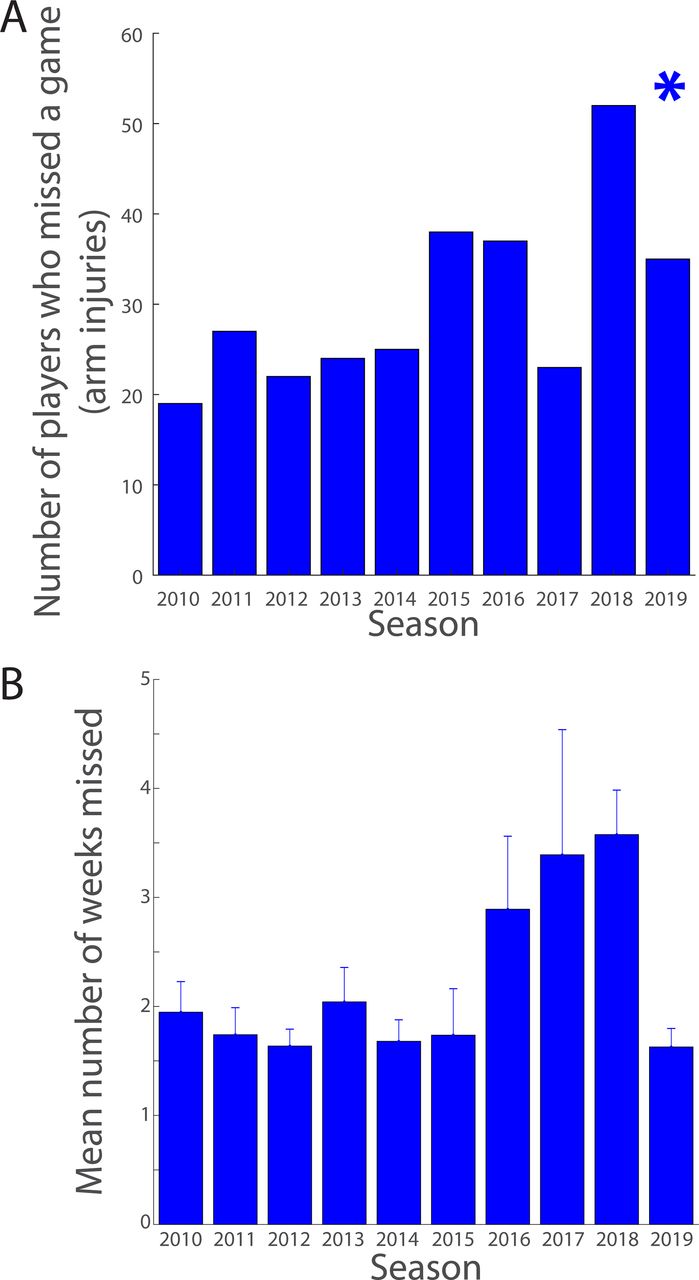
In contrast, the number of players missing at least one game of the regular season owing to injury to the arm showed a small but significantly increasing trend across the last 10 NFL seasons: the slope (m=2.279±0.868) of the linear fit to the data in figure 3A was significantly greater than zero (t(8)= 2.626, p=0.030, two-tailed). The slope (m=0.129±0.076) of the average number of weeks of game time missed over seasons 2010–2019 was not significantly different from zero, however (t(8) = 1.699, p=0.128).

Number of most serious arm (shoulder/arm) injuries and resultant games missed (years 2010–2019). (A) shows a bar graph of the total number of players who missed at least one game because of an arm injury (ordinate) as a function of NFL season (abscissa). Asterisks indicate rule changes adopted before the corresponding season to specifically protect players from injuries to the arm. (B) shows a bar graph of the number of weeks of game time that the injured player missed on average (ordinate) as a function of NFL season (abscissa; 2010–2019). NFL, National Football League.
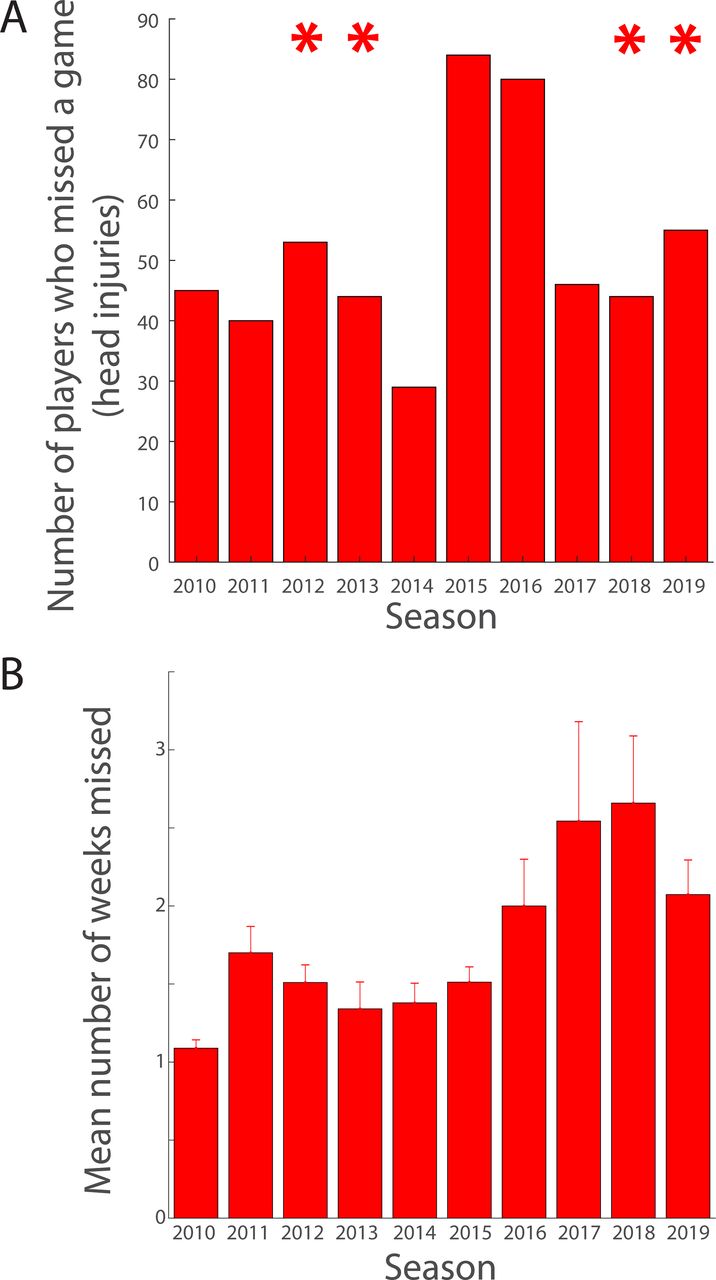
The number of players who missed game time owing to head injuries showed no appreciable trend in either direction (slope—m=1.491± 1.954) over the last 10 NFL seasons (t(8) = 0.763, p=0.467; figure 4A). On the other hand, there was a strong linearly increasing trend in game time missed because of head injury (figure 4B): the slope was positive (m=0.138±0.037) and significant (t(8) = 3.779, p=0.0055; two-tailed).

Number of most serious head injuries and resultant games missed (years 2010–2019). (A) shows a bar graph of the total number of players who missed at least one game because of a head injury (ordinate) as a function of NFL season (abscissa). Asterisks indicate rule changes adopted before the corresponding season to specifically protect players from injuries to the head. (B) shows a bar graph of the number of weeks of game time that the injured player missed on average (ordinate) as a function of NFL season (abscissa; 2010–2019). NFL, National Football League.
In a companion analysis, we compared two models—a linear model versus a non-linear family of step functions—over the data to see if the data were better fitted by a line, which is reflective of a gradual trend over the last decade, or by a sharp, abrupt change, reflective of some underlying change in the rules or improvement in protective gear or in the game itself. In brief, the non-linear step function was not a substantially better fit of data on the number of players who suffered leg, back, arm or head injuries (see online supplementary figures 5A-8A and online supplementary material for details). The step function was not a significantly better fit of games missed due to injuries to the leg (see online supplementary figure 5B and online supplementary material for details) and back (online supplementary figure 6B) and trended towards significance for injuries to the arm (p=0.086; online supplementary figure 7B) and head (p=0.071; online supplementary figure 8B).
Next, we explored if new rules that the NFL enacts every season have a short-term impact on player safety. The NFL tweaks several rules annually prior to the start of the new NFL season later that year in order to make the game safer and more exciting. Online supplementary material highlights the key rule changes that the NFL has adopted each year to make the game safer for the players as well as part of body—leg, back, arm, head or some combination thereof (conveniently highlighted in red text)—that was putatively impacted by each such rule change. Arrowheads at the top of online supplementary figures 1-4 show the number of rules that were adopted prior to each NFL season, with each rule represented by a single arrowhead. For example, right before the 2013 season, three rules (indicated by three arrowheads) were changed, which putatively protected from injuries to the head. We analysed whether the adoption of new rules prior to a given season was correlated with change in the number of injuries and/or change in the number of weeks the player had to miss game time because of injury in the given season as compared with the season prior. The number of rules adopted to protect players from injuries to the leg (indicated by counting the number of arrowheads for a given NFL season in online supplementary figure 1A) and change in the number of players who suffered a major leg injury (that caused them to miss at least 1 week of the regular season) were not significantly negatively correlated (r=−0.413, p=0.269; online supplementary figure 9A). Corresponding correlations for back (r=−0.272, p=0.479; online supplementary figure 10A), arm (r=−0.100, p=0.798; online supplementary figure 11A) and head (r=−0.319, p=0.402; online supplementary figure 12A) injuries were not statistically distinguishable from chance either. We conducted a similar set of analyses for the relationship between number of rules changes made and year-to-year change in the number of games the injured player had to miss—to the leg (r=0.099, p=0.799; online supplementary figure 9B), back (r=0.052, p=0.894; online supplementary figure 10B), arm (r=0.081, p=0.837; online supplementary figure 11B) and head (r=−0.157, p=0.687; online supplementary figure 12B); none of the correlations was statistically significant.
Rules that are meant to enhance player safety overall may be too general, and their impact too diffuse to be able to pinpoint any tangible benefit to player safety. A complementary way of investigating the short-term impact of changes in NFL rules is to focus on rules targeted to protect specific parts of the body. For example, a rule that prohibits helmet-on-helmet contact protects players from concussions. Such specific, targeted rule changes are provided by asterisks at the top of figures 1–4, for example, an asterisk at the top of figure 4 (head injuries) above the 2018 season indicates that a rule change(s) was adopted prior to the 2018 season that was tailored specifically to protect players from concussion. We conducted an analysis of the relationship between specific rule changes adopted to protect specific body parts and change in the two measures investigated here. The results were negative in regards to change in number of injured players: seasons in which new rules were adopted to protect specifically the leg (t(7) = 0.901, p=0.398), arms (t(7) = 1.5434, p=0.167) or head (t(7) = −0.220, p=0.832) did not yield statistically fewer injuries as compared with seasons in which no new rules were adopted to target specifically said body parts (we did not identify any rules adopted to protect specifically the back; therefore, a similar analysis on injuries to the back was not possible). The results were somewhat different for the second measure. Whereas seasons in which rules were adopted to protect specifically the leg (t(7) = 0.118, p=0.910) were not statistically related to change in the number of games the injured player had to miss, seasons that saw the adoption of rules to protect specifically the arms (t(7) = 4.194, p=0.004) and head (t(7) = 3.125, p=0.017) did show a significant decrease in the number of games the injured player had to miss in a particular season as compared with the previous season; the result also shows that seasons where no targeted rules were adopted saw corresponding increase in the number of games that players with injuries to the arm and head missed.
Finally, we address if the two measures provide similar or different information. The measures we have adopted—the number of players who missed game time because of injury and the number of weeks of game time missed—were intended to provide two related but nonetheless different perspectives into injuries and their effect or injury management. One way of understanding how related the two measures are is to calculate their correlation for each major body part investigated. The analysis revealed a statistically significant correlation between the two measures in regard to injuries to the leg (r=0.729; 95% CI (0.184 to 0.931), p=0.017); however, the correlations between the two measures in regards to injuries to the back (r=0.315; 95% CI (−0.392 to 0.788), p=0.375), arm (r=0.466; 95% CI (−0.231 to 0.847), p=0.174) and head (r=0.062; 95% CI (−0.590 to 0.864), p=0.854) were not significant.
Discussion
Our research probed whether the NFL’s efforts through rule changes to reduce player injuries has had a positive impact on player safety. The NFL tweaks its rules every year; instead, we looked at general trends over a longer period of time—the last decade (2010–2019) of NFL football. We focused on injury to four major categories of body parts—leg, back, arm and head—through seasons 2010–2019. Our investigations revealed no overall trends in the number of injuries over the last decade. In other words, rule changes (or, for that matter, improvements in protective gear) do not appear to have reduced the number of players suffering injuries (that caused them to miss at least a game of the season/postseason) over the last decade (in fact, there was a linearly increasing trend over the last decade in number of players that suffered injury to the arm). In terms of the amount of game time the injured player had to miss, our investigations revealed an interesting dichotomy: no overall statistical trend in the number of games the player who suffered injury to the leg, back or arm over the last decade but a significant positive trend for players who suffered injury to the head, suggesting that players that suffer head injuries stay out of games longer today than before. A complementary study of the short-term impacts (in a season as compared with the one previous) of new rules designed to protect specific body parts revealed that rules designed to specifically protect players' arms and head were successful in reducing the amount of game time the injured player had to miss, but had little short-term impact on numbers of injured players for any of the body parts examined here.
Evolution of player safety in the NFL (2010–2019)
Lack of a decreasing trend in the number of players with injuries to the leg, back, arm or head indicates that the NFL’s annual ritual of rule changes has had negligible long-term impact on player safety. Alternatively, one could argue that had the NFL not adopted new rules, the numbers would have gotten worse as the league has gradually been becoming more physical over the years. We have no way of determining which of the two possibilities is correct; regardless, playing in the NFL has not become safer over the last decade.
Time lost due to injury—interpretation
Counting the number of injuries in a given season is important in understanding how effective new NFL rules have been in affecting player safety. In this regard, a measure of how serious each injury is on average is complementary information. There is not a standard measure of the seriousness of injury, however. The league does not provide medical records to the public for justifiable reasons, and even if they were to have been provided, there is no universal medical consensus on injury severity anyway. Here, we calculate the number of games the injured player misses and argue that it can provide a useful, if limited, measure of player safety for the simple reason that more serious injuries take more time to recover from.
However, one might argue that more time removed from the sport may be attributable to more conservative injury management. It can be argued that the decade long trend in the NFL of an increase in time missed following injuries to the head is an example of conservative management of concussions. Of course, there are individual differences, for example, interprovider discrepancies in how aggressively or conservatively a concussion is treated; time off is a selection determined by the player reporting the concussive symptoms and his physician choosing jointly to adjust the return-to-play protocol. Nevertheless, the recent explosion of awareness about concussions in the NFL and long-term impact on player health implies that the overall increase in time missed from head injuries over the last decade of the NFL is perhaps the result of the player, his physician and their team exercising increasingly more caution before the player returns to play. Similar long-term increasing trends in time missed were not observed for injuries to other body parts; given that injuries to the head have gotten a lot more press and publicity in recent years than injuries to the arm, leg or back, the increasing trend in time missed observed for head injuries alone also indirectly supports the assertion of more conservative concussion management today.
On the other hand, there are both data and arguments in favour of the simple Occam’s Razor interpretation, namely that the more time lost playing, more serious is the injury—or at least, that the seriousness of injury must be a contributing factor to time lost. A study of season-to-season changes in average time missed because of injury revealed that seasons that saw rules specifically tailored to protect the head exhibited a significant reduction in time missed for players suffering injuries to the head as compared with seasons that did not see such rule changes. The effect was significant. The finding suggests that reducing time missed due to injury is an effective outcome of rules meant to enhance player safety. Reducing time missed from injury also makes sense from an economic perspective, on the part of both player and his team, and is in line with a ‘warrior’ mentality common among NFL players.14–16 In the end, the decade-long trend of increase in missed games from head injury may well be because of both more serious head injuries and more conservative management of them.
More physical game, more offensive game and consequences
The present study found a similar outcome for injuries to the arm—seasons that saw rules specifically tailored to protect players’ arms exhibited a significant reduction in time missed for players suffering injuries to the arm as compared with seasons that did not see such rule changes. We are not aware of any literature arguing for more conservative management of arm injury; here, the measure of time lost is probably indicative of seriousness of arm injury.
The results are in keeping with the way the NFL game has evolved. NFL players today are faster, bigger and stronger than before17 18 (compare graphs of NFL player body size over the years).18 The end-result of a bigger and faster player is increased momentum (product of mass and speed—both are greater today) when a player makes contact with another player or with the ground, which means increased likelihood of more serious injury.
The NFL game is also more exciting than before. The NFL game has evolved in recent years from a defensive, running game to a more exciting, offense-dominant, passing oriented game, which means more plays per game (compare, eg, Refs. 19 and 20 showing significantly more plays in 2016 vs 2009, p<0.001), more players involved per play (due to more movement at the line of scrimmage as well as downfield) and more acrobatic plays. Put together, evolutions of player and game ought to have had a negative impact on player safety (see also Ref. 21 demonstrating increasing time lost in rugby over the years). Seen in this light, the fact that no long-term increasing trend in the number of players with leg, back or head injuries or in time lost owing to leg, back or arm injury was found could lead the NFL to claim that it has managed to protect its players at the same time that the game has become more exciting and physical. On the other hand, the fact that injuries are not decreasing is not encouraging news.
New standards for player safety
It is important that there be a clear consensus among interested parties on quantification of player safety. This has not always been the case thus far. Case in point is the NFL's thinking on concussions: The NFL’s own assessment is that their concussion protocols are working based on data that they began sharing with the public since 2012.12 According to the NFL, a lower number of diagnosed concussions is a sign of progress, but so is a higher number, because the NFL claims that a higher number points to a sign of ‘culture change’, a point that was made in 201622 and again, back in 2010 when the number of concussions first showed an uptick compared with the year before.23 24 Flexible interpretations of a single measure muddy its importance and end up making a case for alternative measures of player safety.
Indeed, a single measure of anything runs into the singular problem of Goodhart’s law,25–27 that is, the premise that if a measure (number of injuries in the present day NFL) is picked as an indicator of some desirable outcome (player safety), it inexorably ceases to function as that indicator because, over time, interested parties (NFL, teams, players) learn to game it. Having two or more measures renders it harder to game both at the same time.
These measures should not be correlated with each other in order for them to be able to provide different perspectives. The two measures used here correlated for injury to the leg (which indicates that number of players with leg injuries and game time the player missed because of leg injury changed in lockstep over the last decade), but did not for injury to the back, arm or head, suggesting that number of injured players and games missed on average provide at least somewhat different perspectives on player safety. In addition, the ease of its availability to the public and ability to be a common measure irrespective of body part makes games missed a simple, viable, if imperfect, candidate to be a second measure of player safety.
Limitations
Our measures are probably underestimates of injury. Injuries that occur in the last game of the season or playoffs for a team do not lead to any missed games for the player, because injuries in the offseason are never monitored. Moreover, teams may under-report injuries or, for strategic advantages, over-report injuries, so that other teams may not prepare for the ‘injured’ player’s skill set. The latter is unlikely, because a team would not leave out a player of a game for financial and other reasons; alternatively, for a team to report that a player is out on the status report and then play him would lead to a major loss of the team's credibility around the league and lead to league sanction. Access to medical data for all injuries would have led to a strong measure of the seriousness of injury. We do not expect to be gaining access to such data any time soon. All in all, the above limitations, while real, do not exhibit a bias for some seasons over others, which goes to bolster trust in the present findings.
Conclusion
We studied the evolution of player safety over the last 10 seasons and found a discouraging trend in that an incontrovertible long-term improvement in player safety was not found. Despite the NFL’s efforts over the years to enhance player safety, the modern game has not become safer—a sobering conclusion for the economic health of the NFL. The NFL must adopt, in tandem with independent clinicians, state-of-the-art risk management strategies for preventing and treating injury.
Acknowledgments
SBS acknowledges Ms Hill from Carnegie Vanguard High School for her encouragement and insightful critiques of the work.
Footnotes
SBS and DA are joint first authors.
Contributors SBS: study concept, study planning, data collection, data interpretation, manuscript (first draft), manuscript editing. DA: data collection, data interpretation, manuscript editing. SSS: study planning, data analysis, data interpretation, manuscript (first draft) manuscript editing. BRS: responsible for the overall content as guarantor, data analysis including statistical analysis, data interpretation, manuscript editing.
Funding The authors have not declared a specific grant for this research from any funding agency in the public, commercial or not-for-profit sectors.
Competing interests None declared.
Patient and public involvement Patients and/or the public were not involved in the design, or conduct, or reporting, or dissemination plans of this research.
Patient consent for publication Not required.
Ethics approval Data used for the study are in the public domain. All authors have been certified by the IRBs of UH and/or BCM.
Provenance and peer review Not commissioned; externally peer reviewed.
Data availability statement Data are available in a public, open access repository. All data used for our analysis are available from publicly available websites, which have been cited in the article.