Article Text

Abstract
Objective The incidence of colorectal cancer (CRC) in people aged <50 years has been increasing dramatically in the past three decades and such patients are known to face difficulties in diagnosis. The objective of this study was to better understand the diagnostic experiences of patients with CRC and explore age-related differences in the proportion with positive experiences.
Method A secondary analysis of the English National Cancer Patient Experience Survey (CPES) 2017 was conducted on the responses of patients with CRC, restricted to those likely to have been diagnosed in the preceding 12 months via pathways other than routine screening. Ten diagnosis-related experience questions were identified, with responses to them categorised as positive, negative or uninformative. Age group-related difference in positive experiences were described and ORs estimated, both raw and adjusted for selected characteristics. Sensitivity analysis was performed by weighting survey responses to 2017 cancer registrations by strata defined by age group, sex and cancer site, to assess whether differential response patterns by these characteristics affected the estimated proportion of positive experiences.
Results The reported experiences of 3889 patients with CRC were analysed. There was a significant linear trend (p<0.0001) for 9 of 10 experience items, with older patients consistently displaying higher rates of positive experiences and patients aged 55–64 showing rates of positive experience intermediate between younger and older age groups. This was unaffected by differences in patient characteristics or CPES response rates.
Conclusion The highest rates of positive diagnosis-related experiences were reported by patients aged 65–74 or 75 years and older, and this is robust.
- COLORECTAL CANCER
- HEALTH SERVICE RESEARCH
- COLORECTAL CANCER SCREENING
Data availability statement
Data are publicly available from the following citation:NHS. Quality health. national cancer experience survey. UK Data Service; 2017. Available: https://beta.ukdataservice.ac.uk/datacatalogue/studies/studyid8573
This is an open access article distributed in accordance with the Creative Commons Attribution Non Commercial (CC BY-NC 4.0) license, which permits others to distribute, remix, adapt, build upon this work non-commercially, and license their derivative works on different terms, provided the original work is properly cited, appropriate credit is given, any changes made indicated, and the use is non-commercial. See: http://creativecommons.org/licenses/by-nc/4.0/.
Statistics from Altmetric.com
WHAT IS ALREADY KNOWN ON THIS TOPIC
Colorectal cancer (CRC) incidence rates among people aged <50 years are increasing, in contrast to older age groups, and this group is known to have a more difficult diagnostic path than younger cohorts. There is lack of research specifically comparing diagnosis-related care experiences of different age groups of patients with CRC.
WHAT THIS STUDY ADDS
Cancer patient experience data confirm that 10%–15% more of older than younger patients have a positive diagnostic experience. This was robust after adjusting for sex, broad ethnic group, socioeconomic deprivation quintile and cancer site, and after adjusting for the possibility of differential response rates by age, sex and cancer site. A supplementary assessment, using separate 2013 data, suggests that controlling for confounding and response bias by cancer stage slightly reduces but does not eliminate the observed age-gradient.
HOW THIS STUDY MIGHT AFFECT RESEARCH, PRACTICE OR POLICY
Anonymised data that is routinely publicly available can be used to advance health policy and practice. Lower rates of positive care experience among younger patients with CRC is a pervasive issue suggesting a need for targeted intervention by healthcare systems. Additional contemporary evidence controlling for possible confounding by cancer stage will be valuable.
Introduction
Colorectal cancer (CRC) accounts for approximately 10% of all new cancer cases diagnosed globally in 2020, and 9.4% of all cancer deaths.1 Between 2016 and 2018, it was the fourth most common cancer and the second deadliest cancer in the UK, with about 42 900 annual incident cases and 17 000 annual deaths in 2017–2019.2 More than half (54%) of CRC cases in the UK are estimated to be preventable.2
In England, between 1990 and 2014, the incidence of early onset CRC (EoCRC; defined as onset <50 years of age) increased fourfold for people aged 20–29 (from 0.7 to 2.8/100 000), more than doubled for those aged 30–39 (from 3.1 to 7.6/100 000) and increased by 12% for those aged 40–49; by contrast, the incidence of CRC for older groups decreased or was unchanged.3 A study examining the most recent decade of available data in Canada (2012), Australia (2015) and New Zealand and the USA (both 2016) found that EoCRC incidence increased by between 2.2 and 4.0% per annum, depending on the country, while incidence in people aged 50 and over decreased by 1.2%–2.4% per annum.4 This largely reflects the impact of screening programmes and changed risk factors in these older age groups.5 As a consequence, younger patients have become a larger proportion of all patients with CRC. Estimates in the USA, for example, suggest that by 2030, patients younger than the screening age will account for 11% of all colon and 23% of all rectal cancers, more than double their contributions in 2010.6
In addition to its rising incidence, EoCRC has been found to exhibit differing clinical features to later age groups (>50 years), with higher rates of pathogenic germline variants. Presenting symptoms are often associated with benign conditions and providers are less likely to test for cancer in younger patients.7 8 EoCRC has been associated with advanced staging, which may potentially be attributed to belated patient presentation or delayed provider diagnosis.7
There is a gap in understanding of how these younger patients experience diagnostic care in comparison with the older CRC cohort. Patient experiences have become increasingly recognised as an important domain of cancer care quality, distinct from clinical effectiveness and patient safety.9 To gain insight into patient experiences and monitor quality of cancer care over time, the English National Cancer Patient Experience Survey (CPES) has been conducted each year since 2010,10 compiling experiences of patients’ journeys through cancer care, from diagnosis to treatment and follow-up. The 2010 CPES data for patients with CRC have been analysed to assess the impact of route to diagnosis on negative assessments of key aspects of care; adjusted for demographic characteristics, patients identified through screening routinely had the lowest rates of poor experience.11 Younger patients with CRC cannot access the population screening route, so this alone can be expected to result in higher rates of negative experiences for them.
The objective of our study was to better explore the age-related pattern of positive diagnostic experiences of patients with CRC. We used CPES 2017 individual-patient data for newly diagnosed patients with CRC to investigate age-related differences in their experience of diagnosis, controlling for selected patient and cancer characteristics. While 2018 CPES data were available, a goal of the study was to undertake a sensitivity analysis comparing raw CPES responses to responses weighted to reflect the age, sex and cancer site distribution found in cancer registry data, to control for possible CPES response bias by these characteristics. Registry data were only available for 2017, hence analysis was restricted to CPES 2017 data.
Methods
Data source
The CPES 2017 was commissioned by the National Health Service England (NHS) to sample patients with cancer aged 16 years and above who were discharged following an inpatient episode or had an outpatient visit for cancer treatment during April, May and June 2017. The survey measures patient experience with different aspects of care including initial diagnosis, support, treatment and follow-up.12 Patient characteristics recorded as part of the survey are de-identified prior to being made publicly available. Anonymised CPES responses are publicly available,12 and include: age group (16–24, 25–34, 35–44, 45–54, 55–64, 65–74, 75–84 and 85+), gender, tumour site (ICD-10-CM), ethnic group (British mixed ethnicity, white British and ‘not specified’) and Index of Multiple Deprivation quintile rank. The overall response rate for all cancers was 63% (69 072 out of 110 449 eligible).10
Selection of study population
The study population was restricted to patients with colon and rectal cancer (International Classification of Diseases-10, codes C18-C20). To ensure recency of respondent recollection of their primary diagnostic experiences and to permit weighting to cancer registry data for 2017, the following respondents were excluded: respondents who had been sampled for a previous survey (2015 or 2016); those who had first been treated for cancer over 12 months previously (Question 60—‘Q60’), and those who had not had a diagnostic test for cancer in the 12 months prior to survey (Q4, a yes/no question). As screening was only routinely available for people aged 60–74 years in 2017, all patients identified through screening (Q1) were eliminated, making the experiences of different age groups amenable to comparison. Finally, respondents were excluded if they had missing data for any of the patient characteristics adjusted for in multivariable analyses, to ensure comparability of the raw and adjusted ORs.
Diagnosis-related experiences
The first 11 question of CPES 2017 are diagnosis-related.12 Of these, Q4 was used to determine the study population, leaving 10 questions for consideration. The responses to each question were categorised as positive (eg, ‘yes, completely’), negative (eg, ‘yes, to some extent’; ‘no’) or uninformative (eg, ‘don’t know/can’t remember’) experiences (see table 1), in accordance with standard NHS scoring,12 where available. Question 3 (‘how long was it from the time you first thought something might be wrong with you until you first saw a general practitioner (GP) or other doctor?’) was the only question without NHS scoring; by consensus, the authors assigned ‘3–6 months’, ‘6–9 months’ and ‘more than 12 months’ as negative, with only ‘less than 3 months’ classified as positive; this is arbitrary, but in line with NHS classification of ‘positive’ experiences as being completely positive.
Positive response categorisation in CPES diagnosis-related questions
Analysis
For analysis, CPES defined age groups (16–24, 25–34, 35–44, 45–54, 55–64, 65–74, 75–84, 85+) were regrouped into four age categories (<55 years, 55–64 years, 65–74 years and 75+ years) because of small numbers in the younger and older age groups. The age distribution of available characteristics included in the CPES (sex, ethnic group, deprivation quintile and cancer site) was described.
For each question, only positive and negative experiences were included in analysis. Differences between the age groups in the percentage of positive responses were tested for statistically significant differences using the χ2 test; the linearity of the age-effect was assessed using the Mantel-Haenszel χ2 test for trend.13
Raw ORs (ORr) were estimated to compare the rate of positive experience of older age groups to the <55 years referent age group. Adjusted ORs (ORa) were calculated to simultaneously control for potential confounding by sex, ethnic group, deprivation quintile and cancer site. Adjusted and Raw ORs were compared by estimating the relative percentage change in OR (100*([ORr / ORa]−1)). A negative relative change would indicate that risk adjustment makes the age groups more similar, while a positive change indicates that risk adjustment made the groups more different.
A sensitivity analysis was undertaken to control for potential under-response by age group, sex and site (colon vs rectal). This was achieved by weighting CPES responses of patients with CRC to the total numbers of incident cases by age group, sex and site as recorded in the cancer registry for 2017. Deidentified registry data for 34 825 individuals diagnosed with CRC in 2017 were retrieved from publicly available records.14 Age (4 groups), sex (2 groups) and cancer site (2 groups) were coded in the same way as indicated above for CPES data, leading to 16 (4×2×2) subgroupings. For each of the 16 subgroupings, a weight was calculated by dividing the total number of registry-recorded individuals by the number CPES respondents. As screening status was only reported in the CPES 2017 and not the publicly available registry data, these weights were calculated before removal of screened individuals from the CPES. The 16 weights were linked back to the full CPES database and screen-detected patients were removed to give the study population; the total number of registry patients diagnoses by methods other than screening was estimated using weighted frequency tabulations of the study population. To avoid artificially inflating sample sizes, rates were restandardised by multiplying them by a fraction calculated as the CPES study population divided by the weighted CPES study population, resulting in weights ranging from 0.65 to 1.65. Application of these standardised weights reduces the influence of subgroups with higher-than-average response rates and increases the influence of subgroups with lower-than-average response rates. The proportion positive for each question was then recalculated using the standardised weights. For each question, the unweighted percentage positive was subtracted from the weighted percentage positive to assess whether the estimated percentage positive was influenced by differential response rates to the CPES. No statistical tests were performed.
Supplementary (post hoc) analyses were undertaken to clarify the potential role of cancer stage, which is publicly available in the CPES data for 2013 (‘wave 4’)15 at individual patient level. Of the 10 questions examined in the 2017 analysis, analysis was confined to the eight that were identical in 2013: Q01-Q03 (same numbers in both years); and Q07-Q11 (questions 9 and 11–14 in 2013, respectively). As with the 2017 data, CPES responses were restricted to those with colon or rectal cancer, with the falling groups excluded those who had first been treated for cancer over 12 months previously (Q76 in 2013)), those who had not had a diagnostic test for cancer in the 12 months prior to survey (Q5 in 2013) and those with missing data for characteristics adjusted for in multivariable analysis; in 2013, there were no questions identifying people who had been surveyed in previous years, so these could not be excluded. The 2017 analyses comparing raw and adjusted ORs by age group were repeated in 2013 (ie, controlling for sex, ethnic group, deprivation quintile and cancer site as done for 2017) and separately controlling for stage (classified as I, II, III, IV and missing, with stage I as referent). The sensitivity analysis looking for the impact of differential response bias on proportion positive weighted by age group, sex and cancer site (16 wt groups) was also repeated and contrasted with the impact on proportion positive after also controlling for stage (80 wt groups), using publicly available CRC registry data for 2013 (34 359 registrants)14; standardised weight. Screening status was not recorded for all registrants in 2013, so weights were calculated with the same procedure as in 2017.
All analyses were conducted using SAS V.9.4. A two-sided significance level of 0.05 was used for all statistical tests. No adjustment was made for multiple comparisons.
Results
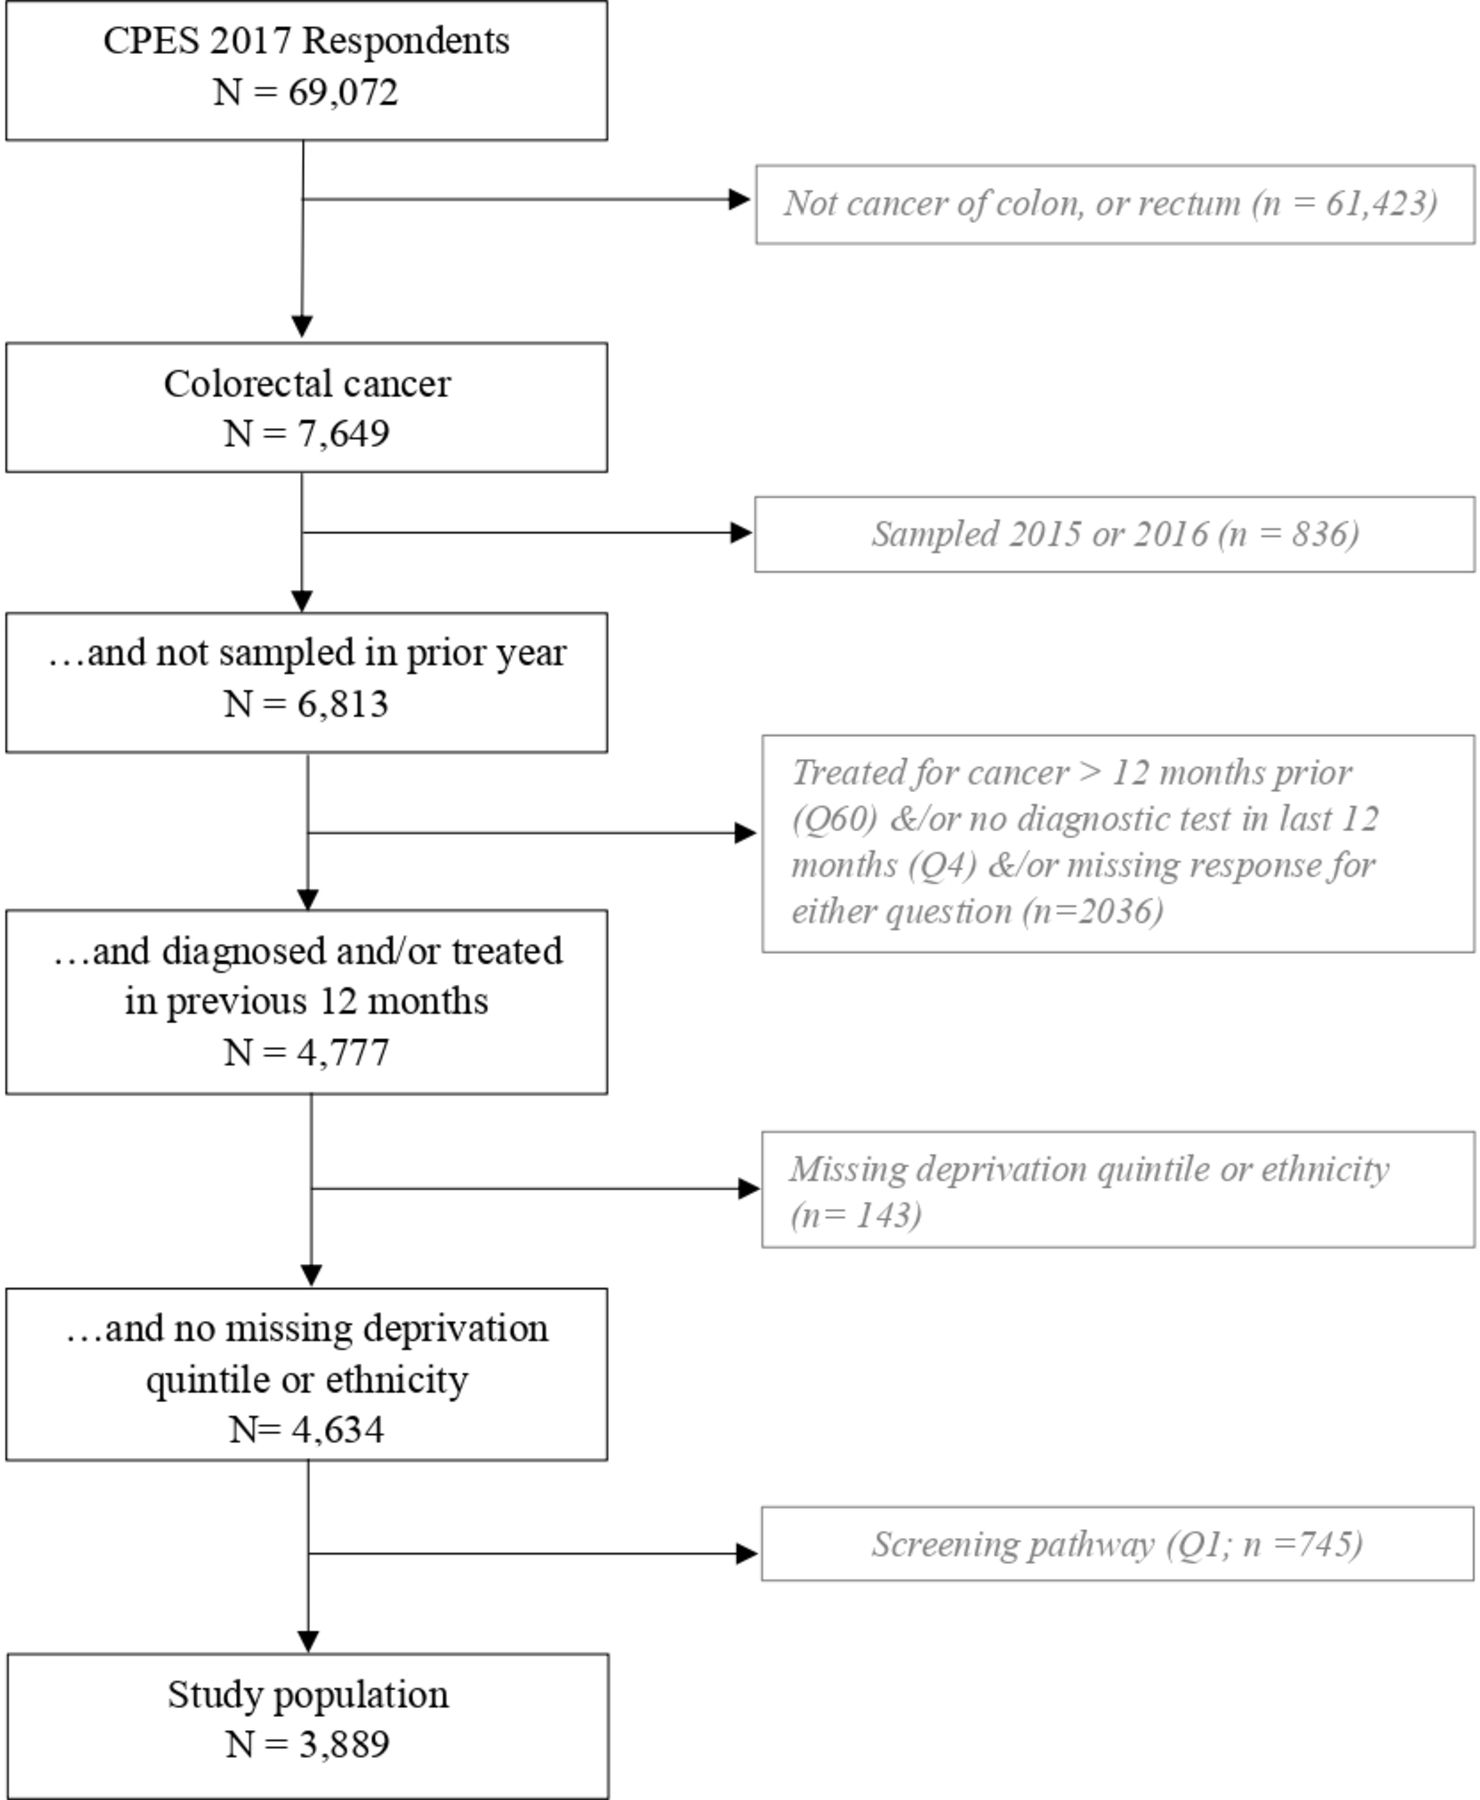
Of 69 072 survey respondents in 2017, 7649 had a diagnosis of CRC. As shown in figure 1, the final study population comprised 3889 patients with CRC who had not been sampled for a prior survey (2015–2016), who had not been treated more than 12 months previously, who had a diagnostic test in the 12 months prior to survey and who had not been diagnosed through screening, and who had complete data on all demographic characteristics.

Selection of the study population.
Table 2 shows selected characteristics of the respondents selected for study. The proportion of females is highest for the <55 years age group (54.6%), and lower in the other age groups (40.2%–44.3%). The proportion of ‘other ethnicities’ appeared to be higher in the <55 years age group (13.2%), falling with older age from 7.9% for 55–64 years age group to 4.6% for those aged 75 years and older. The youngest and oldest age groups appear to have a higher proportion in the more and most deprived categories. The proportion with colon cancer appears to be higher in the two older age groups, particularly in those aged 75 years or older (65.4%).
Distribution of respondent characteristics (N=3889)
Figure 2 shows, for each of the ten diagnosis-related questions, the proportion of included respondents with positive experiences in each age group. Question 5, ‘Beforehand, did you have all the information you needed for your test?’, had a very high percentage of positive experiences in all age groups (94.6%–96.1%) and no significant differences between age groups. For each of the other nine questions the overall difference between age groups was highly significant (all p<0.0001) as was the test of linear trend (all p<0.0001). For eight of these nine questions, those aged <55 years consistently displayed the lowest rates of positive experiences, ranging from 60.7% to 81.4%; those aged 55–64 years had a slightly lower proportion visiting a GP or other doctor within 3 months (68.7%), similar to those aged under 55 years (70.4%). The highest rates of positive experiences were usually found in the 75+years age group, with a couple of exceptions where they were found among those aged 65–74 years. The number of missing or ‘uninformative’ responses per question (ie, neither positive nor negative) ranged from 22 for the question about understanding what was wrong (Q10; 0.6%) to 660 for number of GP visits (Q1; 17.0%).
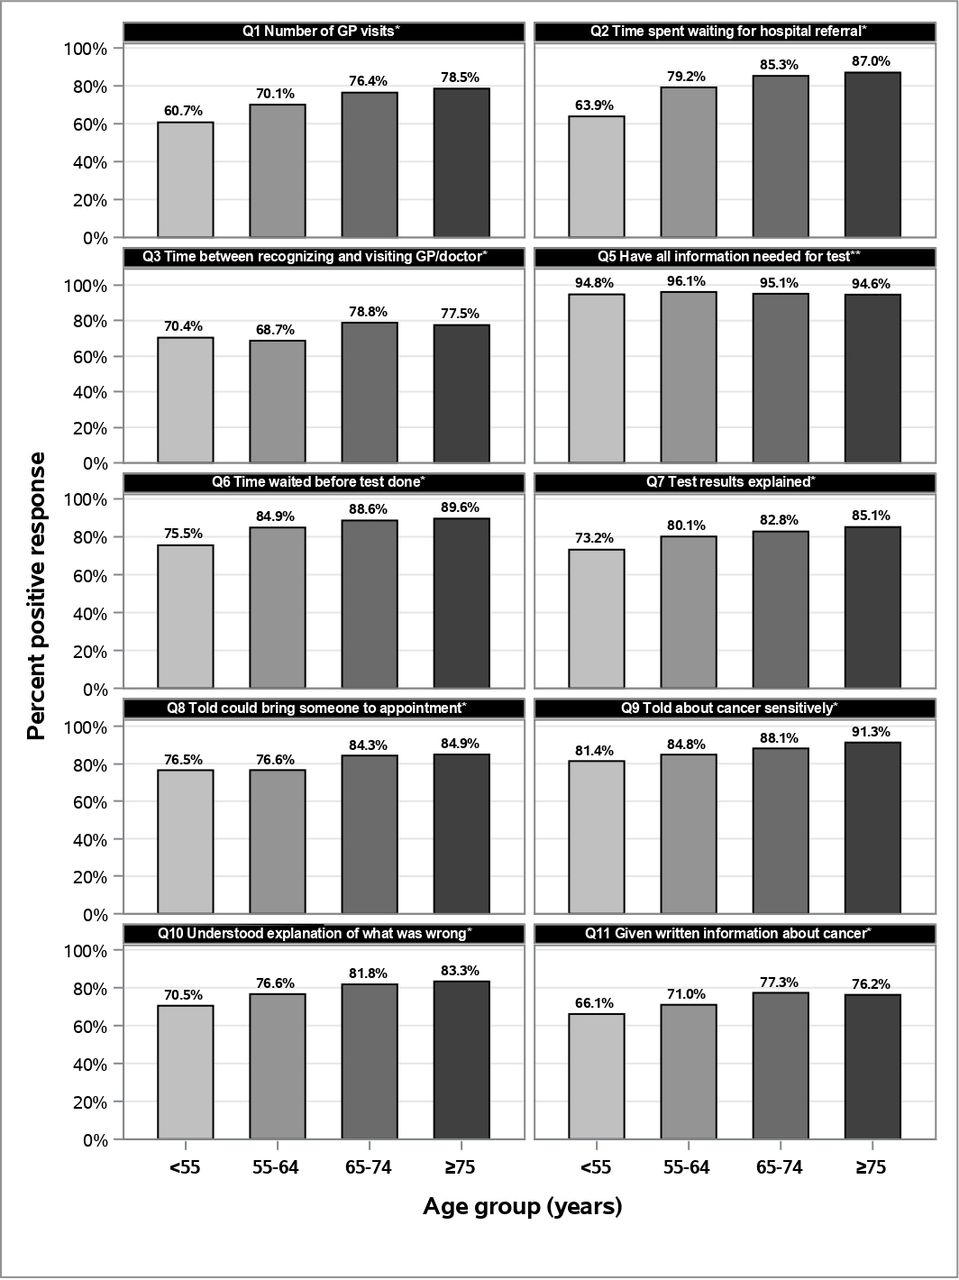
Proportion of respondents in each age group with positive responses, as a percentage of those with positive or negative experience.# #The number of missing or ‘uninformative’ responses excluded from calculation was: Q1=660 (17.0%); Q2=77 (2.0%); Q3=195 (5.0%); Q5=107 (2.8%); Q6=83 (2.1%); Q7=65 (1.7%); Q8=249 (6.4%); Q9=80 (2.1%); Q10=22 (0.6%); Q11=623 (16.0%). *Overall χ2<0.0001, Mantel-Haenszel χ2<0.0001. **Overall χ2=0.36, Mantel-Haenszel χ2=0.35.
The proportion of patients who went to a doctor within 3 months of first symptoms (Q3) ranged from 68.7% to 78.8%. Of those who visited a GP, the proportion who had only one or two GP visits before diagnosis (Q1) ranged from 60.7% to 78.5%, but a higher proportion of patients, especially in the older age groups, felt that they were seen by a hospital doctor as soon as necessary (Q2; 63.9–87.0). The proportion reporting that they felt that the wait for the test was ‘about right’ (Q6) ranged from 75.5% to 89.6%, while fewer felt that the test results were ‘completely explained’ in a way that the patient could understand (Q7; 73.2%–85.1%). A similar proportion were told that they could bring someone to the appointment where they were informed about their cancer (Q8; 76.5%–84.9%) while a higher proportion felt they were told about their cancer sensitively (Q9; 81.4%–91.3%). A relatively lower proportion understood the explanation of what was wrong with them (Q10; 70.5%–83.3%), while fewer still were given written information that was easy to understand (Q11; 66.1%–76.2%).
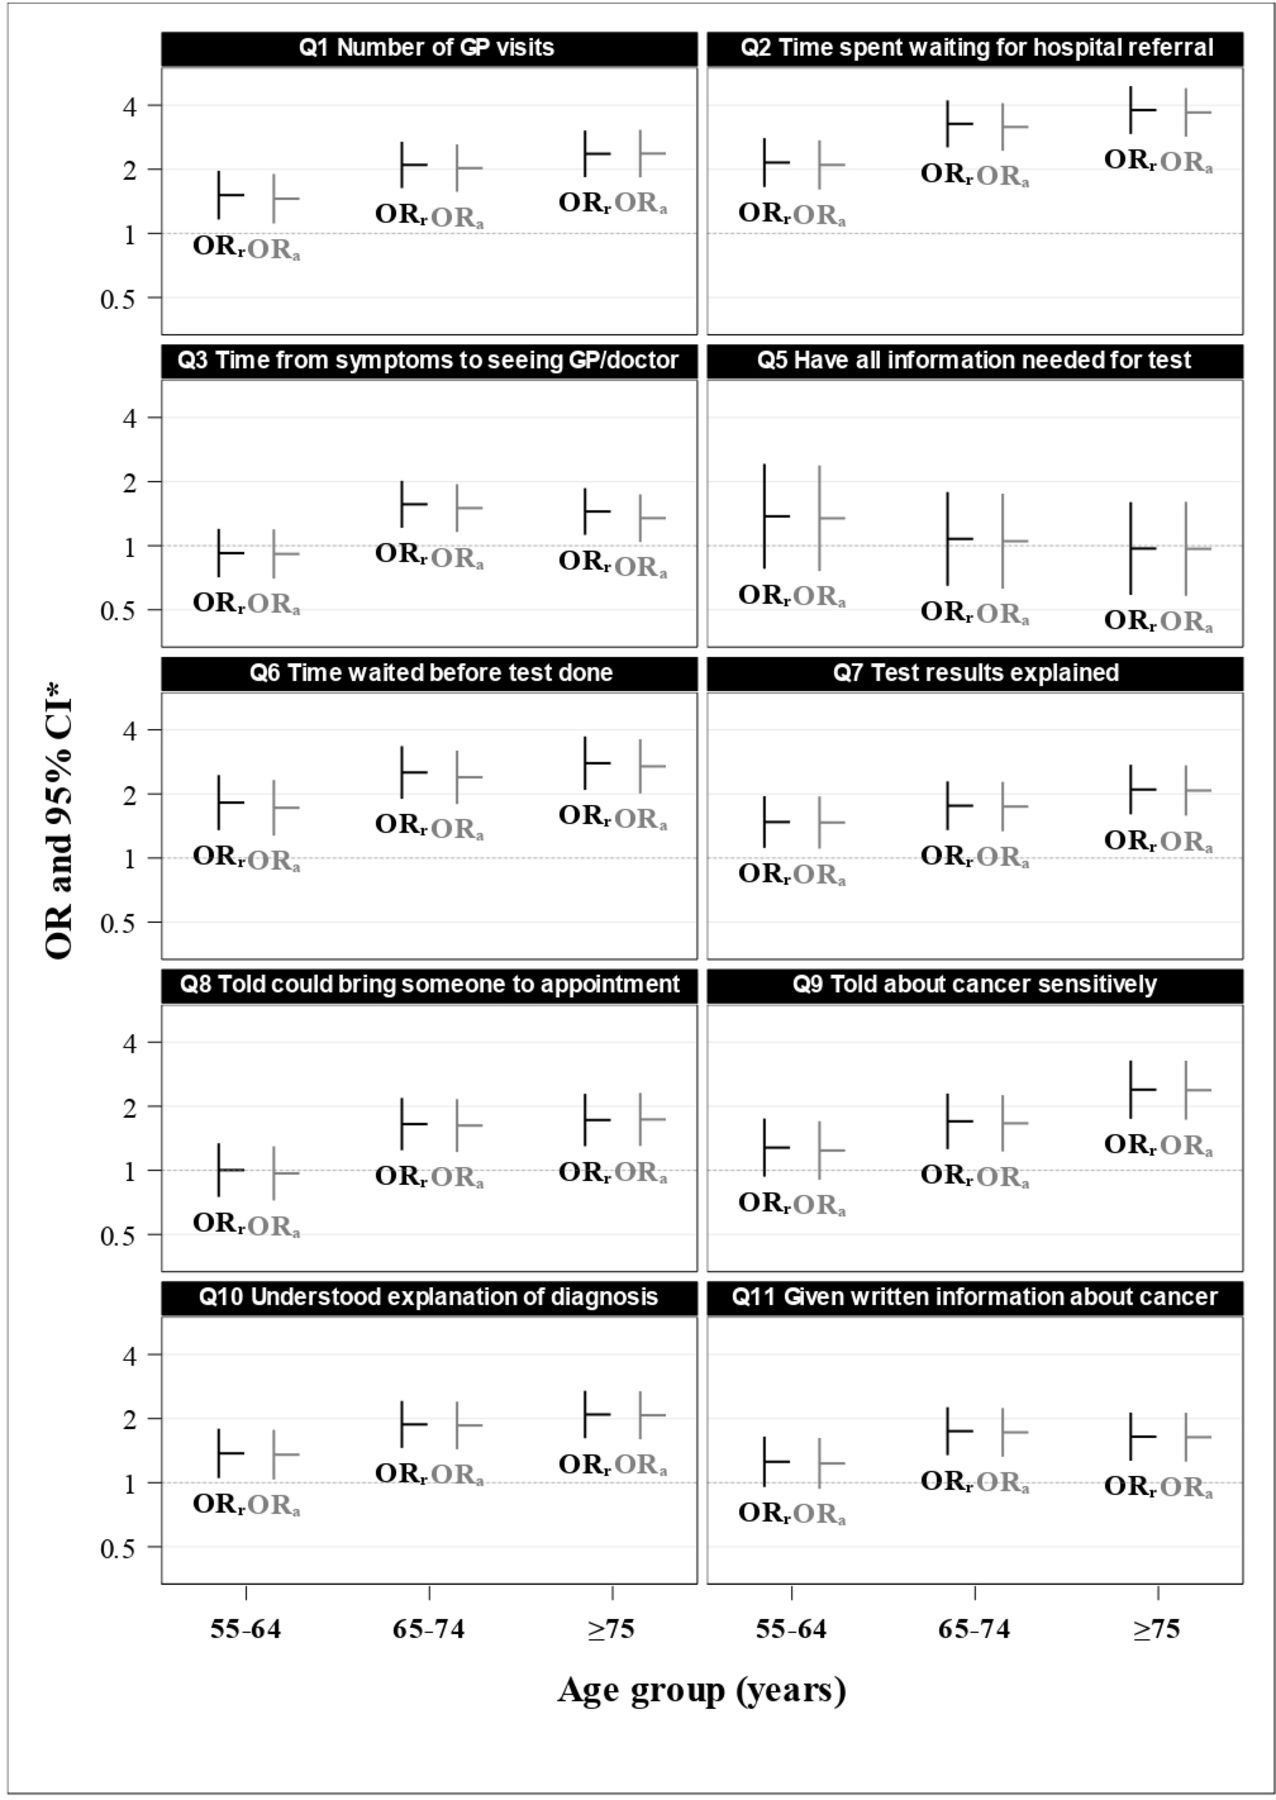
Except for the one question with similar responses for all age groups, compared with the <55 age group, raw ORs were usually intermediate for those aged 55–64 years ORr=1.0–2.2 (five of nine were statistically significantly higher than the <50 years referent age group) and highest for either the 65–74 years age group (1.6–3.3; all significantly higher) or the 75+ years age group (1.5–3.8; all significantly higher) see (figure 3). The raw and adjusted ORs were very similar; the med ian percentage difference was −2.0%, indicating that the adjustment process slightly reduced the OR; the IQR was −3.3% to −1.1% (see online supplemental appendix 1, eTable 1).
Supplemental material
OR of positive experiences for selected question for each age group. *Referent age group is <55 years. = ORa, adjusted OR; ORr, raw OR.
The sensitivity analysis adjusting for differential response rates by selected patient characteristics showed that weighting for differential response by age, sex and cancer site (colon/rectum) had minimal impact on the proportion of positive responses. No estimated proportion positive changed by even one percentage point (see online supplemental appendix 1, efigure 1).
Supplementary analysis of the 2013 CPES data, to explore the potential confounding role of stage, identified 7533 respondents with a diagnosis of CRC, of whom 4175 were retained for analysis as they had had diagnostic test in last 12 months, were not treated more than 12 months previously and had not been identified by screening (see online supplemental Appendix, eFigure 2). Online supplemental Appendix, eFigure 3 shows the proportion positive in 2013 for the eight questions which are found in both the 2017 and 2013, by age group; the pattern is broadly similar with statistically significant linear trends for an increasing proportion positive with age.
ORs adjusted for age, sex, cancer site, ethnicity and deprivation quintile in 2013 resulted median relative change of just −1.8% from the raw OR, similar to that found in 2017 (online supplemental Appendix eTable 2A). Adding stage (online supplemental Appendix eTable 2B) increased the median relative change to −4.4%; 4-.0% for the 55–64 and 65–74 years age groups, and −8.1% for the 75+ age group. The biggest change was for the question about whether the patient was told about the cancer sensitively; the raw OR of 1.51 (95% CI 1.19 to 1.91) reduced to 1.33 (95% CI 1.04 to 1.69; an 11.9% relative reduction in the point estimate) after adjustment for all characteristics including cancer stage.
Sensitivity to differential response rates in 2013 was minimal, when weighted for age, sex and cancer site (online supplemental Appendix eTable 3A) with the biggest change in proportion positive being a reduction of 0.6 percentage points. When simultaneously weighted for cancer stage this increased (online supplemental Appendix, eTable 3B), with limited change in the middle age groups (reductions of 0.5–0.6 percentage points on average), but large changes for the <55 age group (an average reduction of 1.5 percentage points, ranging from an increase of 0.3 to a decrease of 3.2 percentage points) and the 75+ age group (1.9 percentage points on average, with individual questions reducing by 1.4–4.2 percentage points).
Discussion
In this large cohort of 3889 patients with CRC who responded to the CPES 2017, respondents aged <55 years have the lowest proportion of positive responses for the selected diagnosis-related questions. There was a consistent trend overall for the rate of positive experience to increase with age. The age-related pattern was consistent after controlling for sex, ethnicity, socioeconomic status and cancer site. A supplementary analysis using 2013 data suggests that cancer stage has a bigger effect than other characteristics but does not alter this general pattern.
A positive correlation between age and positive healthcare reported experience is ubiquitous. Restricted to patients with cancer, the relationship has been found in a variety of studies using CPES data,16–20 earlier UK studies21 and elsewhere.22–24 In adult patient populations, a similar age-related pattern of positive experience or satisfaction has been found in primary care,25–29 inpatient care,25 30 31 outpatient care29 30 32 and emergency departments.29 30 32 33 A similar pattern has been found in the UK25–31 and other countries.32–35 In 1990, a systematic review found that age was the most commonly and consistently reported correlate of patient satisfaction36 and a separate review in 2016 arrived at the same conclusion.37 Exceptions to the finding of a positive correlation between age and reported healthcare experience include studies restricted to older people,35 studies of paediatric populations25 and a study of population satisfaction with the health system as a whole, among countries of the former soviet bloc.34
Our data reflect this pervasive age-related pattern of higher rates of positive experience for older age groups and our findings contribute to an understanding of this phenomenon. It has long been known that young patients with CRC delay seeking healthcare, reflecting a gap in their CRC symptom awareness.38 39 Our results show that 70% of patients aged <55 years had their first postsymptom visit to a GP or doctor within 3 months; this compares to 69% of those age 55–64 years and increased to 78%–79% for respondents aged 65 years and above. Bowel Cancer UK initiated its ‘Never Too Young’ campaign in 2013, in part to address low public awareness of the symptoms of CRC in people aged <50 years.38 Our findings suggest that campaigns to increase symptom awareness could include those aged 50–64 years who have a substantially higher baseline incidence and a similar rate of health-seeking delay; the need for such action, however, is mitigated because of the extension of the National Bowel Cancer Screening Programme to those aged 50 and over by 2025, starting gradually from April 2021.40 It is notable that screening for bowel cancer has been recommended for people aged 45 years and above in the USA41 and Australia.42 In addition, it has been recently suggested in Australia that there may be opportunities to increase CRC screening participation rates by encouraging education for primary care physicians and support for quality improvement initiatives in primary care43; such approaches should also consider the implications of the age-related patterns we have found.
In addition to patient delays in presentation, delays have been repeatedly found in EoCRC investigation and diagnosis; providers are less likely to consider cancer as a differential diagnosis due to non-specific symptoms, perceived unlikelihood of cancer and lack of assimilation of updates to guidelines.7 8 We found an age gradient in relation to both the proportion having only one or two GP visits before diagnosis and in the proportion who got a hospital appointment as soon as they thought necessary. Younger symptomatic individuals who do not meet the guidelines pose a particular challenge for clinicians, who need to eliminate other possible causes before diagnostic testing for CRC can be justified. There is evidence that medical communication skills mediate appropriate diagnostic practice in EoCRC; specifically, clinicians who encourage patient communication, are engaged and appear friendly and sincere, are also more likely to achieve appropriate clinical outcomes in CRC diagnosis.44 While it is also plausible that sound communication of diagnostic uncertainty could increase a patient’s sense of the appropriateness of time to hospital referral, evidence on this is lacking,45 while theorists of diagnostic uncertainty encourage training of medical students in uncertainty communication,46 some empirical evidence suggests that explicit communication of diagnostic uncertainty may undermine parent confidence in provider competence.47 We are not aware of the assessment of interventions to improve provider communication specifically in relation to CRC diagnosis; if such studies are proposed, our results suggests that they should consider age gradients rather than simply targeting those <50 years.
Almost half a century ago, Donabedian noted that information about patient experience is indispensable as an assessment of quality,48 echoing the views of earlier thinking on the uses of consumer evaluations of healthcare.49 In keeping with this perspective, a central motivation of studies such as ours is to identify and prioritise targets for interventions to improve patient experience. A key question then is whether the age-related differences in reported experience that we have observed reflect deficiencies in service provision or whether they reflect differences in patient expectations or some other tendency among patient subgroups to systematically rate experiences differently.
Our finding that all age groups report a uniformly high level of satisfaction with the level of information they had before their diagnostic test (Q5) suggests that patients can and do discriminate between different types of question, and that where there are differences in the proportion reporting positive experiences, we should take them at face value. Another source of evidence may derive from comparing questions that are feelings or opinion based (eg, Q6. How did you feel about the time waiting for your test? And Q9. Were you told about your cancer sensitively?) to questions that are apparently factual (eg, Q8. Told you could bring someone to an appointment to hear test results? or Q11. Given written information about your cancer?). If age-related differences reflect patient expectations, one might expect the questions relating to feelings or opinions to show a higher difference. In reality, however, the proportion of patients aged 75 years and over is generally 10–15 percentage points higher than for patients aged <55 years, regardless of whether the question relates to facts versus opinions, suggesting that if there is a difference it is not large.
One approach to unpacking these characteristics is to include anchoring vignettes, a technique promoted by the WHO to adjust for differential response propensity in survey ratings.50 In this approach, survey respondents are asked to rate one or more standard vignettes, and these ratings are used to adjust the analysis of responses about their personal experience or views, to allow comparison across countries51 or, within a country, across relevant sociodemographic characteristics like age and sex.52 Analysis need not be restricted to the adjusted responses, but they provide an additional form of evidence when prioritising among subgroups with similarly poorer than average experience. Alternatively, qualitative studies of patient journeys could provide greater insight into the different experiences and lenses of key patient subgroups, such as age cohorts, to help determine priorities for quality improvement interventions.
A strength of this study is that it is focused on a limited subset of primary tumour locations, specifically primary cancers of the colon and rectum. This allowed meaningful restriction of the participants to those patients not diagnosed through the bowel screening programme; a subgroup likely to have a markedly different diagnostic experience. As screening-diagnosed patients are restricted to particular age groups, their removal provides a more legitimate comparison of experience by age group. The ORs controlling for sex, ethnicity, socioeconomic status and cancer site indicate that the age-effect persists after controlling for these factors. Finally, the sensitivity analysis that weighted for differential response by sex and location (colon vs rectum) reassures that the over-representation of these characteristics among younger patients with CRC, both associated with poorer experience, is not a systematic source of age-related difference in reported experience as the estimated proportions positive changed by around a half a percentage point or less in all questions.
As to limitations, we chose to assess the age effect as linear, whereas the data show that highest positive rates are sometimes in the 65–74 years age group. This curvilinear age pattern has been reported in CPES data, with a slight reduction in positive responses in patients with cancer aged 85 and over.20 While we could have analysed the data using regression methods fitting curvilinear relationships between age group and positive experiences, the results of the linear model were similar to the curvilinear and facilitated exposition.
A separate analysis looking at the impact of controlling for factual questions (eg, Q3 patient delay) on the age-related rate of positive experiences reported on feeling or opinion based is possible but was considered, but is beyond the scope of the current study. Moreover, the coding of Q3 as positive/negative is not the subject of an NHS standard (unlike all other diagnosis experience questions); the coding used in this study was developed by the authors to reflect the approach taken by the NHS in relation to other diagnostic experience questions. In addition, there is no information in the CPES to indicate the severity of initial patient symptoms; patient delay may be reasonable if initial symptoms were mild. A separate analysis would need to address these issues and acknowledge the limitations of the information available.
Another limitation was the inability to control for differences in stage of cancer at diagnosis in calculating both the adjusted ORs for the age effect, and the sensitivity analysis correcting for differential response rates, as staging data in not available in publicly available CPES datasets for 2017. A supplementary analysis was undertaken using the 2013 ‘Wave 4’ CPES data, where stage is included in both CPES and registry datasets and suggests that stage has a bigger impact as both a confounder and as a source of sampling bias, but still does not interrupt the underlying pattern. The role of stage in more recent data should be explored and adjusted for, especially for younger and older patients, when the National Cancer Registration and Analysis Service make linked CPES/registry data available,15 as proposed.
We have reported on 2017 CPES data, while 2018 CPES data were available,53 there was no publicly available 2018 cancer registry data for CRC to permit the sensitivity analysis for differential response. We note, however, that the sensitivity analysis could not control for differential response by ethnicity, and this is unfortunate as ethnicities other than ‘White British’ are disproportionately in the <55 age group and are also known to be less likely to be CPES respondents.54 Further, the CPES data only allows for the younger age group to be grouped as <55 years, while a lot of the focus of literature is EoCRC defined as <50 years; based on the trends we found, the reported experience of patients <50 years old is likely to be less positive than we find for patients aged <55 years.
Conclusion
These data demonstrate that the proportion of patients with CRC reporting positive experiences increases with age group, arching with highest ratings at 65–74 or 75 years and over. This pattern remains after adjustment for sex, ethnicity, socioeconomic status and cancer site, and is unaffected by survey response biases relating to sex or cancer site. An assessment of the role of stage in an earlier dataset suggests that it is more important that the other characteristics, but still does not explain the observed age effect. The value of publicly available data on patients with cancer, including CPES and cancer registry data, would be further enhanced by the proposal to make linked data available in the UK, and the inclusion of additional variable such as cancer stage in other years.
Data availability statement
Data are publicly available from the following citation:NHS. Quality health. national cancer experience survey. UK Data Service; 2017. Available: https://beta.ukdataservice.ac.uk/datacatalogue/studies/studyid8573
Ethics statements
Patient consent for publication
References
Supplementary materials
Supplementary Data
This web only file has been produced by the BMJ Publishing Group from an electronic file supplied by the author(s) and has not been edited for content.
Footnotes
Contributors SSO and GA developed the study and design. SSO conducted the analysis and wrote the first draft manuscript in consultation with GA and KL. SSO and GA accept full responsibility of the analyis, access of data and published content. All authors contributed to and approved of the final draft.
Funding This study was supported by the Centre of Research Excellence in Implementation Science in Oncology, National Health and Medical Research Council of Australia (NHMRC grant number 1135048) which is administered by the Australian Institute of Health Innovation, Macquarie University.
Competing interests None declared.
Provenance and peer review Not commissioned; externally peer reviewed.
Supplemental material This content has been supplied by the author(s). It has not been vetted by BMJ Publishing Group Limited (BMJ) and may not have been peer-reviewed. Any opinions or recommendations discussed are solely those of the author(s) and are not endorsed by BMJ. BMJ disclaims all liability and responsibility arising from any reliance placed on the content. Where the content includes any translated material, BMJ does not warrant the accuracy and reliability of the translations (including but not limited to local regulations, clinical guidelines, terminology, drug names and drug dosages), and is not responsible for any error and/or omissions arising from translation and adaptation or otherwise.