Setting benchmark revision rates for total hip replacement: analysis of registry evidence
BMJ 2015; 350 doi: https://doi.org/10.1136/bmj.h756 (Published 09 March 2015) Cite this as: BMJ 2015;350:h756
- Ngianga-Bakwin Kandala, principal research fellow in health technology assessment1,
- Martin Connock, senior research fellow in health technology assessment1,
- Ruth Pulikottil-Jacob, research fellow in health economics1,
- Paul Sutcliffe, associate professor in health technology assessment1,
- Michael J Crowther, research associate and NIHR doctoral research fellow2,
- Amy Grove, NIHR doctoral research fellow in health services research1,
- Hema Mistry, assistant professor in health economics1,
- Aileen Clarke, professor of public health and health services research1
- 1Warwick Evidence, Division of Health Sciences, Warwick Medical School, University of Warwick, Coventry CV4 7AL, UK
- 2Department of Health Sciences, University of Leicester, Leicester LE1 7RH, UK
- Correspondence to: Aileen Clarke Aileen.Clarke{at}warwick.ac.uk
- Accepted 12 January 2014
Abstract
Objective To compare 10 year revision rates for frequently used types of primary total hip replacement to inform setting of a new benchmark rate in England and Wales that will be of international relevance.
Design Retrospective cohort study.
Setting National Joint Registry.
Participants 239 000 patient records.
Main outcome measures Revision rates for five frequently used types of total hip replacement that differed according to bearing surface and fixation mode, encompassing 62% of all primary total hip replacements in the National Joint Registry for England and Wales. Revision rates were compared using Kaplan-Meier and competing risks analyses, and five and 10 year rates were estimated using well fitting parametric models.
Results Estimated revision rates at 10 years were 4% or below for four of the five types of total hip replacement investigated. Rates differed little according to Kaplan-Meier or competing risks analysis, but differences between prosthesis types were more substantial. Cemented prostheses with ceramic-on-polyethylene bearing surfaces had the lowest revision rates (1.88-2.11% at 10 years depending on the method used), and cementless prostheses with ceramic-on-ceramic bearing surfaces had the highest revision rates (3.93-4.33%). Men were more likely to receive revision of total hip replacement than were women, and this difference was statistically significant for four of the five prosthesis types.
Conclusions Ten year revision rate estimates were all less than 5%, and in some instances considerably less. The results suggest that the current revision rate benchmark should be at least halved from 10% to less than 5% at 10 years. This has implications for benchmarks internationally.
Introduction
Total hip replacement is a successful intervention for hip osteoarthritis. In the United States more than 300 000 total hip replacements were undertaken in 2010,1 and in the United Kingdom about 80 000 are undertaken annually.2 Many total hip replacement components exist. Surgeons in the United Kingdom can select from more than 150 different devices and combinations of components.3 Ageing of host bone, wear in bearing surfaces, and other contingencies mean that some total hip replacements need replacing during a patient’s lifetime.
Surgical revision is a complex and demanding procedure that is inconvenient, traumatic, and expensive. In the past, alarmingly high revision rates were documented for some total hip replacement designs. Catastrophic failure resulted in a 67% five year revision rate for one device.4 The 3M Capital hip, implanted in more than 4000 patients in the United Kingdom from 1991, raised concerns in 1995, and a Department of Health hazard notice was issued in 1998.5 The DePuy ASR device was recalled from the market in 2010 after more than 93 000 had been implanted worldwide.6 7 Concerns have been raised about devices with metal-on-metal bearing surfaces.8 9 In 2009 roughly a third of hip replacements in the United States were metal-on-metal.
Such episodes highlight the need for monitoring. Past use of poor devices has been bad for patients and bad for the reputation of orthopaedics and of clinicians, and it has contributed to waste of National Health Service resources. Effective measures are needed to sieve out devices that fail to fulfil their promise and to raise the performance of hip replacement. One way of achieving this is the timely and stringent implementation of a benchmark for revision rates. The benchmark can be promulgated throughout the NHS and associated stakeholders, allowing for quality assurance and organisational governance procedures that encourage local compliance and improve quality. Some people go further and suggest that any new product or procedure should be compared with established standards of care in a controlled trial,4 and others have commented that “widespread surveillance of existing implants is urgently needed.”10
The desire for monitoring has led to the creation of national registries that achieve almost total coverage and can be used to monitor performance.11 The National Joint Registry for England and Wales holds information on more than 400 000 hip replacements from 2003, including data on patients’ sex, age at primary intervention, and time to revision.2 12 13 In 2000 the National Institute for Health and Care Excellence (NICE) suggested a 10 year benchmark of 10% for revision or a three or five year revision rate commensurate with this 10 year benchmark.14 In 2003 the NHS Supply Chain set up the Orthopaedic Data Evaluation Panel (ODEP) to monitor performance of prostheses against this benchmark.15 16 Manufacturers may non-compulsorily register a product, submit evidence, and receive a rating of evidence quality. Total hip replacement cups and stems are rated separately.
In 2011 ODEP identified 65 products that lacked an ODEP rating.16 A recent systematic review found no evidence of effectiveness for 24% of the total hip replacements recorded for 2011 in the National Joint Registry,17 and the authors suggested that the ODEP system may allow scope for submission of selective evidence.
Other international registries have published data on long term revision rates,18 19 which provide a valuable standard for assessment of the relevance and appropriateness of a benchmark. They indicate that England has revision rates that are comparable to internationally reported rates, although they are not the best. The rates show that lowering the benchmark for England would be reasonable. Conversely, publication of a benchmark will support healthcare organisations in other countries in trying to improve and assess their own performance. Other publications, including National Joint Registry annual reports, have analysed revision rates using Kaplan-Meier and competing risk methods.2 20 21 22 23 In Kaplan-Meier analysis, the event of interest is revision and other outcomes are censored; in competing risks analysis, death before revision is a competing risk for revision and only patients alive at the end of follow-up without revision are censored. Kaplan-Meier analysis is believed to overestimate the cumulative incidence of the event of interest compared with competing risks analysis.20
We aimed to use different methods to compare 10 year revision rates for frequently used types of primary total hip replacement to inform the setting of a new NICE benchmark rate in England and Wales that will be of international relevance.
Methods
Data came from the National Joint Registry for England and Wales and contained records of primary surgery (resurfacing and total hip replacement) between April 2003 and March 2012. We included revision or death notified up to September 2012. We used an iterative cross tabulation procedure applied to 386 556 useable records of total hip replacement undertaken for osteoarthritis to identify four categories of prosthesis on the basis of highest frequency of use of combinations of components. We also included a fifth category that has recently gained in popularity. Table 1⇓ lists the components of the five total hip replacement categories studied (further details and data on use are in web appendix A and B).
Components of five frequently used categories of total hip replacement
Analysis of revision rates
We used parametric models to estimate 10 year revision rates. We used Stata 12 software for analyses. We judged goodness of fit visually and according to Akaike’s information criterion. For Kaplan-Meier analyses, we fitted bathtub, Weibull, and loglogistic models with the stgenreg package of Crowther and Lambert 2013 and flexible parametric models with the stmp2 package of Lambert and Royston 2009.24 25 We used bathtub models to reflect perceived biological plausibility in describing reducing risk after surgery and subsequent increasing risk,26 27 28 as both bone and prosthesis accumulate wear and tear. Competing risks analysis used the stcompet package of Coviello and Bogess 2004,29 and flexible parametric models were fitted with the stmp2cif and stcompetadj packages of Hinchliffe and Lambert 2012 and Coviello 2013.30 31 The subhazard procedure of Fine and Gray 1999,32 as available in Stata, was followed by least squares non-linear regression to fit Weibull and lognormal models.
As patients’ age and sex influence performance of revision, we stratified by sex and modelled 10 year revision rates for 70 year old patients by using Kaplan-Meier and competing risks methods. We also compared five year revision rates by category, again using Kaplan-Meier and competing risks flexible parametric models, adjusted for age and stratified by sex.
Results
The five categories comprised 239 089 patients, representing 62% of all eligible patients in the database and representative of all eligible patients with respect to follow-up, age and sex distributions, and American Society of Anesthesiologists’ physical condition grading (see appendices A and B). Figure 1⇓ illustrates the unadjusted cumulative incidence of revision for each category of total hip replacement, according to Kaplan-Meier and competing risks analyses. Competing risks analysis delivered lower cumulative revision than Kaplan-Meier analysis, but the difference is small for all categories; the categories most altered by use of the competing risks method had higher rates of death and were implanted in relatively older patients. (For category A, the 95% confidence intervals of the two flexible models did not overlap.)

Fig 1 Kaplan-Meier and competing risk analyses of time to revision for different total hip replacement prostheses. C=ceramic; Ce=cemented; CeL=cementless; Hy=hybrid; M=metal; P=polyethylene
Revision rates at 10 years were fitted using bathtub, Weibull, loglogistic, and flexible parametric models for Kaplan-Meier analyses and flexible parametric models for competing risks analyses and were all considerably less than 4% except for the cementless prostheses C (ceramic head (cementless stem) on cementless hydroxyapatite coated metal cup (ceramic liner)) and B (metal head (cementless stem) on cementless hydroxyapatite coated metal cup (polyethylene liner)) (table 2⇓ and fig 2⇓; further details in appendix C). The different revision rate models delivered very similar 10 year estimates within each total hip replacement category. Differences between categories were greater than those between alternative methods of modelling revision within a category. The 95% confidence intervals for categories A and E did not overlap with those for B and C. The results show that cemented and hybrid device types seem to yield better revision performance than others.
Estimated percentage revision rate (95% CI) at 10 years according to differing methods of analysis
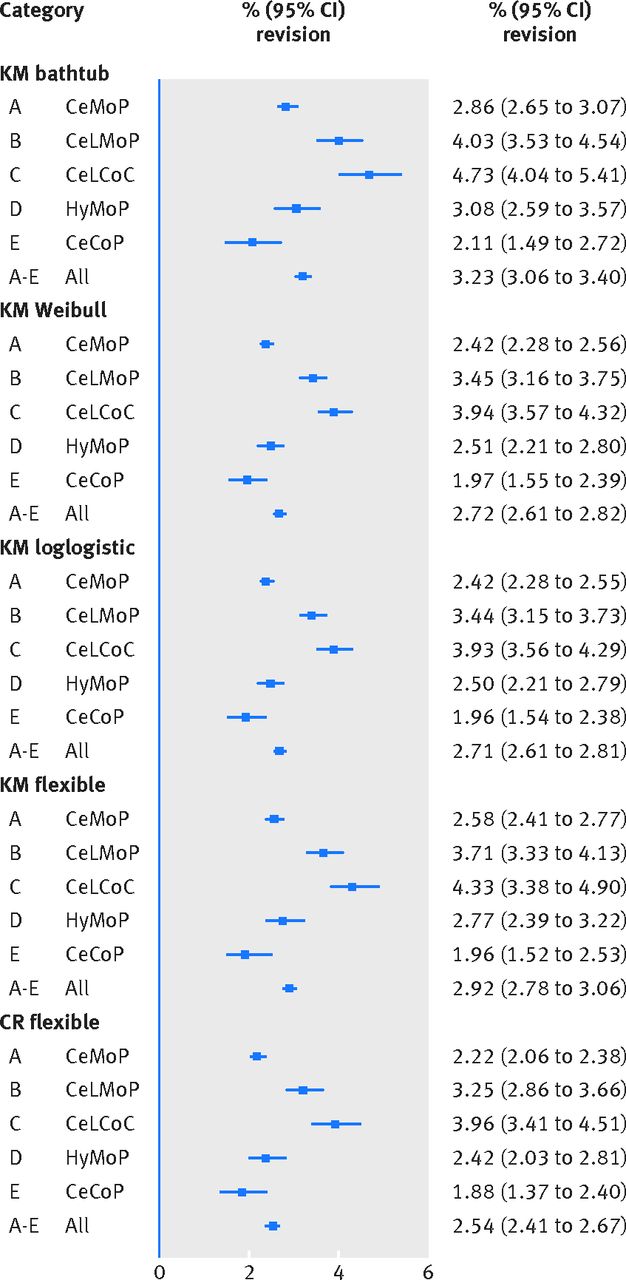
Fig 2 Estimated percent revision of different total hip replacement devices at 10 years according to Kaplan-Meier (KM) and competing risks (CR) models. C=ceramic; Ce=cemented; CeL=cementless; Hy=hybrid; M=metal; P=polyethylene
Median age across the combined categories was 70.4 years. The populations receiving the five total hip replacement categories differed by age and sex (fig 3⇓). Age distributions within categories for men and for women were similar. Mean age differed between categories by as much as 10 years (for example, category C versus category A). Men had higher revision rates than women according to both Kaplan-Meier (fig 4⇓) and competing risks (appendix D) analyses. Except for category E, this difference was statistically significant (P<0.05) both with and without age stratification.

Fig 3 Age distribution for men and women by category. Vertical line represents 70 years of age. C=ceramic; Ce=cemented; CeL=cementless; Hy=hybrid; M=metal; P=polyethylene

Fig 4 Kaplan-Meier analysis of time to revision according to sex by total hip replacement category. C=ceramic; Ce=cemented; CeL=cementless; Hy=hybrid; M=metal; P=polyethylene
After stratifying by sex, we modelled 10 year revision for male and female 70 year old patients by Kaplan-Meier and competing risks methods. The ceramic head (cementless stem) on cementless hydroxyapatite coated metal cup (ceramic liner) category (C) remained the poorest performing category and ceramic head (cemented stem) on cemented polyethylene cup (category E) the best (table 3⇓; further details in appendix E). Differences between sexes were of smaller magnitude than differences between total hip replacement types. Categories C and E have been used in younger populations, who typically experience higher revision rates; adjustment for age should favour their performance relative to the other three categories.
Modelled 10 year revision rates (%) for 70 year old men and women
Table 4⇓ and figures 5⇓ and 6⇓ show the five year revision rates for a patient with the average age for each category. Age adjustment resulted in very small differences across an age span from 50 to 70 years, varying between 0.03% (for women receiving metal head (cementless stem) on cementless hydroxyapatite coated metal cup (polyethylene liner) devices) and 1.1% (for women receiving metal head (cemented stem) on cemented polyethylene cup devices). Full results for revision at five years for men and women aged 50, 60, and 70 years are provided in appendix F. In most cases at five years, revision rates were less than 2.5% for both men and women aged 50 to 70 years.
Five year revision rates—% (95% CI)—according to flexible parametric models

Fig 5 Flexible parametric models reflecting age distribution of each category in men. C=ceramic; Ce=cemented; CeL=cementless; Hy=hybrid; M=metal; P=polyethylene

Fig 6 Flexible parametric models reflecting age distribution of each category in women. C=ceramic; Ce=cemented; CeL=cementless; Hy=hybrid; M=metal; P=polyethylene
Discussion
We found that 10 year revision rates for five frequently used categories of total hip replacement prosthesis were all less than 5% and that revision rates were higher for men than for women. We concluded that the revision rate benchmark for England and Wales at 10 years should be at least halved from 10% to 5%.
The National Joint Registry for England and Wales represents a valuable resource providing statistical power and comprehensiveness. However, some weaknesses are common to such databases, even with careful observance of protocols for data entry.33 34 These include a heavy reliance on revision as an outcome rather than on pain or quality of life, omission of variables that might confound analyses (such as activity levels among recipients of different devices), and the possibility of missing and duplicate entries. Nevertheless, in the absence of evidence from randomised controlled trials, national registries remain the best available evidence to assess performance of devices.18 19 23 35
One of the strengths of this study is that our analyses have explored all models previously used to investigate revision and reflect the actual performance of devices as used in the United Kingdom. Modelling of revision rates is valuable in this case, as it uses information from all the observed data and does not depend on idiosyncrasies in the data at any particular point in time or on a period in which uncertainty is high owing to progressive reduction in numbers at risk.
The extrapolated 10 year performance of different total hip replacement devices reported here is compatible with previous analyses of the National Joint Registry.2 23 Cemented devices seem to have better revision performance than cementless devices. Greater use of cementless as opposed to cemented prostheses in 2008-09 (table 5⇓) reported for Australia and the United Kingdom thus does not reflect the apparently superior performance of cemented devices and differs from the Scandinavian experience.18 19 However, a recent analysis of Nordic registries found that from 2005 to 2011 use of cementless devices increased dramatically. The authors attributed this to “intensive marketing of more expensive uncemented implants.”36 Variation in national practice coupled with lenient regulatory requirements and a lack of randomised controlled trial evidence may allow widespread use of suboptimal devices. Potentially serious consequences are illustrated in experience of the 3M Capital and the DePuy ASR devices.
Relative use of different total hip replacement types as reported in different registry datasets
A huge possible range of different combinations of prosthesis components exists, and it was impractical to analyse all of them. Selection of categories was based on frequency of use of component parts. Four of the selected categories encompassed the most frequently used types, and we selected the additional smallest category because it has also gained in popularity more recently (appendix B).
The five categories represented 62% of the total National Joint Registry cohort and were representative of the total cohort with respect to length of follow-up, sex and age distribution, and American Society of Anesthesiologists grade distribution. Our analyses indicate that for these five frequently used total hip replacement categories, irrespective of analysis method, all 10 year revision rates were below 5% and some were considerably less than 4%. At five years, only cementless devices exceeded a 2% failure rate.
Our findings suggest that continuation of a benchmark of 10% at 10 years might allow patients to have inferior total hip replacement devices implanted. Some people argue that a benchmark should not be so low as to stifle innovation, but too a high benchmark would have little function. We consider that a satisfactory benchmark could be set as a 4% revision rate at 10 years, although a 5% rate would allow for continuing innovation while ensuring that poorly performing devices can be phased out. We would also recommend that this benchmark is reviewed within the next four years as new data become available. The current Orthopaedic Data Evaluation Panel rating system in the United Kingdom, although unique, is voluntary and reactive. We agree with others that the current operation of the system requires urgent modification.17
Conclusion
NICE has now published its revised benchmark and recommends that the current benchmark at 10 years is reduced from 10% to 5%.37 Our data strongly support this change. As a result of this work, we also consider that the regulation of device introduction in the United Kingdom should be considered as a matter of priority. Regulatory mechanisms, predicated on the assumption that devices can be afforded a looser regulatory mechanism than drugs, have allowed a very large number of brands of total hip replacement to slip into routine use without rigorous monitoring of effectiveness and with a backlog of certification by the ODEP.
If the ODEP were strengthened and randomised controlled trials were demanded (as is standard for drugs by the regulatory agencies), the use of devices that may be suboptimal for some patients would be reduced. In the absence of a change in regulatory procedures an effective updated benchmark is very necessary, but it is a poor second best.
What is already known on this topic
The total hip replacement revision benchmark of 10% at 10 years in England and Wales is under reconsideration
Revision rates vary between different types of total hip replacement device
Worryingly high revision rates have been documented for some devices and monitoring has been less effective than is desirable
What this study adds
Ten year revision rates were all less than 5% for five frequently used categories of total hip replacement prosthesis
Revision rates were higher for men than for women
The 10 year revision rate benchmark for England and Wales should be at least halved from 10% to 5%
Notes
Cite this as: BMJ 2015;350:h756
Footnotes
We thank the National Joint Registry for England and Wales for continuing advice and support regarding the data analysis and Matthew Costa, Warwick Clinical Trials, Warwick Medical School, Coventry, for his expert clinical advice.
Contributors: All authors were substantially involved in the study design and the collection and interpretation of data and writing of the article. N-BK, MJC, RP-J, and HM did the analysis. All authors contributed to draft versions and reviewed and agreed the final version to be published. AC is the guarantor.
Funding: This project was funded by the Health Technology Assessment programme (project number 11/118). Further information is available at www.nets.nihr.ac.uk/programmes/hta. N-BK and AC are also supported by the National Institute for Health Research (NIHR) Collaboration for Leadership in Applied Health Research and Care West Midlands at University Hospitals Birmingham NHS Foundation Trust. AG is supported by the NIHR Doctoral Fellowship Programme (project number DRF-2013-06-064), and MJC is funded by an NIHR doctoral research fellowship (DRF-2012-05-409). This report presents independent research commissioned by the NIHR) to support the work of the National Institute for Health and Care Excellence (NICE). The views and opinions expressed in this publication are those of the authors and do not necessarily reflect those of the NHS, NICE, NIHR, MRC, CCF, NETSCC, Health Technology Assessment programme, or Department of Health.
Competing interests: All authors have completed the ICMJE uniform disclosure form at www.icmje.org/coi_disclosure.pdf (available on request from the corresponding author) and declare: no support from any organisation for the submitted work other than those in the funding statement; no financial relationships with any organisations that might have an interest in the submitted work in the previous three years; no other relationships or activities that could appear to have influenced the submitted work.
Ethical approval: Ethical approval was not needed for this study. No individual patients participated in the research.
Transparency declaration: The lead author (the manuscript’s guarantor) affirms that the manuscript is an honest, accurate, and transparent account of the study being reported; that no important aspects of the study have been omitted; and that any discrepancies from the study as planned have been explained.
Data sharing: Technical appendix, statistical code, and dataset are available from the corresponding author. Participants’ informed consent for data sharing was not obtained, but the presented data are anonymised and risk of identification is low.
This is an Open Access article distributed in accordance with the Creative Commons Attribution Non Commercial (CC BY-NC 4.0) license, which permits others to distribute, remix, adapt, build upon this work non-commercially, and license their derivative works on different terms, provided the original work is properly cited and the use is non-commercial. See: http://creativecommons.org/licenses/by-nc/4.0/.