


Introduction
We analyze a typhoid epidemic that occurred in the city of Tampere, Finland, in 1915–1916. To explain differences in time to illness among the eventually infected population, we link records on location, housing characteristics, and individual socioeconomic and demographic variables with data on self-reported behavior. We construct an awareness indicator based on contemporary survey responses about the perceived sources of contagion. This combination makes it possible to answer questions about concrete micro-level mechanisms that usually remain hidden. How does material and social inequality interact with epidemics to produce unequal outcomes? Were people too poor, too ill-informed, or too disobedient to avoid disease? Was their living environment the problem, and if so, how?
A growing body of literature has analyzed the socioeconomic determinants of contagion within cities during historical epidemics, most often the Spanish Flu of 1918. Norwegian individual-level data shows a correlation with apartment size and parish poverty in the national capital and an earlier wave affecting the poor than the more affluent in the city of Bergen (Mamelund Reference Mamelund2006, Reference Mamelund2018). Ward-level statistics from Chicago show the effects of illiteracy rates and population density on influenza mortality (Grantz et al. Reference Grantz, Rane, Salje, Glass, Schachterle and Cummings2016). Late initiation and early lifting of public health measures may have been responsible for the “twin peak” death patterns in certain U.S. cities, but the correlation with pre-epidemic mortality implies that sociodemographic factors mattered as well (Bootsma and Ferguson Reference Bootsma and Ferguson2007). Tuckel et al. (Reference Tuckel, Sassler, Maisel and Leykam2006) make use of GIS and death certificates of those who died from the Spanish flu in Hartford, Connecticut. In their analysis, ethnicity becomes decisive, hypothetically due to its correlation with culturally determined health behavior. Ethnicity has been an important behavioral proxy in literature on urban mortality outside epidemics as well (Sawchuk et al. Reference Sawchuk, Tripp and Melnychenko2013; Ekamper and Poppel Reference Ekamper and Poppel2019). However, focusing on the turn of the century in Dublin, Connor (Reference Connor2017) argues that a segregated and low-quality living environment significantly exacerbated the mortality gap between Catholics and Protestants, suggesting that interaction between practices and material constraints was important.
Historical data rarely contains direct metrics on health-related behavior. Behavior may be critical for the control of epidemics, but it may also be conditioned by socioeconomic and environmental factors.Footnote 1 In contemporary studies, the containment of typhoid has been strongly associated with hand washing, particularly after defecation, and the use of soap (Gasem et al. Reference Gasem, Dolmans, Keuter and Djokomoeljanto2001; Hosoglu et al. Reference Hosoglu, Celen, Geyik, Akalin, Ayaz, Acemoglu and Loeb2006; Ram et al. Reference Ram, Naheed, Brooks, Hossain, Mintz, Breiman and Luby2007; Karkey et al. Reference Karkey, Thompson, Tran Vu Thieu, Dongol, Phuong, Vinh, Arjyal, Martin, Rondini, Farrar, Dolecek, Basnyat and Baker2013; Alba et al. Reference Alba, Bakker, Hatta, Scheelbeek, Dwiyanti, Usman, Sultan, Sabir, Tandirogang, Amir, Yasir, Pastoor, van Beers and Smits2016; Najma Javed et al. Reference Najma Javed, Tahir and Bashir2017; Prasad et al. Reference Prasad, Jenkins, Naucukidi, Rosa, Sahu-Khan, Kama and Jenkins2018). Findings have indicated a connection between behavior and conditions like crowdedness (Gasem et al. Reference Gasem, Dolmans, Keuter and Djokomoeljanto2001; Siddiqui et al. Reference Siddiqui, Rizwan Haider and Ahmed Bhutta2008). Other factors affecting success in outcomes have included an awareness of exposure and understanding the mechanism of transmission (Siddiqui et al. Reference Siddiqui, Rizwan Haider and Ahmed Bhutta2008; Masinaei et al. Reference Masinaei, Eshrati and Yaseri2020).
We analyze a typhoid outbreak initiated by contaminated tap water causing more than 3,000 infections and more than 270 deaths among a population of approximately 45,700 in the Finnish city of Tampere in 1915–1916. Typhoid is a life-threatening disease caused by the Salmonella Typhi bacterium, typically spread through contaminated water or food (fecal-oral transmission). After an incubation period of 7–21 days, the symptoms include fever, headache, nausea, abdominal pain, and diarrhea or constipation. At around the third week of illness, there is a heightened risk of fatal complications due particularly to intestinal perforations (Bulage et al. Reference Bulage, Masiira, Ario, Matovu, Nsubuga, Kaharuza, Nankabirwa, Routh and Zhu2017). In pre-biomedical contexts, case fatality rates (CFR) of approximately 6–9% have been reported (Whipple and Sedgwick 1908: 99). The typhoid bacterium can be highly scarring to the organism, even in the case of survival. Historically, it has been associated with co-mortality from various other diseases, and its eradication from the urban water supply of the U.S. in the early 20th century has been linked with significant improvements in the educational and economic outcomes of the affected cohorts (Ferrie and Troesken Reference Ferrie and Troesken2008; Beach et al. Reference Beach, Ferrie, Saavedra and Troesken2016). It remains endemic in parts of the developing world, with WHO estimating approximately 11–20 million annual cases and between 128,000 and 161,000 deaths.Footnote 2
The Case
Tampere was the first industrial city in a country that, until 1917, was an autonomous Grand Duchy in the Russian Empire and remained characteristically poor and agrarian compared to Western Europe (Saaritsa Reference Saaritsa2019). As part of a new industrial policy after its 1809 annexation from Sweden, the Russian Emperor granted the city an exemption from taxes and occupational licensing in 1821. By the turn of the century, with domestic and foreign, particularly British (Peltola Reference Peltola2019), expertise, and state support, Tampere had developed into a center of industry, dominated by the textile company Finlayson. The population of the city increased through migration from 20,000 in 1890 to 45,000 in 1909, with approximately 1,400 women per 1,000 men by 1910. Migration was reflected in the household structure, with 23% of households consisting of a single person in the 1910 census, and 60% consisting of three or more persons (Haapala Reference Haapala1986: Appendix Table 7; SVT 1914). Being “single” for the most part did not mean living alone, but rather denoted complex patterns of sharing and subletting.
Wedged between two lakes connected by rapids, the city grew west and east from its center by the main market adjacent to the river (district II), giving rise to neighborhoods with distinctive characteristics (Figure 1). The workforce in the large factories in the north, Finlayson (cotton) and Tampella (linen and machinery), mostly lived close to their places of employment. Houses with rooms around a shared kitchen were built early by Finlayson, but they did not meet the growing demand. In the latter half of the 19th century, garden allotments in the west of the city were auctioned to purchasers ranging from merchants and officials to skilled workers, who built up the area, giving it the name Amuri after a famous Finnish expedition to the Russian Far-East (Kanerva Reference Kanerva1994: 12–14), into a dense zone of mostly single-story tenements along wide streets (IV, parts of V). To the east of the railway line, the area of Tammela housed large segments of the working class, divided into north, central, and southern districts (XIV–XVI), with the southernmost part more affluent than the rest. Besides the stone-built central districts (II, III, and the adjacent middle-class VI), the area of Kyttälä (XI–XII) attracted people from higher tax brackets (Keskinen et al. Reference Keskinen, Peltola and Suodenjoki2005). Employment structures and social indicators demonstrate the varying profile of the districts (Appendix Figure 1; Appendix Table 1). After 1910, population growth predominantly occurred in peri-urban settlements outside the official city limits, with modest or no planning (such as Pispala, Messukylä) (Keskinen et al. Reference Keskinen, Peltola and Suodenjoki2005).

Figure 1. Map of Tampere with city districts, 1915 (source: Jutikkala Reference Jutikkala1979; image by MA Jouni Keskinen).
Housing, health, and water issues were intertwined. National policy makers were alerted to health problems created by damp, cold, and unsanitary housing overseen by private landlords in cities already in the late 1850s (Peltola Forthcoming). In Tampere, company housing was constructed with shared kitchens. Several families had to use the same stove for cooking, and they obtained water from a well outside, with outhouses and a cesspit for human waste disposal placed in the same yard (Kanerva Reference Kanerva1946: 190–195; Rasila Reference Rasila1984: 279, 286). Shared facilities were prominent in Amuri, but prevalent also in other worker districts. The problem of waste from latrines gradually seeping into wells as populations grew was universal during early urbanization. The main solution was the provision of piped water (Peltola and Saaritsa Reference Peltola and Saaritsa2019). Following a deficient low-pressure system initially established in the early 1880s, modern waterworks were built in Tampere in 1896–98 and started to quickly service a growing share of the population, mainly through water pumps located in people’s yards (Juuti Reference Juuti2021: 294–296). The source was surface water from Lake Näsijärvi, north of the city. To cut costs, the city did not build a filtering system, which had been strongly recommended by experts (Koskinen Reference Koskinen, Laakkonen, Laurila and Rahikainen1999: 109–110). With an increasing amount of human waste being deposited into the lake as more WCs were being installed, this turned out to be a recipe for disaster.
There had been sporadic typhoid epidemics in Tampere before. During the epidemic of 1908–1909, which resulted in more than 1,000 infections, piped water from the lake contaminated by human waste had definitively been shown to be the cause. Filtration and chemical purification solutions were debated, but the efforts to introduce them stalled due to their perceived complexity and cost (Koskinen Reference Koskinen, Laakkonen, Laurila and Rahikainen1999). An unusual increase in typhoid cases was noted in November and December of 1915, and by Christmas, both municipal authorities and local newspapers warned of an epidemic.Footnote 3 After a period of relative calm in January, with an elevated but constant number of cases, the disease started to spread explosively in February, peaking quickly at the end of the month. Figure 2 shows the daily reported cases based on notifications by the city doctor and a daily measure of the presence of microorganisms in piped water (Bartram et al. 2003), which major cities had been obliged to monitor since the summer of 1915 (Koskinen Reference Koskinen, Laakkonen, Laurila and Rahikainen1999: 115).

Figure 2. Reported typhoid cases and microorganisms in tap water in 1916 (source: af Hällström Reference Hällström1917; Tampereen kaupungin terveydenhoitolautakunnan kertomus 1916).
Chlorination of piped water was initiated at the beginning of March, resulting in a sudden improvement in water quality. However, after a minor hiatus, the epidemic continued and peaked again in late March. New infections started to decline steadily from the beginning of April. Cases were still constantly higher than in previous years, though, and it took until December 1916 before the crisis was declared over (Hällström Reference Hällström1917). Based on notifications by the city doctor, the complete toll was 3,304 cases and 279 dead (Koskinen Reference Koskinen, Laakkonen, Laurila and Rahikainen1999), generating a historically typical CFR of approximately 8.4%. Previous literature describing the epidemic has paid particular attention to the policy aspects of the crisis, but studies have not included a detailed statistical analysis of the event (Voionmaa Reference Voionmaa1935; Jutikkala Reference Jutikkala1979; Koskinen Reference Koskinen, Laakkonen, Laurila and Rahikainen1999; Harjula Reference Harjula2003; Juuti Reference Juuti2021).
Public action
Despite internal conflict and reticence, local authorities gradually initiated many countermeasures and eventually built up a considerable crisis organization. Conducting information campaigns through the dissemination of written material was the earliest and most consistent type of response. Official print production and distribution of information were echoed by local newspapers.Footnote 4 While the information covered many aspects of typhoid and how to avoid it, the most prominent theme was boiling water and avoiding the use of unboiled water for drinking or other purposes, such as washing up or washing dishes.
The city health board first convened on Christmas Eve 1915, and on the same day the local paper Aamulehti (The Morning Paper) published an article stating that “TYPHOID has again begun to rage in our city on a larger scale.”Footnote 5 It urged citizens to avoid drinking unboiled water, “which is usually considered to be the cause of the disease.” On December 29th, the city health board received a letter from the National Health Board (Lääkintöhallitus) pointing to piped water as the probable cause of typhoid and asking local authorities to tell the public to completely avoid using unboiled water. It also requested that the city distribute an eight-page informational booklet entitled “Typhoid,” of which the Board included a large shipment. Tens of thousands of copies were disseminated (Hällström Reference Hällström1917: 19, 23). On March 17th, the city authorities consolidated all prior instructions in the form of posters displayed in various public locations. This was done in response to a letter from the governor. The posters contained instructions prohibiting the use of unboiled water and also offered guidance on maintaining proper hand hygiene, specifically by always keeping one’s hands clean and washing them with soap and warm, boiled water prior to eating. Those individuals involved in food preparation or service work were directed to maintain strict adherence to handwashing guidelines.Footnote 6 Specific instructions pertaining to the boiling of water were disseminated to various facilities, such as restaurants, cafeterias, and boarding houses, and these were later reinforced through the imposition of fines (Hällström Reference Hällström1917).
As for monitoring compliance, the city health office had employed only four sanitary police at the beginning of the epidemic, but “manifold” temporary assistants had been hired by mid-January. Their broad mandate was to monitor general hygiene, “particularly in yards, cesspits, and dumps and in all suspicious sites of infection, conduct sanitation in the homes of the sick, and organize the cleansing of their clothes, as well as give advice and cleaning agents to avoid infection” (Hällström Reference Hällström1917: 24). Much attention was given to neutralizing the feces of the sick with chemical agents and making sure untreated feces did not end up in sewers or cesspits. This concern motivated a major logistical operation, with the feces of the hospitalized typhoid patients being collected and transported to an empty field for boiling by a “particular person” recruited for the task.Footnote 7
Unlike rural municipalities, the cities did not have ambulatory nurses who would routinely conduct home visits, providing guidance on hygiene and care during disease outbreaks (Saaritsa et al. Reference Saaritsa, Simanainen and Ristola2023). Another doctor was appointed to assist the city doctor in inspecting general hygienic measures at the end of February, and on March 7th an engineer was hired to ensure that guidelines were followed in factories, places of employment, and other places where the public gathered (Hällström Reference Hällström1917: 32, 35). Due to their high social status, however, it is unclear how much of a hands-on approach they took. In a meeting of the health board held on February 25th, a doctor stated that the decisions taken had remained ineffective due to insufficient implementation and monitoring, especially in the case of boiling water.Footnote 8
While piped water was considered an obvious culprit by many, and people were constantly reminded of the need to boil water, the city’s executive body in charge of finances (rahatoimikamari) refused to take the suggestion seriously and required more studies before committing to any costly measures. The problem was compounded by an initial laboratory investigation in Helsinki that failed to find typhoid in the water at the end of January.Footnote 9 In the last week of February, the city finally decided on the need to thoroughly cleanse the network, followed by permanent chlorination of the water. A related measure was the distribution of boiled water to the general public, rejected in January but initiated on February 25th, after which carts circulated in the streets until late April, delivering 587,000 liters of water (Hällström Reference Hällström1917: 31–32). At the beginning of March, new studies confirmed the widespread presence of typhoid both in the lake and in the piped water before chlorination.
The most extensive measure taken was the establishment of a network of temporary typhoid hospitals in addition to the three existing public hospitals, one of which specialized in the treatment of infectious diseases (kulkutautisairaala). During the January hiatus in the epidemic, the city executive was reluctant to allocate the facilities or funds recommended by the health authorities. The first hospital was finally opened on January 12th in a centrally located building. During World War I, several temporary military hospitals had been prepared in the city for Russian troops in venues like schools or meeting halls, but they had not treated any of the wounded. The city gradually managed to negotiate a plan to take them over to deal with the epidemic. In the context of the drastically deteriorating situation, five new hospitals were launched within a single week, starting from February 18th, and four more in March. In the absence of effective therapies, the hospitals provided basic care with the primary function being to isolate the infected. The health board decreed on February 14th that sick people should be removed from their homes so as not to infect others; patients would receive free treatment, but if people refused to go, then doctors should notify the board, which “in a suitable way will persuade the insubordinates.” Especially in February, the hospitals filled up immediately after opening. At their peak, on March 30th, they contained a total of 1,503 patients. According to our data, approximately 2,712 patients passed through the temporary hospitals, with a further 362 cared for in other public hospitals. Closures began gradually in April, and by June 30th only the first hospital still remained operational, before shutting down on October 17th (Hällström Reference Hällström1917: 40–41).
All told, the decision to rely heavily on the dissemination of written material may have been problematic with respect to the assumed literacy rates and reading habits of the general population. In the United States in the 1920s, written material proved ineffective particularly among less schooled and more marginalized groups, and interventions involving personal contact by nurses had a greater impact on infant mortality (Moehling and Thomasson Reference Moehling and Thomasson2014). Tampere had a relatively high literacy rate, with 71% of adults being able to both read and write according to the 1910 census (SVT 1914), and an evolved literary culture, including a worker’s college (työväenopisto) (Lammi Reference Lammi1949). The circulation rates of the largest newspapers, Aamulehti and Kansan Lehti, were 13,800 (1915) and 11,000 (1916), respectively (Tommila et al. Reference Tommila, Nygård and Salokangas1987). Nevertheless, direct and personal forms of intervention have been found most effective across different contexts, including rural Finland in the late 19th and early 20th centuries (Saaritsa et al. Reference Saaritsa, Simanainen and Ristola2023). In Tampere, interpersonal interventions were less routine and left to heterogeneous actors with unfocused mandates and a varying potential for personal engagement. Less literate and less compliant citizens might have been less influenced by such attempts at modifying their behavior.
Furthermore, hand hygiene was critical in limiting the spread of typhoid. However, in official communications from 1915–1916, Tampere city authorities primarily recommended that people boil all water; the importance of washing hands, preferably using soap or disinfectants, was mentioned less frequently. Boiling water is also not unproblematic. It has sometimes been found to be ineffective, with merely 18% of boiled drinking water proving entirely free of coliforms in a study done in Karachi, Pakistan, in 2000 (Luby et al. 2000: 5). It is also costly in many ways, creating disincentives. In some contexts, the availability and price of firewood itself might be prohibitive (Gilman and Skillicorn Reference Gilman and Skillicorn1985), although Finland is known to be densely wooded. A household budget study suggests “heat and light” accounted for 4.8% of total household expenses in Tampere in 1908–1909 (Hjelt Reference Hjelt1912: 60). During the war years, the price of firewood increased faster than the cost of living until 1916, while the earnings of factory workers were declining.Footnote 10 But constantly boiling water also required a considerable increase in housework. Here, a question of importance was ease of access to cooking facilities. In Tampere in 1916, kitchens were often shared, potentially crowded, and described as sites of conflict and bickering (Kanerva Reference Kanerva1994: 23–24). For similar reasons, chemical methods have been strongly recommended in place of boiling in modern times (Mintz et al. Reference Mintz, Bartram, Lochery and Wegelin2001). In Tampere, it took until the beginning of March 1916 for the authorities to commence centralized chlorination efforts targeting the whole population. Until then, households had to rely on their varying private capabilities to maintain hygiene.
Data and variables
The material relating to the epidemic in Tampere makes it possible to construct a database on the typhoid patients and analyze the statistical determinants of the differences in the timing of infection. The individual-level data is based on several interlinked, previously unused sources. The records of the temporary typhoid hospitals, which provide the names, ages, occupations, addresses, dates of entry, diagnoses, and outcomes of treatment (recovered, partially recovered, dead), form its core.Footnote 11 After extensive cleaning, the data revealed a total of 2,692 individual cases, 2,472 of which received a typhoid diagnosis. Similar data was collected for 362 patients in the public general and infectious disease hospitals, bringing the total to 2,834.Footnote 12
As the key dependent variable in our analysis is the timing of infection, it is critical to determine when people fell ill with as much accuracy as possible. The date of hospital admission is typically clear, but there can be nonrandom differences between groups in delays in hospitalization after the onset of symptoms. In light of the staggered response to the crisis, admission was also affected by the opening dates of the temporary hospitals, especially in February (Figure 3). Altogether, 23% of all hospitalizations of typhoid patients occurred on dates when new hospitals were opened; before March, the share was 54%. A cross-check is provided by the independently recorded notifications of cases of contagious disease by municipal doctors, which contain dates, names, ages, and diagnoses.Footnote 13 They were typically given either on the date of hospitalization or before it, with the exception of some children who were hospitalized first and notified afterward. However, notifications prepared by doctors were apparently also contaminated by the opening dates of the temporary hospitals. Peaks on or prior to hospital openings were evident, and on certain dates, large numbers of notifications were evidently prepared in a rush.Footnote 14 It is also possible to try to use the times of onset reported by patients or their families in a patient follow-up survey. Instead of contamination by administrative exigency, in such instances, problems could be related to recall and self-diagnosis.Footnote 15

Figure 3. Temporal distribution of cases based on hospitalizations (top) and hospitalizations adjusted based on doctor’s notifications and self-reported onset (bottom); the vertical ticks indicate opening dates of temporary hospitals.
When choosing the earliest available date from the three sources, a total of 1,109 of the original 2,834 cases receive an earlier date based on notifications by municipal doctors, and in 452 instances the timings of infection are further changed based on the patient survey. Figure 3 shows that the distribution of timing thus becomes more realistic. However, nearly 22% of cases still coincide with the date of opening of a temporary hospital. Prior to March, the share fell about 13 percentage points to approximately 41%. However, a drastic increase in the number of cases occurs on the 28th and 29th of February, which is driven by notifications by doctors and likely influenced by the forthcoming opening of a hospital on March 1st. Therefore, these dates should also be considered problematic. When they are included, 26% of all cases and 55% of cases of a person falling ill before March 1st still involve dates with a probable measurement error, which we will control for in the analysis. The improvements are modest in this sense, likely because the survey forms provide dates for only 586 cases, with only 5% of them occurring in February. Appendix Figure 2 shows the variation in temporal distribution among the different linked samples discussed in this section.
As for the explanatory variables, address calendarsFootnote 16 make it possible to link street addresses with buildings and districts, which further makes it possible to control for neighborhood effects and link some of the observations to a housing survey conducted in 1914–1915 by the city health authorities at the request of labor organizations.Footnote 17 This provides detailed data on relevant housing characteristics important for understanding the interaction between the material environment and behavior. Variables captured in this respect include having shared kitchens, access to water outside the house, shared latrines, and having access to a separate laundry house.
After attaching GIS coordinates to the addresses using a map from 1916, we constructed an interdependent buffer variable to measure the number of hospitalized cases within a 50-meter radius of a patient’s home during the 30 days prior to onset. The aim is to control for a contagion risk directly related to the number of infected persons living nearby. The variable also measures the general presence of typhoid in people’s immediate surroundings, which may have influenced their behavior. Appendix Figure 3 shows that this indicator changed dramatically over the course of the epidemic. Furthermore, distance to the nearest hospital has been controlled for. Based on the GIS coordinates, we also created a complete animation of the course of the epidemic in the city (digital Appendix 1).
The sources contain an exceptional attempt to capture health behavior within households. The health authorities conducted a survey targeting each affected family with questions on the time of onset of the illness, water sources, whether water for cooking, washing dishes, or bathing had been boiled, and “socializing” (seurustelu).Footnote 18 The survey was conducted through home visits, during which time surveyors interviewed family members if the patient was still hospitalized. The variables we created based on the information focus on the uses of unboiled water. Not everyone drank water with meals, and traditional home-brewed ale with a low to moderate alcohol content (kotikalja) was a popular substitute. Responses were only coded accordingly if they explicitly indicated the consumption of unboiled water. Additionally, we examined the section on “socializing” to identify a significant minority of responses where the infection was attributed to an obviously false cause, such as “getting cold” or touching supposedly contaminated Russian cotton in a factory.Footnote 19 We used these to construct an experimental indicator for the expressed lack of awareness of typhoid transmission mechanisms.
In terms of occupations, it is important to note that distinctions relevant to the analysis can be related to epidemiological exposure rather than socioeconomic status. For instance, traditionally low-status outworkers may have been less at risk than factory workers if the latter worked in more crowded conditions, whereas live-in servants might have been protected by the better facilities and hygienic discipline of the employing wealthy households. This is why a HISCO-style (Leeuwen Reference Leeuwen2011), ordinal-hierarchical reasoning is inadequate here (Rijpma et al. Reference Rijpma, van Dijk, Schalk, Zijdeman and Mourits2022). The categories we applied in this study reflect historically and contextually defined types of labor, with different implications for disease risk. Children were typically ascribed to their parents’ occupation in the hospital records. Schoolchildren might be classified as pupils or denoted by their parents’ status. Due to high female employment in the city, it was not always evident that occupation referred to fathers; married women frequently had recorded occupations. Others may have been listed as wives of a man holding a specified occupation. Although a classic problem, it can be argued from an epidemiological standpoint that information on the activity of a parent or spouse may be relevant for exposure. On this basis, all cases were coded based on the available information.
The hospital records analyzed in this study are limited to public hospitals. The 1916 annual report of the health board shows that typhoid patients were also treated in the Finlayson factory hospital (55 patients) and at the local private hospital (29 patients).Footnote 20 It is possible that some overlap may exist between public and private hospital records, as patients may have been transferred. The elite may have avoided public hospitals altogether and may even have left the city for Helsinki, despite a travel ban being implemented on February 23rd for potentially infected individuals without a permit.
After extensive efforts to cross-check data and reduce errors, less than 3% of patients remained without identifiable addresses in the city. GIS mapping was hampered in certain districts by the lack of proper plans or knowledge of house locations. The housing survey prioritized working-class districts, and the level of certainty in linking responses varied; in some cases, residents could be identified, while in others only the apartment or building could be matched. Given the focus on shared facilities in this study, identifying the house was sufficient in most cases.
Of the more than 2,000 patient follow-up survey forms in the archives, only 1,529 could clearly be linked to cases in the data. For questions pertaining to household-level matters, such as water handling, responses were linked to other members of the household who did not have their own form.
Table 1 shows overlap and attrition in the number of cases with different data combinations; during the analysis, the robustness of the results has been tested by repeating baseline analyses with the more limited linked samples and checking for balance in the observable characteristics.
Table 1. Typhoid cases in data, linked sample sizes

Due to our focus on behavioral aspects, we were unable to construct a non-infected control group since we lacked the necessary information for the entire population. As a result, our analysis is limited to the population that eventually became infected. Our estimates pertain only to the speed at which illness occurred among those persons who eventually fell ill, conditional on covariates. This approach is similar to the design used by Tuckel et al. (Reference Tuckel, Sassler, Maisel and Leykam2006). Our data selection is based on falling ill in the first place, so using our estimates to evaluate the general risk of infection would invite possible bias. For instance, the speed of infection among the infected does not always correlate with the final incidence of disease in city district populations. However, the analysis reveals far more about the mechanisms of infection than would be possible without the patient data variables. It is plausible that many of the individual-level variables identified will also be determinants of falling ill in the first place. The use of polluted water, for example, is an obvious proximate cause of infection.
We maintain a focus on morbidity and do not use mortality as proxy or worry about the determinants of CFR as a source of bias. Table 2 compares the age structure of the typhoid cases in the data to that of the entire city in the 1910 census. It shows that among the patients, those in the age group 10–29 years were clearly overrepresented. While Whipple and Sedgwick (1908: 105–105) suspect that children probably had higher morbidity than suggested by U.S. mortality statistics, our data shows that in Tampere, “youth and middle-aged persons“ also comprised the largest groups in terms of morbidity. The death rates seemingly suggest that typhoid was more common among males, but in fact, the morbidity data contains only approximately 42% of males, reflective of the overall city population. However, males made up 46% of all fatalities, thus being overrepresented, indicating a higher CFR. These differences demonstrate how direct data on morbidity improves accuracy.
Table 2. The age structure of the population of Tampere in the 1910 census and the data

Sources: Census 1910: SVT 1914. Väenlasku Tampereella joulukuun, 7 p., 1910: Taululiitteet. Vol. 4. VI 44. Tilastollinen päätoimisto.
Appendix Table 1 shows that morbidity relative to the 1910 census population was highest in certain working-class neighborhoods, namely Amuri (IV, V), the northern, poorer parts of Tammela (XIV, XV), and the outlying Ratina (XIII). In terms of occupations, while the categories are not directly comparable, with “industrial” and “other” laborers making up approximately 59% of the population in the zoned part of the city in 1910, we find that industrial workers, other laborers, artisans, outworkers, and skilled workers account for approximately 69% of all typhoid patients in our data. This suggests working-class overrepresentation. Contemporary analysis observed the high prevalence of the disease in “crowded worker districts” (Hällström Reference Hällström1917: 89). As our analysis will show, however, occupation or neighborhood were ultimately not very informative as determinants of the speed of infection among the infected.
Methods
We apply survival analysis to model factors related to faster or slower contagion rates among the eventually infected population, using Cox proportional hazards regressions (Cox Reference Cox1972). We define the epidemic as having started on November 15th, 1915, after which the cases are deemed as “at risk.” An increase in typhoid cases reported by the city doctor was notable by November (12 in total), as opposed to in September-October (four each) (Hällström Reference Hällström1917: 11–12), with a surge in December (117). When a person falls ill, they “fail” from a survival analysis perspective. Many became sick on the same day. We use the Breslow method for resolving ties.Footnote 21 We initially did not censor the data at any point prior to the end of 1916, but our results are tested for robustness to truncation at relevant points.
Constant proportionality of hazards is a requirement for the accurate estimation of the size of group differences in terms of relative risk in Cox regressions. Characteristics of the Tampere epidemic raise concerns about time-varying effects. The impact of the same factors might vary over time, and in some cases even change direction, which cannot be accounted for by a single, proportional hazards estimate and may result in inaccuracies. For instance, water was contaminated until March 1st, but the threat was considerably reduced as a result of chlorination, which could have prompted a change in the statistical determinants of falling ill. While the precise level of the estimates is of less interest than the overall structure of associations, the estimates are diagnosed and refined with time-varying specifications where appropriate. In certain analyses, it has also been possible to apply linear probability models with separate time variables. In our analyses, each variable of interest is first added in a separate Cox regression one by one, and then at the same time in a multivariate model. Reporting univariate estimates is common in similar studies (Ekamper and Poppel Reference Ekamper and Poppel2019) and can be informative when dealing with saturated models.
Results
The baseline models reported in Tables 3 and 4 show some predictable variation in proportional hazards by occupation and city district. Artisans, including occupations like seamstress (over a fifth of the group), smith, butcher, or tailor, were significantly associated with faster infection rates in univariate modeling, whereas employees, denoting salaried workers with a higher occupational status and often permanent, public-sector contracts such as policemen, postal workers, teachers, and office workers, were consistently slower to catch the disease. Membership in major occupational groups, like industrial workers, did not predict the speed of infection, however. District IV, at the heart of the Amuri neighborhood, is associated with faster than average infections, but so is the affluent and central district VI, where the patients actually had a working-class profile.Footnote 22 The hospital for infectious disease was located there, as were major industrial employers and the hall of the Worker’s Association (Työväentalo). Since the final incidence of typhoid was low in district VI (Appendix Table 1), the data helps reveal conditions at a subpopulation level. Some patterns matched income levels: the wealthier Kyttälä neighborhood was associated with slower contagion, and in working-class Tammela there was a gradient from north to south. The lower risk district XIII and Pispala neighborhood were unplanned zones with worker families living in cottages and drawing water from wells, which might have provided initial protection. Since the final incidence rate in district XIII was high, the timing may say something about the mechanisms of transmission. All in all, standard occupational and ecological variables provide limited information on the mechanisms at play.
Table 3. Cox proportional hazards regressions based on daily infection risk among the eventually infected, baseline and occupations

Notes: Modeling is based on time to infection from Nov 15th, 1915. N represents patients. Proportional hazards and z scores are shown in parentheses. The reference category in the multivariate model is Other labor. 30d, 50m is a variable measuring the number of other cases within a 50-meter radius of the patient’s address during the previous 30 days. Distance is the distance to the nearest typhoid hospital. *p < 0.1; **p < 0.05; ***p < 0.01.
Table 4. Cox proportional hazards regressions based on daily infection risk among the eventually infected, city districts

Notes: Modeling is based on time to infection from Nov 15th, 1915. N represents patients. All models include occupational controls. The reference category in the multivariate model is District IX. 30d, 50m is a variable measuring the number of other cases within a 50-meter radius of the patient’s address during the previous 30 days. Distance is the distance to the nearest typhoid hospital. Proportional hazards and z scores are shown in parentheses. *p < 0.1; **p < 0.05; ***p < 0.01.
In addition to age and sex, we add a dummy for dates where an effect from the opening of temporary hospitals is observed in the models. The idea is to control for the random increase in risk caused by measurement errors on those days. The control is statistically highly significant and associated with a 3.5-fold increase in the risk of failure. The GIS-based variables on other nearby typhoid cases and distance to the nearest hospital display proportional hazards of close to one, implying they were not substantively important even if they were statistically significant.
The physical environment
Table 5 describes the distribution of relevant housing characteristics by district and in the linked part of the data. The housing survey focused on older and more central districts of the city, but the occupational profile remained comparable to the full dataset.
Table 5. Share of relevant amenities by city district and in total based on housing survey data
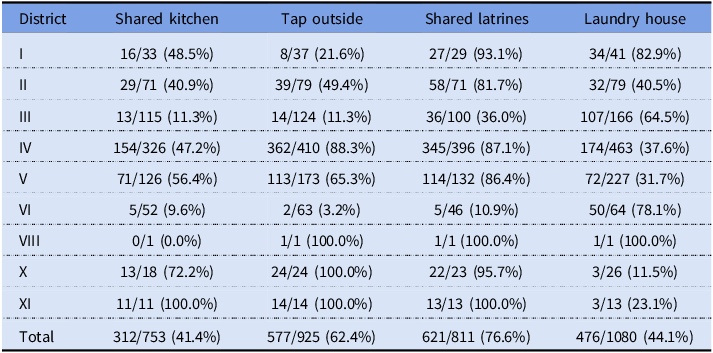
Notes: Numbers represent patients with the amenity and total numbers of patients by district and in total based on the records linked to the housing survey of 1914–1915 containing answers to the questions. The table only includes districts with patients with linked records.
Shared kitchens were a potential problem in more ways than one. Although in districts like Amuri the stoves were specially designed and had several hearths, one might still expect crowdedness and hassle, which might have discouraged the constant boiling of water demanded by the authorities. At about 41%, shared kitchens were quite common among the surveyed population. Although Amuri has traditionally been famous for this arrangement, Table 5 shows that shared kitchens were prevalent across the city.
More than 60% of the surveyed households got their water from a tap outside. This meant extra work, reducing the time available for activities like boiling water. On the other hand, having a tap in the kitchen made access so easy that it might have increased the risk of direct consumption of contaminated water. Some responses in the survey seem to indicate that drinking water “from the tap” was considered unproblematic, with people mentioning it in response to questions about boiling water. Differences in prevalence between districts resembled those regarding shared kitchens. District VI, associated with early infections, had a quite high frequency of indoor taps, which could have been linked to some early exposure.
Most toilets in Tampere in 1916 were pit latrines, with the share of housing with water closets being between 10% and 20% at the time (Peltola and Saaritsa Reference Peltola and Saaritsa2019). The majority were shared latrines used by several households (77%). The lack of a water source on-site may have constituted a risk factor, as typhoid is transmitted via the fecal-oral route. Having access to a separate laundry house might have facilitated washing soiled textiles, a potential vector of transmission. Considerable effort was spent on washing textiles in the hospitals (Hällström Reference Hällström1917: 32). Laundry houses also had big, fixed cauldrons for boiling large amounts of water at one time.
Table 6 presents Cox estimates on dummy variables for the four housing characteristics.Footnote 23 The results show a strong association between shared kitchens and faster infection rates. The univariate estimate is highly significant and would suggest an approximately 28% higher risk of infection on a given day. The estimates for having a tap outside or shared latrines are imprecise and lack statistical significance. However, having access to a laundry house is seemingly associated with slower infection rates, reducing the average daily risk by more than 10%. Including all four variables simultaneously leads to a loss of statistical significance for shared kitchens and a drop in the implied proportional hazard, while the estimate for laundry houses is robust.
Table 6. Cox proportional hazards regressions for daily infection risk among the eventually infected, housing and amenities

Notes: All models include baseline, occupational, and city district controls. Modeling is based on time to infection from Nov 15th, 1915. N represents patients. Variation in N is based on response rates to individual questions; the results are robust to limiting to smallest N (appendix table 3). Proportional hazards, z scores shown in parentheses. *p < 0.1; **p < 0.05; ***p < 0.01.
Diagnostics indicate that the effects of the statistically significant variables are time-varying, meaning that the association of the housing characteristics with infection risk changed over the course of the epidemic. While a problem in theory, the changes actually provide valuable information on the potential mechanisms of transmission. Plotting the Schoenfeld residuals on time (Grambsch and Therneau 1994) shows a visible change in estimated risks from around March 1st, when chlorination was initiated (Figure 4). In the case of shared kitchens, there is clear gradual attenuation towards zero, while the plot still remains positive. This might suggest that the discouraging effect of shared kitchens on boiling water significantly increased infection risk prior to chlorination. After chlorination, only some of the risk related to factors other than water remained, like several families handling their food in the same space. The locally weighted moving average implies that having access to a laundry house might have meant slower contagion spread before chlorination, but possibly even slightly faster after it, perhaps because the facility was shared by multiple households.

Figure 4. Proportional hazards diagnostics over the course of the epidemic for shared kitchens (left) and laundry houses (right); the vertical tick indicates the introduction of chlorinated tap water.
The time-varying estimates presented in Appendix Table 4 show that the estimated positive and negative proportional hazards from those factors prior to chlorination were larger when controlling for the change that followed chlorination. The results suggest that the specific physical characteristics of where one lived mattered for the speed of infection, but that this inequality was significantly mitigated by the chemical purification of water initiated by the authorities during the crisis.
Behavior and knowledge
The first column in Table 7 presents shares of respondents who had reported drinking unboiled tap water. This constituted a minority of about 15% but still a quite noteworthy percentage considering the emphasis on not doing so by the authorities and the press since December. While working-class districts like Amuri (IV) and particularly southern (and less poor) parts of Tammela (XV, XVI) stand out, others do as well: in the central district II, nearly a third of people reported consuming unboiled water. Over half of the district II population had tap water in their apartment, even though this was not unique.
Table 7. Reported use of unboiled water for different purposes and prevalence of flawed statements about typhoid transmission by city district and in total based on patient survey data

Notes: Numbers represent patients who responded positively and total numbers of patients by district and in total based on the records linked to the patient follow-up survey containing answers to the questions. The table only includes districts with patients with linked records.
Boiling all use water was the clear recommendation during the crisis, and it obviously had not been followed by many people. The variation in responses regarding different types of water use can be seen as a reassuring indication of the reliability of the data, as opposed to a scenario where people consistently report boiling all water, which might suggest socially desirable responding. Using unboiled water for washing dishes or washing up was much more common than drinking it. Over half of the respondents had used unboiled water for washing up. Washing up at home was limited in working-class households, with actual baths being taken during weekends in public saunas, of which there were several around Amuri, for instance (Kanerva Reference Kanerva1994). The relative differences by district appear similar with respect to different uses of water, but the levels increase markedly when moving from drinking to washing dishes to personal hygiene.
Table 8 presents estimates on dummies for using unboiled water for different purposes.Footnote 24 Unsurprisingly, drinking potentially contaminated water was associated with elevated typhoid risk. Interestingly, the estimate on using unboiled water for washing up is even higher. This suggests that behavior like washing your face without boiling the water first could have constituted a quite significant risk factor. Neglecting to boil water was also most common in this category of risk behavior related to water use.
Table 8. Cox proportional hazards regressions for daily infection risk among the eventually infected, using unboiled water

Notes: All models include baseline, occupational, and city district controls. Modeling is based on time to infection from Nov 15th, 1915. N represents patients. Variation in N is based on response rates to individual questions; the results are robust to limiting to smallest N (appendix table 6). Proportional hazards, z scores shown in parentheses. *p < 0.1; **p < 0.05; ***p < 0.01.
The effects of boiling water again had a significant time-varying component related to the introduction of chlorinated tap water, which made unboiled water less hazardous for everyone (Figure 5). Cox estimates are much higher when controlling for this variable with time interactions (Appendix Table 7), suggesting that the risk of infection per day might have more than doubled when using unboiled water and that using unboiled water for washing up was associated with faster infection rates even more strongly than drinking unboiled water prior to chlorination.

Figure 5. Proportional hazards diagnostics over the course of the epidemic for using unboiled water for drinking (left) and using unboiled water for washing up (right); the vertical tick indicates the introduction of chlorinated tap water.
We also constructed an indicator for responses that seemed to reflect flawed understandings of the transmission mechanism of typhoid – a matter repeatedly covered in the public information campaign. In the section asking about “socializing” (seurustelu) habits, many respondents advanced their own theories on the sources of infection. Some listed plausible channels like interacting with sick people or “drinking raw water” (on juonu raakaa vettä). Large numbers, however, gave less credible explanations. Many attributed the disease to being exposed to cold weather while outdoors, which had presumably caused the flu-like symptoms that then progressed to typhoid. Other explanations included exhausting working conditions in the factories or touching presumably contaminated Russian cotton. When excluding even partially plausible explanations, approximately 22% of respondents provided explanations that were medically incorrect. A high prevalence of incorrect explanations was observed in some working-class areas, such as southern Tammela, but also in areas with many residents from higher socioeconomic backgrounds, including the affluent Kyttälä (XI) neighborhood and the central district II.
Was there an association between a deficient understanding of the transmission of the disease and becoming infected more quickly? Table 9 presents Cox regressions as the indicator. At the outset, this variable would seem to be significantly associated with the speed of infection, also when controlling for water use variables. Nevertheless, there is an evident source of bias: overwhelmingly, the most common (95%) false explanation offered was exposure to cold, and since the epidemic took place over course of the spring, this response could cause a spurious correlation with the speed of infection. Late cases in the data had fewer chances to blame infection on the cold weather.
Table 9. Cox proportional hazards regressions for daily infection risk among the eventually infected, false explanations

Notes: All models include baseline, occupational, and city district controls. Modeling is based on time to infection from Nov 15th, 1915. N represents patients. Variation in N is based on response rates to individual questions; the results are robust to limiting to smallest N (appendix table 8). Proportional hazards, z scores shown in parentheses. *p < 0.1; **p < 0.05; ***p < 0.01.
The final case with flawed explanations in the survey fell ill on May 12th. This date can be used to truncate the data and determine if excluding those cases that failed when it was no longer possible to blame the weather makes a difference. This leads to a collapse of the proportional hazard. The same pattern does not occur with any of the variables on using unboiled water – instead, their estimates are increased. The statistical association between false explanations and the speed of infection therefore seems to be an artifact of seasonality and does not constitute reliable evidence of a connection between deficient knowledge and infection speed.
Time, constraints, and boiling water
Can the hypothesis that the connection between housing characteristics and typhoid worked primarily through boiling water be directly supported? Although the linkage between hospital records, the housing survey, and the patient survey reduces the number of available observations to 371–550, depending on the number of variables, it provides an opportunity to investigate whether risk behavior was influenced by material constraints or knowledge constraints.
While the water use variables have no dates, the use of unboiled water was clearly related to time, as can be seen from the shares reported by patients at different stages of the epidemic (Table 10). Despite the public campaign launched in December 1915, many did not follow the recommendations to boil water. This was the case particularly in the early phase of the epidemic when water was not chlorinated and boiling would have been especially important. About one in four new patients reported drinking unboiled water in the period prior to March 1st, compared to approximately 9% in the period after that. The prevalence of using unboiled water for washing was well over 70% prior to chlorination. One could ask whether the introduction of chlorination in its own right and related measures like boiled water distribution, paradoxically also worked to increase awareness and change behavior. It seems there was a particularly large drop in the share of new patients who reported having used unboiled water during the month of March – especially late March, when new cases as well as cases in the vicinity of the patients, based on GIS mapping information, had also peaked. Considering the incubation period, this might indicate a reduction in risk behavior around the time chlorination was initiated. Later, there was a slight rebound.
Table 10. Reported use of unboiled water for different purposes over the course of the epidemic from Nov 15th, 1915 to Dec 31st, 1916

Note: Numbers represent patients who responded positively and total numbers of patients by period based on the records linked to the patient follow-up survey containing answers to the questions.
The drop in shares over time could in principle be caused by three different factors. People might have boiled water more often as cases multiplied, learning from observation and reassessing their risks. People might also have been more inclined to report that they had boiled water as awareness and social pressure increased. Finally, in a dataset consisting of cases sequenced based on the time of infection, the observation could be spurious. Those who used unboiled water became ill faster than others, even if no-one changed their behavior during the epidemic. In all cases, it is necessary to try to control for time while attempting to estimate the role of housing characteristics or knowledge in people’s decisions to boil water. We model the likelihood of reporting unboiled water use with a linear probability regression model based on relevant housing characteristics while entering time in days and time squared into the specification.Footnote 25
Table 11 shows that after controlling for time, there is still a positive and significant association between shared kitchens and using unboiled drinking water, although when all water use variables are entered simultaneously, the estimate becomes imprecise, and statistical significance is lost (p=.12). As a naïve comparison, one can observe that out of the 399 linked typhoid cases with the variables available, 24% of those with shared kitchens and only 11% of those without them reported using unboiled drinking water. This lends support to shared kitchens being a part of the mechanism. The findings on using unboiled water for washing are less clear (Appendix Table 9).
Table 11. Linear probability model (OLS) for reporting the use of unboiled drinking water based on housing characteristics

Notes: All models include baseline, occupational, and city district controls. Variation in N is based on response rates to individual questions; the results are robust to limiting to smallest N. Robust standard errors shown in parentheses. *p < 0.1; **p < 0.05; ***p < 0.01.
The variable for lacking an understanding of the transmission mechanism was not significant in any estimation, with or without the water use variables (not reported). A naïve comparison reveals a difference of only two percentage points in the prevalence of drinking unboiled water between those who provided false explanations and the rest of the patients.
All in all, there is evidence that physical living conditions were related to the speed of infection and some plausible indication that the limits set by housing on the ability to constantly boil water were part of the mechanism. In contrast, having misguided ideas about the transmission mechanism cannot be identified as a factor in the speed of infection. In the models shown in Table 11, the control variable for number of cases within a 50-meter radius over the past 30 days is also significantly associated with the reduced probability of using unboiled water. This suggests there might also have been a demonstration effect from the growth of cases in everyone’s vicinity, motivating people to reduce their risk behavior.
Conclusions
Our results elaborate on the dynamics of infection during an urban epidemic using data that makes it possible to discern unequal patterns of structure and agency in greater detail than in many previous studies. According to our findings, patients in Tampere likely became sick more quickly if the physical constraints of their everyday lives prevented them from engaging in disease avoidance behavior by boiling water. Concrete problems caused by shared kitchens or lack of access to laundry houses were more decisive than socioeconomic status or neighborhood, or the lack of information.
Our estimates show that drinking contaminated water was demonstrably unhealthy, but also using contaminated water for personal hygiene carried an elevated risk. The immediate and most persistent response of the authorities was to call on people to boil all the water they used – a common, costly, and sometimes ineffective recommendation in similar circumstances. Particularly in the early phase, the significant number of working-class people who lived in housing with shared kitchens were more prone to rapidly become infected, whereas those with access to laundry houses contracted the disease more slowly. Further elaboration suggests that shared kitchens complicated the constant boiling of water. They also potentially carried an elevated risk of contamination through food, as several households handled groceries in a crowded space. Laundry houses may have facilitated boiling water as well as maintaining cleanliness, but the mechanism was less clear.
At the beginning of March, the city introduced chlorinated tap water and publicly distributed boiled water, which had an impact on how quickly the disease spread. The importance of using unboiled water and having shared facilities diminished as water became less dangerous. Collective measures leveled the playing field and brought the biggest benefits to those unable to take costly and complicated private measures to avoid the disease within their crowded homes. Similar to findings in studies on the introduction of antibiotics, the impact of the measures was more pronounced in contexts where controlling infections through other means was more challenging (Vecchi Reference Vecchi2017; Alsan et al. Reference Alsan, Atella, Bhattacharya, Conti, Mejía-Guevara and Miller2021: 112).
Lack of knowledge or noncompliance with recommended measures are also risk factors during epidemics, and messaging about the nature of the problem and the importance of disease avoidance behavior is a common course of action. In Tampere, authorities relied heavily on providing written communication to the public, though a significant minority of persons were still illiterate, and placed much less emphasis on monitoring or offering preventive advice delivered person to person. This strategy may not have been optimal. Our data suggests that compliance with the primary recommendation of boiling water was highly imperfect, especially in the critical initial stages when water was still heavily contaminated. Following official guidelines seems to have increased only later and in tandem with the large-scale measures that made it less important for disease avoidance but may have worked to increase awareness. This is an interesting finding in terms of behavioral dynamics during pandemics. The responses given by patients in the follow-up survey also suggest that a significant minority of them were not aware of how typhoid was transmitted, regardless of the tens of thousands of information booklets distributed to citizens. Nevertheless, demonstrated ignorance did not have any statistical connection with becoming ill faster or with violating guidelines for boiling water. Factors related to the immediate living environment, and the extent to which they facilitated or hindered disease avoidance, were more important than simply having knowledge about the risks.
Previous studies discussed in the introduction have often attached great significance to individual-level variables that are available in historical sources like censuses, such as ethnicity. By introducing direct measures of behavior and of material constraints to behavior, we have been able to better identify the proximate causes of inequality in the spread of an epidemic. Our contribution hopefully helps refine the analysis of urban morbidity and mortality differences even in cases where similar, rare data is not available.
Supplementary material
The supplementary material for this article can be found at https://doi.org/10.1017/ssh.2023.34
Acknowledgments
Funding from the Academy of Finland and the Faculty of Social Sciences of the University of Helsinki is acknowledged by Saaritsa. The authors would like to thank the numerous audiences and discussants of our presentations at the Social Science History Association Annual Meetings 2018, 2019, and 2021, Lund University Department of Economic History 2019, The European Historical Economics Society meeting in 2019, The 3rd and 4th Sound for Seniors Workshops in 2018 and 2019, The European Society for Historical Demography conference in 2022, The Finnish Conference on Historical Research in 2019 and 2022, and the Seminar in Economic and Social History at the University of Helsinki in 2019 and 2022 for valuable comments on earlier versions of this work. While we may have inexcusably forgotten many over the extended course of the project, we have benefited from comments by Eric Schneider, Kota Ogasawara, Volha Lazuka, Maria Stanfors, Tommy Bengtsson, Martin Dribe, George Alter, Heini Hakosalo, Hanna Kuusi, and Sarah Rafferty, among others. Sanni Saarinen and Eero Simanainen provided excellent, vital research assistance for the project.


