


1. Introduction
Plants constantly update their internal state to adapt to the surrounding conditions, and the signalling pathways involved in this process can be extremely fast. This is particularly exemplified by the root response to gravity. Root gravitropism allows to correctly orient the seedling primary root in the soil. In a matter of seconds after gravistimulation, the root columella cells sense the new gravity vector and trigger a signalling cascade to adjust the root growth towards it (Band et al., Reference Band, Wells, Larrieu, Sun, Middleton, French, Brunoud, Sato, Wilson, Peret, Oliva, Swarup, Sairanen, Parry, Ljung, Beeckman, Garibaldi, Estelle, Owen and Bennett2012). Gravitropic response depends on the rapid redirection of fluxes of the phytohormone auxin in the columella cells, on auxin flux towards the lower side of the root (Luschnig et al., Reference Luschnig, Gaxiola, Grisafi and Fink1998) and on auxin accumulation, perception, and response in the lower epidermis of the root (e.g., Bennett et al., Reference Bennett, Marchant, Green, May, Ward, Millner, Walker, Schulz and Feldmann1996; Swarup et al., Reference Swarup, Kramer, Perry, Knox, Leyser, Haseloff, Beemster, Bhalerao and Bennett2005). Quantification of gravitropic performance is therefore often used as a benchmark for mutants of genes involved in auxin transport, perception, and response (Liu, Reference Liu2012; Luschnig et al., Reference Luschnig, Gaxiola, Grisafi and Fink1998; Retzer et al., Reference Retzer, Akhmanova, Konstantinova, Malínská, Leitner, Petrášek and Luschnig2019; Samakovli et al., Reference Samakovli, Roka, Dimopoulou, Plitsi, Žukauskait, Georgopoulou, Novák, Milioni and Hatzopoulos2021).
Technologies and methods in imaging are continuously evolving, increasing in sensitivity and spatiotemporal resolution (Fendrych et al., Reference Fendrych, Akhmanova, Merrin, Glanc, Hagihara, Takahashi, Uchida, Torii and Friml2018; Goh, Reference Goh2019; Grossmann et al., Reference Grossmann, Guo, Ehrhardt, Frommer, Sit, Quake and Meier2011; Ovečka et al., Reference Ovečka, Vaškebová, Komis, Luptovčiak, Smertenko and Šamaj2015; von Wangenheim et al., Reference von Wangenheim, Hauschild, Fendrych, Barone, Benková and Friml2017). However, image analysis represents a bottleneck in data acquisition as it is time consuming and laborious. Turning images into numbers is particularly important to avoid cherry picking and misinterpretations. Furthermore, quantifications allow researchers to make conclusions based on proper statistical analysis. For these reasons, reproducibility of measurements is crucial, especially for tasks that are subjective (Lee & Kitaoka, Reference Lee and Kitaoka2018). This is particularly the case for manual measurements of root bending as the lines to quantify the angle are usually set subjectively in software such as ImageJ. This process is then prone to human unconscious bias (Jost & Waters, Reference Jost and Waters2019; Lazic, Reference Lazic2018; Nickerson, Reference Nickerson1998). Furthermore, manual measurement of root angles is a very laborious process, and there is no consensus on how to measure the angle of a root bending over time. In most cases, only the angle after a certain amount of time is measured (e.g., Cséplő et al., Reference Cséplő, Zsigmond, Andrási, Baba, Labhane, Pető, Kolbert, Kovács, Steinbach, Szabados, Fehér and Rigó2021; Samakovli et al., Reference Samakovli, Roka, Dimopoulou, Plitsi, Žukauskait, Georgopoulou, Novák, Milioni and Hatzopoulos2021). However, there is a growing number of scientific articles reporting gravitropism dynamics over time (e.g., Marquès-Bueno et al., Reference Marquès-Bueno, Armengot, Noack, Bareille, Rodriguez, Platre, Bayle, Liu, Opdenacker, Vanneste, Möller, Nimchuk, Beeckman, Caño-Delgado, Friml and Jaillais2021; Platre et al., Reference Platre, Bayle, Armengot, Bareille, Marquès-Bueno, del, Creff, Maneta-Peyret, Fiche, Nollmann, Miège, Moreau, Martinière and Jaillais2019; Prigge et al., Reference Prigge, Platre, Kadakia, Zhang, Greenham, Szutu, Pandey, Bhosale, Bennett, Busch and Estelle2020). This approach is a relevant way to quantify root bending as a mutant can respond similarly to a wild type after a defined amount of time but have phenotype restricted in the first stages of gravitropic bending (Serre et al., Reference Serre, Kralík, Yun, Shabala, Slouka and Fendrych2021; Shih et al., Reference Shih, DePew, Miller and Monshausen2015). In this context, implementing tools and workflows such as semi or fully automated image analysis is essential to limit the interaction of the scientists with the images and to produce trustworthy and reproducible results.
Several software tools dedicated to measuring root angles of Arabidopsis thaliana and other species growing on agar media are already available. However, most of them are semi-automated. Furthermore, some require specific imaging setups PlaROM (Yazdanbakhsh & Fisahn, Reference Yazdanbakhsh and Fisahn2012) and RootReader 2D (Clark et al., Reference Clark, Famoso, Zhao, Shaff, Craft, Bustamante, Mccouch, Aneshansley and Kochian2013) or protocol Kinoroot (Basu et al., Reference Basu, Pal, Lynch and Brown2007). Others require manual user input such as fine tuning of various parameters or manually indicating each seedling, e.g., Rootrace (French et al., Reference French, Ubeda-Tomás, Holman, Bennett and Pridmore2009; Naeem et al., Reference Naeem, French, Wells and Pridmore2011). BRAT (Slovak et al., Reference Slovak, Göschl, Su, Shimotani, Shiina and Busch2014) is fully automated but measures the angle between the root vector and the vertical axis of the image and thus could produce artefacts at angles bigger than 90°. These programs mostly rely on traditional image processing such as ridge detection and thresholding. However, machine learning and especially image segmentation by deep machine learning combined with the traditional methods can provide outstanding segmentation results (Bernotas et al., Reference Bernotas, Scorza, Hansen, Hales, Halliday, Smith, Smith and McCormick2019; Fischer et al., Reference Fischer, Besora-Casals, Rolland, Haeussler, Singh, Duchen, Conradt and Marr2020; Hamidinekoo et al., Reference Hamidinekoo, Garzón-Martínez, Ghahremani, Corke, Zwiggelaar, Doonan and Lu2020; Yasrab et al., Reference Yasrab, Atkinson, Wells, French, Pridmore and Pound2019). Deep machine learning segmentation requires prediction models trained with image libraries containing images and corresponding masks. These models can be retrained with updated libraries to expand the range of accuracy.
In parallel to scanned petri dishes, vertical stage microscopy allows high spatiotemporal observation of roots in their natural orientation with respect to gravity. Although this microscopy setup is still not a standard equipment, it continues to grow in popularity as it allows experiments such as the observation of the root gravitropic response in high spatiotemporal resolution and thus, quantification of very small bending angles (Serre et al., Reference Serre, Kralík, Yun, Shabala, Slouka and Fendrych2021; Shih et al., Reference Shih, DePew, Miller and Monshausen2015). However, there is still no solution to efficiently measure root bending angle over time, and measurements of small angles create noisy outputs, so it is important to have reliable measurements for small bending angles.
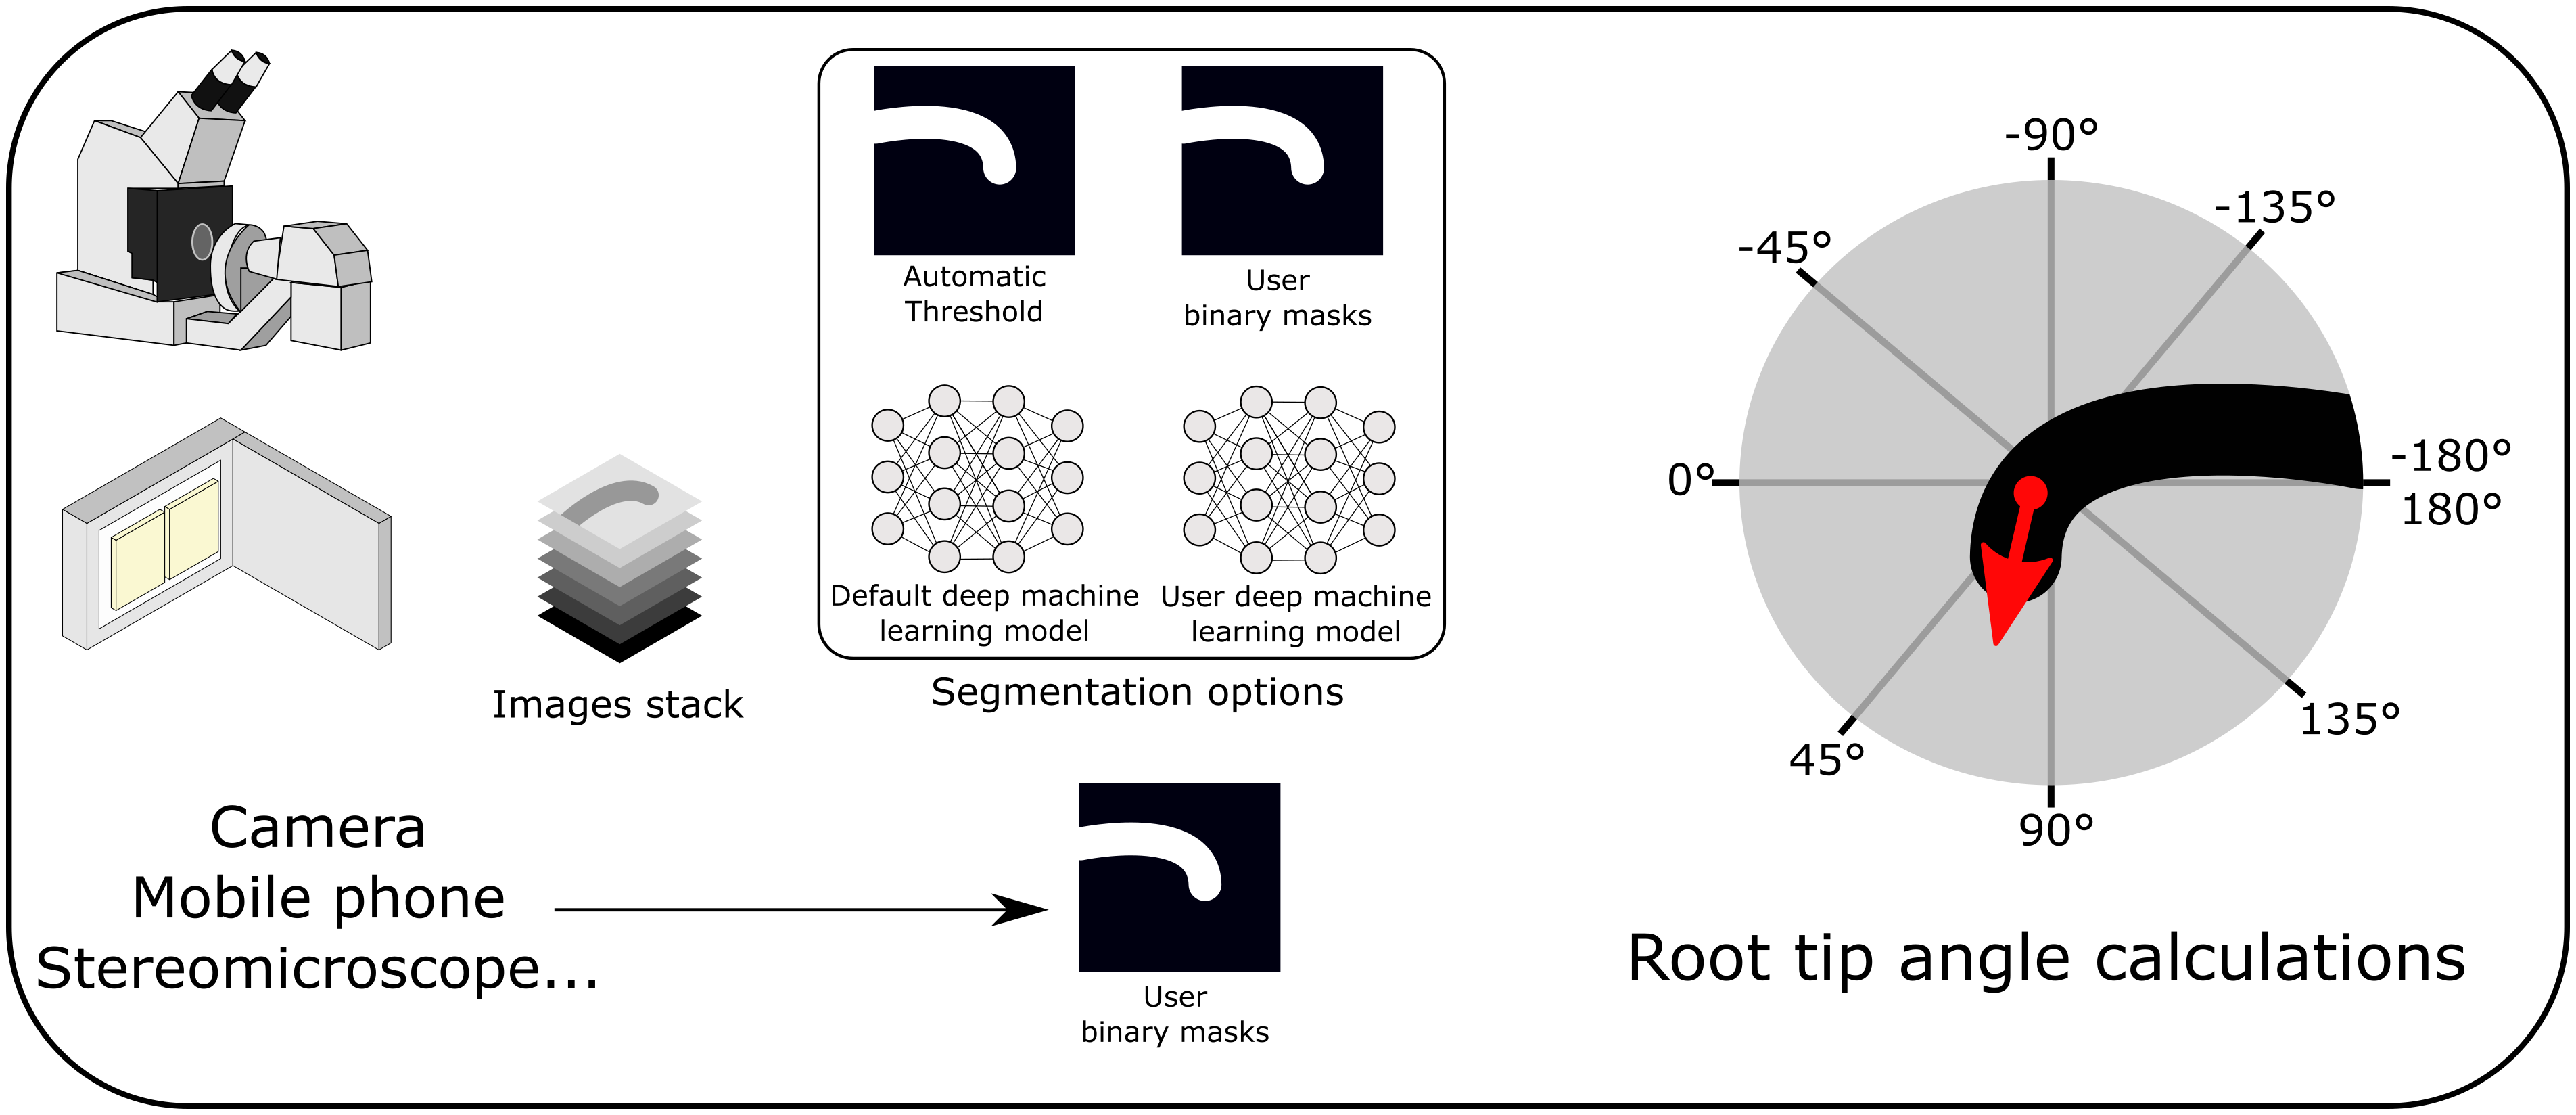
To provide a standard for unbiased automated measurements of root bending angles, we developed ACORBA, which is a fully automated workflow to measure root bending angle dynamics in a 360° space from microscope, scanner, stereomicroscope microscope or camera images. The software offers a flexible workflow based on both traditional image processing (automated or manual) and deep machine learning segmentation to measure root tip angle progression over time from images of gravitropic or waving roots. As the software is automated, it limits human interactions and has high reproducibility. ACORBA will support the plant biologist community by reducing time and labour and by producing quality results from various types of input data.
2. Methods
2.1 Plant material and growth conditions
Wild-type A. thaliana ecotype Columbia (Col0) and aux1 (SALK_020355) were used in this study. The genotype of aux1 was verified by PCR genotyping using the following primers: SALK LB1.3 primer (ATTTTGCCGATTTCGGAAC), aux1-R (AGCTGCGCATCTAACCAAGT), and the aux1-L primer. Poppy seeds (Papaver somniferum) were purchased from a grocery store. Seeds were surface sterilized by chlorine gas for 2 hr (Lindsey et al., Reference Lindsey, Rivero, Calhoun, Grotewold and Brkljacic2017). Seeds were sown on 1% (w/v) agar (Duchefa) with ½ Murashige and Skoog (MS, Duchefa, 1% (w/v) sucrose, adjusted to pH 5.8 with KOH 1 M, and stratified for 2 days at 4°C. Seedlings were grown vertically for 5 days in a growth chamber with 23°C by day (16 hr), 18°C by night (8 hr), 60% humidity, and light intensity of 120 μmol photons m−2 s−1.
2.2 Plant imaging
In the microscopy Sandwich setup, seedlings were placed onto a thin layer of ½ MS medium placed inside a custom 3D printed chambered coverglass (24 × 50 mm). The seedlings were allowed to recover vertically for at least 30 min before gravistimulation. In the Through setup, the roots were growing unobstructed on the surface of the agar, and the imaging was performed through the coverglass and the agar.
Imaging was performed using a vertical stage (von Wangenheim et al., Reference von Wangenheim, Hauschild, Fendrych, Barone, Benková and Friml2017) Zeiss Axio Observer 7 coupled to a Yokogawa CSU-W1-T2 spinning disk unit with 50 μm pinholes and equipped with a VS-HOM1000 excitation light homogenizer (Visitron Systems). Images were acquired using the VisiView software (Visitron Systems) and Zen Blue (Zeiss). We used the Zeiss Plan-Apochromat 20 × /0.8, Plan-Apochromat 10 × /0.45 and EC Plan-Neofluar 5 × /0.16 objectives. Brightfield signal was retrieved using a PRIME-95B Back-Illuminated sCMOS Camera (1200 × 1200 px; Photometrics), Orca Flash 4.0 V3 (2048 × 2048 px; Hamamatsu) and the camera from a LSM 700 confocal microscope (Zeiss).
For the scanner setup, seedlings were transferred to ½ MS, 1% sucrose (unless specified otherwise) and imaged every 30 min using an Epson Perfection v370, v600, or v700 flatbed scanner. The procedure followed to automate the scanning process is described in the Supplementary User Manual.
2.3 Programming
All the scripts used in this study were written in the Python programming language. The latest versions of the ACORBA software and user manual can be found at: https://sourceforge.net/projects/acorba. The software is maintained by N.B.C.S.
The models were trained using Google Colaboratory Pro High RAM/GPU accelerated servers. The software was programmed and the analyses were conducted on a Windows 10 computer with an Intel Core i5-7300HQ 2.50 GHz processor, a CUDA-enabled NVIDIA GeForce GTX 1060 Max-Q design 6Go GPU, and 16Go of RAM.
The deep machine learning part of this work was partially inspired by Sreenivas Bhattiprolu Python image analysis and machine learning tutorials (https://github.com/bnsreenu/python_for_microscopists).
The Python dependencies used to create and run ACORBA are listed below: Scikit-Image (0.18.1), Scikit-Learn (0.24.1), TensorFlow (2.6.0), Keras (2.6.0), Keras-unet (0.1.2), OpenCV (4.5.1.48), PySimpleGUI (4.34.0), Matplotlib (3.3.4), Pandas (1.2.3), Patchify (0.2.3), Numpy (1.19.5), Fil Finder (1.7) and Astropy (4.2.1), tifffile (2021.2.1), and tqdm (4.62.2). The scripts also used a modified version of the script at https://github.com/Vooban/Smoothly-Blend-Image-Patches.
The Python scripts were transformed as .exe files with the module Auto PY to EXE (2.8.0) to make the scripts portable for Windows x64. The whole software was compiled as a single setup .exe file for Windows x64 using the software Inno Setup Compiler (6.1.2).
3. Results
3.1 General presentation of the software and its workflow
ACORBA is a minimalist and user-friendly program written in the Python programming language. The software implements a fully automated workflow allowing the user to measure primary root bending angle from images obtained on a microscope or flatbed scanner. ACORBA can also be used as a semi-automated approach with manual annotation of roots from various inputs such as cameras, stereomicroscopes, and mobile phones.
The workflow is divided into two main steps. First, the root surface is identified in the image by image segmentation creating a binary mask isolating the root surface(s) (and root tip(s) for microscopy images). To improve versatility, ACORBA has three possible segmentation implementations: (a) traditional image segmentation by automatic thresholding, (b) deep machine learning prediction models and (c) the possibility to use binary masks created by the user. Roots on scanned images can be challenging to segment so we added a second traditional method and a super accuracy mode for deep machine learning. The user can decide which approach is the best for a given dataset with an implemented option called ‘test segmentation’. Second, the software automatically calculates the angle of the root tip(s). The approach used in ACORBA is the creation of a Euclidean vector that originates in the centre of the root meristem and points in the direction of the actual root tip. With this method, the root tip angle can be determined in a 360° space. To facilitate interpretation, the angles are exported in a +180/−180° space corresponding to downward/upward gravitropic bending or left/right root waving, respectively.
ACORBA includes various options including the possibility for the user to export the segmentation without angle analysis and use his own deep machine learning models. These models have to follow rules described in the user manual (Supplementary User Manual). Uploading custom prediction models to ACORBA can be used for researchers who want to analyse another species or have a large number of very specific images.
Data output-wise, the user has the option to normalize the bending angle data to the initial angle of each root. In other words, the first angle of one set of bending angles (for one root) can be automatically subtracted from the rest of the time frames to obtain relative bending angles. The raw angles are always exported as well. Users can also save the analysis plots which appear during the analysis and show the vectors. These options are particularly helpful for troubleshooting. Finally, to allow debugging any unusual output, the user has the possibility to save all the root predictions over time to check if the segmentation method selected is accurate for the whole stack of frames.
3.2 Establishment of image/mask libraries and neural network architectures
Deep machine learning models are trained using libraries containing original images and their corresponding ground truth images. The lasts are binary masks (black and white pixels) in which the element to be predicted was manually annotated.
Recently, we developed a method to observe the root gravitropic response on a vertical stage microscope involving limited mechanical stress compared with the classical method of sandwiching the root between a layer of agar and the coverglass (Serre et al., Reference Serre, Kralík, Yun, Shabala, Slouka and Fendrych2021). In this method, which we will refer to as the ‘Through’ method, a thin layer of ½ MS agar is casted directly on a microscopy chamber coverglass, and the seedlings are placed on the top (Figure 1a). The Through method is adapted to experiments in which the user is not interested in fluorescence signals while the standard Sandwich method allows classical imaging of root fluorescence.

Figure 1. Establishment of the deep machine learning libraries. (a) Comparison of the Through and Sandwich methods. (b) Establishment of the microscopy libraries. From original images, the roots were annotated to create binary masks. Then, the original images were augmented (cropped, scaled up, rotated) and reduced to 256 × 256 pixels images. (c) Establishment of the flatbed scanner library. From original images, the roots were annotated to create binary masks. Then, the original images and their masks were padded with a black border to a size divisible by 256. Finally, the last images were divided into 256 × 256 tiles.
We created libraries and trained root surface prediction models for both microscopy methods. In parallel, we also trained root tip area detection models. Indeed, the estimation of the middle line of the root for the angle calculation requires a skeletonization step which is more accurate if restricted to a smaller area such as the root tip. Both predictions are relevant as the root surface, as a whole, is a defined structure in a picture while the root tip area is a subjective zone. The subjective aspect of the root tip area prediction makes it untrustworthy for determining the root angle directly. The original libraries created for both microscopy methods consisted of 302 and 189 images/masks for the Through and the Sandwich methods, respectively. These numbers are in general considered small for deep machine learning training as they are unlikely to display enough diversity to obtain a prediction model with a wide range accuracy. To mitigate this problem and artificially increase the diversity and the final model accuracy, we used a method called image augmentation in which the original images and their masks are duplicated and then modified (rotation, cropping, Figure 1b). The final libraries contained 785 and 757 images/masks for the Through and Sandwich methods, respectively. For the root tip prediction models, the images were not cropped to avoid losing the overall context of the root and increase accuracy. All the models were trained with images/masks resized to 256 × 256 pixels for faster training and analysis. The images were obtained from several microscopy cameras (see Materials and Methods).
For images obtained with a flatbed scanner, the process was different. On the one hand, skeletonization of long and thin objects is comparably easy, so we only trained a root surface prediction model. On the other hand, images of scanned square plates are large with small objects to be detected (at 1200 dpi, the root thickness is approximately 10 pixels), and the images contain cotyledons and hypocotyls which are not relevant to the analysis. Therefore, cotyledons and hypocotyls were manually cropped out of the images, only leaving root parts (Supplementary Figure S1a). It was not possible to simply resize the raw images to 256 × 256 padded squares as this produced extreme inaccuracy in angle measurements. To circumvent this, the raw images of various original sizes were first padded to a rectangular image that can further be divided into 256 × 256 tiles (Figure 1c). The pre-library contained 340 original images/masks with 5–30 roots in one row obtained using commonly used Epson flatbed scanners (see Materials and Methods). The library was augmented (horizontal flip and contrast adjustments) to a final library containing 21,816 images/masks containing background or pieces of roots.
The neural networks trained in this study are modified UNET architectures (Ronneberger et al., Reference Ronneberger, Fischer and Brox2015) (Supplementary Figure S1b). This architecture is commonly used for its efficiency for semantic segmentation in biology. The network was implemented using TensorFlow implementing Keras, https://github.com/tensorflow) and the package Keras-UNET (https://github.com/karolzak/keras-unet). The super accuracy mode for scanner images is using the same prediction model. However, the prediction is averaged from mirrored and rotated pictures to increase accuracy. We used the ADAM optimizer (Kingma & Ba, Reference Kingma and Ba2017) and the Dice coefficient metric to quantify the prediction accuracy over the training periods. The accuracies of our trained models are presented in Supplementary Table I. The root surface prediction accuracies for the microscopy methods were above 93% (For comparison with manual annotations, see Supplementary Figures S1–S4). Given the size of the root surface, these scores are more than satisfying to allow accuracy in further angle measurements. The accuracies for the root tips were lower, as expected. Indeed, the root tip area is not a defined area and was subjectively annotated. Overall, the trained models managed to recognize the pixel pattern created by the root tip shape. Furthermore, the root tip area detection is only intended to grossly detect the root tip in space. The scanner root surface prediction accuracy was 85% (Supplementary Figure S5). However, consistent manual annotations of thin objects are difficult. Most of the time, the final model predictions were visually more accurate than the manual annotations (for comparison with manual annotations, see Supplementary Figures 5–10). Deep machine learning model accuracies were also assessed using a test dataset by comparing manual and prediction segmentation of images unknown to the models. The accuracies of our models on test datasets are presented in Supplementary Table I, which showed similar accuracies than on the libraries, with the exception of root tip predictions which were lower. These root tips were annotated separately and thus, the subjective annotations of the root tips might have been different. Regardless of the differences, the performances of the models were visually more than satisfactory (https://doi.org/10.5281/zenodo.6410167).
3.3 Traditional image segmentations
As deep machine learning is unlikely to be accurate in every condition, we developed an alternative automatic solution using traditional image segmentation approaches. However, for microscopy, the root tip detection method is always conducted by deep machine learning as we could not find a satisfying method to detect the root tip area by traditional methods. For the images obtained by the Through method, an automatic Otsu threshold is applied followed by a binary closing function to fill the possible holes in the binary thresholded image (Figure 2a). For the Sandwich method, the image goes through a texture detection filter based on entropy (complexity of the grey levels in a given area). Then, the image is automatically thresholded, and a binary closing function is applied to fill the possible holes (Figure 2b). It is worth noting that unlike in case of the deep machine learning prediction, detached root caps and other objects with sufficient contrast are also segmented and could create angle measurements artefacts (Figure 2b).

Figure 2. Image segmentation in ACORBA. (a) Traditional automatic segmentation of root in vertical stage microscopy using the Through method. (b) Traditional automatic segmentation of root in vertical stage microscopy using the Sandwich method. (c) Traditional automatic segmentation of root imaged with a flatbed scanner. (d) Example of the function test segmentation for vertical stage microscopy using the microscopy Through method. (e) Example of the function test segmentation for scanner images.
For scanned images, we implemented two methods similar to both methods in microscopy (Figure 2c).
Deep machine learning predictions and traditional methods can be compared using the ‘test segmentation’ option to decide which one is the most suitable for a given dataset (Figure 2d, e). In case none of the automated methods are satisfying, the software allows the users to import their own binary masks for root surface (and root tip for microscopy). Ways to create those masks are presented in the user manual. Using custom binary masks avoids any bottleneck from image segmentation.
3.4 Calculation of the angle for microscopy and flatbed scanner images
Even though the angle calculations are based on a root tip vector for both microscopy and scanner images, the size of the root surface and the number of roots in every image is different. Determining the root tip vector for microscopy images is a more complex process than for scanner images.
Once the segmentation of roots in microscopy images is carried out, both root surface and tip masks are preprocessed before the actual determination of the root tip vector. The first step is a series of binary pixel dilation and erosion to remove potential non-specific pixel detection conducted on both root tip and root surface masks. Then, the particles are analysed, and only the largest surface (root surface/tip) is kept for analysis. Finally, to ensure that the angle orientation in space is similar for every root, the root tip is automatically oriented towards the left side of the frame.
To focus the analysis on the root tip and not on the rest of the root, the root tip area is isolated. For this, a circular region of interest (40 pixels width by default, customizable) around the centroid of the root tip mask is created (Figure 3a). This circular selection is used to crop and isolate the root tip area on the root surface mask. Finally, this cropped area is enclosed into a circular bounding box (using the circle() function in Python OpenCV package), and the root tip area perimeter is determined (Figure 3b).

Figure 3. ACORBA measurements of root tip angles. (a)–(e) For microscopy images and (f)–(I) for flatbed scanner images. (a) Cleaning of binary masks and determination of the approximate position of the root tip on the root surface prediction. (b) Isolation of the root tip on the root surface prediction and determination of the intersecting points with an enclosing circle to estimate the root tip direction. (c) Skeletonization of the root tip surface. (d) Determination of the middle of the skeleton corresponding to the angle vector origin. (e) Determination of the direction of the angle vector by modelling a linear regression between the estimated root tip direction (see b) and the angle vector origin. The intersection between the linear regression modelling and the root perimeter gives the direction to the vector. (f) Original flatbed scanner tif stack. (g) Binary mask. (h) Individual skeletonization of every root and determination of skeleton origin and end. (i) Determination of the vector origin and direction.
The creation of the vector starts by first determining the central pixel position of the root tip area. The result of enclosing the root tip perimeter into a bounding box is the creation of two intersecting pixel clusters present both in the bounding box and the root tip area perimeter: (1) the actual root tip and (2) the root tip area shootward (Figure 3b). These two clusters are identified by K-mean clustering. The smallest cluster central coordinates are kept for further use as they correspond to an estimated root tip position (Figure 3b).
Second, the software goes back to the isolated root tip surface area for skeletonization (Figure 3c). The skeleton pixels are ordered from the closest to the previously determined root tip cluster to the shootward side by a closest-to-closest pixel approach. From this ordered single line of pixels, the middle pixel is set as the origin of the vector for angle calculation (Figure 3d).
Finally, the root tip pixel’s (vector’s direction) precise location is determined by creating a straight line from the middle of the skeleton to the image frame (Figure 3e). The intersection between this line and the root perimeter is set as the root tip pixel and vector’s direction.
From this vector, the angle of the root tip is determined with the formula to determine the angle of a vector in a 360° space. However, to facilitate interpretation, 180° is automatically subtracted from the angle resulting in arbitrarily negative values for upward bending and negative values for downward bending.
This process is carried on every time frame of a stack (Supplementary video 1), and the angles are compiled into a table for export.
Creation of root tip vectors from thin and long surfaces is simpler than from large surfaces. However, working with several objects in one image creates new challenges that we describe below.
Once the full binary mask is reconstructed from the 256 × 256 segmentation patches (Figure 3f, g), the mask size is reduced by 40% to increase analysis speed without significantly decreasing accuracy.
The first step of the analysis is to detect every root in the images and isolate them as individuals before skeletonization which represents the roots as a single line of pixels (Figure 3h). Next, both ends of the skeleton are detected (Figure 3h). The identification of the shootward end and the root tip is facilitated by the mandatory step required from the users to orient the root tips towards the right side. The shootward end is determined as the leftmost coordinate and the root tip is identified as the second skeleton end. This step is followed by the reorganization of the skeleton pixels from the shootward end to the root tip by a closest-to-closest coordinate approach.
Finally, the angle vector is determined individually for each root tip. The root tip direction is determined as the root tip end identified above. The vector’s origin is set, by default (customizable), as the 10th pixel on the skeleton starting from the end of the root (shootward) (Figure 3i).
We previously stated that the segmentation of several thin objects in a large image can come with challenges such as a not fully segmented root which appears as two roots. To mitigate this and ensure that all the roots are in one piece, a function calculates the distance between all the skeleton ends and origins. If one skeleton end is less than 50 pixels (by default, customizable) from another skeleton origin, the software assumes that these two pieces belong to one root and those two pieces are linked to recalculate the angles.
Similarly, to the microscopy images, the whole process from reconstructing the images from tiles to the calculation of the angles is carried out in every time frame (Supplementary video 2), the angles are then compiled into a table for export.
3.5 Evaluation of microscopy models and method
To assess the accuracy of the angle calculation method for microscopy, we first compared manual and automated analyses of the same roots bending over time in a vertical stage microscope. For the manual analysis, we used the manual equivalent of ACORBA’s method (Supplementary Figure S4). ACORBA and manual measurements, overall, produced comparable results (Figure 4a, Root 1 and 2). However, in some cases, manual measurements produced significant differences between repeated measurements of the same roots, in contrast to ACORBA which always produced the same result for one root (Figure 4a, Root1 and 4). This demonstrated that ACORBA is more reproducible than the human eye and hand in manual measurements. Moreover, the analysis time by ACORBA is roughly 10–20 times faster (depending on the computer hardware) than the manual analysis and does not require oversight.
Next, to test whether ACORBA can measure angles bigger than the maximum 15° measured in our first experiment (Figure 4a), we gravistimulated and measured Col0 roots bending during the course of 5 hr (Figure 4b). We recorded angles up to 68°. In theory, the method would be able to measure angles higher than 90°. However, this scenario is unlikely to happen with a gravistimulated root observed with a vertical-stage microscope.
Further, we compared our recently published gravitropic data analysed using a different method (Serre et al., Reference Serre, Kralík, Yun, Shabala, Slouka and Fendrych2021). In this experiment, we studied the afb1 mutant impaired in the rapid response to auxin and rapid gravitropic response. We showed that afb1 was slower to trigger gravitropic bending with an approximative 12 min delay compared with the wild type Col0. The image stacks from this experiment were re-analysed using ACORBA and showed similar results (Figure 4c). However, ACORBA was faster than our previously published method as it is fully automated.
Further, to demonstrate the performances of ACORBA in another biological context, we compared the gravitropic response of Col0 and the aux1 mutant impaired in the main auxin influx carrier (Bennett et al., Reference Bennett, Marchant, Green, May, Ward, Millner, Walker, Schulz and Feldmann1996) in plants. This mutant is known to be agravitropic as auxin is not correctly redistributed during the gravitropic response. As expected, Col0 initiated bending towards the gravity vector with recorded downward angles ranging from 5 to 21° (Figure 4d). In contrast, aux1 roots displayed a typical agravitropic behaviour with growth orientation independent of the gravity vector with roots bending upward, downward or not bending, again well analysed by ACORBA (Figure 4d).
We previously described two methods used in our laboratory to assess the gravitropic response using a vertical-stage microscope (Figure 1a). Here, we used ACORBA to compare the dynamics of root bending imaged with the Through and Sandwich methods. This experiment showed that the roots imaged with the Through method are, overall, bending faster than the roots imaged with the Sandwich method (Figure 4e). This confirmed that the Through method is allowing a better gravitropic response probably by providing less mechanical stress and unobstructed growth.
To quantify ACORBA’s accuracy, we measured the root tip angles of an artificial set of roots with set angles from −89 to +89° as the microscope method is not adapted to angles bigger than 90°. These measurements showed that ACORBA can measure angles in this range with a small margin of error (in average 0.74%, Figure 4f).
This set of experiments allowed us to confirm that ACORBA can be used to accurately determine the bending angles of roots imaged with a vertical-stage microscope.
Furthermore, we measured poppy roots gravitropic response using the software in semi-automated mode (Supplementary Figure S4e,f). This experiment showed that using handmade binary masks, the software can measure bending angles of other species than A. thaliana.

Figure 4. Characterization of the angle calculation method for vertical stage microscopy images. (a) Comparison of ACORBA and manual measurements of Col0 root gravitropic angles. n = 4 individual seedlings. (b) Calculation of Col0 root gravitropic angle over 302 minutes. n = 6 individual seedlings. (c) Comparison of Col0 and afb1 gravitropic bending angles. n = 9 (Col0) and 12 (afb1) individual seedlings. (d) Comparison of Col0 and aux1 gravitropic bending angles. n = 13 (Col0) and 19 (aux1) individual seedlings. Images were taken every 2 min. (e) Effect of the imaging method (Through versus Sandwich) on Col0 seedling gravitropic angles in a vertical-stage microscope. Represented data are mean ± SD (shaded area). n = 10 (Through) and six (Sandwich) individual seedlings. (f) Accuracy of ACORBA on an artificial set of bended roots from −89 to 89°.

Figure 5. Characterization of the angle calculation method for flatbed scanner images. (a) Comparison of manual and ACORBA measurements of Col0 gravitropic bending angles. n = 9 individual seedlings. (b) Comparison of Col0 and aux1 gravitropic bending angles. n = 9 (Col0) and 8 (aux1) individual seedlings. (c) Measurement of root tip angles during horizontal root curling. (d) Accuracy of ACORBA on an artificial set of bended roots from −90 to 90°. (e) Effect of no sucrose and (f) 3% sucrose on Col0 vertical root waving. n = 10 (0% sucrose) and 11 (3% sucrose) individual seedlings. (g) ACORBA semi-automated measure with manual binary masks of root tip angles of Col0 seedling growing horizontally and observed under a stereomicroscope. Images were taken every 30 min.
3.6 Evaluation of the scanner model and method
We progressed further with the evaluation of the scanner angle calculation. We first compared ACORBA and manual measurements (method described in Supplementary Figure S4a) of root bending on agar plates measured over 15 hr after gravistimulation (Figure 5a). We showed that ACORBA and manual measurements were strikingly similar. However, ACORBA produced more noisy data. Nevertheless, in most cases the bending angles of roots in plates are averaged and the overall average and error bars between methods were almost identical. Furthermore, the analysis time is considerably shorter with ACORBA (up to 10 times depending on hardware) and does not require oversight.
Next, we also compared Col0 and the agravitropic mutant aux1 responses and showed that while Col0 bent downward up to 130° over 15 hr, the mutant bent slightly downward or upward, showing a typical agravitropic behaviour (Figure 5b).
To push the limits of the software, we imaged a root curling, a phenomenon appearing when agar plates are horizontally positioned. In this scenario, the deep machine learning segmentation showed untrustworthy accuracy above 158° bending. However, the automatic traditional segmentation method and the angle calculation method showed that ACORBA can measure relative angles up to 180°. Passing the 180° threshold up/downward bending resulted in a complex output, with difficult interpretation as the root tip is changing horizontal direction (Figure 5c). The complex interpretation is a direct consequence of working in a +180/−180° space instead of a 360° one. However, this situation is not common, and the gain in interpretation facility obtained by working in a +180/−180° space for regular gravitropic experiments overcomes this specific limitation. These results demonstrate the limitations of the software for measurements of curling behaviour, and we conclude that ACORBA should not be used for measuring curling and/or touching roots.
Further, to quantify ACORBA’s precision, we quantified the root tip angles of a set of artificial root images with set angles ranging from −90° to +90° (Figure 5d). This experiment allowed us to demonstrate that the software can measure root tip angle from scanned images with an average margin of error of 1.05%.
To demonstrate the software’s ability to measure angle of waving roots, we imaged seedlings growing vertically on 1/2MS medium without or with 3% sucrose, known to induce waving (for review, see Oliva & Dunand, Reference Oliva and Dunand2007) for 20 hr. The seedlings transferred from 1% sucrose to no sucrose showed almost straight root growth after 6 hr (Figure 5e). However, seedlings transferred to 3% sucrose medium displayed heavy waving with a waving amplitude of approximately ±60° (Figure 5f).
Finally, to illustrate the semi-automated use of the software, we imaged seedlings growing in agar plates using a stereomicroscope and a mobile phone (16 megapixels resolution) (Figure 5g). After resizing the images, so that the roots were approximately 10 pixels in width (similar to 1200 dpi scanned images), we prepared the binary masks manually in ImageJ (Method in Supplementary User manual, Figure S5a,c). It is worth noting that seedlings from the mobile phone image and the stereomicroscope were also correctly segmented by the deep machine learning model Supplementary Figure S5b,d). In these conditions, ACORBA was able to measure single time frame angle from mobile phone image (Supplementary Table II) and angle dynamic of horizontally growing seedlings observed with a stereomicroscope (Figure 5g).
4. Discussion
ACORBA is, to our knowledge, the only software dedicated to automated or semi-automated measurements of root bending angles dynamics from various image inputs. We demonstrated that it can quantify root bending towards gravity and root waving in vertical conditions. The software implements semantic image segmentation with deep machine learning and can be fully automated which is still a rare case in plant biology image analysis. We implemented an innovative, deep machine learning based method to detect the root tip area in microscopy images even if the root is over-bending or spiralling over itself. This method is more accurate than our previously published method (Serre et al., Reference Serre, Kralík, Yun, Shabala, Slouka and Fendrych2021).
The models provided in the software were trained on libraries containing images taken from different inputs to fit other laboratory setups. Furthermore, the models can still be retrained with contributions from the scientific community to expand the range of accuracy. On the other hand, as long as the input format follows our model input pre-formatting, custom deep machine learning prediction models can also be implemented for various applications. Otherwise, to avoid analysis bottlenecks and flexibility at the root segmentation step, the software can also do traditional automatic segmentation or can be semi-automated by using manually annotated roots. This opens the range of usage to researchers working with different species than A. thaliana, specific image types (e.g. images from a camera, mobile phone, or stereomicroscope).
The software showed similar or better accuracy than the manual measurements of root angles from microscope. For the scanner images, we showed that ACORBA produced strikingly similar measures as the ones obtained by manual measurements. Moreover, ACORBA measurements are highly replicable in contrast to the manual subjective approach.
We demonstrated that it can reproduce and quantify already published data such as the delayed gravitropism of afb1 (Serre et al., Reference Serre, Kralík, Yun, Shabala, Slouka and Fendrych2021), aux1 agravitropism, and sucrose-induced waving in vertical conditions (Oliva & Dunand, Reference Oliva and Dunand2007). We showed that the software was producing complex data to interpret passing the 180° angles which were induced by curling in horizontal conditions. These extreme bending angles are unlikely to happen in regular vertical bending experiments, and this experiment had for only purpose to demonstrate the limitations of interpretation passed the 180° threshold .
ACORBA was not designed to measure angles from a single timeframe. However, by duplicating the single frame to obtain a two-frame stack prior to analysis, we showed that it can be used for single-time frame angle measurements.
A direct benefit but also disadvantage of the fully automated approach is that the user has less control on the measurement. This is especially striking when a root or row of seedlings displays unforeseen characteristics. Nevertheless, with the export related to the analysis steps (original/prediction overlay and analysis graphics), users can quickly identify problems and, most of the time, fix it by image preprocessing (e.g. remove an agar bubble or a detached root cap, see user manual for troubleshooting).
The program was written in the Python programming language which is not as fast a compiled language like C++ but offers very good support and modules for machine learning and image processing.
In this context, ACORBA offers a broad range of measurements possibilities by producing unbiased and highly replicable datasets by automatization of a time and laborious process.
Acknowledgements
The authors would like to thank Shiv Mani Dubey, Monika Kubalová, and Denisa Oulehlová for their image contributions to establish the prediction model libraries and their valuable inputs and software beta testing. They also thank Eva Medvecká for technical support and Sreenivas Bhattiprolu for his free and online Python image analysis and machine learning tutorials.
Financial support
This work was supported by the European Research Council (grant no. 803048).
Conflict of interest
The authors declare that they have no competing interests.
Authorship contributions
N.B.C.S. and M.F. conceived the project and wrote the manuscript. N.B.C.S. and M.F. performed the microscopic acquisitions. N.B.C.S. programmed the software and measured and analysed the data.
Data availability statement
The latest versions of ACORBA software, training annotated libraries, source code, examples, image pre-processing scripts, deep machine learning model training Jupyter notebooks and user manual maintained by N.B.C.S. are available at https://sourceforge.net/projects/acorba/. The raw microscopy and scanner stacks used in this paper are available at ZENODO (https://doi.org/10.5281/zenodo.6410167). The analysed results are supplemented (Supplementary data).
Supplementary Materials
To view supplementary material for this article, please visit http://doi.org/10.1017/qpb.2022.4.


 Open access
Comments
Dear Editor,
Hereby we submit our manuscript entitled “ACORBA: Automated workflow to measure Arabidopsis thaliana root tip angle dynamics” for your consideration for publication in Plant Quantitative Biology journal. Submission to your journal was motivated by the Preprint editor’s solicitation, Dr. Enrico Scarpella.
Quantification of root tip orientation in space is an important aspect of root physiology. Especially for the response of roots to the gravity vector, often quantified in auxin-related studies. However, these measurements are mostly quantified manually while it is known that manual quantification of images and microscopy pictures involves unconscious human bias. Furthermore, these measurements are too often made on one time point instead of time-series, hence loosing temporal resolution. Potentially missing phenotypes or leading to misinterpretation. To this day, several tools already exist allowing users to perform semi-automated analysis of root tip angles but these require, in most cases, specific type of setup, user interaction, hardware or set of conditions to produce the image input. This restricts the range of laboratories able to use these software. Moreover, to our knowledge, there is no available solution to quantify root tip angles from vertical stage microscopy images.
Using the Python programming language, we created ACORBA (Automatic Calculation Of Root Bending Angles) to automatically calculate root tip angles of time-series obtained from a rather universal array of inputs (vertical stage microscope, flatbed scanner, camera, stereomicroscope…). ACORBA puts the accent on the user by setting input rules to a minimum and thus increasing flexibility by expanding the range of hardware to common tools in most laboratories. The software allows to transform, quickly and with high reproducibility, image time-series into quantified angles with no or minimal user interaction. This produces unbiased data with barely any effort and time investment from the user. We also promote the use of time-series instead of single time-frame analysis to fully exploit the dynamic aspect of the root gravitropic response.
The software is a two steps workflow: 1) The root surfaces are segmented and 2) the root tip angles are calculated. The analysis was programmed to be fully automated, relying on either (to the user’s choice) deep machine learning segmentations or traditional image analysis solutions. Nonetheless, to increase usage flexibility and prevent any workflow bottleneck, the critical segmentation step can be shunted using the user own segmentation masks. ACORBA was developed to worked with Arabidopsis thaliana primary root. However, the user can also use the automated mode combined with his own deep machine learning segmentation model(s) and/or the semi-automated mode with other plant species, significantly enlarging the array of potential users.
The manuscript first presents exactly how the software was created. Secondly, we assessed the software accuracy by comparing its outputs to manual measurements showing very similar quantifications but with higher reproducibility. Finally, the program was successfully tested against already known phenotypes such has small delay in the gravitropic response of the afb1 mutant and aux1 mutant agravitropism.
To conclude, ACORBA provides a flexible tool which will help the plant biology community to produce unbiased and reproducible measurements while saving time and labor.
We took the liberty to submit a preprint version of this article on bioRχiv (https://www.biorxiv.org/content/10.1101/2021.07.15.452462v1) to rapidly reach potential users. This was helpful as we got some user feedback allowing use to improve the software input flexibility and speed by almost 40%. The preprint showed an Altmetric score of 25, scoring higher than 91% of its contemporaries on this preprint server (on 13/09/2021). Moreover, we counted 29 downloads (15/07/2021 to 13/09/2021, version 1.1) from 8 countries. These indicate that our work has the potential to interest a specific but broad scientific audience.
Thank you in advance for considering our work for publication in Quantitative Plant Biology.
Nelson BC Serre and Matyáš Fendrych