


1. Introduction
Global transport properties in turbulent flows are intimately connected to flow structure and flow organization. Clearly, this holds for thermally driven turbulent flows, where the key global transport property is the heat transport. This is of utmost importance in many technological applications and in the natural flows that one finds in the ocean, in the atmosphere, and in the interiors of stars and planets. The paradigmatic system for thermally driven flow is Rayleigh–Bénard (RB) convection (Bodenschatz, Pesch & Ahlers Reference Bodenschatz, Pesch and Ahlers2000; Kadanoff Reference Kadanoff2001; Ahlers, Grossmann & Lohse Reference Ahlers, Grossmann and Lohse2009; Lohse & Xia Reference Lohse and Xia2010; Chilla & Schumacher Reference Chilla and Schumacher2012; Shishkina Reference Shishkina2021), a fluid in a box heated from below and cooled from above. The key question for this flow is: how does the heat transfer (the Nusselt number,  ${Nu}$) depend on the control parameters, such as the non-dimensional temperature difference between top and bottom plates (the Rayleigh number,
  ${Ra}$), the ratio of kinematic viscosity and thermal diffusivity (the Prandtl number,
  ${Pr}$), and the geometry of the convection domain? The same fundamental question holds for rotating RB convection when one varies the ratio of rotation to convection (Ecke & Shishkina Reference Ecke and Shishkina2023), as expressed by the inverse Rossby number.
Turbulent RB flow is characterized by the interplay between large-scale convection rolls, thermal boundary layers, and plumes detaching from these boundary layers. The interplay between these flow structures determines the overall heat flux. Any model for the heat transport in RB flow makes assumptions on the flow structures. The unifying theory of thermal convection of Grossmann and Lohse (Grossmann & Lohse Reference Grossmann and Lohse2000, Reference Grossmann and Lohse2001; Ahlers et al. Reference Ahlers, Grossmann and Lohse2009; Stevens et al. Reference Stevens, van der Poel, Grossmann and Lohse2013) describes successfully the functional dependence of the Nusselt number and the Reynolds number on the Rayleigh number and the Prandtl number. Such connections must also be made in the theories for rotating RB flow. For  ${Pr}>0.7$, rotation first leads to an increase in heat transport and then a strong decrease, due to the Taylor–Proudman theorem (Ecke & Shishkina Reference Ecke and Shishkina2023).
The increase in  ${Nu}$ as a function of rotation rate for intermediate Rossby numbers can be understood from the overall flow organization and its connection to the thermal boundary layers (Stevens et al. Reference Stevens, Zhong, Clercx, Ahlers and Lohse2009; Zhong et al. Reference Zhong, Stevens, Clercx, Verzicco, Lohse and Ahlers2009), a concept that can be extended to laterally confined RB convection (Chong et al. Reference Chong, Huang, Kaczorowski and Xia2015; Chong & Xia Reference Chong and Xia2016; Hartmann et al. Reference Hartmann, Chong, Stevens, Verzicco and Lohse2021) and to double diffusive convection (Chong et al. Reference Chong, Yang, Huang, Zhong, Stevens, Verzicco, Lohse and Xia2017). Chong et al. (Reference Chong, Yang, Huang, Zhong, Stevens, Verzicco, Lohse and Xia2017) and Xia et al. (Reference Xia, Huang, Xie and Zhang2023) suggest a unifying view for these individual stabilizing effects, connecting the overall heat flux with both the boundary layer structures and the flow organization in the bulk. Hartmann et al. (Reference Hartmann, Verzicco, Kranenbarg, Lohse and Stevens2022) extended this concept to account for the heat transport in laterally confined and rotating RB flow, i.e. when two stabilizing effects modify the flow simultaneously, showing a complex interference of the different effects.
The flow organization and the flow structure are relevant not only for the time-averaged heat flux, but also for its temporal evolution. Nikolaenko et al. (Reference Nikolaenko, Brown, Funfschilling and Ahlers2005), Brown & Ahlers (Reference Brown and Ahlers2006), Xi & Xia (Reference Xi and Xia2007), Zwirner, Tilgner & Shishkina (Reference Zwirner, Tilgner and Shishkina2020) and Shishkina (Reference Shishkina2021) showed that rearrangements of the roll structure over time lead to correlated modifications in the heat flux. Each roll is quite isolated from its neighbours and has a long-lasting identity. Similarly, Sugiyama et al. (Reference Sugiyama, Ni, Stevens, Chan, Zhou, Xi, Sun, Grossmann, Xia and Lohse2010) showed that the reversal of the large-scale convection roll is related to the spatial growth of otherwise spatially isolated corner flows. The reversal is then correlated with a burst in the temporal evolution of  ${Nu}$ as the corner flow grows to the size of the system and takes over the role of the large-scale roll. In both cases, we use the term isolated to refer to minimal mixing of momentum and heat with the surrounding flow, as if there exists a partial flow barrier there. In temperature fields, these barriers generate features that are easily distinguishable as relatively uniform regions surrounded by large temperature gradients, across which diffusive transport is maximized.
Given the important role of flow organization for the overall heat transport, quantitative criteria are needed to characterize the flow structure. In their two-dimensional numerical simulations, Sugiyama et al. (Reference Sugiyama, Ni, Stevens, Chan, Zhou, Xi, Sun, Grossmann, Xia and Lohse2010) used the overall angular velocity to achieve this. In three-dimensional (3-D) RB convection, the  $Q$-criterion and
  $\lambda _2$ criterion (Hunt, Wray & Moin Reference Hunt, Wray and Moin1988; Jeong & Hussain Reference Jeong and Hussain1995) have been used previously (Boubnov & Golitsyn Reference Boubnov and Golitsyn1986; Vorobieff & Ecke Reference Vorobieff and Ecke1998, Reference Vorobieff and Ecke2002; Kunnen, Geurts & Clercx Reference Kunnen, Geurts and Clercx2010; Weiss et al. Reference Weiss, Stevens, Zhong, Clercx, Lohse and Ahlers2010). Though these methods have their merits and are Galilean-invariant, they are not objective, i.e. they give different results in general moving frames. Results returned by these criteria therefore depend on the observer and generally do not capture properties and structures intrinsic to the flow. Furthermore, the original, physically motivated values of these criteria are generally ignored, and user-selected level surfaces of the quantities involved are presented instead. As a result, a precise definition for coherent structures is missing in the applications of these methods.
Fortunately, over the last two decades, mathematical methods for the objective identification and characterization of material fluid structures and transport barriers have been developed (Haller Reference Haller2005, Reference Haller2015, Reference Haller2023; Haller et al. Reference Haller, Hadjighasem, Farazmand and Huhn2016, Reference Haller, Katsanoulis, Holzner, Frohnapfel and Gatti2020). These methods uncover experimentally verifiable flow features that are indifferent to the choice of the frame of reference. Technically, this means that the results of these structure or barrier identification procedures do not change under time-varying rotation and translation frame transformations of the form
 \begin{equation} \boldsymbol{x}=\boldsymbol{\mathsf{Q}}(t)\,\boldsymbol{y}+\boldsymbol{b}(t), \end{equation}
where  $\boldsymbol{\mathsf{Q}}(t)$ is an arbitrary, time-dependent rotation matrix, and
  $\boldsymbol {b}(t)$ is an arbitrary time-dependent translation vector. This objectivity requirement ensures that transport barriers are intrinsic to the flow. That is, advective and diffusive transport barriers can be unambiguously visualized experimentally using material tracers or dye (e.g. Tél et al. Reference Tél, Kadi, Jánosi and Vincze2018). As shown, the
  $Q$-criterion and
  $\lambda _2$ criterion do not pass this objectivity test (Haller Reference Haller2015). The correlation of active barriers with such tracer-influencing features can also be verified experimentally unambiguously given their objectivity. Furthermore, objectively defining barriers of dynamically active vector fields provides a common test for verifying conceptual models and settling debates through flux calculations that are indifferent to a researcher's chosen reference frame.
The purpose of the present research is to investigate objectively defined heat and momentum barriers as well as elliptic (rotationally coherent) Lagrangian coherent structures in non-rotating and rotating RB flow. This approach allows us to better identify the flow organization, the flow structures, vortices and transport barriers, and how they develop under varying control parameters (Rayleigh and Rossby numbers). To achieve this, we also require objective definitions of heat and momentum flux that can be calculated for arbitrary surfaces in the flow. This feature-based approach is in contrast to the majority of heat and momentum transport studies on non-rotating and rotating RB convection that rely on bulk scaling arguments (e.g. see the review by Ecke & Shishkina Reference Ecke and Shishkina2023). Once a potential transport barrier is defined, the amount of heat or momentum flux through the surface should be a property of the surface and the flow for a given time, and should be independent of the reference frame in which the calculations are made. To do this, we utilize frame-indifferent definitions of heat and momentum flux, defined in §§ 2.2 and 2.3.
While there has indeed been substantial development in Lagrangian and Eulerian barrier detection methods over the past two decades, our paper relies on barrier definitions that have not been compared on 3-D flows. The theory of rotationally coherent structures and the Lagrangian-averaged vorticity deviation was first published 7 years ago (Haller et al. Reference Haller, Hadjighasem, Farazmand and Huhn2016) but was first implemented effectively on a 3-D turbulent flow by Neamtu-Halic et al. (Reference Neamtu-Halic, Krug, Haller and Holzner2019). Diffusion barriers were first defined and derived mathematically as solutions of an extremum problem by Haller, Karrasch & Kogelbauer (Reference Haller, Karrasch and Kogelbauer2018), and they are located in 3-D turbulent flow data for the first time in the present paper. Active barriers to momentum transport were first defined, with their governing equation first derived, in 2020 (Haller et al. Reference Haller, Katsanoulis, Holzner, Frohnapfel and Gatti2020), and have never been compared systematically to diffusion barriers in 3-D strongly unsteady flow data.
We utilize direct numerical simulations of RB flow in a cylinder of aspect ratio  $\varGamma = 1/2$ at Rayleigh number
  ${Ra} = 2\times 10^8$ and three different (inverse) Rossby numbers, namely
  ${Ro}^{-1} = 0$ (no rotation),
  ${Ro}^{-1} = 6.25$ (intermediate rotation, close to the maximum in heat transfer), and
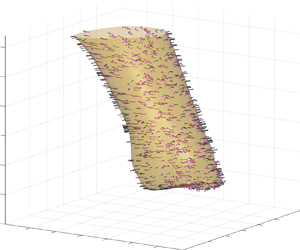
  ${Ro}^{-1} = 33.3$ (strong rotation, with strong suppression of the heat transfer due to the Taylor–Proudman theorem). A comparison of these three scenarios is shown in figure 1.

Figure 1. Normalized heat transport  ${Nu}/{Nu}_0$ with respect to the inverse Rossby number
  ${Ro}^{-1}$ for
  ${Pr}=4.38$ and
  ${Ra}=2\times 10^8$ in a
  $\varGamma =0.5$ cylinder. The circles show data points published in Hartmann et al. (Reference Hartmann, Verzicco, Kranenbarg, Lohse and Stevens2022); the crosses belong to unpublished data. The dotted line shows schematically the expected behaviour for the onset of heat transport enhancement. The arrows indicate the three cases considered in this paper. The volume renders of the instantaneous temperature field illustrate the typical, very different flow morphologies for these cases.
The paper is organized as follows. To be self-contained, we discuss briefly advective, diffusive and active transport barriers in § 2. For a detailed and more general discussion we refer the reader to Haller (Reference Haller2023). In § 3, we give the underlying equations of rotating RB convection and the numerical method that we have employed for the direct numerical simulations of these equations. Section 4 presents the results, which are discussed in § 5. The paper ends with conclusions and an outlook in § 6.
2. Different types of transport barriers
Transport barriers inhibit the spread of material or specific quantities associated with a fluid flow. We will refer to the inhibitors of the spread of material (or of a conserved tracer field) as advection barriers, whereas we will call the inhibitors of the transport of diffusive tracer fields diffusion barriers. Advective barriers are assumed to be passive here, which means that their evolution does not change the fluid velocity field. In contrast, we refer to the transport of dynamically active vector fields with a direct connection to the fluid velocity field as active transport, with examples including the transport of vorticity and linear momentum. Barriers inhibiting the spread of an active field will be referred to as active barriers.
In this study, we describe the role that heat plays as an intermediary between active and passive fields. We show that barriers to diffusive heat transport can be computed effectively directly from the velocity field, as one may expect if heat is a passive scalar concentration (e.g. dye) being advected in the flow. On the other hand, temperature is also present in the equations of motion. This feedback between convection-generated momentum and momentum transport barriers plays a central role in the interplay that is the focus of this study. For a general discussion of all these barrier types and for ways to detect them, we refer again to Haller (Reference Haller2023).
2.1. Advection barriers
Defining the observed barriers to material advection precisely is challenging as all material surfaces block the transport of conserved tracers across them. The concept of Lagrangian coherent structures (LCS) addresses this ambiguity by seeking distinguished material surfaces that are the centrepieces of material deformation and maintain coherence over some finite time interval of interest (Haller Reference Haller2015, Reference Haller2023). Hyperbolic LCS are defined as local maximizers of repulsion or attraction among material surfaces in the flow. In contrast, elliptic LCS are defined as local maximizers of shear among material surfaces.
In a given velocity data set  $\boldsymbol {v}(\boldsymbol {x},t)$, LCS detection tools use fluid particle trajectories
  $\boldsymbol {x}(t;t_{0},\boldsymbol {x}_{0})$ generated from the differential equation
 \begin{equation} \dot{\boldsymbol{x}}=\boldsymbol{v}(\boldsymbol{x},t), \end{equation}
with initial position  $\boldsymbol {x}_{0}$ at time
  $t_{0}$. These trajectories define the flow map
  $\boldsymbol {F}_{t_{0},t}(\boldsymbol {x}_{0})=\boldsymbol {x}(t;t_{0},\boldsymbol {x}_{0})$, from which we also define the right Cauchy–Green strain tensor
 \begin{equation} \boldsymbol{\mathsf{C}}_{t_{0},t}=\left[\boldsymbol{\nabla}\boldsymbol{F}_{t_{0},t}\right]^{\mathrm{T}} \boldsymbol{\nabla}\boldsymbol{F}_{t_{0},t}. \end{equation}
To visualize hyperbolic LCS, it is common to use the finite-time Lyapunov exponent (FTLE) field, defined over a finite time interval  $[t_{0},t_{1}]$ as
 \begin{equation} \mathrm{FTLE}_{t_{0},t_{1}}(\boldsymbol{x}_{0})=\frac{1}{2\left|t_{1}-t_{0}\right|}\log\lambda_{max} \left(\boldsymbol{\mathsf{C}}_{t_{0},t_{1}}\left(\boldsymbol{x}_{0}\right)\right),\end{equation}
where  $\lambda _{max}>0$ is the largest eigenvalue of the positive definite tensor
  $\boldsymbol{\mathsf{C}}_{t_{0},t_{1}}$.
FTLE values measure locally the largest material stretching rate in the flow. For  $t_{1}-t_{0}$ large enough, codimension-one
  $\mathrm {FTLE}_{t_{0},t_{1}}(\boldsymbol {x}_{0})$ ridges align with
  $t_{0}$ positions of maximally repelling LCS. Similarly, for
  $t_{0}-t_{1}$ large enough (backward-time integration), we can find maximally attracting LCS (Haller Reference Haller2015, Reference Haller2023).
To detect elliptic LCS over a time window  $[t_0, t_1]$, we define the Lagrangian-averaged vorticity deviation (LAVD; Haller et al. Reference Haller, Hadjighasem, Farazmand and Huhn2016), by measuring the average deviation of the pointwise vorticity
  $\boldsymbol {\omega }=\boldsymbol {\nabla }\times \boldsymbol {v}$, along a trajectory, from its spatial mean
  $\bar {\boldsymbol {\omega }}$. To obtain the time
  $t_0$ location of elliptic LCS, we calculate
 \begin{equation} \mathrm{LAVD}_{t_{0},t_{1}}(\boldsymbol{x}_{0}):=\frac{1}{|t_{1}-t_{0}|}\int_{t_{0}}^{t_{1}} \left|\boldsymbol{\omega}(\boldsymbol{F}_{t_{0},s}(\boldsymbol{x}_{0}),s)-\bar{\boldsymbol{\omega}}(s)\right|{\rm d}s.\end{equation}
This quantity is objective once the fluid mass involved in the spatial averaging is fixed, but the result will depend on the choice of that domain. In the RB setting that we analyse here, the domain will be fixed simply as the full computational domain.
Locations of elliptic LCS at time  $t_{0}$ can be identified as smooth cylindrical level surfaces of
  $\mathrm {LAVD}_{t_{0},t_{1}}(\boldsymbol {x}_{0})$ surrounding a unique, codimension-two ridge (see Neamtu-Halic et al. Reference Neamtu-Halic, Krug, Haller and Holzner2019; Haller Reference Haller2023). In turn, coherent Lagrangian vortices can be located as nested families of such elliptic LCS. As discussed further below, smooth cylindrical level surfaces in
  $\mathrm {LAVD}_{t_{1},t_{0}}(\boldsymbol {x}_{0})$ fields provide the
  $t_{1}$ locations of such structures by using a backward-time integration, and are reflective of the fluid rotation that occurs from
  $t_{0}$ to
  $t_{1}$.
As with any Lagrangian diagnostic, the choice of integration time  $\delta t=|t_{1}-t_{0}|$ must be made by the user. We are interested in finding material surfaces that maintain coherence over a given time. In rotating RB flow, it is reasonable to assume that fluid particles will eventually transit even the most resilient LCS in finite time as they interact with the boundaries of the flow domain. We show the effect of varying the integration time, from 1 to 20 free-fall times, in the Appendix. We reveal that over this range of values, the underlying LCS do not change, but LAVD fields and their relationship to heat and momentum transport become noisier at larger
  $\delta t$ due to the chaotic nature of the fluid flow. We settle on an intermediate value
  $\delta t=4$ for our analysis as it balances structure visualization with flux barrier statistics. This sort of time scale analysis is secondary to the primary purpose of the study, and is simply a part of studying finite-time dynamical systems (Haller Reference Haller2023).
2.2. Diffusion barriers
In contrast to advective barriers, diffusive barriers can be defined unambiguously without any reliance on a coherence definition. If a scalar  $c$ satisfies the classic advection–diffusion equation with diffusivity
  $\kappa >0$, then the diffusive transport through an evolving material surface
  $\mathcal {M}(t)$, with
  $\mathcal {M}(t_{0})=\mathcal {M}_{0}$, can be written as
 \begin{equation} \varSigma_{t_{0},t_{1}}(\mathcal{M}_{0})=\int_{t_{0}}^{t_{1}}\int_{\mathcal{M}(t)} \kappa\,\boldsymbol{\boldsymbol{\nabla}}c\boldsymbol{\cdot}\boldsymbol{n}\,{\rm d}A\,{\rm d}t,\end{equation}
with  $\boldsymbol {n}(\boldsymbol {x},t)$ denoting a smoothly oriented unit normal vector field along
  $\mathcal {M}(t)$. In contrast to the convective scalar flux
  $\boldsymbol {v}c\boldsymbol {\cdot }\boldsymbol {n}$, diffusive transport through a surface as defined in (2.5) does not change with varying reference frames and can be thought of as a physical property of only the surface and flow. Haller et al. (Reference Haller, Karrasch and Kogelbauer2018) sought to minimize the functional
  $\varSigma _{t_{0},t_{1}}(\mathcal {M}_{0})$ and found that when
  $t_0< t_1$, diffusive transport minimizers are marked by ridges of the diffusion barrier sensitivity (DBS) field, defined as
 \begin{equation} \mathrm{DBS}_{t_{0},t_{1}}(\boldsymbol{x}_{0}) := \mathrm{Tr} \left[\frac{1}{|t_{1}-t_{0}|}\int_{t_{0}}^{t_{1}}\boldsymbol{\mathsf{C}}_{t_{0},t}^{{-}1}(\boldsymbol{x}_{0})\,{\rm d}t\right].\end{equation}
 In RB convection, distinguished flow features (plumes, vortices, etc.) are often identified qualitatively as homogeneous structures with limited mixing with the surrounding fluid. These barriers, across which the mixing of heat is limited, correspond to surfaces with the most dramatic temperature gradients. That is, they are surfaces that maximize diffusive transport. By inverting the integration time, DBS ridges identify diffusion minimizers in backward time, which are by definition equivalent to diffusion maximizers in the standard forward-time flow. In other words, backward-time integration from  $t_1$ to
  $t_0$ provides the
  $t_{1}$ positions of diffusion maximizers as ridges of
  $\mathrm {DBS}_{t_{1}}^{t_{0}}(\boldsymbol {x}_{0})$.
It is remarkable that DBS is a predictive field given that its computation requires no diffusive simulation and relies on only the velocity field. The mathematical accuracy of this relies on a relatively small dimensionless thermal diffusivity. Specifically, DBS is a valid indicator for large Péclet number ( $Pe\gg 1$), and will predict diffusion barriers in any flow, regardless of density, viscosity or diffusive coefficients, given sufficient advection. For the rapid, intermediate and no-rotation simulations, we calculated Péclet numbers 590, 1820 and 2170, respectively, using the known Prandtl number and Reynolds number from velocity fluctuations in all directions. Throughout the paper we use the terms heat transport, flux and barriers to refer to diffusive heat flux, and exclude consideration of the non-objective convective heat transport because of inconsistencies in its value for varying reference frames.
For both the advective and diffusive barriers evaluated in this study, we use regularly the inverse flow map, beginning at a given time  $t$ and integrating backwards in time to
  $t-\delta t$. When plotting LAVD at
  $t$ in this way, we reveal the rotational behaviour of the fluid for a
  $\delta t$ window immediately prior to
  $t$, and identify the advective transport barriers that are organizing the scalar fields at
  $t$. DBS ridges computed using this backward-time integration are barriers that maximize diffusive heat transport and are Lagrangian structures that maintain strong temperature gradients across their boundaries. We utilize the same integration time for DBS and LAVD calculations as discussed in the Appendix.
2.3. Momentum barriers
Defining transport barriers objectively for active dynamical quantities is a challenge because such quantities used most often (such as the vorticity and the momentum) are not objective. For example, convective momentum transport  $\rho \boldsymbol {v}(\boldsymbol {v}\boldsymbol {\cdot }\boldsymbol {n})$ varies between reference frames and is an insufficient benchmark to quantify momentum blocking behaviour in arbitrary flows. To circumvent this problem, Haller et al. (Reference Haller, Katsanoulis, Holzner, Frohnapfel and Gatti2020) introduce the (average) diffusive transport of the linear momentum vector
  $\boldsymbol {f}(\boldsymbol {x},t)=\rho \,\boldsymbol {v}(\boldsymbol {x},t)$ through
  $\mathcal {M}(t)$, defined over a time interval
  $[t_{0},t_{1}]$ as
 \begin{gather} \psi_{t_{0},t_{1}}(\mathcal{M}_{0})=\frac{1}{t_{1}-t_{0}}\int_{t_{0}}^{t_{1}}\left[\int_{\mathcal{M}(t)} \frac{{\rm D}\boldsymbol{f}}{{\rm D}t}\boldsymbol{\cdot}\boldsymbol{n}\,{\rm d}A\right]_{vis} {\rm d}t=\frac{1}{t_{1}-t_{0}}\int_{t_{0}}^{t_{1}}\int_{\mathcal{M}(t)}\nu\rho\, \nabla^2\boldsymbol{v}\boldsymbol{\cdot}\boldsymbol{n}\,{\rm d}A\,{\rm d}t,\end{gather}
where the  $[{\cdot }]_{vis}$ operation identifies the part of the bracketed quantity that has an explicit dependence on the viscosity
  $\nu$, as determined from the incompressible Navier–Stokes equation with density
  $\rho$. In (2.7),
  $\nu$ and
  $\rho$ may vary spatially and temporally. Barriers to momentum transport (or momentum barriers for short) can be defined as material surfaces whose initial positions
  $\mathcal {M}_{0}$ are local extremizers of the functional
  $\psi _{t_{0},t_{1}}(\mathcal {M}_{0})$. Of these extremizers, the strongest ones are active momentum barriers, which are structurally stable surfaces admitting strictly zero transport over any of their subsets.
In the instantaneous limit  $t_{1}\to t_{0}=t$, a surface
  $\mathcal {M}(t)$ is a perfect barrier to momentum flux if
  $\nabla ^2\boldsymbol {v}\boldsymbol {\cdot }\boldsymbol {n}$ vanishes at each point of
  $\mathcal {M}(t)$. Throughout the paper, we use the terms momentum transport, flux and barriers to refer to this objective value, and exclude consideration of the non-objective convective momentum transport. Finding active Eulerian (instantaneous) momentum barriers then reduces to finding structurally stable invariant manifolds in the barrier vector field
 \begin{equation} \boldsymbol{x}^{\prime}=\nu\rho\,\nabla^2\boldsymbol{v}(\boldsymbol{x},t_0) \end{equation}
at a given time  $t_0$. Here, a prime denotes differentiation with respect to the barrier time
  $s$ that parametrizes trajectories of (2.8) that form barrier surfaces. Both
  $\nu$ and
  $\rho$ may vary spatially and temporally, as in many natural and thermally driven flows. One can simplify calculations by reparametrizing the dummy integration time without changing the geometry of the vector field or the invariant manifolds of the system. Specifically, to maintain consistency with the equations of motion in rotating RB convection, we calculate streamlines (trajectories) and the flow map of the instantaneous barrier field (2.8) as
 \begin{equation} \mathcal{F}_{(\boldsymbol{x}_{0}; t_{0})}^{s}=\boldsymbol{x}(s;\boldsymbol{x}_{0};t_{0})= \boldsymbol{x}_{0}+\sqrt{\frac{{Pr}}{{Ra}}}\int_{0}^s\nabla^2\boldsymbol{v}(\boldsymbol{x(\tau)},t_0) \,{\rm d}\tau, \end{equation}
where the leading constant coefficient  $\sqrt {{{Pr}}/{{Ra}}}$ rescales
  $s$ to become the same order of magnitude as the Lagrangian integration times
  $\delta t$ used for LAVD and DBS. The barrier vector field is a steady, volume-preserving dynamical system because
  $\nabla ^2\boldsymbol {v}$ is divergence-free for incompressible flows.
We can compute FTLE and LAVD fields along trajectories defined by (2.9), using trajectories  $\boldsymbol {x}(s;\boldsymbol {x}_{0};t_{0})$ computed for
  $t_0$ fixed, from a grid of initial positions
  $\boldsymbol {x}_{0}$. In all our computations, we select the integration length
  $s$ for
  $\mathcal {F}_{(\boldsymbol {x}_{0}; t_{0})}^{s}$ to be close to the decorrelation time scale (
 $s\approx 3$) using the computational method suggested by Aksamit & Haller (Reference Aksamit and Haller2022). Beyond this time scale, trajectory-based diagnostics become less representative of features near their initial positions
  $\boldsymbol {x}_{0}$, as also described for LAVD fields in the Appendix. Hyperbolic and elliptic invariant manifolds of (2.8) are detected in analogy with their advective counterparts in the active FTLE (aFTLE) fields
 \begin{equation} \mathrm{aFTLE}_{t_{0}}^{s}(\boldsymbol{x}_{0})=\frac{1}{2\left|s\right|}\log\lambda_{max} \left(\boldsymbol{\mathcal{C}}_{t_{0}}^{s}(\boldsymbol{x}_{0})\right),\end{equation}
and the active LAVD (aLAVD) fields
 \begin{equation} \mathrm{aLAVD}_{t_{0}}^{s}(\boldsymbol{x}_{0}):=\frac{1}{s}\int_{0}^{s}\left|\boldsymbol{w}\left(\boldsymbol{\mathcal{F}}_{(t_{0},\boldsymbol{x}_{0})}^{\tilde{s}}(\boldsymbol{x}_{0})\right)-\bar{\boldsymbol{w}}\right|{\rm d}\tilde{s}.\end{equation}
Here,  $\boldsymbol {\mathcal {C}}$ is the active Cauchy–Green strain tensor generated by the active flow map
  $\mathcal {F}$, and
  $\boldsymbol {w}$ is the vorticity of the active barrier field
  $\nabla ^2\boldsymbol {v}$.
The barrier time  $s$ is a non-dimensional geometric parameter corresponding to integration times of trajectories of the barrier equations. As such, it has no direct fluid dynamical meaning. This is akin to using the parameter
  $\tau$ in the differential equation
  ${\rm d}\boldsymbol {x}/{\rm d}\tau = \boldsymbol {v}(\boldsymbol {x},t)$ to calculate instantaneous streamlines in a velocity field. In a normalized unit barrier vector field,
  $s$ is precisely the arc length of a barrier trajectory and would then control directly the barrier length scales revealed by the Lagrangian diagnostics. For non-normalized vector fields, we do not have this direct connection to physical scales. In our situation,
  $s$ influences the length of barrier field trajectories and whether or not initially nearby trajectories will have time to separate and reveal barrier structures.
3. Dynamical equations and numerical method
Rotating RB convection is governed by a set of equations including the continuity equation, the Navier–Stokes equations and the convection–diffusion equation of temperature. Under the Oberbeck–Boussinesq approximation, they are given in their dimensionless forms as
 \begin{gather} \boldsymbol{\nabla}\boldsymbol{\cdot}\boldsymbol{v} = 0, \end{gather}
 \begin{gather}\frac{\mathrm{d}\boldsymbol{v}}{\mathrm{d}t} ={-} \boldsymbol{\nabla} P + \sqrt{\frac{{Pr}}{{Ra}}}\,\nabla^2\boldsymbol{v} + \varTheta {\boldsymbol{e}}_z - \frac{1}{{Ro}}\,{\boldsymbol{e}}_z\times\boldsymbol{v}, \end{gather}
 \begin{gather}\frac{\mathrm{d}\varTheta}{\mathrm{d}t} = \frac{1}{\sqrt{{Pr}\,{Ra}}}\,\nabla^2\varTheta. \end{gather}
Here,  $\boldsymbol {v}$,
  $P$ and
  $\varTheta$ are the dimensionless velocity, pressure and temperature fields, respectively, normalized by the height
  $H$ between the plates and the free-fall velocity
  $U_0=\sqrt {\alpha g \delta T H}$, where
  $\alpha$ is the isobaric thermal expansion coefficient,
  $g$ is the gravitational acceleration, and
  $\delta T$ is the temperature difference between the upper and lower plates. The pressure field
  $P$ is reduced further by the hydrostatic balance and centrifugal contributions. Hence the set of equations depends on three control parameters: the Prandtl number
  ${Pr}=\nu /\kappa$, the Rayleigh number
  ${Ra}=\alpha g \delta T H^3/(\nu \kappa )$ and the inverse Rossby number
  ${Ro}^{-1}=2\varOmega H/U_0$, where
  $\nu$ is the kinematic viscosity,
  $\kappa$ is the thermal diffusivity, and
  $\varOmega$ is the rotation rate. Time will be measured in terms of the free-fall time scale
  $t_{ff}=H/U_0$.
The RB system (3.1)–(3.3) is confined to a cylinder of diameter to height ratio  $\varGamma =0.5$, with no-slip boundaries at the plates and the sidewall. The top and bottom plates are isothermal with
  $\varTheta =0$ and
  $\varTheta =1$, respectively, whereas the sidewall is adiabatic. In our simulations, we keep
  ${Pr}=4.38$ and
  ${Ra}=2\times 10^8$ fixed, and consider the cases for no rotation (
 ${Ro}^{-1}=0$), ‘optimal’ intermediate rotation (
 ${Ro}^{-1}=6.25$), and rapid rotation (
 ${Ro}^{-1}=33.\bar {3}$); see figure 1 and Hartmann et al. (Reference Hartmann, Verzicco, Kranenbarg, Lohse and Stevens2022).
We solve (3.1)–(3.3) by using a central second-order-accurate finite-difference scheme on a staggered grid (see Verzicco & Orlandi Reference Verzicco and Orlandi1996; Verzicco & Camussi Reference Verzicco and Camussi1997, Reference Verzicco and Camussi1999). The computational domain consists of  $N_\vartheta \times N_r\times N_z=384\times 64\times 256$ grid points in the azimuthal, radial and vertical directions, respectively. The grid points are further clustered towards the plates and the sidewall to ensure a sufficient resolution of the boundary layers (Shishkina et al. Reference Shishkina, Stevens, Grossmann and Lohse2010) and the Kolmogorov scales in the entire domain. More details about the simulations can be found in Hartmann et al. (Reference Hartmann, Verzicco, Kranenbarg, Lohse and Stevens2022), on which the three analysed cases of this study are grounded. For our analysis, we consider a period of 25 free-fall times in the statistically stationary regime (
 $800\leq t/t_{ff}\leq 825$). We note that the 3-D flow fields are horizontally interpolated to a Cartesian grid in the post-processing to apply the different barrier diagnostics.
4. Results
We investigated the role of transport barriers in RB convection for three different strengths of rotation, representing three distinct flow regimes. In figure 2, we show horizontal slices of the temperature field  $\varTheta$ near the bottom wall and in the centre for our three different simulations. Figures 2(a–c) intersect our flow volume at
  $z/H=0.1$, whereas figures 2(d–f) show intersections at
  $z/H=0.5$. Further quantitative analysis will utilize the entire volume for all three flows.

Figure 2. Comparison of instantaneous snapshots of temperature in RB convection for three different Rossby numbers. Panels (a–c) shows  $\varTheta$ at
  $z/H=0.1$, whereas panels (d–f) reveal structures closer to the heat source at
  $z/H=0.1$. All colormaps are centered around the plane-averaged temperature
  $\langle\varTheta\rangle_\mathcal{H}$ at that height. Classical non-rotating RB convection, Ekman pumping in vertically aligned vortices, and sidewall boundary flow characterizes the flow in panels (a,d), (b,e), and (c,f), respectively.
The temperature fields describe qualitatively the influence of distinct flow structures on fluid organization. Figures 2(a) and 2(d) reveal highly turbulent mixing for  ${Ro}^{-1}=0$. In figure 2(b), three distinct hot vortices reveal evidence of ongoing Ekman pumping at
  $Ro^{-1}=6.25$, which becomes less evident at
  $z/H=0.5$ (figure 2e). At the highest rate of rotation,
  ${Ro}^{-1}=33$ in figures 2(c) and 2(f), the flow is much less turbulent, with the dominant features along the sidewall depicting the dominant roll of wall modes. We investigate the agreement of these signatures with advective, diffusive and momentum barriers, as well as providing additional insights on fluxes from our transport barrier focused approach in the following subsections.
4.1. No rotation
For the strongly convective case with no rotation ( ${Ro}^{-1}=0$), our transport barrier diagnostics reveal a complex network of hyperbolic and elliptic structures both in the fluid velocity field, and in the momentum barrier field. In figures 3(a) and 3(d), we plot temperature and vertical velocity, respectively, alongside aLAVD, aFTLE, LAVD and DBS fields at
  $z/H=0.5$ for the same dimensionless flow time (
 $t/t_{ff}=809$) as that visualized in figure 2(d).

Figure 3. Comparison of temperature and velocity (a,d) with active (b,c), advective (e) and diffusive (f) barriers for the non-rotational flow ( ${Ro}^{-1} = 0$) at
  $t/t_{ff}=809$ and
  $z/H=0.5$. The Eulerian momentum barriers (b,c) show the greatest complexity, but there is a very similar general organization of the flow at the advective fluid barriers (e) and diffusive heat barriers (f). There is a notable increase in structural complexity for all diagnostics when compared with temperature and velocity in (a,b).
Figures 3(b) and 3(c) reveal instantaneous momentum barriers in aLAVD and aFTLE fields calculated from an active barrier field integration time  $s=5$. We remain consistent with this integration time for all values of
  ${Ro}^{-1}$. Many of the same organizing structures can be identified in both the aLAVD and aFTLE fields. For example, rotationally coherent momentum barriers appear as both concentric families of circular aLAVD level sets around maxima and regions encircled by aFTLE ridges.
Separations between hot and cold plumes in figure 3(a) clearly correlate with momentum barriers, but the momentum barriers are actually much more complex than one would expect from the temperature field alone. For the region  $y>0$, there is one such robust hot–cold interface, in figure 3(a), corresponding with a separation between ascending and descending fluid in figure 3(d). Both aLAVD to aFTLE highlight structures parallel to
  $\varTheta =\langle \varTheta \rangle _{\mathcal {H}}$, but multiple spiralling features are also revealed in adjacent regions with significantly weaker temperature and velocity signatures. The vortex that appears to mix warm and cold regions at approximately
  $(x,y)=(0,0.5)$ will be investigated further in § 5. Further qualitative comparisons reveal many additional detailed structures in aLAVD and aFTLE, whereas a seemingly low-pass filtered version of such features is present in the temperature and velocity fields.
Figure 3(e) shows the intersection of coherent Lagrangian vortices with the  $z/H=0.5$ plane. In contrast to the instantaneous active barrier field approach used for identifying barriers in figures 3(b) and 3(c), these rotational structures are generated by advecting fluid particles in the time-varying fluid velocity field. We use the inverse flow map, beginning at
  $t=809$ and integrating backwards in time. As mentioned before, calculating LAVD this way reveals the rotational behaviour of the fluid between
  $t=805$ and
  $t=809$, and plots the transport barriers locations at
  $t=809$. Figure 3(f) complements this analysis and shows barriers that maximize diffusive heat transport as DBS ridges from the inverse flow map.
Similar to our comparison with momentum barriers, the advective and diffusive barriers also show a general agreement with the scalar distribution in figure 2(a). This confirms that DBS is indeed a predictive field as its computation relies solely on the velocity field, requiring no diffusive simulation. There is a strong correlation between DBS and LAVD features, and they both reveal more detail about the internal structure of advective and diffusive barriers than one sees in  $\varTheta$ or
  $v_z$. For example, there are multiple double-plume structures, such as at
  $(x,y)=(-0.1,\pm 0.1)$, whose vortices are not clearly defined in figures 2(a) or 2(d). There is also a difference between the instantaneous momentum barrier features and the Lagrangian structures, such as the double plume at
  $(x,y)=(-0.1, -0.1)$. These differences will be explored in more detail in § 5.
4.2. Optimal intermediate rotation
For the intermediate rotation case ( ${Ro}^{-1}=6.25$), our transport barrier diagnostics still reveal a complex network of active, advective and diffusive transport barriers. In figure 4, we plot
  $\varTheta$,
  $v_z$, aLAVD, aFTLE, LAVD and DBS fields at
  $z/H=0.1$ at the same dimensionless flow time (
 $t/t_{ff}=805$) as that visualized in figure 2(b), and computed with the same advection time scales as in § 4.1.

Figure 4. Comparison of advective, diffusive and active barriers for the intermediate rotational case ( ${{Ro}}^{-1} = 6.25$) at
  $t/t_{ff}=805$ and
  $z/H=0.1$. The momentum barriers visible in the active Eulerian diagnostics (b,c) again show the greatest complexity, but all diagnostics clearly emphasize the dominant Ekman vortices in the flow. (e) Three rotationally coherent vortices, largely independent of each other. (f) The diffusive heat barriers further support the separation of the flow into minimally interacting domains.
In figures 4(b) and 4(c), we see the three Ekman vortices act as instantaneous momentum barriers in aLAVD and aFTLE fields. Surrounding these prominent features are momentum barriers that are limiting momentum transport near the cores, effectively separating core regions from each other. This behaviour can be seen as convex ridges of aLAVD and aFTLE that parallel and contour the ridges that define the central cores. Along approximately  $y=0.15$, we see one such momentum barrier that agrees loosely with the
  $\varTheta =\langle \varTheta \rangle _{\mathcal {H}}$ contour, separating that zone by blocking momentum transport into the other Ekman vortices. Some other momentum barriers have a less visible effect on the spatial distribution of
  $\varTheta$.
Figures 4(e) and 4(f) show the  $x$–
$x$– $y$ intersection with advective and diffusive transport barriers at the same height. These Lagrangian diagnostics show a clear dominance of the Ekman vortices, and much less of the small-scale transport barrier behaviour seen in the instantaneous momentum barrier diagnostics. One significant similarity with momentum barriers here is the organization of LAVD and DBS contours that separate the Ekman vortices from each other and from the centre of the cylinder. The extent of this separation, and the exact locations of these barriers, cannot be obtained from
  $\varTheta$ alone in figure 4(a). Separating the flow by along
  $v_z=0$ contours in figure 4(d) also suggests an organization of the flow that does not coincide strictly with momentum or heat transport.
4.3. Rapid rotation
In our final example, we compare advective, diffusive and active barriers for an RB flow with high rotational strength. In figure 5, we compare  $\varTheta$,
  $v_z$, against aLAVD, aFTLE, LAVD and DBS fields at
  $z/H=0.1$ at the same simulation time as that visualized in figure 2(c), computed with the same advection time scales as in the previous two subsections.

Figure 5. Comparison of temperature and velocity (a,d) with active (b,c), advective (e) and diffusive (f) barriers for the rapid rotation case ( ${{Ro}}^{-1} = 33$) at
  $t/t_{ff}=811$ and
  $z/H=0.1$. All barrier diagnostics highlight the features of sidewall boundary flow due to convective wall modes.
In figures 5(b) and 5(c), momentum barriers appear with considerably less complexity than in the previous two simulations. These features largely parallel  $\varTheta$ contours in figure 5(a). There are two major features that are related to sidewall boundary flow resulting from the high rate of rotation. Our two Lagrangian diagnostics reveal advective and diffusive barriers at the same locations with approximately the same level of complexity, with some additional detail at the crossovers from the cold to the warm fraction of the wall mode. This is in direct contrast to the previous two simulations, where there was a large-scale agreement between all barrier types, but at finer scales, many differences could be found. The only thing that changed between all simulations is the rotational strength
  ${Ro}^{-1}$. Comparing these three flows, it appears that the degree to which advective, diffusive and active barriers agree in rotating RB convection depends on the relative role of Coriolis and buoyancy forces. We investigate the role that mechanically stabilizing forces play in heat and momentum organization, and how momentum and heat transport barriers influence the flow, in the following subsections.
4.4. Bulk agreement of heat and momentum transport
By varying the Rossby number, we are able to evaluate the role of purely convective and Coriolis-influenced structures in rotating RB convection. In our non-rotating case,  ${Ro}^{-1}=0$, the flow consists of turbulent convective plumes. In the high rotational strength case, the Coriolis effect impedes vertical mixing in the bulk and triggers the formation of a sidewall boundary flow. In both cases, transport barriers of heat and momentum govern the mixing of these variables throughout our flow.
The direction and magnitude of the diffusive transport of heat can be quantified by the gradient of  $\varTheta$. A coherent structure that effectively limits the mixing of heat will in turn generate a significant concentration of heat, and a large temperature gradient will form along the structure boundary. These strong gradients are clearly visible surrounding the Ekman vortices in figure 2(b), which are responsible for the increase in the normalized heat transport in figure 1. Momentum transport barriers have been shown by Haller et al. (Reference Haller, Katsanoulis, Holzner, Frohnapfel and Gatti2020) to be stream surfaces in the barrier field (2.8). Therefore, along a surface that acts as a transport barrier that constrains the transport of both momentum and heat, the inner product of the vectors
  $\langle \nabla ^2 \boldsymbol {v}, \boldsymbol {\nabla } \varTheta \rangle$ is equal to zero. In figure 6, we show discrete probability histograms of this inner product, after normalizing by vector lengths
  $|\nabla ^2\boldsymbol {v}|$ and
  $|\boldsymbol {\nabla } \varTheta |$, for the entire flow volume over 26 free-fall time units for each strength of rotation. We use 500 equal-width bins spanning
  $\pm 1$.

Figure 6. Discrete probability histograms of momentum flux and heat flux inner products for the three strengths of rotation. Momentum and heat orthogonality increases as mechanical influence on flow structure dominates convective influence.
All three flows in figure 6 show a clear probability peak around zero, indicating a general bulk agreement between momentum and heat transport barriers. As this calculation is applied for every grid cell, and not just along transport barrier surfaces, some variability around zero is to be expected. This probability indicates that the transport of momentum and heat is governed largely by similar features in the flow, though some fine-scale disagreement exists. The variance of the three distributions in figure 6 is compared in table 1. The decrease in variance with increase in  ${Ro}^{-1}$ quantifies the enhanced barrier field agreement by Coriolis forces. As well, the percentage of momentum barrier and diffusive heat flux vector pairs with the angle between them,
  $\beta =\cos ^{-1}({\langle \nabla ^2\boldsymbol {v}, \boldsymbol {\nabla }\varTheta \rangle }/{|\nabla ^2\boldsymbol {v}|\, |\boldsymbol {\nabla }\varTheta |})$, being between
  $80^\circ$ and
  $100^\circ$, exhibits a similar trend. Both
  $\beta$ and the variance confirm that the inner product distributions contract around zero as transport barriers become strongly modified by both buoyant convection and rotational stabilizing forces.
Table 1. Statistics from normalized inner product of heat and momentum barrier field vectors. For decreasing rotational strength, there is an increase in the variance of barrier field inner products due to less agreement between heat and momentum barriers. The percentage of barrier field vector pairs with an angle between them ( $\beta$) less than ten degrees also decreases as rotational strength decreases.

These inner products quantify the agreement of heat and momentum fluxes, and the similarity of heat and momentum organizing structures. Both heat and momentum barriers influence the evolution of the flow field, and changes in inner product distributions reveal when these structures are in direct competition for organizing the flow. We investigate this balance further in § 5.2.
5. Discussion
5.1. Comparison of advection, heat and momentum barriers
In the work of Haller et al. (Reference Haller, Katsanoulis, Holzner, Frohnapfel and Gatti2020), DBS was found as the solution of an extremum problem aimed to highlight diffusive transport barriers to scalar fluxes. In the original derivation, however, the authors were able to verify this diffusive transport barrier behaviour only by looking at the evolution of an initial scalar concentration that evolves passively with the flow. The present work is the first verification that DBS ridges indeed represent heat transport barriers that constrain the heat distributions that modify the flow.
To date, there has been no investigation of the interplay of advective, diffusive and active barriers, and no investigation of any of these barriers in flows with both convective and mechanically modified velocity fields. It is exceptional to note that many of these barriers show ample agreement for our three cases, though they are all derived with distinct mathematical approaches. For example, in the intermediate rotation case with Ekman pumping ( ${Ro}^{-1}=6.25$), the rotational LCS, seen as closed convex contours surrounding LAVD maxima, align precisely with the Ekman vortices in the temperature field, as well as the diffusion-maximizing DBS ridges, and are parallel to the active momentum barriers in aLAVD and aFTLE. We make this comparison more rigorous by isolating one such LAVD level surface and quantifying the flux of momentum and heat transport across it.
In figure 7, we show how these three kinds of transport barriers align for the Ekman vortex case. Figure 7(a) shows the  $\mathrm {LAVD}=0.06$ level surfaces that intersect the Ekman vortex contours at
  $z/H=0.1$. This is only an approximation to more complex elliptic LCS extraction methods (see Neamtu-Halic et al. Reference Neamtu-Halic, Krug, Haller and Holzner2019), but shows how robust LAVD fields are for identifying rotationally coherent 3-D transport barriers in time-varying flows. In fact, figure 7(b) shows the degree of orthogonality of momentum and heat flux vectors with the gradient of the LAVD field. This discrete probability histogram evaluates the heat and momentum transport limiting behaviour of arbitrary LAVD level sets in the entire flow domain. We find a high degree of tangency between LAVD level sets and momentum flux barriers, as seen by a familiar peak around zero, with a variance of 0.16, and
  $|\beta -90|<10^\circ$ for
  $40\,\%$ of the vector field. That is, any structurally stable LAVD isosurface will provide a good barrier to momentum transport, regardless of the chosen LAVD value. Similarly, the temperature gradient is largely parallel to the LAVD gradient, as seen with sharp maxima in inner product values at
  $\pm 1$ and
  $\beta <10^\circ$ for
  $20\,\%$ of the vector field.

Figure 7. (a) Ekman vortices as LAVD isosurfaces (advective barriers). (b) Inner product of both diffusive heat flux and momentum flux with LAVD gradient. (c) Inner product of both diffusive heat flux and momentum flux with LAVD isosurface normal vectors. (d) Inner product of diffusive heat flux and momentum flux vector along isosurface.
We calculate the distribution in figure 7(c) by restricting our focus to the level set approximation of the Ekman vortices in figure 7(a). Here, we find an even stronger orthogonality between momentum flux and the passive barrier normals. The variance of momentum flux and LAVD gradient inner products reduces to 0.13, with  $|\beta -90|<10^\circ$ for
  $46\,\%$ of the surface vectors, suggesting minimal leakage of momentum out of the actual Ekman vortices. The distribution of heat flux angles also aligns with
  $|\beta |<10^\circ$ for
  $44\,\%$ of the vectors.
Figure 7(d) compares the agreement of heat and momentum flux for every point on our advective barriers from figure 7(a). On the surface of this elliptic LCS, we find that there is also a strong pointwise agreement of heat and momentum transport, with a similar maximum around zero, and variance only 0.13. This is a smaller variance than the bulk values shown in table 1. That is, even though LAVD is a diagnostic field designed to identify elliptic LCS (advective barriers), LAVD isosurfaces localize where connections between momentum, heat and fluid advection barriers in RB flow are strengthened. As well, surface-specific analyses like this also provide a means to quantify objectively changes in momentum and heat transport behaviour in a manner that is temporally and spatially resolved, and can follow material features as they deform. This further opens the door to evaluating the conditions under which momentum and heat fluxes are not in agreement.
As seen in figure 6, the  ${Ro}^{-1}=0$ case shows the greatest disagreement between momentum and heat geometries. We will now focus on examples of two structures with different momentum and heat transport limiting abilities. If we zoom in on the central region of the
  $z/H=0.5$ slice from figure 3, then we see what appears to be a cylindrical momentum barrier. We have isolated this region in figure 8. We extract the outermost closed convex contour surrounding the aLAVD maximum in the centre of figure 8(a). Though not presented here, the aFTLE field also reveals concentric closed ridges in the same region (figure 3b).

Figure 8. An example of an elliptic momentum barrier as it intersects the  $z/H = 0.5$ plane in the
  ${Ro}^{-1}= 0$ flow. This momentum barrier is entraining fluid into its core and is thus not behaving as a perfect heat transport barrier. However, the warm fluid is entering from only the right-hand side (RHS) of the vortex, as can be seen by alignment of DBS ridges with aLAVD contours on the left-hand side of the core. The fluid mixing by this structure is also evident in the inner product distribution of heat and momentum flux.
When we compare this momentum blocking feature with the Lagrangian DBS field (figure 8b), instead of a closed curve, we see a plume wrapping in on itself, entraining surrounding fluid. The magnitude of  $\boldsymbol {\nabla }\varTheta$ in figure 8(c) shows that indeed there are relatively high gradient ridges parallel to the momentum barrier in red (on the left), but there are also level sets of constant temperature that are mixing in to the momentum core (from the right). In figure 8(d), we visualize the normalized momentum and heat flux inner product, and compare to the location of the momentum vortex core. Here, there is clear evidence of the entrained fluid. The direction of momentum transport and diffusive heat flux are actually parallel for two arms of the swirl (marked 1 and 2), entering from the right. This is in direct contrast to the typical orthogonality of momentum and diffusive heat flux that we have seen for other barriers, and is seen on the left-hand side of the momentum barrier in zone 3.
Using our closed aLAVD contour as initial positions, we can also extract the stream surface rigorously by calculating trajectories in (2.8). This barrier stream surface perfectly blocks active momentum transport. On the surface, however, the temperature gradient follows a wide range of orientations, and is orthogonal on only part of the surface. In figure 8(e) we find the probability distribution of the heat momentum inner products for this 3-D stream surface in red, with the three zones from figure 8(d) also marked. We see many more spikes away from zero than in previous distributions, suggesting a more complex relationship with the roles of heat and momentum for fluid organization in this region. The same distribution from the entire plane  $z/H=0.5$ is shown as a black curve in the background, and provides a useful comparison for average behaviour in the same region.
Though  ${Ro}^{-1}=0$ shows the greatest relative disagreement between momentum and heat flux vectors for our three flows, there is still significant alignment between heat and momentum barriers in this turbulent flow. We highlight one such hyperbolic momentum barrier that acts as a barrier for both momentum transport and temperature mixing. Shifting our focus to the dominant hot–cold interface in figure 9, we identify an aFTLE ridge in red (figure 9a) that shows close approximation to LAVD and
  $\varTheta$ contours. While aFTLE and
  $\varTheta$ are both Eulerian diagnostics, and LAVD is Lagrangian, we can see there is actually greater agreement between
  $\varTheta$ (figure 9c) and LAVD contours (figure 9d) around our momentum barrier in red. Using this red curve as initial conditions, we again calculate the full 3-D momentum barrier as a stream surface in (2.8). For this hyperbolic momentum barrier, we find a much clearer peak probability distribution of heat momentum orthogonality shown in red in figure 9(e) than the bulk
  $z/H=0.5$ distribution shown in black. This confirms our qualitative conclusion that this aFTLE ridge is effectively isolating a momentum barrier that also limits the mixing of heat across it.

Figure 9. An example hyperbolic manifold in the momentum barrier field intersecting the  $z/H=0.5$ plane represented as an aFTLE ridge for the
  ${{Ro}}^{-1} = 0$ flow. This momentum transport barrier is also behaving as a wall between cold and warm regions of the flow, thus maximizing diffusive heat transport.
5.2. Feedback of convection generating momentum and organizing the flow
In § 4.4, we found that the agreement between heat and momentum fluxes varies with the strength of rotation. Specifically, when fluid motion is dominated by mechanically generated structures, the momentum and heat transport barriers are more closely aligned. We propose that this is the result of a feedback mechanism of balancing forces that organize the flow.
Starting with the case when rotational strength is large, and convection plays a smaller role in organizing motion, we know that heat distributions are more passively organized in the flow. This can be interpreted physically by a large Péclet number. This relationship is to be expected, and previous work has shown that DBS fields can identify accurately diffusive transport extremizers for scalar concentrations that have no influence on the flow, solely from the velocity field (Haller et al. Reference Haller, Karrasch and Kogelbauer2018). In flows with no convective influence, active momentum barriers have also been shown to align with advective transport barriers, and advective barriers themselves can have a close resemblance to diffusive transport barriers (Haller et al. Reference Haller, Katsanoulis, Holzner, Frohnapfel and Gatti2020; Katsanoulis et al. Reference Katsanoulis, Farazmand, Serra and Haller2020).
The high rotational strength system may be thought of as a situation where momentum transport barriers not only organize the distribution of momentum, but also drive the fluid motions that organize the relatively passive distribution of heat. Through this connection of active, advective and diffusive barriers, we find that the flow of momentum coincides closely with features that effectively block scalar transport across them. This is why momentum barriers have large temperature gradients across their boundaries, and is precisely what we see in figure 6, where higher rotational strength ( ${{Ro}}^{-1}=33$) generates stronger orthogonality of momentum and heat fluxes.
As we decrease the rotational strength, the role of buoyancy increases and the transport of momentum becomes more complex. Thermal plumes can now generate more momentum, meaning that the location and shape of momentum barriers are no longer dominated by just mechanical forcing. However, the transport of momentum is not governed solely by the heat gradients either, even in the non-rotational case. This is clearly true since we are dealing with fluid motions that are interacting with the walls of a bounded domain. The organization of momentum barriers has a clear connection to fluid motion by definition, which again influences the mixing of heat in the flow. Thus there is a feedback from the momentum barriers back into heat barrier formation by way of the velocity field. We find that this heat–momentum feedback, or competition between forces, is most complex at low  ${Ro}^{-1}$ when there is the lowest agreement between active, advective and diffusive heat barriers. This provides a structure-based understanding of the degree to which the mixing of these scalar and vector values is correlated. For example, there is still some heat and momentum flux alignment, and figures 8 and 9 help to discriminate when momentum and heat barriers can agree for
  ${Ro}^{-1}=0$.
When we consider separate fixed regions in our flow domain, we can compare the influence of the walls on the geometries of heat and momentum barriers. In figure 10, we look at discrete probability histograms of momentum and heat flux inner products near the top and bottom of the cylinder ( $z/H<0.01$ and
  $z/H>0.99$). We find that the thermal boundary layer height
  $\lambda _T$ (Stevens, Clercx & Lohse Reference Stevens, Clercx and Lohse2010) is of the order of this range, equalling
  $1.11\times 10^{-2}$,
  $9.37\times 10^{-3}$ and
  $3.43\times 10^{-2}$ for the three flows, in order of increasing strength of rotation. Sidewall boundary layer theory is less developed for weakly rotating RB flows, so we also looked at inner products in an outer region defined as the outermost
  $15\,\%$ of the volume (
 $r/H>0.23$), and took the complement of all these regions to be the inner region of the flow. We are limited as to how close we can get to the cylindrical walls by interpolated Cartesian grid used for the barrier diagnostics.

Figure 10. Discrete probability histograms of momentum flux and heat flux inner products for the three strengths of rotation in different regions of the flow domain. Momentum and heat orthogonality increases as mechanical influence on flow structure dominates convective influence for all regions when comparing the highly rotational and non-rotational cases. For the optimal intermediate rotation, outer region orthogonality decreases slightly, while the other two regions are enhanced.
Momentum in ascending and descending fluid is redirected as that fluid deforms along the upper and lower plates, respectively. As these hot and cold plumes react to the plates of the flow domain, the deformation of diffusive barriers and momentum barriers is strongly coupled. This results in a larger degree of agreement in active and diffusive barriers in the top and bottom regions for all three values of  ${Ro}^{-1}$, where orthogonality still increases with increasing rotation strength. The peak probability for the top and bottom region inner products is larger than the respective bulk values in figure 6, with a smaller variance and more closely aligned flux vectors (table 1). Though there is a strong thermal influence at the lower plate, inner product distributions are nearly identical if we further separate fluid near the top versus bottom (not pictured). This shows that we have found a zone with a particularly strong agreement between momentum and heat transport, resulting from a largely mechanical influence as the vertically moving fluid is redirected when impacting the plates and has no other options.
In comparison, the inner region of the domain reveals significantly less agreement between momentum and heat transport, less than half the probability in the strong rotation case. The inner and outer domains still show a general peak probability around zero, indicating some momentum and heat transport coupling. When we isolate outer wall and inner domains, trends in the probability distribution with increasing  ${Ro}^{-1}$ are less clear. This is especially evident for the outer wall distribution peak that actually decreases slightly from
  ${Ro}^{-1}=0$ to
  ${Ro}^{-1}=6.25$ before increasing substantially for
  ${Ro}^{-1}=33$. This requires further investigation, but may be due to the discretization of the round walls used for calculations of the velocity Laplacian, versus the original cylindrical coordinates used for the flow simulations. Using a different flow geometry, such as in a rectangular RB simulation, would help to answer this question and generate further comparison of the interplay between advective, diffusive and active barriers. This may also be related to the specific role played by the Coriolis force, enhancing thermal convection at
  ${Ro}^{-1}=6.25$ and suppressing it at
  ${Ro}^{-1}=33$.
To put our work in context with recent findings, we investigate the average strength of forces associated closely with the diffusive and active barriers. The viscous and buoyancy forces can be written in dimensionless form as
 \begin{equation} \boldsymbol{F}_V=\sqrt{\frac{{Pr}}{{Ra}}} \, \nabla^2\boldsymbol{v}, \quad \boldsymbol{F}_B=\varTheta {\boldsymbol{e}}_z . \end{equation}
In the spirit of the work of Aguirre Guzmán et al. (Reference Aguirre Guzmán, Madonia, Cheng, Ostilla-Mónico, Clercx and Kunnen2021), we compute the coordinate-averaged root mean square (r.m.s.) of the two forces in both the vertical and radial directions. That is, for each force, its r.m.s. value is defined as
 \begin{equation} F(-)=\sqrt{\left\langle \bigl(F_x - \langle F_x \rangle\bigr)^2 + \bigl(F_y - \langle F_y \rangle\bigr)^2 + \bigl(F_z - \langle F_z \rangle\bigr)^2\right\rangle }, \end{equation}
where angle brackets indicate averaging over fixed values of  $r$ or
  $z$, with
  $F$ being a function of the respective coordinate. In figure 11, we plot the plane-averaged and radial-averaged ratios of viscous and buoyancy forces over all time steps for each of our three strengths of rotation. Momentum transport barriers under investigation here are tangent to
  $\boldsymbol {F}_V$, whereas diffusive barriers will organize regions of uniform
  $|\boldsymbol {F}_B|$. Following findings from previous work, one might expect a large ratio
  $\boldsymbol {F}_V/\boldsymbol {F}_B$ when momentum structures are strongly influential and diffusive barriers are aligned passively.

Figure 11. Ratios of coordinate-averaged r.m.s. viscous and buoyancy forces for each of the three flows: (a) plane-averaged force balance; (b) averages for a given radius.
In figure 11, we plot only the lower half of the cylinder as there is a rough vertical symmetry in the ratios and this allows the use of log-log plots to more easily separate ratios for the different cases. Closest to the lower plate (low  $z$, figure 11a), we find that the ratio of mean viscous and buoyancy forces follows a trend similar to that of momentum and heat flux orthogonality. This supports our interpretation that the flow is more strongly organized by the behaviour of momentum barriers, with the coherent heat structures playing a more passive role.
Outside this region, however, the relationships that we have described between active and diffusive barriers does not appear to extend to the bulk r.m.s. ratios of viscous and buoyancy forces. In the interior of the flow, seen as large  $z$-values and small
  $r$-values in figures 11(a) and 11(b), respectively, heat and momentum flux orthogonality trends are not reflected in the force balancing. If these force balances were directly connected to the dominant organizing transport barrier, then we would expect dominant viscous forces for
  ${Ro}^{-1}=33$ over all values of
  $z$, but this is not the case. In the large-
 $r$ outer region of the flow, we also find a contradictory relationship between the magnitude of viscous and buoyancy forces versus the dominating nature of momentum barriers in the flow. Away from the top and bottom of the domain,
  $F_B$ is consistently larger than
  $F_V$, which we previously suggested increased the complexity of heat–momentum barrier relationships and the transport of momentum. If we sort the
  ${Ro}^{-1}$ cases according to the magnitude of
  $\boldsymbol {F}_V/\boldsymbol {F}_B$, then this sorting does not coincide with regional trends of heat and momentum transport alignment seen in figure 10 and table 1.
While the previous subsections have clearly displayed a connection between heat and momentum transport barriers, and a tendency towards closer agreement with increased mechanical influence, this connection is not always readily available when looking at coordinate averages of the magnitudes of the forces being constrained by these barriers. Indeed, figures 7–9 show the enhanced heat–momentum alignment in our own discrete probability histograms when going from a bulk scale to calculations along the actual transport barriers. By investigating heat and momentum flux through the individual structures, we can show more accurately when and how momentum and heat transport are coupled. We suspect that these highly localized processes are lost when averaging bulk forces across larger scales.
6. Conclusions and outlook
We find that recent advances in deriving mathematical representations of various flow structures, and the effort to make them objective, are paying off. In the present work, we conducted the first comparison of advective, diffusive and active transport barriers in a physically relevant and highly non-trivial 3-D turbulent flow. This provides new insights into organization in rotating RB flow, and general insight into the frame-indifferent correlation of momentum and heat flux. Starting with physical and objective definitions of material coherence, and heat and momentum flux, we were able to identify transport barriers using three distinct mathematical criteria. Given their unique mathematical derivations, it is informative to see advective, diffusive and active barriers reveal qualitatively similar structures in rotating RB flows for a wide range of rotational strength, with specific disagreements arising from the flow physics. We summarize our main findings as follows.
(i) Classically observed rotating RB flow structures (e.g. Ekman vortices and sidewall boundary flow) can be identified using advective, diffusive and active transport barrier methods.
(ii) Transport barrier diagnostic fields reveal greater structural detail than is possible with the underlying temperature, or non-objective velocity fields.
(iii) Higher rotational strength leads to an increased alignment of advective, diffusive and active barriers.
(iv) On the surface of LCS, momentum and heat fluxes show the greatest orthogonality (and transport barrier agreement) in the flow domain, regardless of rotational strength.
(v) In bulk, the orthogonality of momentum and heat flux vector fields follows several trends related to mechanical influence and proximity to the walls.
While it may be intuitive to expect the boundaries of hot and cold fluid transport pathways in RB convection to also determine the location of momentum and advection barriers, we find that the exact pathways are only loosely aligned. As well, precise agreement of heat and momentum fluxes, and the exact shape of each respective transport barrier, vary more with larger Rossby number. We propose that this is connected to a heat–momentum feedback mechanism that is influencing organization of the flow.
The relative influence of mechanically modified and thermally generated structures can be seen in trends in the probability distributions of heat and momentum flux inner products for the entire flow domain. Changes to diffusive heat and momentum flux vector fields result in a progressively decreased alignment of heat and momentum transport that is quantifiable at the finest resolved scales. This gives a predictive marker of thermal and mechanical influence for experimental and observational research when the governing forces are not known a priori.
Variations in flux inner product distributions between individual barrier surfaces provide a coherent structure-based link between diffusive heat and momentum transport that was not known previously. At infinite Rossby number, we are able to identify some strong barriers that block both momentum and heat transport, though other momentum barriers become much less effective at also constraining heat. This distinction between barriers in the same flow further supports the theory that heat and momentum flux orthogonality may act as a predictive tool causally linked to different structure generating processes.
Discriminating individual structures that behave predominantly as heat or momentum barriers, and determining their origin, is possible only with a feature-based approach. Attempts to replicate these distinctions with coordinate-averaged force magnitudes were inconclusive. To identify relevant transport barriers, a self-consistent mathematical definition of a barrier is needed, which must necessarily be frame-indifferent. Here, we have introduced methods to identify several kinds of transport barriers to the study of RB convection, and provided a numeric for validating the ability of an arbitrary structure to actually block momentum or heat transport. This provides a common ground for testing theories of zonal separation and tracking the individual structures governing the temporal evolution of heat flux.
Further investigation following this method of inquiry could improve our understanding of the underlying advective, diffusive and active barriers that control the evolution of RB flows in far more complex geometries and scenarios. For example, DBS ridges effectively predict maximizers and minimizers of diffusive scalar fluxes solely from the velocity field, given a sufficiently large Péclet number. As  $Pe$ can be represented as the product of Prandtl number and Reynolds number, we can identify diffusive heat barriers for arbitrarily large Prandtl number, such as liquid metals, as long as there is a sufficiently large Reynolds number. It is an open question how the agreement of objective momentum barriers and heat barriers will change as the Péclet number increases.
We believe that this first study is crucially important and long overdue. Indeed, there is no a priori reason why three different types of barriers, each based on distinct physical principles and satisfying different mathematical expressions, should coincide or differ from each other consistently. It is also remarkable that the explanation for the cases when fluxes and barriers do not agree follows directly from the differences in the definitions of the structures.
As a representative example of convective flows with analogues in many geophysical and industrial settings, the findings here suggest that deeper insights into a variety of physical phenomena may be possible when analysing coherent fluid structures with this dynamic transport barrier perspective. Furthermore, we advocate for more quantitative material-structure-based studies as there are clear advantages over some bulk statistical approaches.
Acknowledgements
We acknowledge PRACE for awarding us access to MareNostrum 4 based in Spain at the Barcelona Computing Center (BSC) under project 2020235589. This work was partially carried out on the Dutch national e-infrastructure with the support of SURF Cooperative. The authors would also like to thank R. Verzicco and R.J.A.M. Stevens for engaging discussions on this topic.
Funding
N.O.A. and G.H. acknowledge financial support from Priority Program SPP 1881 (Turbulent Superstructures) of the German National Science Foundation (DFG). N.O.A. acknowledges financial support from the Swiss National Science Foundation (SNSF) Postdoc Mobility Fellowship Project P400P2 199190. R.H. and D.L. acknowledge funding by the ERC Starting Grant UltimateRB (no. 804283/ERC-2018-STG) and ERC Advanced Grant DDD (ERC-2016-ADG).
Declaration of interests
The authors report no conflict of interest.
Author contributions
N.O.A., R.H., G.H. and D.L. were all involved in the conceptualization of the research, the analysis of the findings, and the writing of the manuscript. N.A. performed transport barrier computations and visualizations. R.H. performed the RB convection simulations and visualizations.
Appendix
In this appendix, we use the intermediate rotation case ( ${Ro}^{-1}=6.25$) as an example flow to exhibit the resilience of LCS when varying the integration time. In figure 12, we present the
  $t=825$ LAVD field along
  $z/H=0.5$ for integration times (
 $\delta t$) ranging from 1 to 20 free-fall times. At the shortest
  $\delta t$ (figure 12a), one Ekman vortex and several strongly rotational mixing regions already appear. When increasing
  $\delta t$ to 5 and 10 free-fall times (figures 12b,c, respectively), the dominant structures do not change fundamentally, but more fine structure is revealed in the surrounding fluid, and the boundaries between flow features become more distinct. At
  $\delta t=20$ (figure 12d), there is a speckling noise-like effect in the LAVD field. This is in fact not noise, but due to the chaotic separation of trajectories that were initially adjacent to coherent material surfaces, and no longer reflect behaviour on those structures.

Figure 12. Evolution of LAVD fields at  $z/H=0.5$ for the
  ${Ro}^{-1}=6.25$ flow as integration times are increased from
  $\delta t=1$ to
  $\delta t=20$ free-fall times. As trajectory integration increases, LAVD fields first gain additional detail (a,b). Vortex core contours gradually lose their convex shape (c), and trajectories eventually become uncorrelated with initially adjacent elliptic coherent structures due to the chaotic nature of the fluid. This results in a gradual increase in noise for long integrations (d).
The resilience of the momentum and heat flux limiting behaviour of LAVD level sets is presented in figure 13. For all  $\delta t$, we can approximate active and diffusive transport barriers with advective barriers, as seen by familiar discrete probability histograms of LAVD gradient inner products with heat and momentum flux fields for
  $z/H=0.5$. We use only 50 equal-width bins between
  $\pm 1$ to generate this histogram as we have restricted the number of samples to the LAVD plots that are presented. While the clear maxima at
  $\pm 1$ show a strong alignment of the LAVD gradient and temperature gradient for all integration times (figure 13a), there is a decrease in the ability of LAVD level sets to identify boundaries with large temperature gradients if comparing the smallest and largest integration times.

Figure 13. Discrete probability histograms of inner products of LAVD gradients with momentum flux and heat flux for increasing LAVD integration times. As integration times increase, contours of LAVD lose alignment with momentum and heat flux barriers.
In figure 13(b), we see a clear peak around 0 for all  $\delta t$, suggesting the resilience of LAVD level sets to block momentum flux. However, there is a consistent decrease in alignment of advective and active momentum barriers as
  $\delta t$ increases. We believe that the decreased agreement of advective barriers with heat and momentum barriers is due to the influence of chaotic behaviour on the LAVD gradient. Similar behaviour can be expected if one varies
  $\delta t$ for DBS calculations, which also rely on advecting fluid particles in the original time-varying velocity field.
Figure 13 suggests that user discretion can be utilized when choosing  $\delta t$, with only a limited effect on the main findings found in this paper. The changes in the LAVD field at increased integration times are typical for any Lagrangian diagnostic applied to a non-autonomous, aperiodic flow. The precise impact of the chaotic trajectories on the diagnostic depends on the ODE solver used to generate particle paths, as well as the method of flow field interpolation.


 Open access