


1. Introduction
Unsteady flow conditions present a challenge to stable flight (Pines & Bohorquez Reference Pines and Bohorquez2006; Moulin & Karpel Reference Moulin and Karpel2007; Zarovy et al. Reference Zarovy, Costello, Mehta, Gremillion, Miller, Ranganathan, Humbert and Samuel2010), and gust rejection remains a concern for flight control (Jones Reference Jones2020). Large-amplitude, transverse gust encounters represent a canonical unsteady flow condition that has been the focus of many studies dating back to the 1930s. In 1932 Küssner (Reference Küssner1932) studied vertical gust encounters theoretically using potential flow modelling and experimentally by measuring airplane wing deflection in stormy weather. According to Küssner, vertical or transverse gusts are particularly important because they lead to the highest wing stresses when compared with stresses caused by similar strength gusts in other directions. Küssner simulated the effect of a vertical gust on a wing by attributing to it a change in the angle of attack, a modelling problem solved earlier by Wagner (Reference Wagner1925). The sharp-edged gust model developed by Küssner assumes small disturbances and a linear flow with a planar wake, attached flow and the absence of viscosity. Nevertheless, it has been shown to predict loads outside of these assumptions (Biler, Badrya & Jones Reference Biler, Badrya and Jones2019).
During flapping flight, Ellington et al. (Reference Ellington, Van Den Berg, Willmott and Thomas1996) showed the significant influence that coherent structures such as the leading-edge vortex (LEV) can have on lift. Comprehensive gust encounter studies that also reveal coherent structures are now possible using time-resolved particle image velocimetry (PIV). Perrotta & Jones (Reference Perrotta and Jones2017) and Biler et al. (Reference Biler, Badrya and Jones2019) used time-resolved PIV and force measurements to study transverse sine-squared wing-gust encounters at various angles of attack and gust strengths, where gust ratio is defined as the maximum gust velocity relative to the free stream
 \begin{equation} \text{GR}=\frac{v_{g,{max}}}{U_\infty}. \end{equation}
In these studies, the lift peak coincided with the formation of a strong LEV. A subsequent lift deficit coincided with the shedding of the LEV and the formation of a trailing-edge vortex (TEV). The lift deficit was followed by a secondary lift peak and the formation of a second LEV. These observations describe important correlations between specific coherent flow structures and the lift force during transverse gust encounters.
Corkery, Babinsky & Harvey (Reference Corkery, Babinsky and Harvey2018) developed a top-hat transverse gust encounter test apparatus and collected flow visualization, PIV and force measurements for a wing-gust encounter for a gust ratio of 1.0. Similar to Perrotta & Jones (Reference Perrotta and Jones2017), they observed the formation of a strong LEV during the encounter. In addition, they observed the deformation of the shear layers on the boundaries of the gust. These observations reveal violations of the attached flow and non-deforming gust assumptions made in classical gust encounter theory. Despite differences in flow topology between theory and experiment, the authors found that lift force coefficients matched well during entry into the gust, but deviated upon exit. Andreu-Angulo et al. (Reference Andreu-Angulo, Babinsky, Biler, Sedky and Jones2020) expanded these studies by comparing gust encounters with a sine-squared profile and a top-hat profile. Their tests spanned gust ratios  $0.5$ to
  $1.5$ and angles of attack
  $0^\circ$ to
  $20^\circ$. They noted a large force discrepancy in experiments of the same strength gust but different gust profiles. They attributed the discrepancy to differences in the vorticity distribution between the two gust profiles, and a greater amount of circulation shed during top-hat gust encounters. These recent studies have shown the influence of the gust strength and profile. Thus, the coherent structures formed during encounters, as well as the gust characteristics and dynamics that influence their formation are important features for study during controlled manoeuvres to inform future control design.
Recent studies have introduced pitching for the purpose of gust mitigation. In prior work (Sedky, Lagor & Jones Reference Sedky, Lagor and Jones2020b), the authors modelled an unsteady sine-squared gust encounter for various gust ratios using a discrete vortex model (DVM). The authors proposed proportional feedback control to regulate lift during the encounter. The only given parameter for the gust was the reduced frequency range. A closed-loop controller based on proportional feedback of the measured lift was designed to provide a pitch acceleration input. The feedback gain was tuned using Theodorsen's (linear) aerodynamic model, with the gust represented as an additive disturbance to the lift signal, but the controller was tested in a (nonlinear) DVM simulation. The controller performed well despite the various assumptions implicit in the use of Theodorsen's model for tuning. The authors decomposed the resulting forces into a circulatory contribution caused by the evolution of vorticity in the wing's wake, an added-mass contribution caused by the wing's unsteady pitching motion and a non-circulatory contribution from the gust itself. A reduction in the circulatory contribution to the lift force correlated with a reduction in circulation shed from the leading and trailing edges of the wing. The present work provides experimental evidence to support these prior simulation-based findings. Andreu Angulo & Babinsky (Reference Andreu Angulo and Babinsky2021) demonstrated gust mitigation under the effect of an open-loop manoeuvre informed by unsteady aerodynamic theories of Küssner and Wagner. The coefficient of lift  $C_l$ of a gust encounter was calculated using Küssner's gust model, and a pitching profile was chosen such that Wagner's lift response cancelled Küssner's gust response. Although this method required knowledge of the gust, it was effective at gust mitigation, thereby providing further evidence for the usefulness of classical aerodynamic theory in control design for gust mitigation.
Pitching moment is an important consideration for flight stability, especially for lift mitigation strategies that rely on pitch actuation. Pitching manoeuvres may succeed at mitigating lift, but could also introduce large aerodynamic pitching moments that negate successful lift mitigation. Prior experimental and computational studies of wing-gust encounters (Corkery et al. Reference Corkery, Babinsky and Harvey2018; Biler et al. Reference Biler, Badrya and Jones2019; Andreu Angulo & Babinsky Reference Andreu Angulo and Babinsky2021; Badrya, Jones & Baeder 2021) have focused only on the wing's lift response to the gust. The current paper presents the wing's pitching moment response about its midchord for experiments involving three open-loop manoeuvres. The results shed light on the physical mechanisms behind the pitching moments experienced by the wing during these encounters as well as the possible introduction of pitching moment transients when pitch control is used to mitigate lift.
This paper contributes to the study of lift regulation in gust encounters by experimentally implementing and comparing three different open-loop (i.e. prescribed prior to the run) control manoeuvres for gust mitigation. The first manoeuvre is designed such that the wing pitches to oppose the effective angle of attack induced by a non-deforming model of the gust. The effective angle of attack induced by the gust is obtained using quasi-steady thin-airfoil theory to account for the non-uniform velocity distribution along the wing's chord. The second manoeuvre is designed, similar to previous work by Andreu Angulo & Babinsky (Reference Andreu Angulo and Babinsky2021), such that the analytical lift results from the Wagner and Küssner unsteady aerodynamic models oppose each other. The third manoeuvre is obtained from closed-loop control simulations in an unsteady DVM. The contributions of this work are (1) experimental demonstration of three open-loop control manoeuvres for gust attenuation, based on (i) effective angle of attack, (ii) a zero lift in a Wagner-Küssner model, and (iii) a simulation of closed-loop proportional feedback control in a DVM; (2) identification of the physical mechanisms of lift mitigation in these three methods based on experimental measurements and flow field momentum calculations; (3) analysis of the pitching moments experienced by the wing during the manoeuvres; and (4) analysis of the use of DVMs for manoeuvre design based on a comparison of DVM-simulated flow fields with experimental PIV measurements. Although the experiments studied in this paper are open-loop in nature, these contributions are important because they provide further insight into useful mechanisms for force regulation in a gust encounter.
2. Aerodynamic modelling for manoeuvre design
This section introduces the three open-loop manoeuvres examined in this work: a manoeuvre based on effective angle of attack, a Wagner/Küssner manoeuvre and a manoeuvre based on a closed-loop DVM simulation.
2.1. Manoeuvre based on effective angle of attack
The vertical upwash imposed on the wing by a transverse gust induces an effective angle of attack on the wing. Variations in the flow velocity of the gust along the wing's chord cause the local angle of attack to vary as well. Figure 1 illustrates local variations in effective angle of attack induced by an upwash. An effective angle-of-attack expression that integrates the local angle of attack along the chord was derived by Sedky, Jones & Lagor (Reference Sedky, Jones and Lagor2020a) based on quasi-steady thin-airfoil theory.
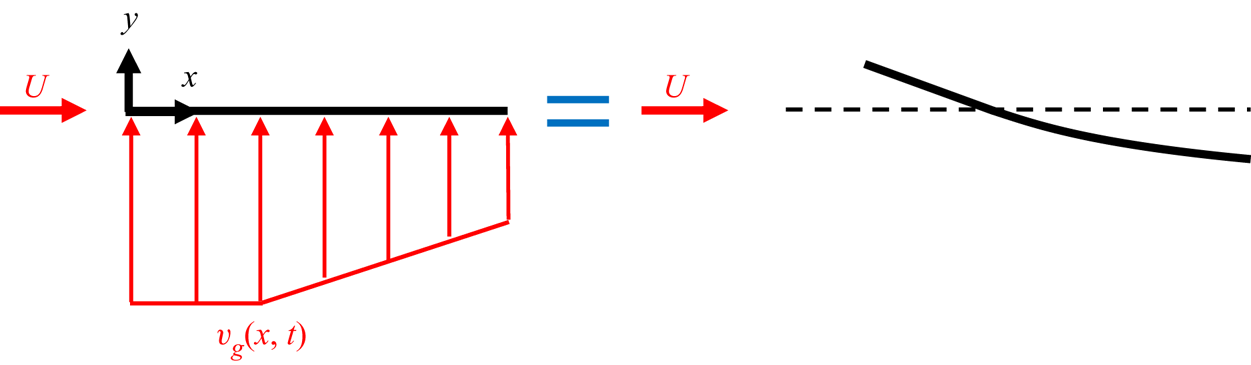
Figure 1. Spatially varying effective angle of attack induced by the gust.
The effective angle of attack  $\alpha _{eff}$ due to a gust profile is
 \begin{equation} \alpha_{eff}(t)={-}\frac{1}{\rm \pi}\int_0^{\rm \pi}\frac{v_g(\theta,t)} {U_\infty}(\cos\theta-1)\,\text{d}\theta, \end{equation}
where  $v_g$ is the local transverse velocity at a point along the wing's chord,
  $U_\infty$ is the free-stream velocity and
  $\theta$ is the angular chord position. The angular chord position
  $\theta$ is related to the
  $x$ location along the chord via the transformation
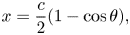 \begin{equation} x=\frac{c}{2}(1-\cos\theta), \end{equation}
where  $c$ is the chord length.
The open-loop pitch manoeuvre based on cancelling the effective angle of attack relies on pitching the wing according to a priori knowledge of the gust to produce an angle of attack  $\alpha$ such that
  $\alpha = -\alpha _{eff}$. Of the manoeuvres in this work, the effective angle-of-attack manoeuvre is the simplest to calculate. However, it fails to account for the added-mass force associated with acceleration of the fluid surrounding the body during unsteady motions. The manoeuvre also does not account for the wake generated by the wing, which influences the circulatory lift. It also assumes fully attached flow and, thus, fails to model the formation of LEVs which have been observed in this work and many prior experimental studies (Perrotta & Jones Reference Perrotta and Jones2017; Corkery et al. Reference Corkery, Babinsky and Harvey2018; Biler et al. Reference Biler, Badrya and Jones2019). Nevertheless, the effective angle-of-attack manoeuvre is considered in this work to assess the impact of unmodelled flow physics on gust mitigation.
2.2. Manoeuvre based on Wagner's and Küssner's unsteady aerodynamic models
Linear superposition of Wagner's and Küssner's unsteady aerodynamic models, shown in figure 2, produces an unsteady analytical model for a pitching wing in a transverse gust. A formulation similar to the one in this work is presented by Andreu Angulo & Babinsky (Reference Andreu Angulo and Babinsky2021).
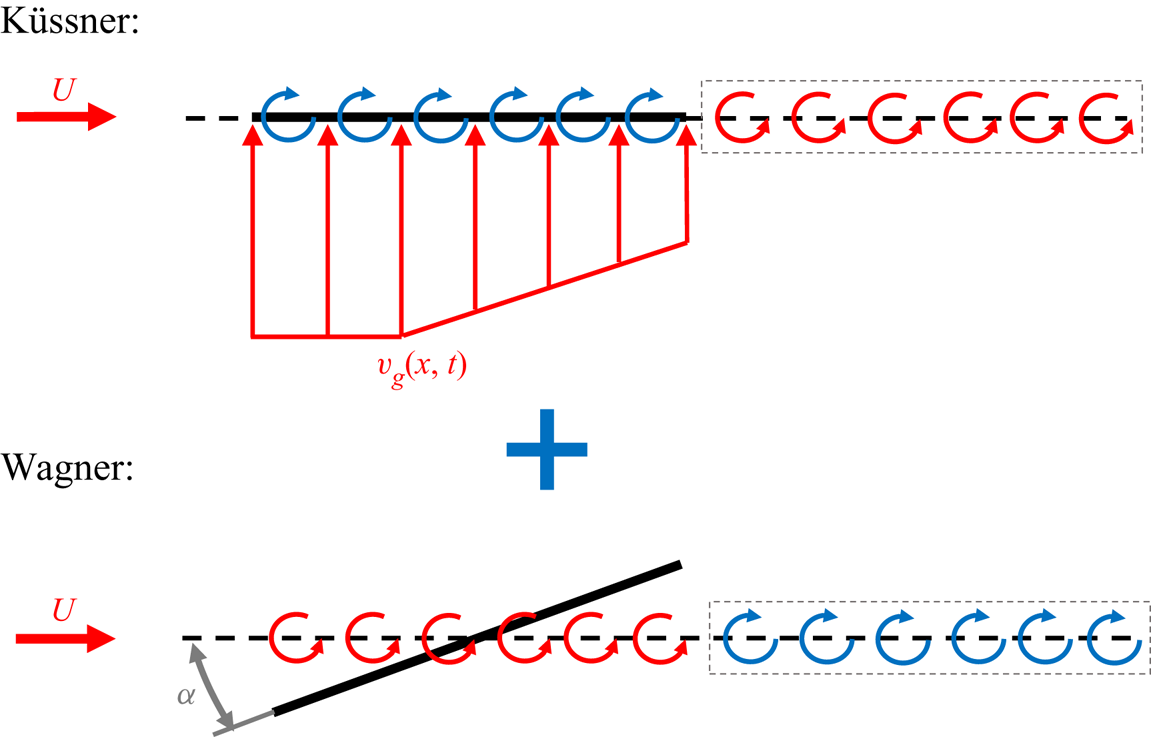
Figure 2. The superposition of the Wagner and Küssner aerodynamic models.
Wagner's indicial function  $\phi$ provides the lift response of a wing due to a step change in angle of attack. Due to the linearity of Wagner's model, the lift response to an arbitrary angle-of-attack profile can be obtained through convolution with Wagner's indicial function
  $\phi$ in the Duhamel integral. The non-dimensional lift response to an arbitrary angle-of-attack profile is thus (Leishman Reference Leishman2006)
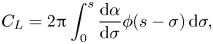 \begin{equation} C_L=2{\rm \pi}\int_0^{s}\frac{\text{d}\alpha}{\text{d}\sigma}\phi(s-\sigma)\,\text{d}\sigma, \end{equation}
where  $s$ is the distance travelled by the wing in semi-chords,
  $\sigma$ is a dummy integration variable and Wagner's function based on the approximation of Jones (Reference Jones1940) is
 \begin{equation} \phi(s)=1-0.165\,{\rm e}^{{-}0.0455s}-0.335\,{\rm e}^{{-}0.3s}. \end{equation}
The indicial function of Wagner was derived based upon potential flow modelling that included a planar wake shed behind the airfoil. Note that Wagner's aerodynamic model therefore includes a simplified model of the wake shed from the wing during an unsteady manoeuvre, while the effective angle-of-attack method does not.
Küssner's unsteady aerodynamic model captures the lift response of a wing to a semi-infinite uniform gust. Similar to Wagner's model, the lift response can be obtained through the convolution with an indicial function. Küssner's lift response to an arbitrary gust is
 \begin{equation} C_L=\frac{2{\rm \pi}}{U_\infty}\int_0^{s}\frac{\text{d}v_g}{\text{d}\sigma}\psi(s-\sigma)\,\text{d}\sigma, \end{equation}
where  $v_g$ is the transverse velocity the wing experiences at its leading edge and
  $\psi$ is Küssner's function. Küssner's function based on Sears and Sparks approximation is (Sears & Sparks Reference Sears and Sparks1941)
 \begin{equation} \psi(s)=1-0.5\,{\rm e}^{{-}0.13s}-0.5\,{\rm e}^{{-}s}. \end{equation}
The aforementioned models do not capture the added-mass effect from pitching, so an additional term for the added-mass force of a wing pitching about the midchord must be added. Under small-angle assumptions, the added-mass lift force experienced by a wing due to pitching about the midchord is
 \begin{equation} C_L=\frac{{\rm \pi} c}{2 U_\infty}\dot{\alpha}. \end{equation}
The combined Wagner–Küssner model for a pitching wing encountering a gust is
 \begin{equation} C_L=2{\rm \pi}\int_0^{s}\frac{\text{d}\alpha}{\text{d}\sigma} \phi(s-\sigma)\,\text{d}\sigma+\frac{2{\rm \pi}}{U_\infty} \int_0^{s}\frac{\text{d}v_g}{\text{d}\sigma}\psi(s-\sigma)\,\text{d}\sigma + \frac{{\rm \pi} c}{2 U_\infty}\dot{\alpha}. \end{equation}
The model given in (2.8) captures the unsteady effects of the wing's wake, a linear representation of the gust's influence and the added-mass force due to pitching about the midchord. However, this model assumes fully attached flow and a small angle of attack. Manoeuvring in strong gusts violates these assumptions due to flow separation and large angular displacements. Nevertheless, this model serves as an important point of comparison based on classical, linear aerodynamic modelling.
The manoeuvre based on the Wagner–Küssner aerodynamic model is designed to achieve
 \begin{equation} C_L=2{\rm \pi}\int_0^{s}\frac{\text{d}\alpha}{\text{d}\sigma}\phi(s-\sigma)\,\text{d}\sigma+ \frac{2{\rm \pi}}{U_\infty}\int_0^{s}\frac{\text{d}v_g}{\text{d}\sigma}\psi(s-\sigma)\,\text{d}\sigma + \frac{{\rm \pi} c}{2 U_\infty}\dot{\alpha}=0. \end{equation}
To obtain the pitch profile  $\alpha (t)$ from the zero lift constraint in (2.9),
  $\dot {\alpha }$ is discretized using the forward-Euler method such that
 \begin{equation} \dot{\alpha}=\frac{\alpha(t_{k+1})-\alpha(t_{k})}{{\rm \Delta} t}, \end{equation}
and (2.9) is solved for  $\alpha (t_{k+1})$, where
  $t_k=k{\rm \Delta} t$ for
  $k=0,\ldots,N$. This model is considered appropriate for the current study because the effective angle of attack is small throughout the gust encounter when the wing is pitching, maintaining the small perturbation assumptions (Andreu Angulo & Babinsky Reference Andreu Angulo and Babinsky2021). However, using this method in a situation with large effective angles of attack may yield inaccurate results.
2.3. Proportional feedback control in a discrete vortex simulation
This section describes the use of a closed-loop control simulation to design a manoeuvre that can be implemented open-loop in experiment. The closed-loop control simulation occurs within an unsteady DVM. In the DVM, a flat plate is modelled by an infinitely thin sheet composed of control points and bound vortices. The bound vortices enforce a no-penetration condition at the control points. Leading- and trailing-edge shedding is enforced by the Kutta condition at both edges of the wing. The gust is modelled as a velocity field, and the transverse velocity contribution of the gust is imposed on the wing's control points and shed vortices according to their positions within the gust. Prior work of the authors (Sedky et al. Reference Sedky, Lagor and Jones2020b) provides additional information on the construction of the DVM which closely follows the model development of Katz & Plotkin (Reference Katz and Plotkin2001) and implements the Kutta condition at the leading and trailing edges.
Figure 3 shows the output-feedback control framework used to regulate the lift of a wing about a desired value,  $C_L^{des}$. In this feedback loop, the pitch acceleration is computed based on the proportional control law
 \begin{equation} \ddot{\alpha} = K \left(C_L^{des}-C_L\right), \end{equation}
designed to mitigate deviations in lift from the desired value. The calculated control input pitches the wing in the unsteady DVM, resulting in a corresponding lift response. The measured lift,  $C_L$, is fed back to compare with the reference,
  $C_L^{des}$, thereby closing the control loop. The controller gain is chosen to provide good disturbance rejection for an expected range of gust frequencies. Prior work of the authors (Sedky et al. Reference Sedky, Lagor and Jones2020b) contains additional information on gain selection for the controller based on a linear Theodorsen model in place of the DVM for tuning. Using this gain value, the control law creates a pitching profile by responding to the lift force calculated within a DVM simulation. Although this manoeuvre is closed-loop in the DVM simulation (i.e. it responds to real-time changes in the flow model), the manoeuvre is executed open-loop in the experiments described in this paper.
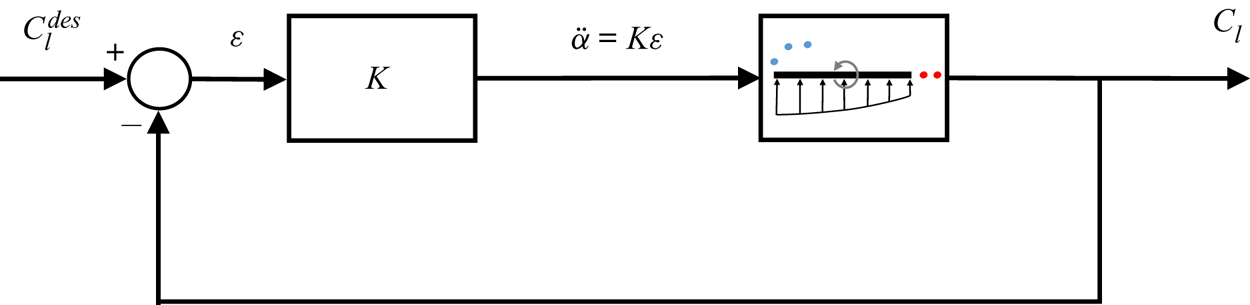
Figure 3. Closed-loop control structure for DVM simulation.
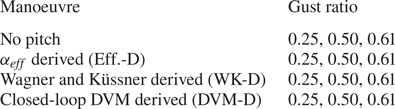
2.4. Summary of open-loop manoeuvres
Sections 2.1–2.3 describe the three open-loop manoeuvres studied in this paper. For brevity, each manoeuvre name is abbreviated in this work. The effective angle-of-attack derived manoeuvre, the Wagner–Küssner derived manoeuvre and the closed-loop DVM derived manoeuvre are referred to as ‘Eff.-D’, ‘WK-D’ and ‘DVM-D’, respectively. Figure 4 shows the angle-of-attack and pitch-rate histories of the wing for each manoeuvre at  $\text {GR}=0.50$ and a gust width to chord ratio of
  $w/c=2.23$. The grey region indicates the time interval during which a portion of the wing is within the nominal gust region.
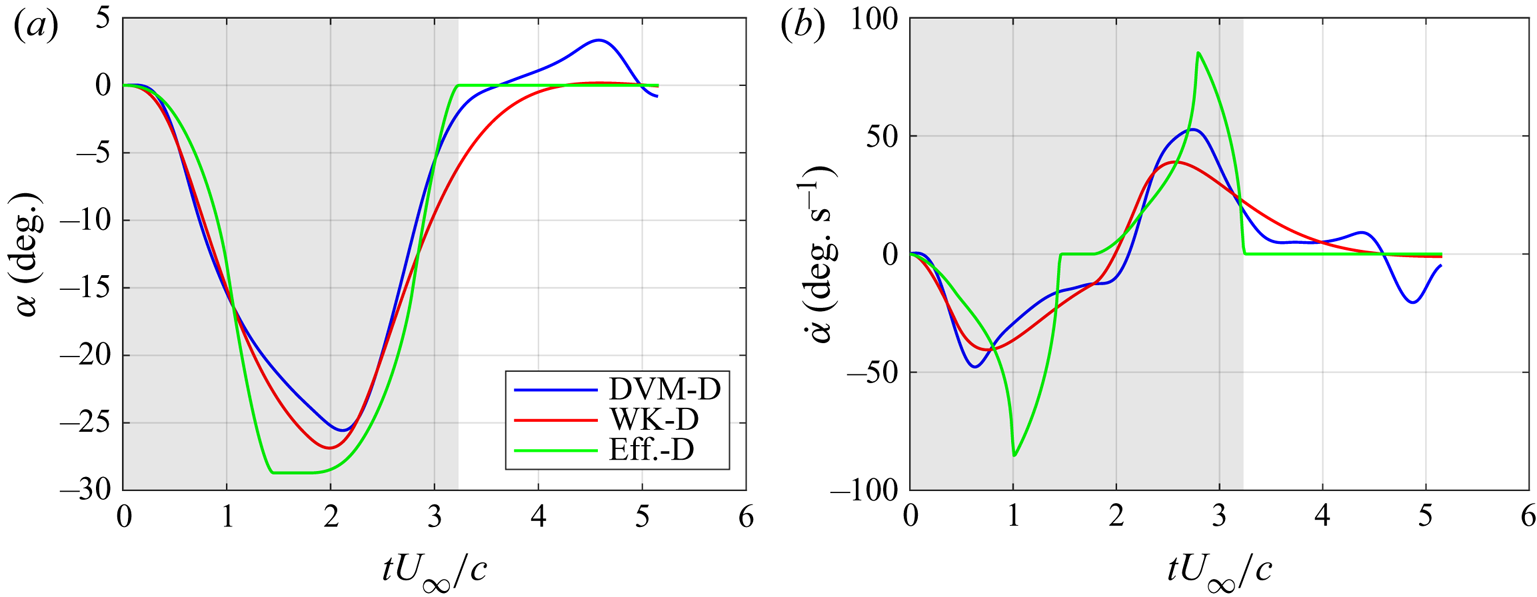
Figure 4. The angle-of-attack and pitch rate for three prescribed manoeuvres at  $\text {GR}=0.50$. (a) Angle of attack and (b) pitch rate.
Table 1 presents a summary of the physics modelled in each manoeuvre. The Eff.-D manoeuvre relies on an attached flow assumption and does not model the wake effects or added mass. The WK-D manoeuvre retains the attached flow assumption but incorporates wake effects and added mass, while the DVM-D model contains both wake and added-mass effects. Moreover, the DVM-D model relaxes the assumption of attached flow by representing shed vortices from the leading and trailing edges using discrete vortices.
Table 1. Summary of the physics modelled in each manoeuvre.

3. Experimental methodology
This section introduces the experimental set-up and describes the approach and methodology for force and flow field data acquisition.
3.1. Experimental set-up and test matrix
Wing-gust encounter experiments were conducted in a  $7\times 1.5\times 1$ m free-surface water-filled tow tank at the University of Maryland where a computer-controlled motor system towed the wing through the water tank. Figure 5(a) shows an overview of the experimental set-up, and figure 5(b) shows the half-wing test article used in the experiments. The half-wing model used in this work was a flat plate with a chord length of
  $c = 0.0762\,\text {m}$, a full-wing aspect ratio of
  ${{A{\kern-4pt}R} } = 4$ and a thickness-to-chord ratio of 0.0417. The wing was made of glass to minimize laser sheet shadows in flow field images. Experiments were conducted at a Reynolds number
  $Re=10\,000$ with the wing mounted onto an ATI Mini-40 force/torque sensor. A divider or splitter plate isolated the half-wing from flow disturbances caused by the pitching mechanism and force balance. Pitching actuation was accomplished by fixing the vertical height of the leading control rod and varying the vertical height of the trailing control rod, resulting in a pitch axis located at the wing's midchord. Figure 5(c) shows the gust generator that provided the transverse gust flow field at the centre of the water tow tank. The gust jet is shown with orange arrows. A variable speed 1.85 HP Hayward centrifugal pump drove the recirculating gust system. The gust ratio was varied by varying the r.p.m. speed of the pump.

Figure 5. (a) An overview of the experimental set-up, (b) wing test article and pitch mechanism, and (c) trapezoidal gust generator.
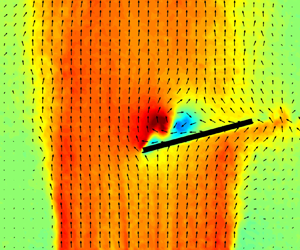
Figures 6(a) and 6(b) show the time-averaged and instantaneous velocity field measurements, as well as calculated vorticity fields. For clarity, only every fifth velocity vector is shown. The time-averaged velocity field of the gust is uniform within the central region. The edges of the gust exhibit strong shear layers where the vorticity of the gust is concentrated, separating the gust flow from the surrounding quiescent fluid. The time-averaged flow field exhibits smooth shear layers at the edges of the gust, whereas the shear layers of the instantaneous flow field exhibit unsteadiness and intermittent vortex roll-up. Figure 6(c) shows the time-averaged vertical velocity distribution normalized by the average velocity within the uniform region,  $v/v_{ref}$, along the dashed line shown in figure 6(b). The time-averaged velocity profile is approximated by a trapezoid with a gust width to chord ratio of
  $w/c=2.23$. More details regarding the design and characterization of the gust generator can be found in Sedky, Biler & Jones (Reference Sedky, Biler and Jones2022).
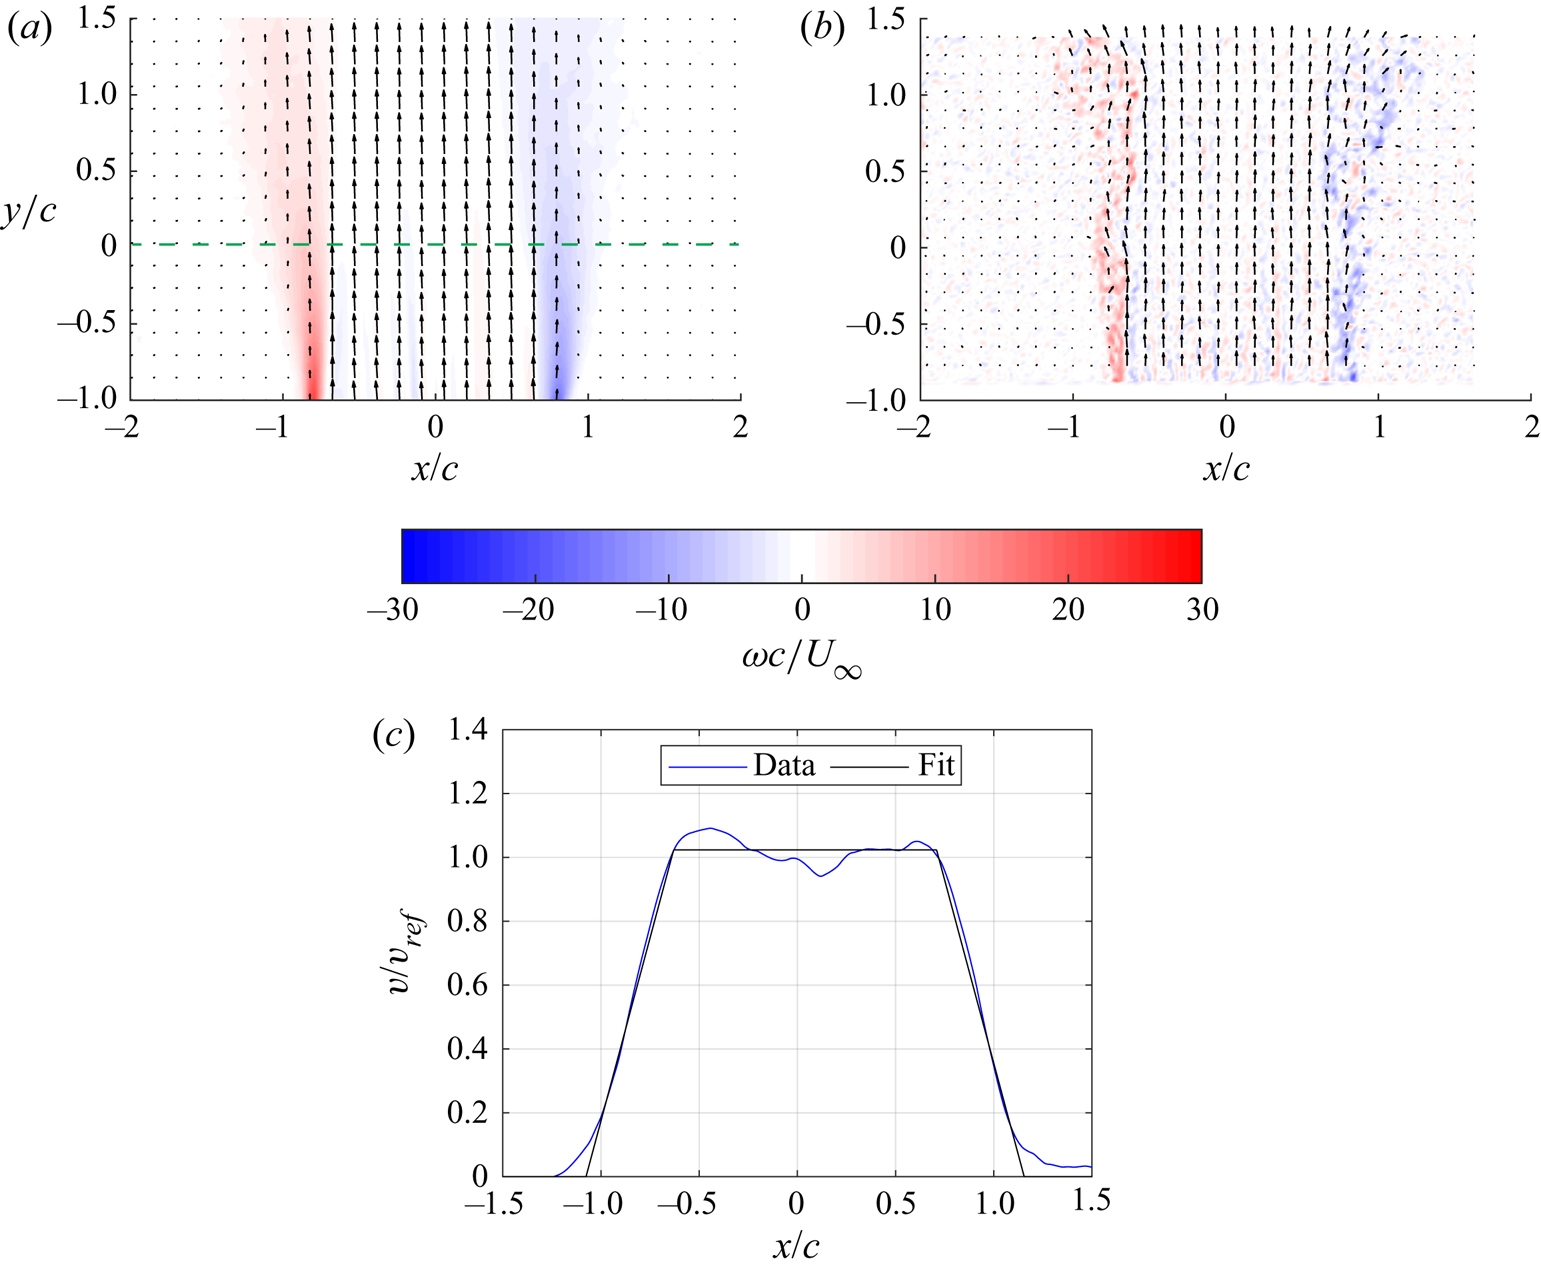
Figure 6. (a) Time-averaged and (b) instantaneous gust velocity measurements along the chordwise plane shown, and (c) the vertical velocity distribution sampled along the dashed line on the time-averaged flow field.
Table 2 shows the experimental cases considered in this work. The total number of cases presented was 12, and each case was repeated five times and ensemble averaged. The wing was towed in the water tank with a smoothed trapezoidal velocity profile. The wing was accelerated for 4.5 chords, towed at a constant velocity for 50 chords and then decelerated for 2.25 chords to rest. The start of the gust region at the height of the test article was approximately 35.5 chords away from the wing's start position.
Table 2. Test matrix.
3.2. Particle image velocimetry and force measurements
Forces and moments in all three axes were sampled at 1 kHz and recorded using a six degree-of-freedom ATI Mini-40 force sensor. The force sensor was mounted at the midchord of the wing to measure loads and moments at the midchord. Since the force sensor rotates with the wing during the pitching motion, sweeps were conducted in the range of expected pitch angles to tare the sensor at all expected orientations. The tare force and moment measurements account for sensor bias, the weight of the test article and the buoyancy force. The raw measurements were filtered using a zero-phase digital Butterworth filter with a cutoff frequency of 5 Hz. The coefficient of lift,
 \begin{equation} C_L=\frac{L}{1/2 \rho U_\infty^2S}, \end{equation}
was obtained by dividing the lift force by the dynamic pressure,  $1/2 \rho U_\infty ^2$, and the wing's planform area
  $S$. The coefficient of pitching moment about the midchord,
 \begin{equation} C_M=\frac{M}{1/2 \rho U_\infty^2Sc}. \end{equation}
was obtained by dividing the measured moment by the dynamic pressure, the wing's planform area and the chord length.
Planar PIV measurements of the flow were collected during the wing-gust encounters at the mid-span. The PIV set-up consisted of a Quantel Evergreen Nd:YAG 532 nm laser and a high-speed Phantom v641 camera with a  $2560 \times 1600$ resolution. The laser sheet illuminated neutrally buoyant class IV soda lime spheres of 37
  $\mathrm {\mu }$m diameter. The time separation
  ${\rm \Delta} t$ in an image pair was chosen such that the maximum particle displacement was 4–5 pixels. The raw images acquired were processed using multi-pass cross-correlation. A
  $64 \times 64$ px square interrogation window was used for the first four passes and a
  $24 \times 24$ px adaptive interrogation window was used for the following four passes. Interrogation regions were overlapped by 50 %. Post-processing was performed using a median universal outlier filter with a
  $5 \times 5$ filter region for the gust encounter cases. All force and flow field measurements were ensemble averaged for each case. The final PIV vector spacing is 1.7 % of the chord length. A built-in DaVis error tool based on the work of Wieneke (Reference Wieneke2015) was used to quantify the uncertainty in the PIV measurements. The maximum measurement uncertainty was determined to be 5.8 % within the centre of the LEV. It is important to consider three-dimensional effects in such encounters given the finite aspect ratio of the wing. The experimental work conducted by Biler (Reference Biler2021) as well as the computational work conducted by Badrya, Jones & Baeder (Reference Badrya, Jones and Baeder2022) have demonstrated that the flow topology remains consistent throughout most of the wing's span absent the wing's tip during the first half of the wing-gust encounter (until the lift peak). This can be attributed to the amount of time it takes for the tip vortex to become large enough to induce considerable three-dimensional effects. Later, the flow becomes more three-dimensional as demonstrated by the vortex break up behaviour shown in the PIV measurements after
  $tU_\infty /c=2.00$ in figures 12 and 13.
The measured PIV data are used to quantify the strength of the LEV shed from the wing. The general region where the vortex lies has been manually identified and isolated in every time frame using an arbitrary polygon. Figure 7 shows an example of this polygon. The arbitrary polygon is chosen to be slightly larger than the LEV region to ensure that the entire vortex is included. Once the nominal vortex region is identified, a threshold of  $\omega =0$ is used to remove all positive vorticity, thus masking the secondary vorticity directly below the LEV. Finally, the remaining vorticity is integrated over the entire region to obtain the circulation of the vortex
  $\varGamma$.
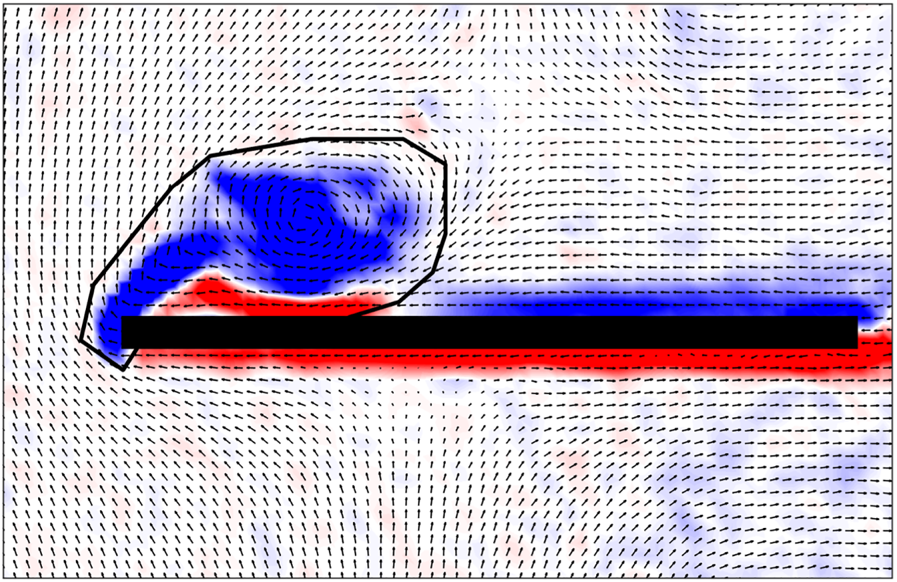
Figure 7. Leading-edge vortex segmentation in PIV data.
4. Results and discussion
4.1. Force measurements
A wing encountering a gust and undergoing an unsteady pitching manoeuvre experiences lift from three dominant sources. The first contribution to lift is the added-mass force due to unsteady pitching. Added-mass force is classically described as the force needed to accelerate the fluid surrounding the body when the body accelerates (Darwin Reference Darwin1953), but some modern descriptions depart from the classical interpretation and argue that it arises from the formation of a non-circulatory bound vortex sheet on the body and its rate of change (Corkery Reference Corkery2018; Limacher, Morton & Wood Reference Limacher, Morton and Wood2018). The added-mass coefficient of lift  $C_L^{am}$ of a wing pitching about its midchord based on potential flow theory can be expressed as (Limacher et al. Reference Limacher, Morton and Wood2018; Limacher Reference Limacher2021)
 \begin{equation} C_L^{am}=\frac{{\rm \pi} c}{2U_\infty}\dot{\alpha}\left(\cos^2\alpha - \sin^2\alpha \right), \end{equation}
where the cosine and sine terms account for the large angle-of-attack displacements that may be undertaken by the wing.
The second contribution to lift is the non-circulatory gust contribution derived in Küssner's theory by von Kármán & Sears (Reference von Kármán and Sears1938) and experimentally verified by Corkery (Reference Corkery2018). In Küssner's gust response the gust is simulated by morphing the wing (von Kármán & Sears Reference von Kármán and Sears1938) such that the local angle of attack at all points on the wing remains consistent with the effective local angles of attack induced by the gust. The wing accelerates the fluid surrounding it as it morphs, giving rise to an apparent added-mass contribution. If the velocity induced by the gust at each point on the wing remains constant in time, i.e. in regions of full wing immersion in a uniform gust flow, the wing's shape does not change, and, thus, the non-circulatory gust contribution goes to 0. The wing does not morph in reality, but Corkery (Reference Corkery2018) demonstrated this contribution experimentally and attributed it to the non-circulatory bound vortex sheet that is induced on the wing by the free vorticity contained in the gust's shear layers. In addition, Corkery demonstrated a good agreement between the experiments and Küssner's prediction of the non-circulatory gust contribution to lift. An estimate of the non-circulatory gust contribution based on the gust velocity can be computed through convolution with the non-circulatory force contribution indicial function, similar to Küssner's indicial function
 \begin{equation} C_L^{{nc}}=\frac{4}{U_\infty}\int_0^{s} \frac{\text{d}v_g}{\text{d}\sigma}\zeta(s-\sigma)\,\text{d}\sigma\cos\alpha, \end{equation}
where the cosine term accounts for the reduction of the wing's area projection perpendicular to the gust flow as the wing pitches and the indicial function based on the expression presented by Andreu-Angulo et al. (Reference Andreu-Angulo, Babinsky, Biler, Sedky and Jones2020) is
 \begin{equation} \zeta(s)=\sqrt{\tfrac{1}{2} s- \tfrac{1}{4} s^2}. \end{equation}
Even though the added-mass contribution  $C_L^{am}/{\rm GR}$ and the non-circulatory gust contribution
  $C_L^{nc}/{\rm GR}$ were derived using potential flow models, Corkery, Babinsky & Graham (Reference Corkery, Babinsky and Graham2019) and Corkery (Reference Corkery2018) have shown that they agree well with their experimental counterparts computed directly from PIV flow field measurements. The only significant error arises from the advection of the gust shear layer, which is considered rigid in (4.3). However, Gehlert, Andreu Angulo & Babinsky (Reference Gehlert, Andreu Angulo and Babinsky2021) showed that the difference in lift due to the gust shear layer advection was small for gust ratios below 1.0.
The final contribution to lift is the circulatory contribution due to the production and convection of circulatory structures in the flow, including the wing's wake, LEV and circulatory vortex sheet along the wing. The total coefficient of lift  $C_L$, can be decomposed into an added-mass force contribution
  $C_L^{am}$, non-circulatory gust contribution
  $C_L^{{nc}}$ and a circulatory contribution
  $C_L^{c}$ (Corkery Reference Corkery2018; Corkery et al. Reference Corkery, Babinsky and Graham2019), such that
 \begin{equation} C_L=C_L^{am}+C_L^{{nc}}+C_L^{c}. \end{equation}
Based on (4.4), the circulatory component of lift can be computed by subtracting the added-mass force contribution and the non-circulatory gust contribution from the total lift measurement.
Figure 8 presents the coefficient of lift  $C_L$ and the coefficient of lift normalized by the gust ratio
  $C_L/{\rm GR}$ for all non-pitching cases. Each line is the ensemble average of five runs. The grey region in the plots highlights the time interval during which the wing was partially within the gust. Even though lift trends vary with gust ratio, they collapse when divided by the gust ratio. Figure 9(a–d) presents the normalized coefficient histories of the total lift
  $C_L/{\rm GR}$, added-mass contribution
  $C_L^{am}/{\rm GR}$, the non-circulatory gust contribution
  $C_L^{nc}/{\rm GR}$ and the circulatory contribution
  $C_L^{c}/{\rm GR}$, respectively. Each manoeuvre is shown with a different colour and each
  ${\rm GR}$ is shown with a different line style.
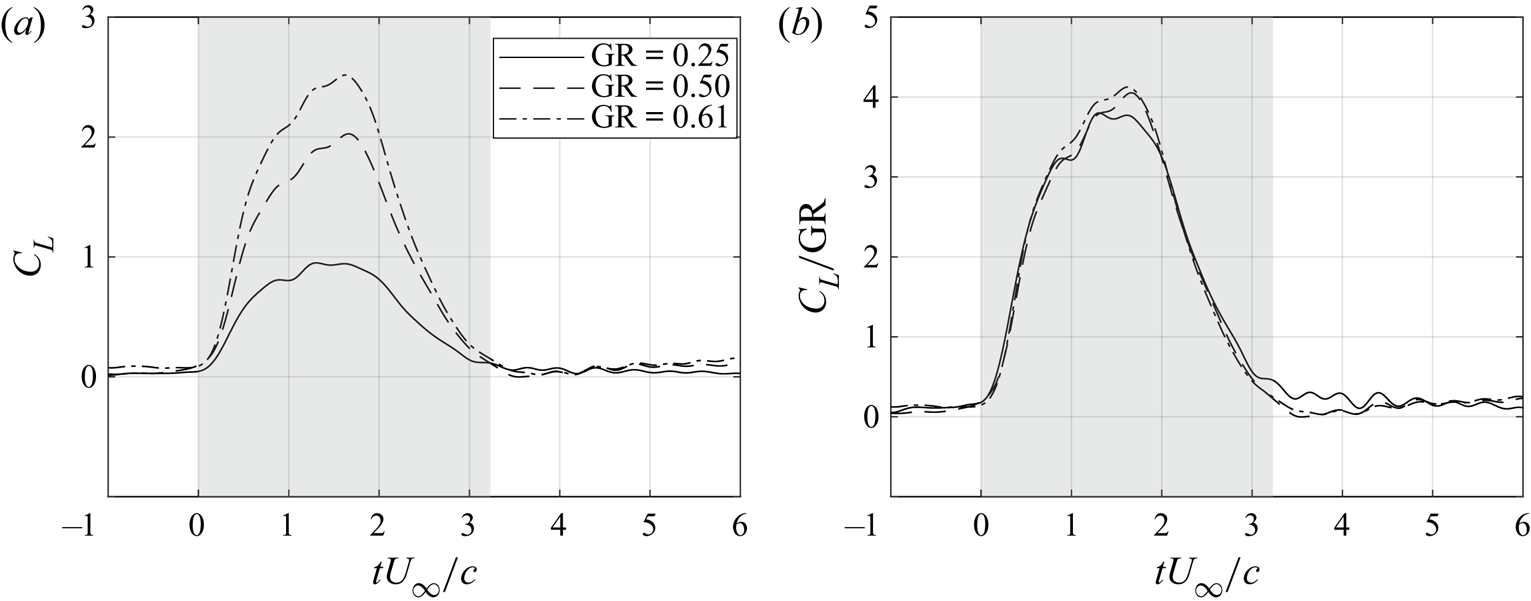
Figure 8. (a) The coefficient of lift  $C_L$ and (b) the coefficient of lift normalized by the gust ratio
  $C_L/{\rm GR}$ for all non-pitching cases.
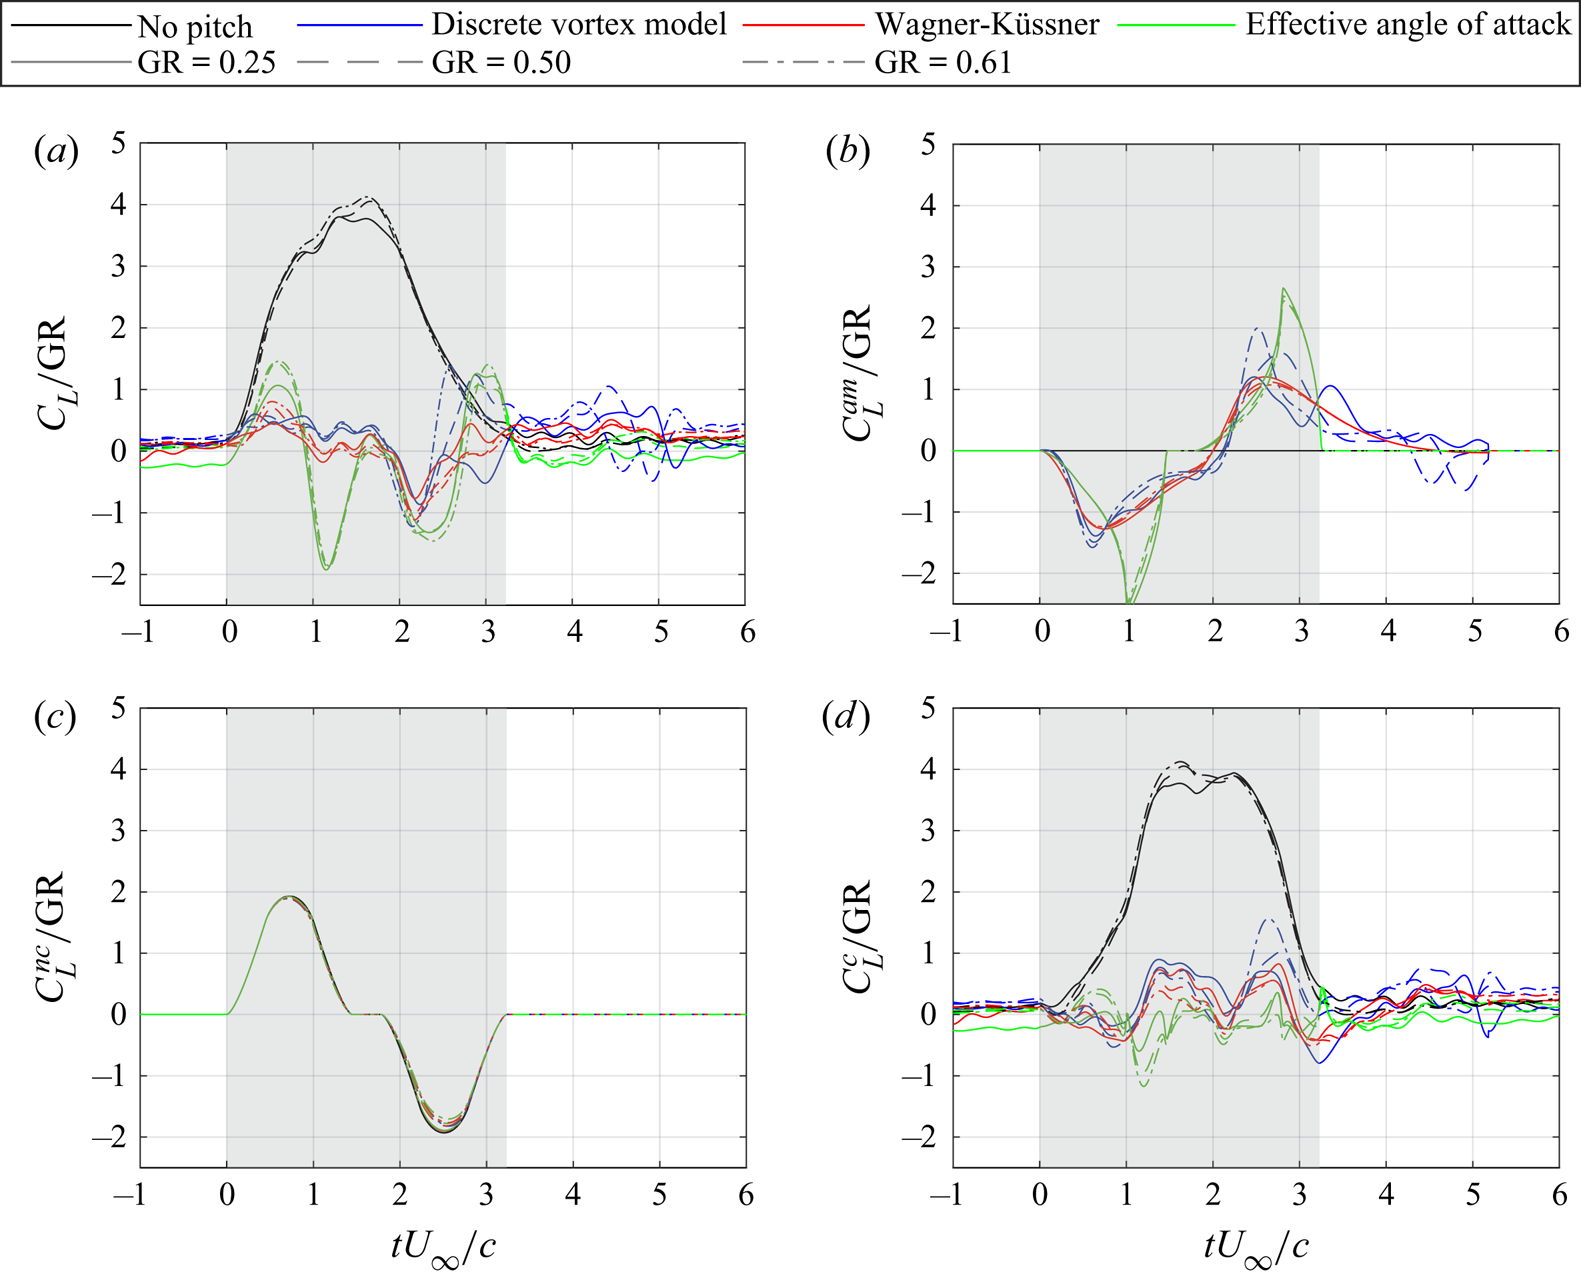
Figure 9. (a) The total coefficient of lift  $C_L$, (b) the added-mass contribution
  $C_L^{am}$, (c) the non-circulatory gust contribution to lift
  $C_L^{{nc}}$, and (d) the circulatory contribution to lift
  $C_L^{c}$ for all cases normalized by
  ${\rm GR}$.
Figure 9(a) shows the total lift trends. For the no-pitch cases, the  $C_L$ trends climb up to
  $C_L=4{\rm GR}$ before dropping down to 0 as the wing fully exits the gust. The Eff.-D manoeuvres perform the worst at mitigating the influence of the gust at all gust ratios. The DVM-D and WK-D manoeuvres perform similarly until the wing begins to exit the gust. Thereafter, the WK-D manoeuvre regulates lift better, indicating that the DVM may not accurately capture the flow field during the wing's exit from the gust. Note that figure 4 shows the DVM-D manoeuvre performs significantly more actuation of the wing after
  $tU_\infty /c=4$ than the other manoeuvres due to the continued presence of shed vorticity near the wing. The other manoeuvres rely on non-deforming gust models for which the lift deviations taper off after exiting the gust.
To examine the added-mass contribution, recall that all three open-loop manoeuvre design methods result in a pitch-down then pitch-up motion as seen in figure 4. Figure 9(b) shows the added-mass force contribution,  $C_L^{am}$, due to pitching of the wing calculated according to (4.1). During entry into the gust, each manoeuvre pitches down to reduce the relative flow velocity normal to the chord, leading to a negative added-mass force peak. As the wing exits the gust, it pitches up, leading to a positive added-mass force peak.
Figure 9(c) shows the non-circulatory gust contribution to lift,  $C_L^{nc}$, as calculated by the Küssner's model according to (4.2) and (4.3). This contribution is largest during the periods of gust entry and exit when the wing experiences the largest variations of velocity imposed on it by the gust in time. As the wing gradually enters the gust, the vertical velocity the gust induces on the wing increases which leads to an increase in the non-circulatory gust contribution. The maximum value of this contribution corresponds to the region with the highest rate of change of induced vertical velocity. As the wing exits the gust, the vertical velocity the gust induced on the wing decreases which leads to a negative non-circulatory gust contribution. When the wing is fully immersed in the gust, it does not experience a change in the gust velocity, and, thus, the gust contribution is zero. The minor differences across manoeuvres are due to the different angle-of-attack histories. The
  $C_L^{nc}$ histories show trends opposite to the
  $C_L^{am}$ trends which suggests that the non-circulatory gust contribution to lift is balanced by the added-mass contribution due to the pitching of the wing.
Figure 9(d) shows the circulatory gust contribution to lift,  $C_L^{c}$. For the no-pitch cases, the initial rise in lift is dominated by
  $C_L^{nc}$, and, thus, the
  $C_L^{c}$ trend rise is slower than the total
  $C_L$. When the wing is fully immersed in the gust,
  $C_L^{nc}$ goes to 0 and the total coefficient of lift is equal to the circulatory contribution,
  $C_L=C_L^{c}$. Moreover, the
  $C_L$ transient begins dropping off sooner than does the
  $C_L^{c}$ transient due to the dominance of
  $C_L^{nc}$ during the gust exit period. Here
  $C_L$ begins to drop off near
  $tU_\infty /c = 1.80$ while
  $C_L^{c}$ does not begin decreasing until around
  $tU_\infty /c = 2.20$. The force trends for the pitching cases demonstrate high reduction in the circulatory force contribution experienced by the wing. Moreover, when the Eff.-D manoeuvres are compared with the rest of the manoeuvres, it is observed that the large performance difference in
  $C_L$ regulation mainly corresponds to a large difference in the added-mass force trends. This indicates that the performance difference across manoeuvres is dominated by the added-mass force and that accurate modelling of added mass is critical for lift mitigation manoeuvre design.
4.2. Pitching moment measurements
The pitching moment is measured directly at the midchord using the force sensor and normalized to obtain the pitching moment coefficient. The pitching moment is often reported about the aerodynamic centre; a point along the wing about which the pitching moment does not significantly vary with changing angle of attack. The theoretical location of this point based on steady thin-airfoil theory is the quarter chord (Abbott & Von Doenhoff Reference Abbott and Von Doenhoff1959; Anderson Reference Anderson1984). However, this study presents the pitching moment with respect to the midchord for the practical consideration that the wing is supported and pitches about this location. Figure 10 presents the pitching moment coefficient  $C_M$ and the pitching moment coefficient divided by the gust ratio
  $C_M/{\rm GR}$ for all non-pitching cases. Some collapse of the curves can be observed when the coefficients are divided by the gust ratio, especially during the initial entry into the gust. However, significant discrepancies remain between the different cases which suggests that there may be additional parameters or considerations necessary for normalization. Figure 10 shows that the pitching moment increases together with the increase in lift (see figure 8), which suggests that the rise of the pitching moment as the wing enters the gust is primarily due to the rise of lift. Peaks in the moment curves occur at approximately
  $tU_\infty /c = 0.90$, while the lift curve peaks occur between approximately
  $tU_\infty /c = 1.25$ and
  $tU_\infty /c = 1.75$. The earlier peak in lift is likely due to a change in the centre of pressure. Throughout the gust encounter, the wing experiences variations in the velocity field due to the gust as well as evolution of the LEV's strength and position. These changes alter the pressure and shear stress distributions on the wing, altering the position of the centre of pressure.

Figure 10. (a) The coefficient of moment  $C_M$ and (b) the coefficient of moment normalized by the gust ratio
  $C_M/{\rm GR}$ for all non-pitching cases.
Figure 11 presents the normalized history of the pitching moment coefficient,  $C_M/{\rm GR}$. Each manoeuvre is shown with a different colour and each
  ${\rm GR}$ is shown with a different line style. The moment trends of the pitching manoeuvres increase to a peak during gust entry and fall to a minimum upon gust exit before recovering to the nominal value. The utilization of pitching to mitigate lift doubles the pitching moment range relative to the uncontrolled case, which may or may not be acceptable for a given application. Note that manoeuvres were designed for lift mitigation only. Since the pitch manoeuvres mitigate lift, the major fluctuations in the pitching moment are not a result of the lift fluctuations as is the case for the non-pitching cases. Instead, the pitching moment fluctuations observed in the pitching cases are due to the pitching motion of the wing. Note that the pitch rate curves in figure 4(b) resemble a scaled version of the moment curves in figure 11 mirrored about the
  $x$-axis. As the wing enters the gust, it pitches down and imparts a negative moment on the fluid. In response, the fluid imparts a positive moment on the wing, resulting in a positive pitching moment. Similarly, as the wing exits the gust, it pitches up and imparts a positive moment on the fluid. In response, the fluid imparts a negative moment on the wing, resulting in a negative pitching moment.

Figure 11. The total coefficient of pitching moment  $C_M$ for all cases normalized by
  ${\rm GR}$.
4.3. Flow field measurements
Figures 12 and 13 show the flow fields of the gust encounters without pitching (a,c,e,g,i) and under DVM-D pitching (b,d,f,h,j) for gust ratios  ${\rm GR}=0.25$ and
  ${\rm GR}=0.50$, respectively. Each row corresponds to a specific convective time instant. The wing first encounters the gust at
  $tU_\infty /c=0$ for all cases. The flow fields of the other cases (WK-D and Eff.-D manoeuvres) are qualitatively similar and omitted for brevity. The presented flow fields consist of velocity vectors and non-dimensional vorticity fields,
  $\omega c/U_\infty$. For the clarity of the figures, only every fifth vector is shown.

Figure 12. The velocity and vorticity fields for  ${\rm GR}=0.25$ without pitching (a,c,e,g,i) and with DVM-D pitching (b,d,f,h,j).

Figure 13. The velocity and vorticity fields for  ${\rm GR}=0.50$ without pitching (a,c,e,g,i) and with DVM-D pitching (b,d,f,h,j).
In the left column of figure 12, as the non-manoeuvring wing enters the gust, the upwash creates a strong leading-edge shear layer and a subsequent LEV at  $tU_\infty /c = 1.00$. The shear layer continues to feed vorticity to the LEV, and the vortex grows until it separates. Due to the low gust ratio, the LEV does not fully separate from the wing's suction side and instead stretches across the surface, as shown at
  $tU_\infty /c = 2.00$. As the wing reaches the latter half of the gust, the shear layer that feeds the LEV is disrupted. The LEV is shed at approximately
  $tU_\infty /c = 2.75$, and the separated vortex loses form as it advects away. Throughout the gust encounter, the trailing-edge wake of the non-manoeuvring wing experiences an upwash from the gust, causing it to bend slightly upwards. Note that the transverse gust flow stagnates for most of the encounter on the pressure side of the wing, but the stagnation point moves to the wake boundary during exit from the gust at
  $tU_\infty /c = 2.75$. The passage of the wing through the gust disturbs the flow; this disturbance to the flow persists after the wing completely exits the gust as shown at
  $tU_\infty /c = 6.00$.
In the right column of figure 12, a manoeuvring wing executes a DVM-D pitching motion. As the wing enters the gust, it pitches down, and the LEV develops similar to the encounter without pitching. The LEV of the manoeuvring wing detaches sooner than the LEV on the non-manoeuvring wing. As the wing exits the gust, it pitches up and an opposite-signed LEV forms on the pressure side of the wing. To distinguish between the primary LEV that forms as the wing enters the gust and the second LEV that forms as the wing exits the gust under pitch control, the former will be referred to as the suction-side LEV and the latter will be referred to as the pressure-side LEV. In contrast to the case without pitching, the flow on the pressure side does not exhibit the same stagnation flow. Instead, the velocity vectors maintain a large vertical component. Although the velocity vectors point into the wing in the laboratory frame of reference, this flow behaviour is physically consistent with the no-penetration boundary condition. Since the wing is translating and pitching, its surface has a non-zero vertical velocity component that the fluid parcels on the wing's surface must match to satisfy the no-penetration and no-slip boundary conditions. The pitching motion appears to reduce the disturbance to the gust's flow field as shown in each of the plots in the second column of figure 12. Through minimization of the gust's deformation, the wing reduces the momentum transfer between the two systems, thus reducing the lift transient experienced.
In the left column of figure 13, the non-manoeuvring gust encounter at  ${\rm GR}=0.50$ experiences the same general trends seen for
  ${\rm GR}=0.25$. The gust is stronger, which leads to a stronger suction-side LEV. This LEV induces the formation of secondary vorticity under it, as shown at
  $tU_\infty /c = 1.00$. The suction-side LEV grows in size, advects upwards and separates. The trailing-edge wake deflects upwards significantly more than in the
  ${\rm GR}=0.25$ case. The wing's disturbance to the gust is severe and leads to the formation of two large vortices, one on either side of the gust. These vortices are also seen when the gust generator is first turned on, which indicates that the passage of the wing though the gust is similar to an abrupt blockage and subsequent restart of the gust flow. This action leads to a large transfer of momentum between the gust and the passing wing, increasing the lift overshoot experienced by the wing. In the right column of figure 13 the pitching wing's suction-side LEV detaches faster than in the case without pitching. As the wing exits the gust, a pressure-side LEV as well as a TEV form. As with pitching at
  ${\rm GR}=0.50$, the flow fields in the right column of figure 13 show that the pitching appears to minimize the disturbance of the gust flow field.
4.4. Momentum quantification
The flow fields in the previous section qualitatively demonstrate a reduction in the vertical momentum in the gust flow during an open-loop pitching manoeuvre. In this section we seek to quantify this result. The total momentum per unit wing span of the flow within the field of view (FOV) for an incompressible flow of density  $\rho$ can be expressed as
 \begin{equation} P(t)=\rho \iint_{FOV} v(t,x,y) \,\text{d}A. \end{equation}
Figure 14 presents the momentum per unit span  $P$ in the field of view and the momentum per unit span normalized by the gust ratio
  $P/{\rm GR}$ for all non-pitching cases. The grey region represents the region where the wing is at least partially immersed in the gust. A collapse can be observed when the coefficients are normalized by the gust ratio. Prior to the wing encountering the gust, figure 14 shows a relatively constant momentum in the flow that corresponds to the steady state of the gust. The vertical momentum in the flow field begins to drop as soon as the wing encounters the gust, and continues to decrease at a relatively constant slope as the wing moves through the gust. The vertical momentum in the field of view begins to recover as soon as the wing fully exits from the gust. Figure 14 demonstrates a large reduction in the vertical momentum in the field of view for the entirety of the gust encounter, supporting the qualitative claims made in the previous section.

Figure 14. (a) The momentum per unit span  $P$ and (b) the momentum per unit span normalized by the gust ratio
  $P/{\rm GR}$ for all non-pitching cases.
Figure 15 presents the momentum per unit span  $P$ in the field of view for all the pitching and non-pitching cases, normalized by
  ${\rm GR}$. The pitching cases do not demonstrate the large reduction of momentum observed for the non-pitching cases. Instead, they demonstrate a slow increase in the vertical momentum of the flow from
  $tU_\infty /c=1.00$ to
  $tU_\infty /c=6.00$.

Figure 15. The momentum per unit span  $P$ for all cases normalized by
  ${\rm GR}$.
The first two rows in figure 16 present contours of the vertical velocity for  ${\rm GR}=0.50$ without pitching. During gust entry at
  $tU_\infty /c=1.00$, the vertical velocity on the pressure side of the wing is near zero due to the stagnation of the flow, and the vertical velocity over the suction side of the wing aft of the midchord is close to zero due to the blockage imposed by the wing on the vertical gust flow. The forming LEV contains regions of positive and negative velocities due to the rotation of the flow. The region of zero velocity expands as the wing passes through the gust. Once the wing exits the gust, the blockage effect created by it subsides and, thus, the gust begins to recover momentum in the field of view.

Figure 16. Contours of the vertical velocity for  ${\rm GR}=0.50$ without pitching (a–f) and with DVM-D pitching (g–l).
The last two rows in figure 16 present contours of the vertical velocity for  ${\rm GR}=0.50$ with DVM-D pitching. In contrast to the non-pitching case, the zero velocity region is tightly confined to the region around the wing in this pitching case. Thus, the pitching of the wing reduces the vertical momentum variation in the gust flow. The small rise in the vertical momentum shown in figure 15 corresponds to a gradual widening of the gust in figure 16. The passage of the pitching wing through the gust may disturb the steady state of the gust, causing temporary variation in flow rate from the outlet, but the momentum value within the gust region is relatively consistent compared with the non-pitching cases.
4.5. Leading-edge vortex strength
The circulation of the suction-side and the pressure-side LEVs was calculated by defining the LEV region of interest in every PIV frame and integrating the vorticity within it. The LEV region of interest includes the vortex as well the shear layer that feeds it. Figure 17 shows the non-dimensional vortex circulation strength as well as the non-dimensional vortex circulation strength normalized by  ${\rm GR}$ of the suction-side and pressure-side LEVs for all gust ratios and pitch manoeuvres. Each manoeuvre is shown with a different colour and each
  ${\rm GR}$ is shown with a different line marker. The non-dimensional vortex circulation strength collapses when normalized by
  ${\rm GR}$, as shown in figure 17(b).

Figure 17. (a) Suction-side and pressure-side non-dimensional LEV strengths  $-\varGamma /U_\infty c$ and (b) non-dimensional LEV strengths normalized by the gust ratio
  $(-\varGamma /U_\infty c)/{\rm GR}$ for all cases.
To understand the growth of the LEV as well as the difference in the circulation trends between the pitching and non-pitching cases, we ensemble average the circulation trends across all the pitching cases and ensemble average the circulation trends across all the non-pitching cases. Figure 18 shows the ensemble-averaged circulation trends along with shaded bands that outline the circulation envelope spanned by the manoeuvres that were ensemble averaged. The circulation of the suction-side LEV appears on the left half of the plot and the circulation of the pressure-side LEV circulation appears on the right half of the plot, after  $tU_\infty /c=2$. The circulation strengths of the suction-side LEV for the pitching and non-pitching manoeuvres are initially similar. In addition, the circulation growth is initially near linear. The LEV strength has been shown to be governed by the velocity at the shear layer feeding the vortex (Kriegseis, Kinzel & Rival Reference Kriegseis, Kinzel and Rival2013; Widmann & Tropea Reference Widmann and Tropea2015), which is normal to the wing at the leading edge. Figure 19 shows the contributions to the normal velocity at the leading edge from the gust, the free stream and the pitching motion. For the no-pitch cases, the normal velocity at the leading edge is dominated by the transverse gust velocity
  $v_g$. For the pitching wing, additional contributions to the normal velocity arise due to the wing's angular velocity
  $\dot {\alpha }$ as well as the free-stream component
  $U_\infty$ normal to the wing. As the wing pitches down, the normal velocity contributions from the gust decreases and from the free stream increases, which alone would lead to a reduction in the total normal velocity. However, the pitching motion about the wing's midchord gives way to an additional positive normal velocity component due to the motion of the leading edge that balances out the changes in the other contributions. Thus, a pitching motion that reduces the effective angle of attack of the wing still produces initially a LEV similar in strength to the no-pitch gust encounter.

Figure 18. Suction-side and pressure-side LEV strengths along with flow fields that illustrate vortex detachment.

Figure 19. Contributions to the normal velocity at the leading edge of the wing from the gust, the free stream and pitching for a pitch down motion.
At  $tU_\infty /c=1.00$, the rate of increase of the suction-side LEV strength for the pitching manoeuvres decreases, and the circulations begin to plateau. This plateau corresponds with the instant that the suction-side LEV separates from its feeding shear layers, as shown in figure 18. The circulation of the suction-side LEVs in the non-manoeuvring cases continues to trend upwards linearly until it begins to plateau at
  $tU_\infty /c=1.75$. This plateau also corresponds to the detachment of the LEV from its shear layer. At
  $tU_\infty /c=2$, a pressure-side LEV begins to form on the pitching wing as the wing pitches up while exiting the gust. The (absolute) growth rate of circulation is initially linear and plateaus towards the end of the manoeuvre as the vortex detaches.
4.6. Streamlines
The flow field can be visualized using instantaneous streamlines, which can also highlight regions in the flow with large path curvature and flow stagnation. The streamlines presented in this section are computed from the PIV velocity vector fields using the algorithm presented by Jobard & Lefer (Reference Jobard and Lefer1997). Figure 20 presents the unsteady streamlines in the laboratory frame of reference for the no-pitch and DVM-D cases at  ${\rm GR}=0.50$ and
  $tU_\infty /c=1.30$. In the no-pitch case in figure 20(a), the vertical gust flow stagnates on the high pressure side of the wing and is diverted to flow horizontally. On the suction side, the LEV is present and still attached at
  $tU_\infty /c=1.30$. In figure 20(b) the streamlines for the DVM-D manoeuvre do not experience stagnation on the high pressure side of the wing and, thus, remain relatively vertical compared with the no-pitch case. The vortex in the DVM-D case has detached and, thus, its core is further from the leading edge. For the non-manoeuvring wing, the stagnation of flow on the high pressure side of the wing leads to high streamline curvature under the wing. Pressure increases across streamlines, outward from the centre of curvature, to maintain the centripetal acceleration required for fluid parcels to follow the curved path. This positive gradient leads to high pressure on the wing's pressure side. The streamlines in the pitching case exhibit less curvature and, thus, the pressure does not increase as much as in the ‘no-pitch’ case. The distinct streamline behaviour between the two cases illustrated in figure 20 suggests that the utilization of sensors on the high pressure side of the wing may provide useful information for flow sensing and control during mitigation of gust encounters.

Figure 20. Flow streamlines in the lab frame for  ${\rm GR}=0.50$ and
  $tU_\infty /c=1.30$. (a) Lab frame, no pitch and (b) lab frame, DVM-D.
The streamlines in the laboratory frame of reference present an intuitive method to understand the topological difference in the flow from the perspective of the gust, but on-board flow sensing requires the frame of reference to be in the body frame of the wing. Figure 21 presents the unsteady streamlines presented in figure 20 at three separate convective times, now in the wing's frame of reference and focused on the wing's leading edge. The wing's body frame translates and rotates with the wing. This figure also presents coloured contours of the flow speed in the body frame. The stagnation points in the flow are highlighted by the red contours in the figures. Without pitching, the gust introduces an effective angle of attack at the leading edge. Due to the angle of incidence of the flow, the stagnation point of the flow lies on the pressure side of the wing towards the leading edge. On the other hand, the pitching wing lines itself up with the flow, moving the stagnation point which initially lies close to the leading edge on the pressure side, to the front of the leading edge. This observation presents a practical objective for gust mitigation through the control of stagnation point position on the wing. Since the stagnation point position on the wing is an indication of the local angle of attack at the leading edge of the wing, it may be possible to use surface pressure sensors and an on-board controller to maintain the position of the stagnation point throughout the gust encounter, thereby minimizing the excursion of the local angle of attack at the leading edge during the encounter.

Figure 21. Flow streamlines in the body frame of the wing (pressure side) for  ${\rm GR}=0.50$.
4.7. Comparison of DVM-simulated and experimental flow fields
Figure 22 shows a comparison between the experimental flow field and DVM simulation for a wing-gust encounter at  ${\rm GR}=0.50$ undergoing a DVM-D manoeuvre. Although the discrete vortex method provides Lagrangian vortex positions, the DVM velocity field is evaluated on an Eulerian grid to match the PIV flow fields. The vorticity is then calculated by taking the curl of the velocity field,
  $\omega =\boldsymbol {\nabla }\times \boldsymbol {v}$. The flow fields show good qualitative agreement with slight differences in the time of vortex detachment. As the wing enters the gust, a LEV forms in both the experiments and simulations. At
  $tU_\infty /c=1.00$, the LEV begins to detach from the leading edge in the experimental flow field, however, it remains attached in the DVM simulations. Note that the DVM simulations fail to model the secondary vorticity that can be seen under the suction-side LEV in experiments. Since the DVM only sheds vorticity at the leading and trailing edges, it does not model vorticity that forms between the main vortex and the wing's surface. Medina & Jones (Reference Medina and Jones2016) observed that the region of secondary vorticity under the LEV grows and eventually penetrates the LEV, separating the LEV from the feeding shear layer. This aspect of the flow is not modelled in a DVM and, thus, leads to a delayed detachment of the vortex. The detached vortex quickly loses its form in the experimental data, as shown in
  $tU_\infty /c=2.00$, but it maintains its shape in the DVM solution. The detached vortex in the DVM maintains its coherence, perhaps due to the absence of three-dimensional effects in the simulation. At
  $tU_\infty /c=2.75$, both flow fields exhibit the formation of a pressure-side LEV as well as a TEV.

Figure 22. A comparison between the experimental (a–d) and DVM simulation (e–h) flow fields of a wing-gust encounter at  ${\rm GR}=0.50$ undergoing a DVM-D manoeuvre.
The accuracy of the DVM simulation can be explored further by comparing the suction-side and pressure-side LEV strengths between the experiments and DVM simulations. Figure 23 presents this comparison for the DVM-D manoeuvre for all gust ratios. The trends plotted between  $tU_\infty /c=0$ and
  $tU_\infty /c=1.50$ are for the suction-side LEV and the trends plotted between
  $tU_\infty /c=2.00$ and
  $tU_\infty /c=3.00$ are for the pressure-side LEV. At the lowest gust ratio
  ${\rm GR}=0.25$, the DVM overpredicts the circulation contained in each vortex. In contrast, the DVM does a good job of predicting the circulation strength of the vortices at the higher gust ratios. The angle of incidence at the leading edge for the lowest gust ratio is small, and the flow does not fully separate. Thus, the application of the Kutta condition at the leading edge for this case leads to an overprediction in the circulation shed, even though the wing has a sharp leading edge. On the other hand, the Kutta condition is successful at predicting the circulation shed from the leading edge at the higher gust ratios.

Figure 23. Comparison of the suction-side and pressure-side LEV strengths for experiments and DVM simulations.
5. Conclusion
This paper experimentally investigates the flow field development and unsteady loading of three open-loop pitch manoeuvres with the objective of mitigating the lift transient during large-amplitude transverse wing-gust encounters. The first manoeuvre, ‘Eff.-D’, is designed such that the instantaneous geometric angle of attack opposes the effective angle of attack induced by the gust. The second manoeuvre, ‘WK-D’, is designed such that the analytical lift result from an unsteady aerodynamic model based on the work of Wagner and Küssner sums to zero. The third manoeuvre, ‘DVM-D’, is obtained from closed-loop control simulations in an unsteady DVM.
Force and pitching moment results are shown to collapse when normalized by the gust ratio. The performance difference across manoeuvres is shown to be dominated by the added-mass force, and, thus, accurate modelling of added mass is critical for lift mitigation manoeuvre design. The pitch manoeuvres were found to mitigate a significant portion of the circulatory contribution to the lift force. The utilization of pitching to mitigate lift doubled the pitching moment range relative to the uncontrolled case. The source of the pitching moment fluctuations differed between the pitch and no-pitch manoeuvres. When a wing encounters a gust without pitching, the moment fluctuations are a result of lift fluctuations. On the other hand, for the pitch manoeuvres, the pitching moment fluctuations are due to the reaction of the fluid to the pitching of the wing.
The main flow features of the wing-gust encounters were identified using flow field measurements. Without pitching, the transverse gust flow stagnates on the pressure side of the wing, resulting in a large disturbance to the gust structure. This disturbance leads to a large transfer of momentum between the gust and the passing wing, increasing the lift transient experienced by the wing. In contrast to the case without pitching, the flow on the pressure side of the pitching wing does not experience stagnation. Instead, the velocity vectors maintain a large vertical component close to the wing's surface. Although the velocity vectors point into the wing in the laboratory frame of reference, this flow behaviour is physically consistent with the no-penetration boundary condition. Since the wing is translating and pitching, its surface has a non-zero vertical velocity component that the fluid parcels on the wing's surface must match to satisfy the no-penetration and no-slip boundary conditions. This behaviour minimizes the disturbance to the gust's flow field. Quantification of the total momentum of the measured flow field demonstrated a larger variation for the non-pitching wing compared with the pitching wing. Flow streamlines highlighted the possibility of mitigating a wing's gust response through maintaining the position of the pressure-side stagnation point throughout the gust encounter.
The circulation strengths of the LEVs for the pitching and non-pitching manoeuvres are found to be similar in magnitude during the initial period of the gust encounter. Furthermore, the magnitude of the circulation strengths of the suction-side and pressure-side LEVs initially increase linearly in time for all cases, plateauing near vortex detachment. This suggests that vortex growth during a large-amplitude discrete wing-gust encounter is linear when the vortex is attached, an important consideration for modelling efforts.
Finally, the accuracy of DVMs for manoeuvre design is examined by comparing the DVM-simulated flow fields with experimental PIV measurements. It is found that the flow fields show good qualitative agreement. The main discrepancies found are due to the DVM not modelling the secondary vorticity observed under the LEV and three-dimensional flow effects seen in experiments. The accuracy of the DVM simulation can be explored further by comparing the suction-side and pressure-side LEV strengths between the experiments and DVM simulations. At the lowest gust ratio  ${\rm GR}=0.25$, the DVM overpredicts the circulation strengths of these vortices. However, the DVM does a good job at predicting the circulation strength of the vortices at higher gust ratios (e.g.
  ${\rm GR}=0.5$.
  $0.61$).
Acknowledgements
The authors thank Ignacio Andreu-Angulo and Oliver Wild for valuable discussions.
Funding
The authors gratefully acknowledge support from the Air Force Office of Scientific Research under grant FA9550-16-1-0508 and the National Science Foundation under award numbers 2003951 and 2003999.
Declaration of interests
The authors report no conflict of interest.


 Open access