


Impact Statement
The United Nations energy statistics have been published, with annual revisions, since 1950 (see, for example, UN, 2021). The data are widely used for both historical perspective and for policy planning and analysis. The question posed is whether the data are sufficiently accurate for reliable planning and monitoring. What are the magnitudes and types of revisions that are presented in the annual updates? Are there countries or sectors of energy data that are particularly prone to frequent or large-magnitude revisions? Review of the data shows that revisions are widespread among sectors and countries. The revisions represent learning as more data are collected and refined and revisions are frequent but generally small. We conclude that the data are sufficiently consistent and reliable for important analyses.
1. Introduction
Estimates of global and national emissions of carbon dioxide (CO2) to the atmosphere are made regularly as part of the process of monitoring progress and commitments for mitigation of global climate change and for improving our understanding of the global carbon cycle. Many estimates of emissions are updated and revised annually. We are interested in the accuracy of these estimates and in knowing that they are sufficiently accurate to provide reliable monitoring. We are interested in the importance of the periodic revisions and the learning that they represent. How might estimates made now be altered by future data collection and learning? Our focus in this analysis is to understand what factors are leading to revisions of earlier estimates, what kind of learning is represented in revised annual estimates, and what revisions can tell us about the accuracy of the most recent estimates?
Monitoring greenhouse gas emissions is essential to track progress toward emission-reduction targets and to provide essential information for climate modeling exercises. Of the greenhouse gases, the largest source of anthropogenic emissions is the release of CO2 from the combustion of fossil fuels. This fossil-fuel-derived CO2 directly influences the global carbon cycle (Friedlingstein et al., Reference Friedlingstein2022) and hence the global climate system. It impacts both human and natural systems. Accurate, consistent estimates of global CO2 emissions, and an appreciation for the uncertainty within the estimates, are needed to fully characterize the impacts that human society is having on the climate and to guide national and international policy-making with regard to reducing CO2 emissions.
Most fossil-fuel-related CO2 emissions inventories rely on statistics on the production, consumption, processing, and trade of fossil fuel products for energy and non-energy uses rather than on direct measurements of emissions (Andres et al., Reference Andres, Boden, Bréon, Ciais, Davis, Erickson, Gregg, Jacobson, Marland, Miller, Oda, Olivier, Raupach, Rayner and Treanton2012). These energy statistics are typically collected via annual questionnaires from different international and national agencies such as the United Nations (e.g. UN, 2021), the International Energy Agency (IEA) (2022), and the US Energy Information Administration (US/EIA, 2022). Some private corporations, such as BP, also produce data on commodities used for energy globally. Although these individual energy datasets are similar, comparisons among them are challenging because of different foci, assumptions, comprehensive data availability, and the degree to which datasets are revised over time (Marland et al., Reference Marland, Hamal and Jonas2009; Andrew, Reference Andrew2020). Each of these factors also contributes to the challenge of estimating uncertainty for energy data and the derived estimates of CO2 emissions. We can gain insight on uncertainty by comparing multiple estimates from different analysts and by comparing year-to-year revisions from a single analytical team.
The IPCC (2022, 2–11) notes that “reporting uncertainties is crucial in order to understand whether available estimates are sufficiently robust to answer policy questions”. Andrew (Reference Andrew2020) and Solazzo et al. (Reference Solazzo, Crippa, Guizzardi, Muntean, Choulga and Janssens-Maenhout2021) provide recent analyses across multiple datasets of CO2 emissions and show the challenges and limitations of comparing datasets. Both the Andrew and Solazzo et al. analyses concluded that, with careful attention to system boundaries, national estimates of CO2 from fossil-fuel combustion have uncertainty typically in the 5-10% range, with higher values for less developed countries. Andrew (Reference Andrew2020) notes that the multiple international datasets share some data sources and are not completely independent.
When estimates of CO2 emissions are updated annually using the same methods and the same data sources, they offer an opportunity for deriving useful information on uncertainty. Marland et al. (Reference Marland, Hamal and Jonas2009) wrote, for example, “We expect revisions to reflect learning and convergence toward more complete and accurate estimates “. Hamal (Reference Hamal2010) analyzed year-to-year revisions in emissions estimates as a vehicle for exploring the uncertainty in the emissions estimates. She noted that changes in emissions estimates that are recalculated annually occur due to structural changes in the consumption of fossil fuels, to methodological refinements in accounting, and to increases in knowledge, that is, learning. Hamal acknowledged that because estimating CO2 emissions requires only knowledge of fossil-fuel use, the chemical characteristics of fossil fuels and their oxidized amounts; annual revisions to fossil CO2 emission estimates do not change drastically from the initial reported values. However, these changes can be important for monitoring commitments and for trading of emissions quotas. Marland et al. (Reference Marland, Hamal and Jonas2009) concluded similarly that although estimates of emissions have greater uncertainty than is often recognized, “we can have reasonable confidence in both the absolute values and current trends.”
Andres et al. (Reference Andres, Boden and Higdon2014) noted the importance of recognizing the uncertainty of CO2 emissions inventories for understanding the global carbon cycle and used repeat inventories as one tool for evaluating uncertainty. They commented on the importance of the full revised time series because it represents the highest quality and most complete data for each year. Jarnicka and Zebrowski (Reference Jarnicka and Zebrowski2019) used an analysis of successive revisions to explore learning in emissions estimates from 15 European Union countries. They too considered the most recent revision of national emissions to be the most accurate estimates and compared these with the evolution from previous versions of the dataset. They concluded that there is a need for further reduction in the uncertainty of emissions inventories by individual countries.
Hoesly and Smith (Reference Hoesly and Smith2018) looked at repeat inventories, not of CO2 emissions but of the energy consumption estimates, by fuel type, that immediately precede the calculation of CO2 emissions estimates. They examined data on 63 countries in 17 annual reports of the BP Statistical Review of World Energy (e.g., BP, 2022). Hoesly and Smith found that 70% of non-zero data points were revised in the first year after initial publication. They found that in this revision data points changed by mostly small amounts. Although increases in energy consumption occurred more frequently, decreases tended to be larger. In the second-year revisions 26% of values were revised, and in the third-year revisions 13% were revised. The frequency and magnitude of changes varied by country and fuel with near-term changes tending slightly larger and more frequent for petroleum fuels and for non-OECD countries.
The analyses discussed above have used repeated inventories to analyze the uncertainty of CO2 emissions inventories or of energy consumption statistics at a very aggregate level, such as total solid fuel consumption in a country or CO2 emissions from solid fuels in a country. But CO2 emissions from solid fuel consumption for a country, for example, are often based on apparent consumption which is generally estimated as the sum of production and imports, subtracting out exports and changes in stocks on hand, and adjusting for any fuels used for international commerce (bunker fuels). Although the aggregate information reveals that there are changes that are occurring at the country or global level, they do not allow for additional information and learning with regard to what specific data are changing, and perhaps why. When a fossil CO2 emission estimate is changed, is this a change in reporting methods, the inclusion of additional data not readily available in the previous edition, or random errors along the data collection process? What can we learn from investigating the details of change in multiple editions of energy statistics, and what are the implications for the estimation of fossil CO2 emissions in the near-term and the long-term? Can we anticipate how today’s estimates of emissions will ultimately be altered by successive revisions in the input data?
The goal of this study is to explore the revisions that occur in the annual updates of the United Nations Energy Statistics Database (UNESD). Gilfillan and Marland (Reference Gilfillan and Marland2021) have used the UNESD to provide an annual update of CO2 emissions estimates, by country, through 2019 - continuing a long series of annual updates. These annual updates use the UN data for the most recent year and show revisions at both the national and global levels for CO2 emissions in previous years (Table 1). We explored these revisions at the level of the detail of the UN Energy Statistics. To the authors’ knowledge, this is the first investigation that uses the fully disaggregated energy data to explore changes in energy statistics and the potential repercussions on current estimates of fossil CO2 emissions. We identified systematic changes to the reporting methodology that influenced large-scale revisions, but we also explored what countries, fuel types, and energy flows are dominant in the annual revision process. Where is learning taking place and what influence does this have on global and national estimates of CO2 emissions? We also analyzed country-level data to determine whether there are identifiable patterns in the behavior of countries with respect to the reporting and subsequent revision of energy data.
Table 1. Estimates of CO2 emissions (in MtC) from fossil fuel consumption in 2014 as estimated initially in 2016 and as revised in 3 successive annual versions of the CDIAC-FF CO2 emissions dataset (see Gilfillan and Marland, Reference Gilfillan and Marland2021; Hefner and Marland, Reference Hefner and Marland2022; etc.)

Note. Data are shown here for the global sum of all countries + bunker fuels and for 3 countries with emissions totals that are large enough to significantly impact the global sum (i.e., the first, second, and fifth largest national emitters in 2019).
The UN energy data are largely survey-based (using some official datasets) and hence continually subject to revision as more data are collected or discovered. For this analysis, we used 11 versions of the annual UN Energy Statistics Database, the versions issued in 2010 through 2020. Because of the time required to assemble final, annual data for 200+ countries, there is typically a 2 or 3-year lag between the end of a calendar year and the first reporting of final energy data by the UN. Thus the Database published in 2020 has, generally, the initial complete publication for data through 2018. To illustrate the impact of revisions on annual CO2 emissions estimates Table 1 shows some emissions estimates for 2014 based on the data first reported in 2016 and then as the energy data were revised in 3 subsequent annual revisions of the energy database. The example of Table 1 signals the conclusions that at the aggregate level revisions of energy data extend over multiple years, are generally small with a small impact on estimates of global CO2 emissions, vary among countries, and are concentrated in the early years after initial reporting. We explore these revisions at the disaggregated level of the U.N. Energy Statistics Database.
2. Methods
2.1. The UN EnergyStatistics Database
The UNESD is maintained by the United Nations Statistics Division (UNSD) and catalogs the production, trade, transformation, and use of solid, liquid, and gaseous fuels, electricity, and heat for all countries. The data are maintained back to 1950. The data are collected largely via an annual questionnaire submitted to every country but include some data from official datasets. New entries are sought annually as are revisions to previous entries and completion of missing values. The UNSD asks each year for revised data from recent years but does not call for revisions back to the beginning of the dataset. When final data are sought for a given year, the UNSD now encourages countries to also enter data for more recent years even if it is provisional and subject to revision (see more below). Table 2 outlines the relevant fuels and fuel products that are involved for the estimation of fossil-fuel-related CO2 emissions: 12 solid fuel categories, 23 fuel categories for liquid commodities, and six for gaseous commodities. For each commodity, the dataset reports production, imports, exports, stock changes, gases flared and vented, quantities used for non-energy uses, and quantities loaded for international marine and aviation bunkers. As noted above, the time required for complete data acquisition and management typically results in a lag of 2 to 3 years between the end of a calendar year and the initial publication of sufficiently final data for that year.
Table 2. Fuels and fuel products with CO2-relevant data in the UN Energy Statistics Database

a Refinery gas is traditionally measured in mass units and is often treated as a secondary liquid.
The edition of the UNESD published in 2020 included over 1.8 million data points up through 2018, each data point with year, country, commodity, transaction, units of measure, and quantity. Of these 1.8 million data points, 438,683 entries are relevant to the oxidation of fossil fuels, as used by Gilfillan and Marland to estimate CO2 emissions, and the rest describe other fuels and energy media. Of the 438,683 relevant values for the 2020 publication 421,838 were unchanged from the previous year, 7206 had the value changed from the previous year’s report, and 9639 were new entries. We distinguish between the publication year, the inventory year – the most recent year with complete, final data - and the emission year – the year in which the CO2 emission or fuel transaction occurred. Thus the database published in 2020 has publication year 2020, includes complete data through inventory year 2018, and reports the most recent values for transactions that occurred in emission years 1950 to 2018 (see section 2.3 below). The analyses in this paper are based on 11 versions of the UNESD: publication year 2010 through publication year 2020. All of these include data beginning for emissions year 1950.
2.2. Defining revisions
Revisions in the UNESD are considered to be changes in the quantity of a data point. This includes additions, deletions, and quantity changes. Additions are entries added for past years in a new release of the database. In essence, the quantity goes from zero to a given value. Deletions are entries taken out from the previous database and represent an entry going from some value to a quantity of zero. Quantity changes are entries that existed in a previous database but the quantity is changed in a subsequent inventory. Additions are positive, deletions are negative, and quantity changes can be positive or negative depending on the change in value. As noted above, since the 2017 publication the database has sometimes reported preliminary values for years more recent than the complete inventory year and these are considered to be new entries that are subject to revision in subsequent years.
2.3. Defining the publication year, inventory year, and the emissions year
We thus categorize revisions by the publication year (the year the inventory was published), the inventory year (the most recent year for which there is a final, complete dataset), by the year during which the transaction or emission occurred (the emissions year), and by the age of the data entry that was revised. The age of an entry refers to the difference in years between the inventory year and the emission year. New entries to the database start with an age of 0. Thus a transaction for year 2018 will generally first appear in publication year 2020 with an age of zero, whereas a transaction for emissions year 2012 which is revised in publication year 2020 will have an age of 6 (2018-2012) years and a transaction for emissions year 2011 which was revised in publication year 2020 will have an age of 7 years (2018-2011). We define historic revisions as revisions made to entries whose age was greater than or equal to 10 years. Near-term revisions are revisions made to entries less than 10 years old.
3. Results and Discussion
3.1 Administrative changes in the 2011 United Nations Energy Statistics Database
Revisions in the UNESD can be influenced by both revisions in country-level reporting as well as by coding changes within the UN Statistics Division. In our review of the 11 available annual versions of the UNESD, we observed one minor reorganization in the data presentation with some noticeable impact. In February 2011 the UN adopted the International Recommendations for Energy Statistics (IRES). The aim of the IRES was to “provide a comprehensive methodological framework for the collection, compilation, and dissemination of energy statistics in all countries irrespective of the level of development of their statistical system.” (UN, 2018) The IRES came as a result of work done by the Oslo City Group (see Statistics Norway, 2021), an international working group started in 2005 by the UN to further develop energy statistics and standards. The impacts of these methodological changes are visible in some of the commodity and transaction codes of the UN energy statistics, as discussed below. As an example, the dataset for inventory year 2010 had 3442 entries for plant condensate, natural gas liquids, and natural gasoline and we were able to match many of these to similar transactions but under a different commodity code (also labeled natural gas liquids) in the 2011 dataset. Similarly, use of the code for brown coal coke was much reduced after the 2010 dataset. Consequently Table 3 below shows in 2011 an unusually large number of revisions, including many revisions of historic data with ages greater than or equal to 10 years. Similarly, Table 4 shows a very large number of new entries in the 2011 dataset versus the 2010 dataset.
Table 3. The number of value changes in the annual versions of the United Nations Energy Statistics Database as a function of the inventory year and the age of the data entries that were changed
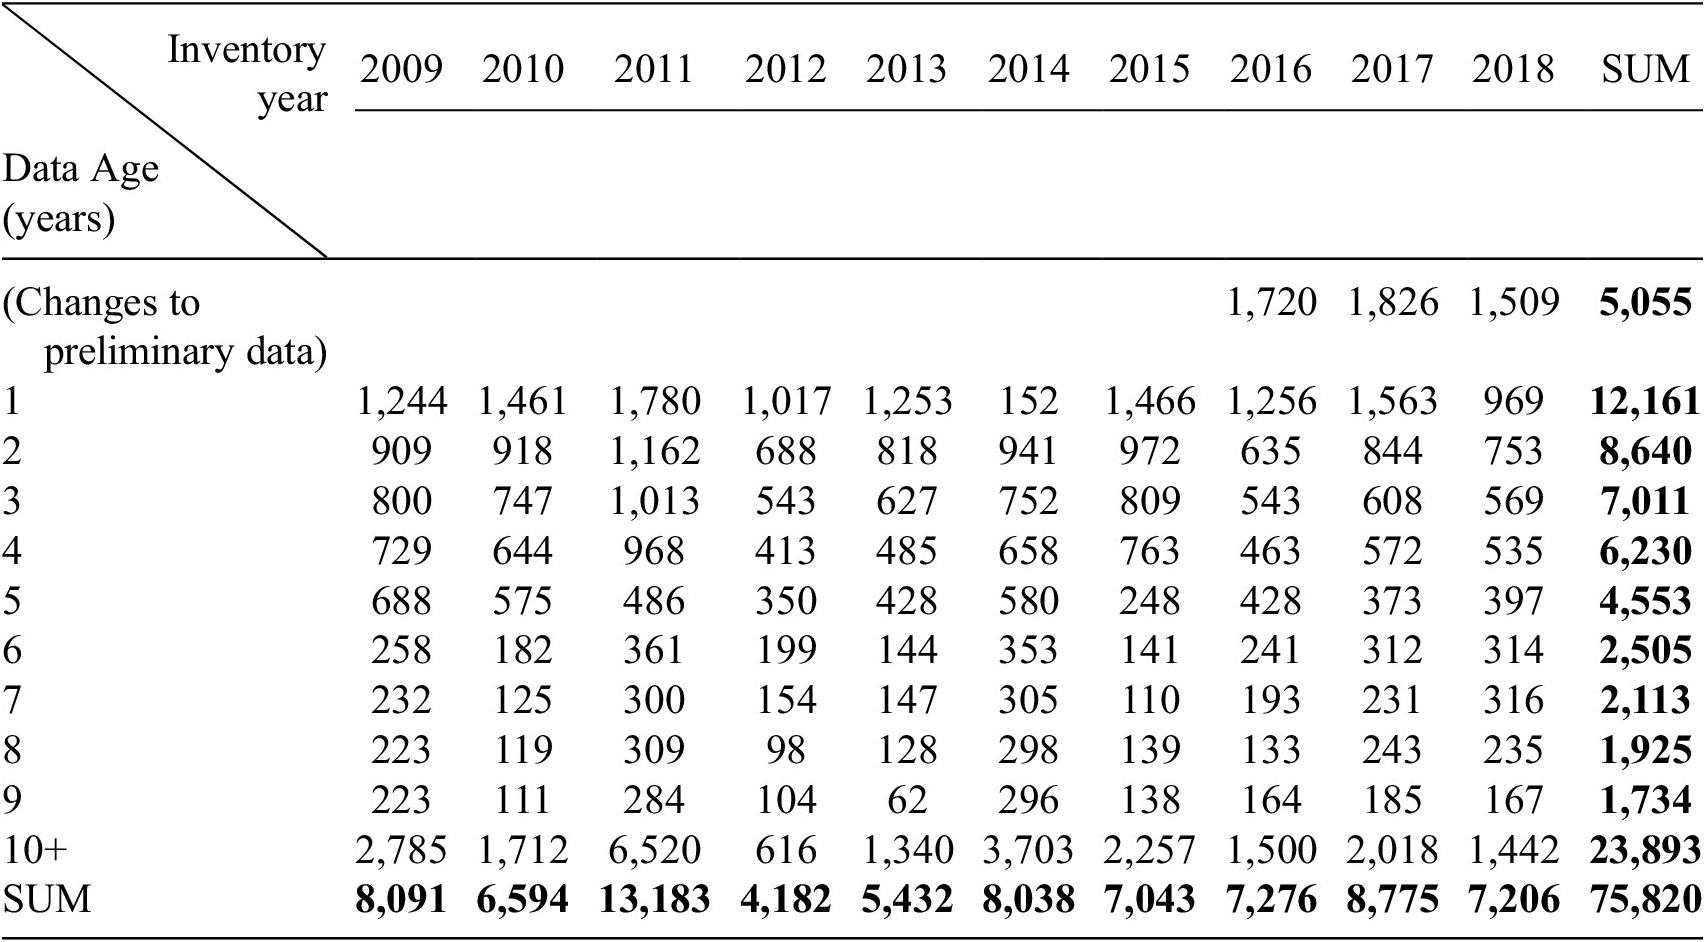
Note. See the text for an explanation of preliminary data entries in the 3 most recent years shown.
Table 4. The number of additional data entries in successive versions of the United Nations Energy Statistics Database

Note. Columns are for the inventory years and the data age represents the number of years in which that year has a previous estimate to compare. Thus, for example, the data for 2009 had 8312 additional values added in the inventory year. Note again the last 4 years include preliminary entries for years more recent than the inventory year.
Table 3 summarizes the number of revisions observed as a function of the year the data were first published (the inventory year) and the age of the data entries that were revised. The table shows, for example, that in inventory year 2009, there were 1244 revisions to data with an age of 1 year, 909 revisions to data with an age of 2 years, and so on out to 2785 revisions to data with an age of 10 or more years; for a total of 8091 revisions. Note that in the 3 most recent years the dataset included preliminary values for the most recent year (i.e., preliminary values for 2017 entered in the database for inventory year 2016) so that these values were often revised in spite of the fact that they had an apparent age of 0. Although Table 3 shows the number of changed values, Table 4 shows the number of new entries to the dataset each year.
Entries in the UNESD can either be added, deleted, or changed after initial publication. Figure 1 shows the summation of revisions for additions, deletions, and quantity changes for subsequent years of the UNESD. For UN2008, for example, the figure shows the number of revisions to the 2008 dataset after 1 year, cumulatively after 2 years, etc. The figure shows, for example, that for inventory year 2008 data there were a relatively small number of revisions in the first following year, a relatively small number again in the second following year, a very large number of revisions in the third following year (inventory year 2011), and again relatively small numbers of revisions in all later years. Likewise, for the inventory year of 2009 the figure shows the cumulative number of revisions after successive inventories up to n = 9 years in inventory year 2020 with a very large number of revisions in the second year. A new edition of the database becomes increasingly less like the initial release as revisions accumulate in each successive year.

Figure 1. Count of additions (orange), deletions (red), and quantity changes (turquoise) in successive editions of the UNESD beginning with the 2010 publication (inventory year 2008). Notice that when the 2011 inventory is compared to previous editions, there is a significant jump in deletions and additions (year 3 in the UN2008 panel, year 2 in the UN2009 panel, and year 1 in the UN2010 panel), noting the administrative changes in the dataset that occurred in inventory year 2011.
From Figure 1 it is clear that a very large number of revisions took place in 2011. Most of the deletions and a large fraction of observed additions can be attributed to the methodological changes in inventory year 2011 as described above. After 2011 revisions are mostly changes in values rather than deletions or additions and the pattern of the number of value changes is relatively constant over time, including through 2011. Reallocating fuel types to new categories is responsible for this pattern of revisions in 2011 and most of the changes can be tracked through the transition. In sum, 47.8 % of all revisions from 2011 to 2018 were revisions in the 2011 UNESD data, compared to 10.0 % for the 2012 UNESD data or 9.6 % for the 2013 UNESD data.
As a consequence of the large number of changes following the methodological change in 2011, the remainder of this analysis examines only revisions in data after inventory year 2011.
3.2 Patterns of revisions
Of all UNESD observations that are employed in the estimation of the fossil CO2 emissions dataset CDIAC-FF (see Gilfillan and Marland, Reference Gilfillan and Marland2021; Hefner and Marland, Reference Hefner and Marland2022) for the 2011-2018 editions, only 3.3 % of entries were revised from the last preceding database. In the 2015 CDIAC-FF CO2 emissions dataset, preliminary entries for the year 2016 began showing up, that is, 2016 transactions in the 2015 inventory year dataset. Of these preliminary values 42.3 % of the early estimate observations were revised in the next edition year; these revisions of early preliminary data represented 6.7 % of all revisions.
Most near-term revisions occurred in the first update (see Figure 2), and these accounted for 14.9% of all revisions. The number or revisions then decreased in subsequent years with 11.3 % of all revisions occurring in the second update, 9.5% in the third, and 8.4 % in the fourth. A total of 28.6 % of all revisions were historic revisions, values revised in the tenth and later years following initial reporting. This decreasing trend of the frequency of revisions over time is similar to what has been reported for other energy statistics (e.g., Hoesly and Smith, Reference Hoesly and Smith2018).

Figure 2. The count of revisions based on fuel type and the age of the data entry, or number of times an observation has the potential to be revised. Observations are separated by fuel type (see Table 2). Unique revisions from year 2011 to 2018 (n=48,515) are included.
Most revisions involved liquid fuel commodities (79.7% of all revisions) (see Figure 2), with 23.2 % of all revisions being historic revisions of liquid fuel data. Of course there are many more liquid fuel commodities so even if emissions were randomly associated with commodities it would be expected that revisions of liquid fuel data would be the most frequent. If revisions are randomly associated with commodities it is not unexpected that revisions of liquid fuel data are the most frequent. Of all revisions 11.8% were for solid fuels and 8.4 % for gaseous fuels. The commodities with the most revisions were diesel oil (11.0 %), kerosene-type jet fuel (10.0 %), natural gas (8.3 %), fuel oil (8.2 %), and motor gasoline (7.9 %).
Data on imports represented the largest portion of revisions by type of transaction (36.6 % of revisions), and this was followed by the transaction “changes in stocks” (16.6 % of revisions).
Figure 3 summarizes the addition of new entries for five recent inventory years. These additions are dominated by data on liquid fuel imports. Additions are most frequent for recent years and typically extend back for 30 years. A departure from this pattern is observed for inventory year 2017 at which time there was a very large introduction of import data for liquids extending back to the beginning of the dataset in 1950.

Figure 3. Additions to the UNESD dataset in each of the inventory years 2015 to 2019 according to the age of the year to which additions were made. The number of additions is seen to decline with time in a pattern that is characteristic of 4 of the inventory years shown. The dominant transaction for additions was liquid fuel imports.
Although there is no clear pattern in the data series revised, some countries submitted notably more revisions than others. The countries that provided revised data the most frequently were (in descending order) the Netherlands, Japan, Canada, United States, Austria, and the United Kingdom. Canada revised their near term data the most frequently, whereas the Netherlands revised their historic solid and gas data the most frequently and Japan revised their historic liquid fuel data the most frequently. Revisions are widespread among countries and the top ten countries accounted for 17% of revisions to historic entries and 18% of revisions to near term entries.
The frequency of changes in fossil fuel data shows that revisions are most common for developed countries, that is, for countries with mature data management systems and continuing resources and attention committed to fuel transactions and the complexities of collecting and managing complex data on manifold commodities and manifold transactions. Developed countries tend to have more than one way to estimate or cross-check data points and these emerge on different temporal scales. Many countries simply do not have the capacity and resources to revise their reporting because they do not have parallel data streams and the capacity to go back and double-check against later data sources. Furthermore, developed countries listed in Annex I of the Kyoto Protocol are obliged to check and recheck their historical data. The frequency of changes helps to characterize the intensity with which commodities and transactions are being monitored and it identifies different behaviors in the data management of different countries. The absolute magnitude and direction of changes influence the end result that we are focused on: estimates of fossil-fuel related CO2 emissions. But we note that large number of data points that are not revised say little about how accurate those data points are.
To provide amplitude scale we list here, by fuel category, the largest revisions observed in the UN energy data. The largest revision observed in the 2011-2018 inventory year datasets resulting in an increase of solid fuel consumption was for coal in China in 2012; the estimate of coal produced was 300 million metric tons higher in this first update of the 2011 numbers. The largest observed decrease for solid fuels was also for China, with a decrease of 224 million metric tons in coal production in 2009 (For further insight on Chinese coal data see also Korsbakken et al., Reference Korsbakken, Peters and Andrew2016). To put these into perspective with regard to CO2 emissions these changes represent an initial underestimate of China’s 2012 CO2 emissions by 226 MtC, and an initial overestimate of emissions from coal production in 2009 by 169 MtC. For liquid fuels, the largest increase observed was 17.1 million metric tons of imported crude oil in 2009 in Singapore in the fifth update, and the largest observed decrease was in Saudi Arabia, a 40 million metric ton decrease in diesel fuel imports in 2017 (a revision of the preliminary estimate in the inventory year 2016 dataset and clearly correction of a typographical error). The largest revision increase for gaseous fuels was the first update to Russia’s 2017 natural gas exports (by 590 PJ), whereas the largest decrease was of Germany’s preliminary estimate of exports of natural gas (1.27EJ) for 2018 (in the UNESD inventory year 2017). The underestimate of Singapore’s import value for liquid fuels would represent 14.3 MtC emissions in 2009 and the Russian overestimate of its 2017 emissions from gaseous fuels would represent 7.9 MtC.
To illustrate the relative magnitude of data revisions Figure 4 summarizes for each fuel group the net magnitude of revisions, by transaction type, and the net contribution to revision of the estimates of the global total fuel consumption and thus of CO2 emissions. For solid fuels it was revisions to production data, followed by changes in stocks, that have had the greatest impact on global fuel consumption estimates. For gaseous fuels it was also revisions of data on production that have had the greatest effect on global fuel consumption estimates. For liquid fuels all of the transaction types have had revisions that contributed to changes in fuel consumption and CO2 emissions estimates, but no transaction has dominated and all of the contributions have been small. Changes have been both positive and negative with respect to the global sum of fuel consumption.

Figure 4. Net revisions for each year for the sum of all of the solid, liquid, and gaseous fuel commodities by transaction category; and for the global effect on fuel consumption and thus on CO2 emissions. Thus the value shown for imports of solid fuels for a given year is the sum of the revisions for each of the solid fuels for the year shown on the horizontal axis. For the vertical axis the values shown are in thousand metric tons of fuel commodity for solid and liquid fuels and in terajoules for gaseous fuels.
4. Conclusions
National and global estimates of CO2 emissions are generally based on statistics on the consumption of fossil fuel products. For countries and for the global total of emissions, these estimates rely on energy statistics such as those compiled annually by agencies such as the UNSD. For the UN, with statistics on over 200 countries, data collection and processing result in a lag on the order of 2 years between the end of a calendar year and publication of complete, final, detailed statistics. All of these data are subject to addition and revision over time as learning and continuing data collection provide ever more, and presumably more accurate, data. We are interested in where (both geographically and in terms of fuel processing and use) this learning takes place and how it affects our estimates of CO2 emissions. Are current estimates of CO2 emissions based on UN data sufficiently accurate to support public policy and our understanding of pending climate change? Is learning likely to alter current understanding?
Examination of the differences among 11 successive annual releases of energy data from the United Nations Statistics Office shows that learning and updates over time result in a very large number of revisions to the energy data. These revisions are widely scattered among countries and among fuel transactions as learning takes place broadly, but the revisions are generally small and represent refinements rather than systematic inconsistencies and/or disruptions of data series. Most revisions occur in the earliest years following original data publication but revisions back to the 1950 origin of the dataset can occur. Development of refinements in data processing and management can result in changes to the details of the dataset that are logical and transparent.
Analyzing energy data at a disaggregated level allows for a deeper understanding of how CO2 emissions estimates are changed for an emissions year as new information is reported. Updates and other revisions are more frequent in developed countries with expected good data management systems and available resources for data collection and management. Revisions among many fuel types occur throughout the chain of fuel production, processing, trade, and consumption. The transaction with the most frequent revisions is imports. But, there is no systematic point where data are routinely revised. Identifying specific data trends within specific countries with regard to revisions is hard to discern but this analysis did not reveal any glaring country-level inconsistencies or biases.
Our analysis does not lead to a quantitative estimate of the accuracy of CO2 emissions estimates but it has permitted us to examine the evolution and consistency of the extensive UN energy input data on global energy production, processing, trade, and consumption. Revisions and additions over time are presumed to reduce uncertainty and there is no indication of systematic changes or bias. Although revisions presumably reflect learning and improvements in accuracy a lack of revisions does not point to accuracy. We believe that estimates of global and national totals of CO2 emissions and the energy data on which they rely are generally consistent and that both absolute values and trends are reliable over time and sufficiently accurate for scientific understanding and public policy.
Acknowledgments
We are indebted to three able and thoughtful anonymous reviewers for deep insight and contributions to the clarity of this text.
Author contribution
Conceptualization, C.B., D.G., E.M., G.M.; Data curation, C.B., D.G., M.H.; Formal analysis, C.B., D.G., M.H., E.M., G.M.; Methodology, C.B., D.G., E.M., G.M.; Supervision, D.G., E.M., G.M.; Writing—original draft, C.B., D.G., M. H., E.M., G.M.; Writing—review and editing, C.B., D.G., M.H., E.M., G.M.
Competing interest
The authors declare none.
Data availability statement
The data that support the findings of this study are available from the United National Statistics Division (unstats.un.org/unsd/energystats/data/). Restrictions apply to the availability of these data and we suggest to reach out to this Division for the underlying energy statistics data (energy_stat@un.org). All R scripts used to develop this analysis are available upon request. Please direct these requests to either Connor Briggs or Dennis Gilfillan.
Funding statement
This research did not receive any specific grant from funding agencies in the public, commercial, or not-for-profit sectors.


 Open access