


Introduction
There are opportunities for farmers to meet demand for local and regional foods in intermediated market channels and increase farm profitability by entering new markets for sales of frozen value-added products. In particular, farmers could capitalize on opportunities provided by investments in regional food processing facilities by freezing produce for retail sales in winter, when supplies of fresh local food in the northern USA are low, and consumer demand is left unfilled. Like many new marketing opportunities, however, farmers have not had access to information they need to determine whether the retail market for value-added frozen produce might be profitable for their farm operation and are often unaware of critical food safety regulations and quality best practices for frozen products that impact production costs and profitability.
Research that illuminates direct-marketing opportunities for farmers has flourished in the last three decades, but information regarding intermediated regional supply chains has been less available (Ruhf and Clancy, Reference Ruhf and Clancy2022). At the same time, recent events such as the COVID pandemic (Ali et al., Reference Ali, Suleiman, Khalid, Tan, Tseng and Kumar2021), extreme weather (Bullock et al., Reference Bullock, Dhanjal-Adams, Milne, Oliver, Todman, Whitmore and Pywell2017) and geo-political (Ben Hassen and El Bilali, Reference Ben Hassen and El Bilali2022) events have disrupted global supply chains, leading to calls for more regional food systems infrastructure that could improve resilience (Lengnick et al., Reference Lengnick, Miller and Marten2015; Ruhf and Clancy, Reference Ruhf and Clancy2022). While a systems-perspective suggests that regional food system stability benefits when enough farmers enter regional value-added supply chains, individual farmers, reasonably, may not be inclined to shoulder the risk of these unproven markets on their own. Similarly, regional food businesses looking to rebuild regional-scale infrastructure and provide facilities that farmers can access presents its own risks, with large capital outlays and a lack of workforce knowledge required for success.
This study provides additional insights on the profitability of frozen produce for farmers and food businesses and provides guidance for regional food business centers and regional food businesses to determine whether to invest in regional-scale infrastructure to support frozen food markets.
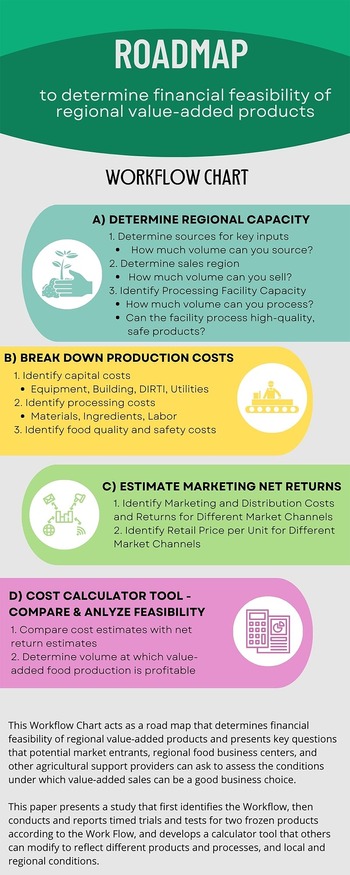
First, we provide an analysis of costs and returns from a series of timed frozen blueberry and spinach production trials, providing a calculator that can be modified to incorporate different contexts. Next, we compare the financial feasibility of two different processing options (hiring a shared-use facility to co-pack frozen product vs investing in frozen processing infrastructure) and two different sales options (selling direct to consumers at a farm stand vs selling through a traditional retail distribution channel). Cost and returns estimates for two regional frozen products are obtained from a series of timed trials conducted at a state-of-the-art regional scale FPF in the Northeast. Our estimates necessarily reflect conditions specific to the time and place in which the study was conducted. We encourage potential market entrants and advisers to fully consider how regional market conditions vary from those estimated below. To assist with these considerations, we provide two tools. Figure 1 lays out the key questions we address in this study and detailed steps that can be taken to assess conditions in other contexts. Supplementary Materials include the ‘Frozen Regional Produce Feasibility Workbook’, a Microsoft Excel-based Workbook that can be modified to reflect different value-added horticultural products, methods, capital and processing options and returns scenarios. We note that additional research using these methods and tools in different locations and under different assumptions will provide more precise estimates and will further reduce market entrant risks.

Figure 1. Roadmap to determine financial feasibility of regional value-added products.
The rest of this paper is divided into five sections. The section ‘Background and literature review’ introduces the motivation and methodology employed to assess financial feasibility. The section ‘Production costs and returns assessment’ details the treatments used to estimate processing costs, gather capital and distribution costs and model returns. The section ‘Financial feasibility of frozen different scenarios’ investigates the economies of scale, costs and returns depending on different processing and sales options. In the last section, ‘Discussion, conclusions and policy considerations’, we discuss implications for individual farm operations, entities that are considering infrastructure investments to support regional value-added food markets and agencies and funders that seek to support regional-scale value-added food systems.
Background and literature review
Food systems infrastructure
Investments in regional food systems infrastructure could support ‘local food’ systems to expand to a regional scale (Hinrichs, Reference Hinrichs2013; Hardesty et al., Reference Hardesty, Feenstra, Visher, Lerman, Thilmany-McFadden, Bauman and Rainbolt2014; McLaughlin et al., Reference McLaughlin, Hardesty, Francis, Flora, Flora and Lynch2014; Fleury et al., Reference Fleury, Lev, Brives, Chazoule and Désolé2016; Ruhf and Clancy, Reference Ruhf and Clancy2022), allowing farmers to meet consumer demand (Low et al., Reference Low, Bass, Thilmany and Castillo2021) and provide more resilient food supply chains (Lengnick et al., Reference Lengnick, Miller and Marten2015; Ruhf and Clancy, Reference Ruhf and Clancy2022). One approach to expanding food systems is for regional stakeholders to invest in food processing facilities that support regional markets for value-added products. The long-running USDA Value Added Producer Grant program provides farm-level financial assistance for agricultural producers to enter into value-added activities related to processing and/or marketing of value-added products, allowing recipient businesses to reduce the risk of failing and to provide more jobs than comparable businesses that do not receive the support (Rupasingha et al., Reference Rupasingha, Pender and Wiggins2018). More recent federal investments in regional food businesses aim to scale up support for infrastructure too big for individual producers. In 2021, USDA announced an investment of $500 million for local and regional meat processors to rebuild capacity, make food systems more resilient to shocks and deliver greater value to growers and workers (USDA, 2021). In 2022, USDA announced a new $400 million program to provide essential local and regional food systems coordination, technical assistance and capacity building services ‘to help farmers, ranchers, and other food businesses access new markets and navigate federal, state and local resources, thereby closing the gaps or barriers to success … [and] assist small and mid-sized producers and food and farm businesses with the goal of creating a more resilient, diverse, and competitive food system’ (USDA, 2022). Investments in regional food processing facilities can provide individual farmers access to costly equipment and food processing expertise, allowing them to enter markets for value-added products while reducing the risk of investing in equipment and navigating food regulations and quality challenges alone (McLaughlin et al., Reference McLaughlin, Hardesty, Francis, Flora, Flora and Lynch2014).
Federal programs could help counteract the trend in food systems toward fewer, larger farms and firms in supply chains with fewer up and downstream sellers and buyers. In the Northeast food manufacturing sector, food processing firms declined 60% between 1954 and 1981 (Blair, 1991 in Ruhf and Clancy Reference Ruhf and Clancy2022). Consolidation and concentration in food supply chains can provide economies of scale that can serve to reduce overall production costs and provide more affordable products for consumers (MacDonald, Reference MacDonald2017), but recent events suggest that the costs savings from eliminating supply chain redundancies may have unintended consequences for food system resiliency (Ruhf and Clancy, Reference Ruhf and Clancy2022). In addition to the loss of physical infrastructure, consolidation and concentration trends have contributed to a loss of localized workforce skills required to successfully bring safe, high-quality products to market in a cost-effective way (Danovich, Reference Danovich2016; Forgrieve, Reference Forgrieve2019). When there are few facilities, the loss of one facility to even a temporary shut-down can have ripple effects throughout the entire supply chain.
A more recent trend toward shared-use kitchen facilities and food incubator programs has helped to somewhat offset the effects of consolidation and concentration. Shared-use facilities allow hourly use or the ability to hire trained staff to co-pack a product, for an hourly fee or base rate (Econsult, 2016). The facilities provide building, equipment, often product development consultation, food safety training and other services to farmers or food businesses (Myran, Reference Myran2018).
Produce grown by small- and medium-sized farms can become key ingredients in value-added and specialty foods, such as shelf-stable and frozen foods made from fruits, vegetables, grains and nuts (Feenstra et al., Reference Feenstra, Hardesty, Lev, Houston, King and Joannides2019). In 2018, Feenstra et al. surveyed 240 specialty food manufacturers (SFM) and conducted 60 in-depth interviews with manufacturers and farmers in California, Minnesota, Wisconsin, Washington and Oregon to investigate the benefits, barriers and challenges for small- and medium-sized farmers who want to sell products to SFMs. They found that supplying produce for these markets could be an ‘important complement to a farm's existing markets, and may be more stable and predictable than direct-to-consumer sales’ (Feenstra et al., Reference Feenstra, Hardesty, Lev, Houston, King and Joannides2019). In 2013, Pansing et al. investigated the potential for sustainable economic development in the food sector, and identified regional scale processing as a key leverage point with high potential for economic returns and job creation (Reference Pansing, Wasserman, Fisk, Muldoon, Benjamin and Kiraly2013).
High-quality, safe frozen produce
Food safety and quality are two critical concerns in value-added markets (Grover et al., Reference Grover, Chopra and Mosher2016; Barone et al., Reference Barone, DiCaprio and Snyder2020). Forty-six percent of foodborne illness outbreaks are attributed to fresh and minimally processed produce, and the Center for Disease Control reports about 20 recalls for frozen produce each year (Disease Control, 2020). Identifying and managing the controls necessary to produce safe, frozen foods is critically important, and incidence of food recalls and illness outbreak is significantly reduced when researchers provide food safety resources and technical tools to processors (USDA, 2020; Disease Control, 2020). Frozen produce falls within the Preventive Controls for Human Food (PCHF) regulation (FDA n.d.), a relatively new rule under the Food Safety Modernization Act (FSMA), which was implemented to proactively reduce the incidence of foodborne outbreaks by increasing food safety management. The expense and expertise associated with ensuring that processed products are safe, high-quality and maintain a reasonable shelf-life can be high, particularly for a small- or medium-scale operation (Ribera et al., Reference Ribera, Palma, Paggi, Knutson, Masabni and Anciso2012; Overdiep and Shaw, Reference Overdiep and Shaw2019). Even when small- and medium-sized facilities are exempt from the most costly PCHF regulations, downstream distributors and retailers increasingly require additional food safety and quality controls from their suppliers to reduce their own liability (Henson and Reardon, Reference Henson and Reardon2005).
In addition to maintaining process controls for food safety, optimized process conditions yield the best quality. While frozen produce helps to provide convenience and access to produce all year round, the freezing process and storage conditions can have deleterious effects on the product quality, such as in textural changes and water weeping (Ferreira et al., Reference Ferreira, Canet, Alvarez and Tortosa2006; Mazzeo et al., Reference Mazzeo, Paciulli, Chiavaro, Visconti, Fogliano, Ganino and Pellegrini2015; Paciulli et al., Reference Paciulli, Ganino, Pellegrini, Rinaldi, Zaupa, Fabbri and Chiavaro2015). Temperature conditions need to be determined within the mid-scale operational capacity of the facility to maximize product quality and minimize operational costs.
Regional capacity for retail frozen produce
This study is conducted with one fruit and one vegetable product. We chose these two products for several reasons. First, we conducted a focus group and survey of regional farmers to evaluate their interest in this market, including what products they grew and would be interested in freezing for retail markets. Second, we evaluated regional supply of the products to determine if sufficient quantity is grown to justify investment in regional-scale processing infrastructure. Third, we reviewed market research to identify consumer demand and market potential for frozen produce. Fourth, we considered the opportunities and limitations of the processing line that was available for our research. Overall, we decided to conduct trials using one product likely to be profitable (blueberries) and one product we were unsure would be profitable (spinach) at the regional scale.
Potential supply and demand
The market for local and regional food in the Northeast USA is significant. In 2015, 30,297 farms in the Northeast sold $1.9 billion of locally branded products in the Northeast, and 167,009 farms sold $8.7 billion such products nationwide (USDA Economic Research Service, 2015). Twenty farmers gathered in March 2015 to discuss the potential to freeze freshly harvested produce for winter retail sales, including why so few took advantage of value-added production and marketing opportunities. Farmers responded that farm operations that produced scale-appropriate volumes of produce for regional retail frozen processing were too small to individually conduct market research needed to assess the key components of profitability in this market. That focus group identified knowledge barriers preventing them from assessing profitability. In October 2016, we surveyed Northeast farmers (n = 183; 23% response rate), confirming focus group results. We found that 63% of the respondents were interested in entering this market but needed more information. Sixty-three percent required information about processing/production costs, 57% were concerned about food safety/quality assurances and 49% required more information about packaging/marketing. Medium-sized farmers comprised 17% of responses (compared to 13% regionally). In our survey, 50% of farmers grew either/both blueberries/spinach. Of the 69% who indicated interest in frozen retail sales, 65% grew either/both products.
Blueberries and spinach grow well in the Northeast. In 2012, 275 operations harvested 556 acres of spinach, and yield in the Northeast is about 7000 lbs/acre, totaling 3,892,000 lbs. In 2012, 2593 operations harvested 21,594 acres of blueberries, and yield in the Northeast is about 4500 lbs/acre totaling 97,173,000 lbs (USDA, 2017). Frozen blueberries/spinach are leaders in frozen fruits/vegetables retail sales. Market researcher Mintel reports that blueberries are the leading product in the frozen fruit category (Bloom, Reference Bloom2014). The Institute of Food Technologists similarly found that frozen produce was among the top ten food trends (Sloan, Reference Sloan2015). To check these national trends against regional trends, we interviewed three regional retailers, and found that about one-third of frozen fruit products stocked are frozen blueberries, and that about 50% of frozen sales was generated by frozen blueberries alone. Spinach was the third highest vegetable in sales generated, ranking below peas and corn.
Processing facility capacity
The food processing facility (FPF) used in this study has the most robust processing capacity that was available for this research in the Northeast, but there are still gaps in their processing line that limited the crops that we could trial. Top selling frozen vegetables, such as peas, corn and green beans (Sloan, Reference Sloan2015), all require significant pre-freezing product preparation. Preparation can include expensive labor and/or equipment to shell/strip kernels/snip ends. Recently blights in the Northeast have made broccoli unreliable. Spinach requires only thorough washing, chopping and blanching. Other top selling frozen fruits have high spoilage rates (raspberries) and/or high labor costs (topping strawberries). Stone fruits require peeling, de-stoning and treatments for browning.
The potential for regional scale value-added food production is high, yet there is no guarantee that public and private investments will necessarily result in a more resilient food system, much less one that provides a stable, profitable return to farmers (Dimitri and Gardner, Reference Dimitri and Gardner2019). Potential market entrants, both farmers and regional food businesses, are understandably concerned that they do not have sufficient information to risk entering this market. This study provides information and tools that can be used to help possible market entrants make informed decisions (Cavigelli et al., Reference Cavigelli, Hima, Hanson, Teasdale, Conklin and Lu2009; Angioloni et al., Reference Angioloni, Kostandini, Alali and O’Bryan2016; Gaskin et al., Reference Gaskin, Cabrera, Kissel and Hitchcock2020).
Production costs and returns assessment
To investigate the financial feasibility of frozen regional produce, we drew from four sources. The first source, in-depth financial analysis of a well-established, non-profit, regional shared-use FPF in New England (Western Massachusetts Food Processing Center at the Franklin County Community Development Corp. in Greenfield, Massachusetts), provided information about fixed capital costs for building and maintaining a regional-scale facility with capacity to produce sufficient volumes of high-quality, safe frozen products. The second source, a series of timed freezing trials, provided variable processing costs under different processing specifications. The third source, field research to determine distribution costs and baseline per unit returns, provided information about post-processing net revenues. The fourth source, published market research, provided parameters for price premiums for local and regional value-added food.
In this section, we first discuss the methodologies used to estimate capital and processing costs. We then apply these methodologies to our two products and estimate costs per pound for blueberries and spinach. Costs differ for the two products in the equipment used and the labor costs associated with preparation, cleaning and packaging. We consider the costs from the perspective of a daily usage rate, as well as the cost of establishing a new facility from scratch. We summarize the fixed, variable and total costs per pound for each of the two products. Last, we consider the returns associated with different methods of selling the product, namely through a farm-stand or through a retailer.
Capital costs methodology
We estimated capital costs, i.e., building and equipment costs, associated with the FPF through a review of financial documents, interviews, and field research to determine current market prices for less common items. The costs of capital items are generally determined as the sum of depreciation, interest, repairs and maintenance, taxes and insurance (DIRTI).
FPFs may perform many different tasks, including procuring raw product from farmers, arranging proper cold chain product storage, transportation and receiving; packaging, labeling, pricing and storing frozen product; and arranging sales to product buyers. We worked with a shared-use commercial kitchen and certified FPF that provides space and expertise to food businesses and farms to start and grow their businesses. This facility is one of the first in the country to adopt a commercial-quality frozen processing line of the three facilities. The FPF is at the vanguard of the movement to invest in local food systems infrastructure, and provided procurement, processing, storage, distribution and marketing data for our analysis.
Equipment
• Depreciation for the building and equipment used in processing blueberries and spinach was determined following a straight-line approach. For each capital item, we used the current value, useful life and salvage value to estimate daily depreciation costs. Current values were taken from FPF records and field research. We determined salvage values by reviewing prices of various used items offered for sale online. Useful lives are based on product specifications.
• Interest is either the interest paid on a loan or an opportunity cost for a capital item that was purchased outright (no loan). We used small business loan interest rates for capital items. (see Appendix A for small business loan details).
• Repairs and maintenance were determined from FPF records on monthly expenditures for repairs and maintenance of all building and equipment. We estimated an aggregate daily value for repairs and maintenance assuming 20 business days per month.
Building
• Property taxes are not charged to a non-profit like the FPF. For-profit ventures, however, would be subject to property taxes.Footnote 1
• Insurance costs are estimated from an aggregate daily cost of insurance based on monthly payments and assuming 20 business days per month.
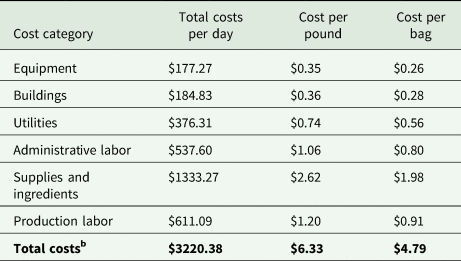
We estimate the capital costs of freezing blueberries and spinach for one production day based on rent charged for the FPF by the parent non-profit, which owns the building. That rental value covers the daily cost of using the facility. We assume that a full day is required for freezing either blueberries or spinach. Interest reflects an opportunity cost for the assessed value of building. Repairs and maintenance are from reported expenses. Taxes are not charged, as the non-profit does not pay taxes. Insurance expenses are those reported for the FPF. We add depreciation and opportunity costs for the equipment used for processing (freezing) the blueberries and spinach. Daily costs of capital are annual costs using an average of 20 business days per month. Building costs for the FPF, including rent, maintenance and repairs, and insurance are $184.83 per day (Table 1).
Table 1. Building costs

a Based on FPF records.
b Items in bold represent category totals.
We also develop a second set of capital cost estimates to consider the possibility of beginning a new facility from scratch. We assume the entity is a for-profit firm that secures a loan for the value of the required building and equipment. All five DIRTI components discussed above are included in this estimate for the building and equipment used in freezing blueberries and spinach. Again, daily costs of capital are calculated assuming 20 business days per month.
An individual quick-frozen (IQF) machine and liquid nitrogen are used in freezing the products. The IQF is a capital item as is the liquid nitrogen tank. Liquid nitrogen tanks can be rented from a company and that rental value is assumed to represent the appropriate DIRTI costs associated with ownership. The rental costs for the liquid nitrogen tank may over-estimate the costs because the firm renting the tank likely includes some profit within the monthly rental rate.
DIRTI capital costs for freezing
The assessed value of the FPF is $759,402 and a salvage value for the building is assumed to be $200,000. (This may be conservative as no real estate appreciation is assumed.) Straight-line depreciation is determined based on a 30-year life. Interest is determined based on an annual interest rate of 6% and the current assessed value of the building of $759,402. Repairs and maintenance are based on FPF records and are identical to the costs assumed above in Table 1. We calculate taxes based on the assessed value and the local property tax rate. Insurance is based on FPF records and is also identical to the value used above. The total costs for the building are allocated based on an average of 20 business days per month. The building is used throughout the year, so the daily rate is not based on only the number of days used for freezing fresh produce. Total daily costs to a private for-profit firm to own and use a building of equal assessed value are $439.80 (Table 2).
Table 2. Estimated freezing costs for a firm owning a facility like the FPF

a Interest on the building is based on a 30-year mortgage at an interest rate of 6\%.
b Building maintenance and repairs based on FPF records.
c Taxes based on the FPF assessed value and the Greenfield, MA, 2019 tax rate of \$22.36 per \$1000.
d Insurance based on FPF records.
e Items in bold represent category totals.
Importantly, these two cost estimates represent the costs of using the FPF and its equipment (or an identical privately owned facility) to freeze blueberries for one full day. These costs will be the same regardless of the amount of blueberries frozen. It is assumed that retail bags will be the final product and equipment is included for freezing blueberries and sealing them in plastic bags. Processing for wholesale would not require the ‘check weight filler’ or the ‘band sealer’ equipment included above—a reduction in costs by more than $20 per day. The label printer for printing bag labels would also not be required reducing the equipment costs slightly.
Utilities
We base utility costs on data from the FPF on expenditures for utilities such as water, electricity, natural gas, water/sewer, laundry service, pest control and other necessary monthly expenditures like rental costs for the liquid nitrogen tank. While the tank could be a capital investment, the FPF chose a rental contract with the firm that provides liquid nitrogen. These inputs are necessary expenses for the FPF and are combined as a part of the fixed costs of processing. Daily costs for these utilities are calculated from the monthly expenditures for utilities and are based on 20 business days per month. These costs are paid monthly and while they may vary based on the amount of produce frozen (e.g., water, sewer, electricity), the amounts of these utilities are not easily measured based on amount or type of product frozen. Thus, these expenses are based on FPF records and are used to estimate costs for one day using the facility to freeze blueberries. These are necessary overhead expenses and many are unavoidable (e.g., liquid nitrogen tank rental) due to contracts, implying they should be included in the fixed costs of freezing. Table 3 shows the daily costs of utilities for freezing blueberries including rental of the liquid nitrogen tank rental, water/sewer, electricity, natural gas and other necessary monthly expenses. Daily costs are based on 20 business days per month. Total utility costs are $376.31 per day for freezing blueberries at the FPF. Energy (gas and electricity) represents over 46% of utility expenses for freezing. Rental of the liquid nitrogen tank adds an additional 15% of a day's utility expenses. We use the same daily cost estimates for spinach.
Table 3. Estimated daily utility costs for freezing at the FPF

a Items in bold represent category totals.
Processing costs methodology
We estimated processing costs for frozen blueberries and spinach through iterative operational cost analysis (Browning and Eppinger, Reference Browning and Eppinger2002) over a series of five (three for blueberries, two for spinach) at-scale freezing trials. We purchase inputs (raw local blueberries and spinach, packaging, labor) and process at-scale quantities of safe, high-quality frozen retail products at the FPF. We closely monitor and time processing activities using five researchers with stopwatches, and map processing activity using Gantt charts. We weigh-in raw product and weigh-out both compost/waste and final product, and track use of all relevant inputs. We assess costs of each processing stage independently so facilities with different production capacities can swap out stages and independently assess their own costs, as needed. The primary focus in estimating costs of freezing during each trial was on the number of workers, time and equipment needed for each of the tasks required to receive, process and pack the raw product. Based on the estimated capital costs (above), imputed capital (building and equipment) and utilities costs were added, as well as the materials and supplies needed specific to the product produced (raw produce input, bags, labels, boxes, etc.). For both blueberries and spinach, our focus was on determining the costs of processing for retail-pack sales.
Supplies: materials and ingredients
This category of costs is variable and depends upon the amount of product that is processed. These costs include the raw vegetable or fruit to be processed and supplies or materials needed to freeze the raw product, including food safety supplies like hair nets, masks and gloves and packaging supplies like bags, boxes and labels. Liquid nitrogen used to freeze the product can be measured after each day of processing and can be easily assigned to the product. Liquid nitrogen used per pound of product processed is calculated and included in the supplies for processing. We estimated that the liquid nitrogen costs are approximately $0.132 per pound of processed product based on tank measurements before and after freezing products. This estimate reflects liquid nitrogen ‘start-up’ costs of cooling the IQF; greater amounts of product frozen during a run will reduce the cost per pound.
Labor
Labor costs for processing are straightforward—they are the aggregate of payments to staff that worked to freeze the blueberries and spinach. The time worked for each individual multiplied by their wage is aggregated. Additional labor costs are charged for management and administration. The FPF processing methods may differ from other processing methods. To allow other individuals or firms to compare their costs of freezing, time spent on each task in the FPF process was collected by observation for each worker. The time-tracking tools used during observation are shown in Tables B1 and B2 in Appendix B. The time-tracking tools show the same basic processes with a few additional steps for spinach processing, as spinach requires the additional steps of blanching, cooling and forming into patties. Initial trials with spinach showed that placing the blanched and cooled spinach on the IQF belt resulted in low yields, less than 50%, and much longer cleaning time for the IQF after processing. The decision was made to create spinach patties that were placed on the IQF belt increasing yield by 25% (to 75%) and reducing cleaning time for the IQF following freezing (see Appendix A. for time-tracking sheets used in data collection.)
Cost estimates for blueberries and spinach
Capital costs
Estimated capital costs for one day of freezing blueberries are shown in Table 4 and for spinach in Table 5. Equipment costs are based on depreciation, opportunity costs (assuming an investment of the asset values shown) and repairs and maintenance. Taxes and insurance are not charged on specific equipment items. Annual depreciation costs are converted to a daily value using the estimated number of days equipment is used in a typical year. The IQF and associated equipment are used 52 days in a typical year. Opportunity costs are calculated using an annual interest rate of 6%. We allocate the annual opportunity costs assuming 20 business days per month. Monthly repairs and maintenance based on FPF records are also allocated assuming 20 business days per month. Total equipment costs for a day of freezing blueberries at the FPF are estimated to be $177.27.
Table 4. Estimated daily capital costs for freezing blueberries at the FPF

a Weighted sum of all equipment values and straight-line depreciation where weights are the number of items.
b Items in bold represent category totals.
c Opportunity costs based on a 6\% rate of return.
d Maintenance and repair and insurance are based on FPF records.
Table 5. Estimated daily capital costs for freezing spinach at the WMFPC

a Weighted sum of all equipment values and straight-line depreciation where weights are the number of items.
b Opportunity costs based on a 6% rate of return.
c Maintenance and repair and insurance are based on WMFPC records.
d Items in bold represent category totals.
Capital costs for freezing spinach at the FPF are very similar to the capital costs for freezing blueberries. There is one important difference; the nature of the vegetable makes it impossible to use the FPF ‘vibratory filler’ machinery to fill retail bags with the spinach. Spinach also requires blanching prior to chilling using the dunk tank and freezing. Daily cost for equipment needed to freeze spinach is less than the costs for blueberries because the check-weight filler was not used. But the need to hand pack the retail bags of spinach results in higher labor costs.
Equipment must be housed somewhere and those costs must be included. The FPF pays monthly rent to the venture center. Rather than depreciation and interest costs, the rent paid ($1666.67 per month) is included. Insurance costs are also added as well as repairs and maintenance to the building based on the FPF records. As a non-profit, the FPF does not pay taxes. As shown in Table 2, total FPF building costs are $3696.68 per month, or $184.83 per day. Adding building costs and equipment costs, the total costs charged by the FPF for a day of freezing fresh produce is $362.10. This represents the costs to the FPF for one day of freezing blueberries at their facility.
Supplies: materials and ingredients
The costs of supplies and ingredients are variable costs that depend upon the type and amount of blueberries that are frozen. Supplies and ingredient costs, including the raw produce, are calculated from the quantity used and per unit costs of supplies used. In addition to the raw produce, inputs such as bags, boxes, hair nets, labels, sanitizing products and other materials are included. Liquid nitrogen is included in material cost; the tank used to store the liquid nitrogen is included under capital costs. To determine the amount and costs of liquid nitrogen, tank measurements were used to calculate the volume. The price per gallon of liquid nitrogen was used to estimate the costs and a cost per pound of blueberries/spinach frozen was determined. The cost of liquid nitrogen per pound of blueberries/spinach frozen can be used to estimate liquid nitrogen costs for alternative levels of production. Greater amounts produced would result in lower per pound costs because of the liquid nitrogen required to cool the IQF before starting to process.
As an example, consider a batch of 500 pounds of blueberries frozen and packaged in 12-ounce plastic retail bags. Bags were packed in boxes (12 bags per box) for storage. Liquid nitrogen cost was 13.2 cents per pound frozen. The costs of supplies and ingredients are shown in Table 6. The cost of the raw blueberries is about half of total supplies and ingredient costs.
Table 6. Supplies and ingredients for freezing blueberries at the WMFPCa

a These estimates are for freezing 508 pounds of blueberries.
b Items in bold represent category totals.
For this research trial, we processed batch sizes of 500 pounds of spinach. Supply costs for freezing spinach are shown in Table 7.
Table 7. Costs of materials/supplies and ingredients for freezing spinach

a Items in bold represent category totals.
Labor
The labor required differs depending upon the process followed to freeze the raw product and the amount of raw product delivered for freezing. Labor inputs for each part of the FPF process for freezing blueberries are shown in Table 8 and for spinach in Table 9. The labor costs shown below are for packaging a total of 500 pounds of blueberries in 12-ounce plastic retail bags and 500 lbs of spinach in 16-ounce plastic bags.
Table 8. Labor input and costs for freezing blueberries at the WMFPC

a An average wage rate of $17.23/h was assumed.
b Items in bold represent category totals.
Table 9. Labor input and cost for freezing spinach

a A wage rate of $17.23/h is assumed.
b Items in bold represent category totals.
The spinach was blanched, chilled, spun, then formed into patties (about the size of a hockey puck). The spinach patties were then frozen and hand packaged in retail bags (16 ounces each). The tasks of patty-making and packaging (bag, seal, box) represent 43% of the labor input. The patty-making, a time-consuming process, was in response to poor yields (less than 50%) when trying to freeze loose spinach and the time required to clean the IQF after freezing. Small bits of loose spinach were embedded in the IQF belt requiring a lot of tedious labor to clean the belt. The patties created much less mess in the IQF and also led to smooth and rapid IQF input. Freezing the patties resulted in substantial improvements in both yield and cleaning time but did add labor for forming the patties.
The costs cover all labor required, from receipt of the raw product to final clean-up at the end of the day. Developing a cost per pound of final product (or a cost per bag) depends also on the yield, the final product weight divided by the raw product weight. The yield for freezing blueberries was very high at 99%. The yield for spinach was lower at 75%.
Data on labor input by task were gathered by observation. A team of five observers recorded start and end times for each task, by individual worker. To ensure coverage, team member assignments overlapped so that each of the worker's times were recorded by at least two team members. The amount of time individuals spent working on each task was determined; starting and stopping times were recorded and the difference calculated. Times on task were then aggregated to determine total labor required to process the raw blueberries. While individuals earned different wages due to experience, an average wage rate of $17.23/h was used in calculating the labor costs for each task and the total labor costs.
The greatest amount of labor for freezing blueberries was for packaging into the plastic retail bags. The task required weighing the frozen product into the bags, sealing the bags and packing them into boxes. For blueberries, a ‘vibratory filler’ machine was used to speed the process. The time required for packaging also affected the IQF time because the blueberries could not be left sitting very long before packaging. The packaged blueberries were immediately boxed and placed in a freezer. Total time and costs for the IQF and packaging portions of the process represented about 45% of all labor. General clean-up throughout the process and the final clean-up represented about 19% of all labor input. Fringe benefits are included as 40% of wages.
Spinach patty-making and packaging represent 43% of total labor. Clean-up throughout the process and final clean-up represented about 20% of labor, not substantially different from the clean-up for freezing blueberries, though total labor for spinach is higher.
Additional administrative labor costs are also added (Table 10). These costs represent administrative and management costs for the FPF and fringe benefits for those staff. This labor provides a wide range of services, like business development (contacts and contracts with buyers and sellers, as discussed in Appendix D), financial management and directing the FPF operations. These are costs specific to the FPF. While a for-profit firm would also have administrative costs, they may be very different and there may be cost savings in freezing blueberries. Combining the administrative labor costs ($537.60) and production labor costs results in a total labor bill of $1292.44 for blueberries and $1603.39 for spinach.
Table 10. Administrative daily labor costs for the WMFPC

a Items in bold represent category totals.
Summary: freezing costs
Table 11 combines the freezing costs for blueberries and Table 12 for spinach. The costs are for one day of processing the fresh produce into retail bags (12-ounce for blueberry and 16-ounce for spinach) and one day's use of the FPF. Capital costs include building, equipment, utilities, supplies and labor used to receive the product, prepare for freezing, freezing, packaging and cold storage of the bags in boxes. Also included are labor for clean-up and administration of the FPF. The greatest costs of frozen blueberries are the supplies and ingredients, and this cost is primarily the fresh blueberries. The price paid for blueberries for this research trial was $2.30 per pound and $3.40 per pound for spinach purchased (given the yield of 75%, the effect of cost of the spinach is $4.53 per pound of final product). Production labor adds about $1.20 per pound to the costs of freezing blueberries and $2.84 per pound for spinach. Administrative labor adds $1.06 per pound. Total processing costs per pound are estimated to be $6.32 for blueberries and $11.06 per pound for spinach. Adding additional capital costs brings total freezing costs for blueberries to and for spinach to $11.74 per pound. Costs would differ if a for-profit firm were to charge the full costs of depreciation, interest and taxes.
Table 11. Summary of blueberry freezing costsa
a Freezing 508.4 pounds of blueberries, packaged in 12-ounce plastic bags and one day's use of the WMFPC.
b Items in bold represent category totals.
Table 12. Summary of spinach freezing costsa

a Freezing 500 pounds of fresh spinach in 16 ounce plastic bags, and one day's use of the WMFPC.
b The yield was 75%—500 pounds of fresh spinach yielded 375 bags (16 ounces) of frozen spinach.
c Items in bold represent category totals.
Returns and sales price
Distribution costs and returns field research
We interviewed two regional food distributors, three regional retail store managers and three farmers to identify the costs associated with retail sales under two different scenarios—selling through an established retailer or selling at a farm stand. Our interview questions included distribution, promotion, stocking, farm stand equipment and operating expenses and mark-up fees.
To sell to a retailer, farmers would need to invest in annual fixed costs. Fixed costs include marketing expenses of about $2500 per year to develop and maintain a label and brand identity. Distributors and retailers generally each require an annual slotting fee to guarantee freezer space for a product. Slotting fees are generally offered for a portfolio of products and run about $10,000 per year for a portfolio of five products per distributor and retailer. To obtain exposure to a distributor, food entrepreneurs generally attend at least one trade show per year, at a cost of about $2500.
Variable costs for selling frozen product through a retailer come in the form of per unit mark-ups. A distributor will generally add a mark-up on frozen items at a rate of 25%. A retailer will generally add a 40% price mark-up between the price paid per unit for the product and the retail price. These costs reflect the high costs of maintaining frozen casing at a retail outlet, which has high utility costs and high opportunity costs for retailers. We do note, however, that two of the interviewed retailers were food cooperatives that had frozen regional products stocked. These cooperatives had waived stocking fees and had significantly reduced mark-up in some cases.
To sell through a farm stand, the farm stand will incur fixed costs. Fixed costs include a freezer case, at a cost of about $5000 per case, must pay the mortgage on the farm stand in which the case is located, which we estimate at $300 per month. Variable costs for farm stand sales will generally include staff, utilities and other overhead, frozen storage, and cost of delivery between the farm and the processor (both ways).
To determine baseline prices for frozen products, researchers collected blueberry and spinach product data from 27 regional stores. Data included store type, whether the product was organic, whether the product had origin information such as local or regional branding, unit price, package unit size, product placement, package design and for spinach, whether the product was loose or formed into cakes. We analyzed these data to determine the most common unit sizes and packaging available to consumers, and to determine a baseline price for comparable commercially available products. The base retail price for blueberries was $2.50 for blueberries and $1.68 for spinach per 12 ounce bag.
Premiums for local and regional value-added produce
In this paper, we identify potential premiums that farmers and food businesses could add to FP from published literature on consumer demand for local and regional food products. Two recent meta-analyses of local food premiums identified that origin-identified labels such as ‘local’ or ‘regional’ command a premium between 27 and 30% (Printezis, Grebitus, and Hirsch, Reference Printezis, Grebitus and Hirsch2019; Li and Kallas, Reference Li and Kallas2021). Fewer studies address value-added local food products, but those that do generally find that premiums vary more widely than for fresh products. Hu et al. (Reference Hu, Woods and Bastin2009) estimate premiums for five value-added blueberry products with consumers in Kentucky. They find that premiums for the ‘Kentucky grown’ label vary significantly depending on the product. Pure blueberry jam, for example, has no statistically significant premium, blueberry raisinettes have an 18% premium and blueberry fruit rollups have a premium of 200%. Rihn and Yue (Reference Rihn and Yue2016) found that ‘Minnesota grown’ labeled apple juice commanded a premium of between 4 and 18%, depending on the experimental method used to elicit premiums. We note that many of these studies are conducted with representative samples of general populations. Local markets can vary greatly, and farmers at farm stands are generally able to accurately price products to meet their customer base. We offer the range of 27–30% as a guideline for premiums, but encourage potential market entrants to consider their own market conditions.
Financial feasibility of frozen produce in different scenarios
We consider two different processing options and two different retailing options, resulting in four separate scenarios. We use the Frozen Regional Produce Feasibility Workbook provided in Supplementary Materials to estimate the trade-offs between the processing and retailing options. The tool can be modified to reflect different regional contexts: the example we use below is based on the context of the Northeast USA.
Shared-used vs on-farm processing
The first set of options a farmer or food business faces is between investing in an on-farm frozen production line or using a shared-use processing facility. From a feasibility viewpoint, this is a matter of scale. The capital costs of establishing a high-quality, safe IQF production line are very high, and it is unlikely that a small- or medium-sized farm operation could produce enough raw produce to justify the expense. For example, for blueberries, if a farmer freezes 6000 pounds, it would cost about $1.74 per 12 ounce retail bag to co-pack at an FPF under the above assumptions, but it would cost $5.29 if the farmer built out their own facility. On the other hand, at a volume of 20,000 pounds of blueberries, it would cost about $3.08 per 12 ounce retail bag to co-pack at an FPF under the above assumptions, but it would cost $2.21 if the farmer built out their own facility.
Retail vs on-farm sales
In our methodology, we consider two options for farmer sales—at a farm stand or through a retailer. While it is possible for a farmer to sell directly at a farmers market, the degradation of product quality would likely be substantial. Community supported agriculture sales at a farm stand could be easily substituted for retail sales in our calculator by re-configuring labor costs. We do not consider wholesale sales in this paper. In our analysis, returns are somewhat comparable between the two marketing options. In the case above for a production of 6000 pounds, we estimate that it would cost about $1.52 per unit to sell through a retailer, and about $1.36 to sell at a farm stand.
For blueberries, our model indicates that a farmer that co-packs with an FPF to freeze 6000 pounds and sells at a farm stand will realize a net profit of about $8,300, while selling through a retailer will realize a net profit of about $2000. It is never profitable for a farmer at this scale to invest in on-farm processing. In that case, profits would be −$19,700 if sold on-farm, and −$26,200 sold at a retailer. The threshold volume of product that results in a net positive profit under any scenario seems to be about 2500 pounds of blueberries.
The above estimates are for blueberries. In our analysis, we found that the per unit processing costs of spinach were very high for any volume, and the per unit baseline price for frozen spinach is very low. We did not identify any scenarios in which frozen spinach would be a profitable venture.
Discussion, conclusion and policy considerations
In this study, we conduct a series of timed trials to estimate production costs for two regional-scale frozen value-added products, blueberries and spinach. Our results suggest that the market for value-added frozen regional produce can be profitable for some products. In particular, we found that blueberries are likely to be profitable, while spinach is not. We prioritize food safety and quality so that the end-product is comparable with other commercially available frozen products. While our research is conducted in a single facility with a specific processing line and specific products, we develop tools that can easily be modified to reflect different processing configurations, scales, products and assumptions so that our results can be applied to the unique context of each potential facility. We encourage potential market entrants to fully explore market conditions in other contexts and to make feasibility estimates publicly available, when possible.
We address the primary gaps that prohibit farmer and regional food business entry into retail frozen local product markets. The processing costs for high-quality, safe, popular retail products are critical to estimating feasibility and viability in this market. It is difficult to find evidence-based estimates for food processing costs, since that information is generally proprietary to private food processing companies. Another important gap is the information gap between farmers, processors and retailers. Each entity has some, but not all, of the information needed to understand the potential in this market. Our research combines the above information with the resources and expertise to analyze the information from a supply-chain perspective, incorporating food safety regulations and best practices.
Similar to results identified by Feenstra et al. (Reference Feenstra, Hardesty, Lev, Houston, King and Joannides2019), we find that regional frozen retail produce markets represent a diversification opportunity for small- and medium-sized farms. The opportunity could take the form of farm-level investment in equipment, facilities and expertise to develop a frozen product line, or the form of a separate regional investment in shared-use infrastructure. There are important considerations, however, that both policy-makers and potential market entrants should weigh as they consider this market.
In addition to financial considerations outlined in this study, potential entrants would need to consider several other aspects of a value-added food processing operation. A value-added food business has important differences from a farm enterprise. There are additional local, state and federal agencies that regulate worker safety and wages, licensing, food safety and building codes. Downstream buyers increasingly require facilities to meet private auditing standards that can exceed government regulations. Trained and knowledgeable production managers must have the capacity to consistently implement approved food production protocols, as well as hire, train, manage and retain a skilled workforce. The seasonal nature of fruit and vegetable production in most of the USA creates significant challenges for staff retention, and food processing generally must occur at the height of harvest season when staffing can already be stretched. For farm operations, payroll must distinguish between worker hours on-farm and worker hours for food processing and transportation activities, as they may be subject to different overtime exemption regulations under the Fair Labor Standards Act (Fitzsimmons, Reference Fitzsimmons2015). Food safety regulations and private food safety standards can vary across geographic regions and across different retail outlets. Building codes that govern facility layout and capacity can vary by municipality, county and state. State and local licensing, permitting, taxes and fees for commercial sales of food products vary by location.
Complications can also arise due to the scale of regional value-added food production, since the volume of production throughput must be large enough to justify up-front investments but is generally too small to competitively source scale-appropriate key inputs and equipment. Key variable inputs such as retail-size, freezer-safe sealable packaging may be difficult to source at regional production scales. Key equipment, such as IQFs, blanching tables and fillers are generally manufactured for larger-scale processing operations and may be difficult to source for regional-scale production. Infrastructure external to the food business, such as frozen storage, cold chains and adequate retail freezer capacity can be difficult to find and secure, and relationships with these external partners must be nurtured so that capacity is available during seasonal peak production periods.
Unless a farmer is capable of supplying large consistent quantities of product, has interest in and capacity to manage a separate enterprise and has access to a reliable supply chains and markets, the capital investments are likely too high for an individual farm operation to take on a value-added food enterprise. On the other hand, a regional-scale food business center like those targeted by recent USDA funding programs (USDA, 2022) could serve as a shared-use facility, like the one employed in this study. While regional food business centers would face similar challenges, they could have significantly more capacity to aggregate raw inputs to meet scale needs, and to navigate a fluid external environment. For regional food business centers, the information provided in this study and the Workbook provided in Supplementary Materials can be used to generate projections of appropriate scale and corresponding investments given proposed product supply and market conditions. Federal, state and private funders could use the Workbook to identify scale and regions with adequate potential produce supply, and tailor Requests for Application for future infrastructure funding to identify ideal facility placement and support the long-term success of awardees.
Farmers, food entrepreneurs and technical assistance providers should proceed cautiously when considering whether entering the value-added frozen produce market is a good choice for an individual operation. Regional food systems advocates and policy-makers seeking to support additional regional-scale food processing infrastructure could consider several additional approaches to achieve this goal. Research, development and entrepreneurship incentives for the design, fabrication and maintenance of regional-scale food processing equipment could help address key bottlenecks for several kinds of value-added foods. Workforce development could support a new generation of food production managerial staff, procurement/cold chain management staff and processing-line staff who are aware of the upstream challenges of regional scale farming. Collaborative approaches toward universal approved food production processes for safe, high-quality foods or group input procurement could minimize start-up bottlenecks. Additional capital funding for frozen storage, freezer trucks and retail display freezers could mitigate downstream cold-chain management barriers. Consumer research and education could identify and leverage consumer demand for a resilient food supply to identify the value and price premiums that could provide stable value-added supply chains. Potential grant recipients could demonstrate the feasibility of proposed projects using the Frozen Regional Produce Feasibility Workbook provided in Supplementary Materials.
While research of this nature is time-consuming and can be limiting due to the specifications of the context of particular facilities, we believe that information like this is critical for policy-makers seeking to support innovative food systems. Future research could explore other value-added products, evaluate upstream and downstream barriers and opportunities in more detail and further estimate consumer interest in regional value-added products.
Supplementary material
The supplementary material for this article can be found at https://doi.org/10.1017/S1742170523000236
Acknowledgements
The authors would like to thank the academic professionals and industry representatives who participated in the study. The authors would also like to thank those who reviewed the manuscript for their helpful comments and suggestions.
Author contributions
Fitzsimmons: conceptualization, methodology, software, validation, formal analysis, investigation, resources, data curation, writing—original draft, visualization, supervision, project administration, funding acquisition. Lass: methodology, software, validation, formal analysis, investigation, resources, data curation, writing—original draft, visualization, funding acquisition. Minifie: investigation, data curation, writing—review and editing, visualization. Kinchla: conceptualization, project administration, funding acquisition.
Financial support
This project was funded by the Northeast Sustainable Agriculture & Education Program (NESARE award, project number LNE 18-370).
Competing interest
The authors of this paper do not have any financial/personal interests or beliefs that could affect their objectivity, or inappropriately influence their actions or have any potential competing interests.
Appendix A: interest rates for small businesses
The Small Business Association (SBA) lists several different rates, a number of those start with the prime rate. Larger loans, up to $5.5 million, use Treasury Bill rates as the base. Most of the capital items used in freezing blueberries and spinach (equipment) have useful lives that suggest SBA 7(a) loan levels (see Table 1). Given the value of equipment, an interest rate of 6% (prime rate plus 2.75%), the SBA 7(a) loan rate for loans over $50,000 and over 7 years in duration, was used. Thus, a single loan for all equipment was assumed. If capital items were assumed to be purchased separately (spinner, tables, etc.), a rate as high as 8% could be used (prime rate plus 4.75%), the rate on loans for under 7 years and less than $25,000. The rates in Appendix Table A1 are all recommendations by the SBA. Rates actually paid by borrowers will vary as each borrower negotiates with their chosen lender.
Table A1. Small business association loan rates by loan type

Appendix B: time-tracking tools
Table B1. Time-tracking tool for labor required to freeze blueberries

Table B2. Time-tracking tool for labor required to freeze spinach

Appendix C: food processing center assets
The Franklin County Community Development Corporation (FCCDC) built the Western Massachusetts Food Processing Center WMFPC in 2001 with over $800,000 in funding from the Massachusetts Department of Agriculture, USDA Rural Development and Department of Housing and Urban Development. In its early years, the center trained food entrepreneurs and leased space and equipment to entrepreneurs. From 2003 to 2017, operations and expansions were funded through user fee revenues ($1,950,000), additional federal, state and private grants ($1,051,210), and support ($276,000). In 2013, the facility made further investments in a high-quality individual quick freeze (IQF) production line and cold storage to meet growing need of farmers and entrepreneurs to supply local food to consumers year-round. Since 2013, the facility secured $835,000 in USDA grants and loans, and raised an additional $165,000 to build the system out. The IQF line began operations in 2014 and since then has frozen about 20,000 lbs of product annually for wholesale and about 3400 lbs for retail sales.
Appendix D: cold-chain management
Successful cold-chain management is critical to providing a safe, high-quality, consistent end-product. To develop cold-chain management practices, the research team consulted farmers, food safety experts, distributors and retailers to determine their capacities/needs. The team reviewed all aspects of the cold-chain, including sourcing potential supply, scheduling, harvest conditions, pre- and post-farm gate moisture and temperature control, transportation, dry-dock delivery, inspection, finished product storage and post-delivery cold-storage protocols. For example, blueberries need to be field-packed in lined 20 cardboard boxes, palleted and top-iced. Spinach needs to be field-packed in plastic bins, kept in shade and top-iced. Both are stored in coolers and delivered in refrigerated trucks.
The process is dependent on the growing season for each individual product. The first step is to identify farmers who are interested in and able to supply the quantity needed within their service area (in this case, a 2 h drive from the FPF). For blueberries and spinach in the Northeast, outreach begins in December. Peak season for blueberries is July, and for spinach is either a spring or fall harvest. Initial conversations include seed-buying/crop-planning (spinach), quantity and availability, pricing, packing and cold-chain logistics, delivery specifications and timing, invoicing, billing and payment terms for delivery. The next step is to follow up with growers, about once each month, to reconfirm and track how any changes may impact harvest timing and volume. The third step is to confirm targeted delivery day/week about a month out. Two weeks before delivery, the FPF and farmer are in close touch to clarify logistics (weather, etc.) until delivery and payments are final.


 Open access