


Childhood undernutrition is a major global public health concern, particularly low-income and middle-income countries. The undernutrition crisis includes stunting (height-for-age), wasting (weight-for-height), underweight (weight-for-age) and micronutrient deficiencies (e.g. Fe, vitamin-A, I)(Reference Micha, Mannar, Afshin and Behrman1). Undernutrition poses a serious threat to survival, health and performance during childhood and adulthood(Reference Victora, Adair and Fall2,Reference Mohseni, Aryankhesal and Kalantari3) . The recent estimates suggest that stunting affected 21 % of children under 5 years of age (144 million), while 7 % of children were found to be wasted (47 million), and 13 % of children were underweight (88 million) across the globe in 2019(4). The WHO statistics indicate that South East Asia and Africa have the highest burden of childhood undernutrition globally. South East Asia is the home of a little less than two-fifth of all stunted children (36 %), and half of all wasted children (53 %) and underweight children (50 %) in the world. Similarly, Africa also has two-fifth of stunted children (39 %), a little than a quarter of wasted children (23 %) and one-third underweight children (32 %)(5–7).
Three countries India, Nigeria and Pakistan, in South East Asia and Africa, have the most children who are stunted, wasted and underweight in the world. Globally, India alone had 47 million stunted children and 26 million wasted children, the highest in the world in 2018(8). The first-ever Comprehensive National Nutrition Survey (CNNS) found that 35 % of children under 5 years of age were stunted, and 17 % were wasted, and 33 % were underweight in India in 2016–2018(9). Similarly, the National Family Health Survey (NFHS-4) reported a 10 % decline in the prevalence of stunting and a 7 % decline in underweight, while the prevalence of wasting remained stable during 2005–2015. The prevalence of stunting, wasting and underweight reportedly were 38 %, 21 % and 36 %, respectively, in 2015–2016(9). Undernutrition is unacceptably higher in many states, with stark and vast differences between and within states and by population groups in India(9–Reference Swaminathan, Hemalatha and Pandey12).
Many previous studies linked socio-economic and demographic factors with childhood undernutrition. The factors include age and sex of child, birth weight, birth order, duration of exclusive breast-feeding, bottle feeding, age of mother, lower maternal education, undernourished mothers, household socio-economic status, presence of toilet facility in the household, poor drinking water quality, poor sanitary conditions and place of residence(Reference Chowdhury, Chakrabarty and Rakib13–Reference Mukabutera, Thomson and Hedt-Gauthier22). On the other hand, the social support, availability and accessibility of food, and socio-economic status determine the nutritional behavior(Reference Brug23). Hence, there is the existence of socio-economic inequality in childhood undernutrition, especially in low- and middle-income countries. However, the vast majority of previous studies assumed ‘pure inequality’ that is ranking of children based on their health status from the most to least undernourished children irrespective of income or economic standing(Reference Van de Poel, Hosseinpoor and Speybroeck24).
Socio-economic inequality is different from pure inequality, and in undernutrition is termed as the degree to which childhood undernutrition rates differ between more and less socially and advantageous groups(Reference Van de Poel, Hosseinpoor and Speybroeck24). Two studies from Bangladesh and Nigeria reported an increase in socio-economic inequality in undernutrition among children over the years. These studies also reported the mother’s education, household wealth index, residence, mother’s health-seeking behaviour, sanitation, mother’s height and fertility were larger contributors to socio-economic inequality(Reference Huda, Hayes and El Arifeen25,Reference Akombi, Agho and Renzaho26) . Childhood undernutrition was found to be highly concentrated among children with mothers with lower education and staying in rural areas in 35 sub-Saharan African countries(Reference Ekholuenetale, Tudeme and Onikan27).
On the other hand, India has the highest burden of stunting, wasting and underweight in the world is not far behind in terms of socio-economic inequality in undernutrition in the children. A recent study found that a higher burden of stunted and underweighted children in the least developed districts in India. It further observed that open defecation in districts increased inequality to stunting and wasting, while maternal education and safe drinking water reduced the inequality(Reference Singh, Srivastava and Upadhyay28). Similarly, inequality was higher in childhood undernutrition among urban children in India(Reference Kumar, Kumari and Singh29). Another study also suggested the disproportionate concentration of the burden of undernutrition among poor children(Reference Pathak and Singh30).
India consists of twenty-eight states and eight union territories (UT). However, strikingly, it has a big divide among Empowered Action Group (EAG) and non-EAG states in socio-economic and demographic factors. The EAG states have poorer socio-economic development than non-EAG states. In 2001, the Ministry of Health and Family Welfare, Government of India (MoHFW-GOI) identified eight states, including Bihar, Chhattisgarh, Jharkhand, Madhya Pradesh, Odisha, Rajasthan, Uttarakhand and Uttar Pradesh as EAG states. The EAG states are socio-economically backward states and lag behind in the demographic and epidemiological transition than non-EAG states. These eight EAG states are highly populous and comprise 48 % of the total population of India. The EAG states are characterised by high fertility, infant and child mortality, maternal deaths, high population growth rate, and low literacy rate(Reference Arokiasamy and Gautam31,Reference Arokiasamy, Jain and Goli32) . It is noteworthy that half of the population below the poverty line in India belonged to EAG states in 2012. The per capita net state domestic product was significantly lower in EAG states in India(33).
The socio-economic development is poorer in EAG states, yet there is significant diversity among socio-economic indicators between EAG states. The state domestic product was the highest in Uttarakhand (Rs. 157 643) and lowest in Bihar (Rs. 34 409) in 2016–2017. The overall average life expectancy ranged between 65 years in Chhattisgarh and Madhya Pradesh and 72 years in Uttarakhand during 2012–2016(33). The highest estimated infant mortality rate was in Madhya Pradesh (forty eight), while it was lowest in Uttarakhand (thirty one) in 2018(34). The maternal mortality ratio varied from 71 in Jharkhand to 197 in Uttar Pradesh(35). According to the NFHS-4, one-third of the poorest wealth status households were from EAG states ranging between 51 % in Bihar and 5 % in Uttarakhand in India in 2015–2016(10).
Notably, the prevalence of stunting, wasting and underweight was almost double in EAG states (37–42 %) than Goa and Jammu and Kashmir from non-EAG states (16–21 %) in 2016–2018(9). A similar pattern was also previously observed in the NFHS series, which reported two times higher prevalence of stunting, wasting and underweight in EAG states than non-EAG states(10,36–39) . Moreover, these estimates indicated a more pronounced decline in stunting, wasting and underweight among children under 5 years of age in non-EAG states over the years. On the other hand, the decline in childhood undernutrition is more prevalent among non-poor than poor households in EAG states.
Given the highest burden of childhood undernutrition and poor socio-economic development in EAG states, there is a strong need to examine inequality in undernutrition, particularly in EAG states in India. There is also a strong need for investigating factors contributing to socio-economic inequality among poor and non-poor in these states. However, there is not any study to the best of our knowledge that assessed the extent and contribution of socio-economic factors to the socio-economic inequality in undernutrition among children under 5 years of age in India. Hence, the study aims to examine the changes in socio-economic inequality in nutritional status among children in EAG states in India.
Methods
Study design and population
We used the most recent two rounds of data from the NFHS conducted in 2005–2006 (NFHS-3) and 2015–2016 (NFHS-4) in India. The NFHS is a large-scale population-based nationally representative cross-sectional survey. Its four rounds are conducted to date in the country since 1992–93 (Demographic Health Survey (DHS) are known as NFHS in India). The NFHS series aims to provide information on population, health and nutrition for India and its states. The usual NFHS sample design is a two-stage probability sampling design in urban and rural areas. Generally, the information is collected from reproductive-aged women (15–49) and men (range varies) using the household, woman’s and man’s questionnaires, and standardised field procedures. The household and individual response rates always remain higher than 90 % in all rounds(10,36–39) .
The information on child health was collected from women aged 15–49 years who were residents of selected households for the survey. The distinctive feature of the NFHS is the collection of anthropometric measurements of height and weight for children aged 0–5 and women aged 15–49 years. The leading indicators of children’s nutritional status are based on anthropometric measures that include height measured in centimetres and weight measured in kilograms. Usually, NFHS collects the anthropometric measurements for the most recent three under-five births in the reference time of the survey. However, our analysis includes only the youngest birth from the mother’s birth history because the information on few predictors variables included in our analysis was not collected for the second and third youngest birth. Hence, our overall analytical sample size is 11 858 from NFHS-3 (2005–2006) and 92 630 from NFHS-4 (2015–2016).
Construction of socio-economic status
We required the information either on the household income or expenditure to examine the socio-economic inequality in the nutritional status of children in EAG states. However, NFHS provides data on the household wealth index instead of household income or expenditure. Hence, we used the household wealth index as a proxy indicator of household socio-economic status. This is highly recommended when direct information is not available on household income or expenditure, particularly in low- and middle-income countries(Reference Filmer and Pritchett40,Reference Poirier, Grépin and Grignon41) . In NFHS, the household wealth index is constructed using principal component analysis(Reference Rutstein and Johnson42). The wealth index is typically based on the information of household assets, type of house, source of drinking water and presence of toilet facility in the household. However, the literature suggests the direct linkages between type of house, source of drinking water, and the presence of toilet facility and nutritional status. Hence, we followed the NFHS procedure and generated a new wealth index, excluding these variables. The new wealth index was further categorised into five quintiles: poorest (lowest 20 %), poorer (lower 20 %), middle, (middle 20 %), richer (higher 20 %) and richest (highest 20 %)(Reference Rutstein and Johnson42).
Outcome variables
We included ‘stunting’ and ‘underweight’ as indicators of child nutritional status and used them as outcome variables in the analysis. Using recommended WHO Child Growth Standards for international use, we analysed anthropometric data from NFHS on height-for-age (HAZ) (stunting) and weight-for-age (WAZ) (underweight) to quantify the nutritional status of children in EAG states(43,Reference De Onis, Garza and Onyango44) . We defined stunting as height-for-age less than −2 sd below the median of the reference population (HAZ < −2 sd). Similarly, underweight was defined as weight-for-age less than −2 sd below the reference population’s median (WAZ < −2 sd). We followed the WHO definition of biologically implausible values for stunting and underweight. Hence, we did not include in the analysis if stunting as Z-score < −6 sd or >6 sd and underweight as Z-score < −6 sd or >5 sd (43). The details on anthropometric measurement can be obtained from elsewhere(10,36–39) . Finally, we included ‘stunting’ and ‘underweight’ as dichotomous variables. Stunting is coded as ‘1’ if HAZ < −2 sd and ‘0’ else. For underweight, if WAZ < −2 sd, it is coded as ‘1’ and else as ‘0’.
Predictor variables
Based on the UNICEF conceptual framework of the causes of undernutrition, we selected a few mothers and children’s background characteristics and included them as predictor variables in the analysis(45). The predictor variables consist of age of child (in months) (0–5, 6–9, 10–12, 13–36 and 37–59), sex of child (male and female), birth order and interval (first birth, 2–3 and < 24 months, 2–3 and > 23 months, 4+ and < 24 months, and 4+ and > 23 months), size of child at birth (small, average and large), mother’s age at child’s birth (in years) (< 20, 20–29 and 30–49), mother’s nutritional status (underweight, normal, overweight and obese), mother’s education (not educated, primary, secondary and higher), antenatal care (ANC) (no ANC, full ANC), initiation of breast-feeding (within 1 h of birth and after 1 h), duration of any breast-feeding (in months) (0–5, 6–11, 12–17 and 18–59), bottle feeding (no and yes), place of residence (urban and rural), caste (scheduled caste (SC) and scheduled tribe (ST), other backward class (OBC) and other), religion (Hindu, Muslim and other), wealth index (poorest, poorer, middle, richer and richest), type of house (kaccha, semi-pucca and pucca), toilet facility (improved and unimproved), fuel used for cooking (smoked and smokeless) and source of drinking water (improved and unimproved). The details of the predictor variable are given in S1.
Statistical analysis
We carried out statistical analysis at two levels. At the first level, we used a concentration index (CI) to measure the magnitude of wealth inequality and quantify the extent of socio-economic inequality in stunting and underweight among children under 5 years of age in EAG states. The second level includes the decomposition of concentration indices of associated socio-economic factors with stunting and underweight. We examined inequality using a set of factors that change systematically. We reported the percentage of contribution of each factor. The higher percentage value of factors indicates its higher contribution to socio-economic inequality.
Concentration index
We computed CI to examine the socio-economic inequality in stunting and underweight in EAG states. The CI is defined as twice the area between the concentration curve and line of equality (the 45° line). Suppose,
 $\mu $
is the mean of undernutrition in children under 5 years of age (stunting or underweight),
$\mu $
is the mean of undernutrition in children under 5 years of age (stunting or underweight),
 ${y_i}$
is the value of the undernutrition of the ith child and
${y_i}$
is the value of the undernutrition of the ith child and
 ${R_i}$
shows the rank of socio-economic status of the ith child in the distribution of household socio-economic status, the CI is given as(Reference Kakwani, Wagstaff and van Doorslaer46):
${R_i}$
shows the rank of socio-economic status of the ith child in the distribution of household socio-economic status, the CI is given as(Reference Kakwani, Wagstaff and van Doorslaer46):
 $$C = {2\over{n.\mu}}\sum \nolimits_{i \,=\,1}^n {y_i}{R_i} - 1$$
The CI is the mean-adjusted covariance of undernutrition (stunting and underweight) and socio-economic rank. The CI takes any value from −1 to +1. If CI is zero, it indicates perfect equality in undernutrition; if it is negative, it indicates inequality concentrated among the relatively poor. The positive value of CI shows that the concentration of undernutrition is higher among the relatively rich. In the present study, we calculated the concentration curve by plotting the cumulative percentage of undernutrition on the y-axis against the cumulative percentage of the children ranked by household wealth, beginning with the poorest quintile and ending with the richest quintile on the x-axis.
Decomposition of concentration index
We decomposed the concentration index into the contribution of predictor variables to socio-economic inequality in children’s nutritional status. Here, the contribution is the product of the sensitivity of stunting and underweight with respect to that factor and the degree of inequality in that factor. If the vector ‘x’ refers to those variable influencing ‘y,’ and we assume that stunting and underweight can be described by linear regression of the form(Reference Wagstaff, van Doorslaer and Watanabe47,Reference Wagstaff, van Doorslaer and Watanabe48) :
 $$y = \alpha + {\beta _{ki}}{X_{ki}} + {\varepsilon _i}$$
Then, CI can be written as:
 $$CI = \sum \limits_k \left( {{\beta _k}{ \overline x_k}\over{{\mu _h}}} \right)C{I_k} + {{{GC{I_g}}}\over{{\mu _h}}}$$
where the index k refers to the regressors in the equation, CI
k
is the concentration index for each of the individual regressors,
 ${\beta _k}$
is the coefficient for each child undernutrition determinant and
${\beta _k}$
is the coefficient for each child undernutrition determinant and
 ${\overline x_k}$
is the mean value of each individual regressor. GCI
g
is the generalised concentration index for the residual from the regression (
${\overline x_k}$
is the mean value of each individual regressor. GCI
g
is the generalised concentration index for the residual from the regression (
 ${\varepsilon _i}$
).
${\varepsilon _i}$
).
Results
Figures 1 and 2 show the trends and prevalence of stunting and underweight declined among all EAG states during 2005–2016. On average, two-fifth of children were either stunted or underweight in all EAG states in 2015–2016. The prevalence of stunting ranged between 34 % in Uttarakhand and Odisha and 48 % in Bihar in 2015–2016. The lowest and highest prevalence of underweight was 27 % in Uttarakhand and 48 % in Jharkhand, respectively. Strikingly, the prevalence of stunting and underweight had been lowest in Uttarakhand among all EAG states over the years. Chhattisgarh reported the highest decline in stunting, while it was lowest in Jharkhand in 2005–2016. Similarly, Madhya Pradesh and Uttar Pradesh had the highest and lowest decline in the prevalence of underweight in the same period.
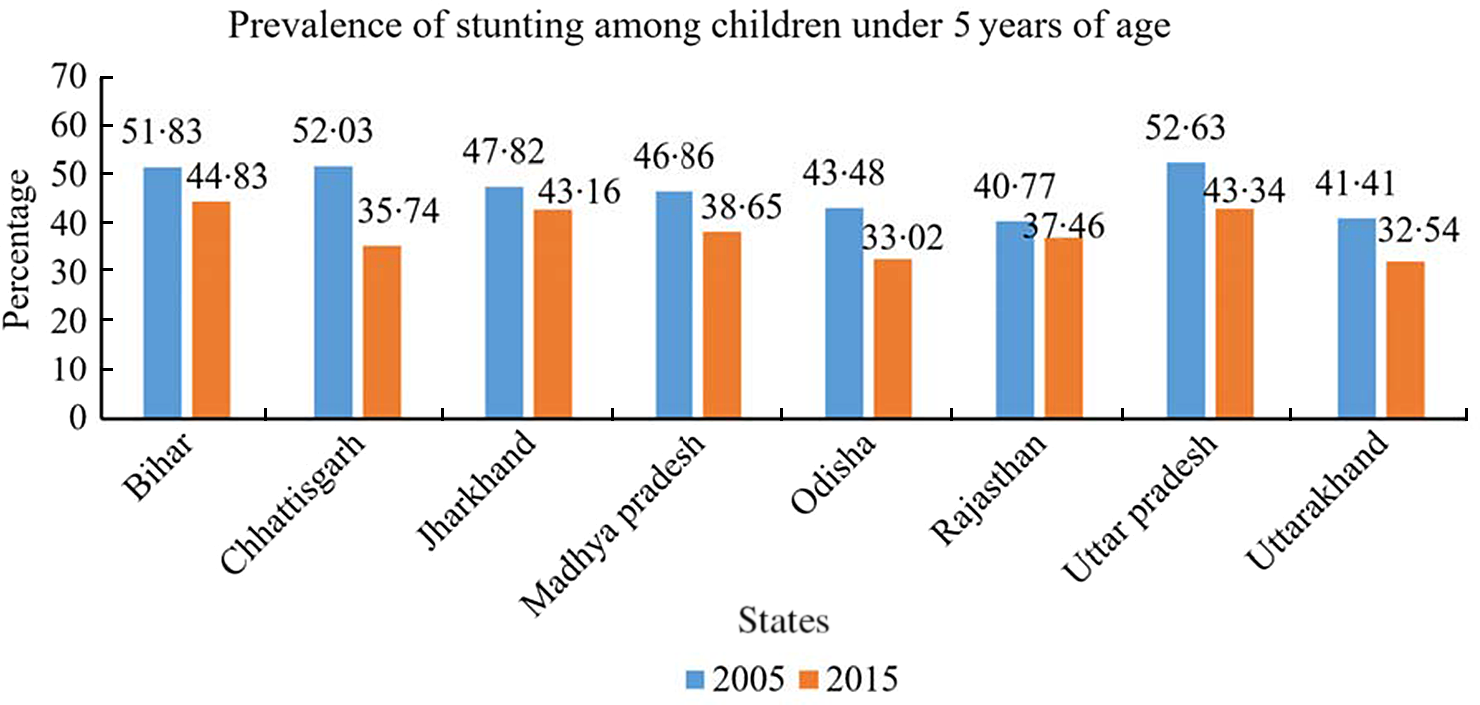
Fig. 1 Prevalence of stunting among children under 5 years of age, EAG states, 2005–2006 and 2015–2016. EAG, Empowered Action Group

Fig. 2 Prevalence of underweight among children under 5 years of age, EAG states, 2005–2006 and 2015–2016. EAG, Empowered Action Group
Table 1 shows the prevalence and trends of stunting and underweight among children under 5 years of age by household wealth index in EAG states during 2005–2016. Over the years, the overall prevalence of stunting and underweight decreased among poor and non-poor in EAG states. The poorest households had a little more than two times stunted and underweight children than the richest households between 2005–2006 and 2015–2016. The wealth intra-quintile analysis also showed that stunting and underweight decreased within each household wealth quintile.
Table 1 Prevalence of stunting and underweight among children under 5 years of age by wealth index, EAG states, 2005–2006 and 2015–2016

EAG, Empowered Action Group; HAZ, height-for-age Z-score; WAZ, weight-for-age Z-score.
Table 2 presents the CI of stunting and underweight differ significantly and have negative values across all EAG states during 2005–2016. The negative values of CI imply a higher concentration of stunting and underweight among children in poor households in all EAG states. The overall CI of stunting did not change much, indicating the inequality remained unchanged during 2005–2016 (−0·127 in 2005–2006 and −0·125 in 2015–2016). However, the overall CI of underweight was higher in 2015–2016 than in 2005–2006, suggesting a decrease in inequality in underweight in this period (−0·161 in 2005–2006 and −0·143 in 2015–2016). The comparison of inequality in stunting and underweight between EAG states suggests the extent of inequality varied and decreased across all states other than Chhattisgarh. It signifies the stunting and underweight had been highly concentrating among children in the poor household over the years. Uttarakhand reported the highest decline in inequality in both indicators, where the inequality in stunting decreased by 0·123 from −0·243 in 2005–2006 to −0·120 in 2015–2016. Uttarakhand also had the highest decrease in underweight inequality (0·089) from −0·235 in 2005–2006 to −0·146 in 2015–2016. The inequality in stunting was the lowest in Madhya Pradesh (−0·096), and that of underweight was in Bihar (−0·108) in 2015–2016. At the same time, Odisha reported the highest inequality in both indicators (−0·180 (stunting) and −0·189 (underweight)).
Table 2 Concentration indices of stunting and underweight among children under 5 years of age, EAG states, 2005–2006 and 2015–2016

EAG, Empowered Action Group.
The multivariable binary logistic regression analysis indicates a statistically significant association between children’s nutritional status and household wealth index during 2005–2016 (Table 3). Children who belonged to households in the higher wealth quintile had a lower risk of either being stunted or underweight than children who belonged to the lowest wealth quintile. The children who belonged to the richest wealth quintile were 0·555 (95 % CI 0·503, 0·612) times less likely to be stunted than children who belonged to the poorest wealth quintile in 2015–2016. Further, the likelihood of being underweight was 0·520 times (95 % CI 0·471, 0·573) lower among children who belonged to the richest wealth quintile compared to the poorest wealth quintile in the same period.
Table 3 Factors affecting stunting and underweight among children under 5 years of age, EAG states, 2005–2006 and 2015–2026

EAG, Empowered Action Group; NFHS, National Family Health Survey; ANC, antenatal care; SC, scheduled caste; ST, scheduled tribe, OBC, other backward class.
Exponentiated coefficients; 95 % CI in brackets.
®Reference.
* P < 0·05.
** P < 0·01.
*** P < 0·001.
Tables 4 and 5 show the CI and elasticity of each socio-economic variable included in the analysis. The tables also show the contribution of each variable to socio-economic inequality in stunting and underweight in terms of ‘contribution to C’ (in the same unit as CI) and ‘% contribution’ (adjusted percentage contribution to inequality) during 2005–2016. The highest contribution to inequality in stunting came from the household wealth index, followed by the mother’s education and nutritional status. The total contribution of these three factors was 80 % to inequality in stunting and 90 % to inequality in underweight in 2015–2016. The inequality in household wealth status contributed to 47 % of stunting CI and 51 % underweight CI. While the mother’s education contributed to 24 % and 21 %, respectively. The mother’s nutritional status contributed to 8 % of the inequality in stunting and 16 % of underweight in 2015–2016
Table 4 Contributions of background characteristics to inequalities in stunting among children under 5 years of age, EAG states, 2005–2006 and 2015–2016

EAG, Empowered Action Group; SC, scheduled caste; ST, scheduled tribe, OBC, other backward class.
* Subtotal of % contribution is shown for the background characteristics which had at least three subcategories.
Table 5 Contributions of background characteristics to inequalities in underweight among children under 5 years of age, EAG states, 2005–2006 and 2015–2016

EAG, Empowered Action Group; ANC, antenatal care; SC, scheduled caste; ST, scheduled tribe, OBC, other backward class.
* Subtotal of % contribution is shown for the background characteristics which had at least three subcategories.
The trends suggest the actual contribution of household wealth index recorded a decline by 9 % to inequality in underweight. The actual contribution of mother’s education increased by 1–2 % to inequality in stunting and underweight. The actual contribution of the mother’s nutritional status to inequality in stunting increased by 3 % and in underweight by 4 % during 2005–2016.
Discussion
To the best of our knowledge, perhaps, our study is the first that examined changes in socio-economic inequality in the nutritional status of children in recent years, particularly in EAG states in India. We analysed large-scale population-based cross-sectional, nationally representative NFHS series data. Our analysis indicated the decline in the prevalence of stunting and underweight did not result in the decline in socio-economic inequality in both indicators. Notably, the overall inequality in stunting remained unchanged, while the underweight inequality decreased over the years in EAG states. Our analysis also indicated that socio-economic inequality differed by state. The highest inequality in stunting and underweight was reported in Odisha, respectively. Similarly, Uttarakhand had the highest decrease in inequality in both indicators during 2005–2016.
We found household wealth index and mother’s education were the largest contributors to socio-economic inequality in stunting and underweight among children in EAG states. Both together contributed nearly three-fourth of inequality in children’s nutritional status. It is a critical finding of our study and consistent with many studies from different settings. A recent study reported that the total contribution of wealth index and mother’s education was nearly half to the inequality in stunting in Bangladesh(Reference Huda, Hayes and El Arifeen25). Similar findings have also been documented in Nigeria, where the household wealth index and educational status of mothers were the largest contributors to socio-economic inequality in stunting and underweight in children(Reference Akombi, Agho and Renzaho26).
While the rich households keep a good amount of expenditure on nutritional foods, the poor have limited food options due to insufficient household income. Socio-economic status also affects food choice behaviour and health behaviour. Thereby health and nutritional status vary by socio-economic subgroups among the population. Similarly, there are various pathways through which a mother’s education determines the child’s nutritional status. One of the pathways includes a mother’s knowledge about health and nutrition and adherence to recommended child feeding practices. Further, the higher level of education improves maternal socio-economic status leading to an increase in the mother’s command over the utilisation of resources(Reference Makoka49).
Our decomposition analysis revealed that the mother’s nutritional status was also a significant contributor to inequality to stunting and underweight among children. Strikingly, the contribution of a mother’s nutritional status to inequality in stunting and underweight increased over the years. The mother’s nutritional status was responsible for a little less than one-tenth inequality in stunting and two-tenth inequality in underweight in 2015–2016. Many previous studies reported a strong association between the mother’s nutritional status and the child’s nutritional status. Underweight mothers tend to have either underweight or stunted children(Reference Khan, Zaheer and Safdar50,Reference Sinha, Dua and Bijalwan51) . Literature suggests that underweight mothers are most likely to deliver low birth weight births, leading to undernutrition in children(Reference Victora, Adair and Fall52–Reference Kirchengast and Hartmann54). We found that children from overweight and obese mothers were concentrated among non-poor households. Since the higher proportion of overweight and obese mothers belonged to better socio-economic conditions, their children were more likely to have adequate nutritional food and essential primary health care services, contributing to better nutrition(Reference Hasan, Soares Magalhães and Williams55). Hence, it confirmed the contribution of the mother’s nutritional status to inequality in stunting and underweight among children.
India is committed to Sustainable Development Goals (SDG), and the second SDG seeks sustainable solutions to end hunger in all its forms by 2030 and achieve food security(56). Hence, India also set a national target of bringing down the prevalence of stunting and underweight up to 2·5 % and 0·9 %, respectively, by 2030(57). To SDG implementation, the Prime Minister of India launched the Prime Minister’s Overarching Scheme for Holistic Nutrition (POSHAN) Abhiyaan (National Nutrition Mission (NNM)) in 2018. It is a multi-ministerial convergence programme with the vision to ensure the attainment of malnutrition-free India by 2022. The POSHAN Abhiyaan has a target of reducing stunting, undernutrition, anaemia (among young children, women and adolescent girls), and low birth weight by 2 %, 2 %, 3 % and 2 % per annum, respectively. It aims to ensure holistic development and adequate nutrition for pregnant women, mothers and children(57,58) . However, India State-Level Disease Burden Initiative Malnutrition Collaborators reported that the annualised percentage decline in the prevalence of stunting and underweight in children is sluggish among low Socio-Demographic Index (SDI) state group (EAG states) compared to the high Socio-Demographic Index state group in India in 2017. The study further added that most of these states require significantly higher rates of reduction for all forms of undernutrition to meet NNM 2022 and SDG 2030 targets(Reference Swaminathan, Hemalatha and Pandey12).
Our findings have important policy implications. According to the National Institution for Transforming India (NITI) Aayog report, EAG states are far behind achieving the second SDG target. All EAG states had the lowest Goal 2 Index scores and ranked below among all twenty-eight states and eight UTs in 2019–20(57). Hence, our findings suggest that the POSHAN Abhiyan should adopt an equity approach to reducing undernutrition in EAG states. Else it will be challenging for India to meet its SDG targets because the poorest households in EAG states have a major contribution to the total burden of childhood undernutrition in the country. Efforts should also be made to minimise the socio-economic inequality in undernutrition between poor and non-poor. The POSHAN Abhiyaan must ensure nutrition and food security for people at the grassroots level, particularly poor households in EAG states. Also, POSHAN should not be limited to women and children, but it should encompass all citizens. The Abhiyaan must include activities to promote key nutritional behaviour practices at the household levels like exclusive breast-feeding, timely complementary feeding for children and a diversified diet for each household member, especially pregnant women, adolescents and children.
Our study also has limitations. First, we did not have a direct indicator of household income or expenditure to examine the socio-economic inequality in children’s nutritional status. Hence, we used the household wealth index as a proxy indicator for household socio-economic status in line with many previous studies examining the socio-economic inequality in child health(Reference Van de Poel, Hosseinpoor and Speybroeck24–Reference Akombi, Agho and Renzaho26,Reference Singh, Srivastava and Upadhyay28,Reference Pathak and Singh30–Reference Arokiasamy, Jain and Goli32,Reference Poirier, Grépin and Grignon41,Reference Rutstein and Johnson42,Reference Wagstaff, van Doorslaer and Watanabe47,Reference Wagstaff, van Doorslaer and Watanabe48,Reference Chalasani59) . Second, we decomposed the inequality based on concentration curves and concentration indices proposed by Wagstaff et al (2003), a widely used method to measure health inequality(Reference Van de Poel, Hosseinpoor and Speybroeck24–Reference Akombi, Agho and Renzaho26,Reference Singh, Srivastava and Upadhyay28,Reference Arokiasamy and Gautam31,Reference Arokiasamy, Jain and Goli32,Reference Chalasani59) . However, Nesson and Robinson (2019) briefly listed methodological issues with the concentration index(Reference Nesson and Robinson60). Third, we analysed cross-sectional data, hence could not establish a causal relationship between socio-economic and demographic variables and childhood stunting and underweight. Fourth, our decomposition analysis did not explain the inequality in stunting and underweight completely because it did not include many of those other factors that contribute to child malnutrition, for example, diarrhoeal illness, poor complementary feeding among children aged 6–23 months. Hence, results should be interpreted cautiously.
Conclusion
Our study concludes the socio-economic inequality in nutritional status among children under 5 years of age have gone through changes during 2005–2016 in EAG states in India. The stunting and underweight are concentrated mainly among children from poor households. The inequality in stunting did not change much, while the inequality in underweight increased over the years. The state-wise differences in inequality can also be noticed. Madhya Pradesh and Bihar had the highest inequality in stunting and underweight, respectively, in 2015–2016. The decomposition analysis indicates that household wealth index, mother’s education and mother’s nutritional status determine about 80 % of the inequality in stunting and underweight among children in EAG states in India.
Acknowledgements
Acknowledgements: Authors are happy to acknowledge the contribution of Ashish Kumar Upadhyay for helping to handle the Stata-14 software. Financial support: For this research, no any specific grant received from any funding agency, commercial entity or non-profit organisation. Conflict of interest: There are no conflicts of interest. Authorship: R.K. and B.P. contributed to analysis of the data, interpreted the result and drafted the manuscript. Both authors reviewed and approved the final manuscript for submission for publication. Ethics of human subject participation: Not applicable.
Supplementary material
For supplementary material accompanying this paper visit https://doi.org/10.1017/S1368980021000343


