


Worldwide, breast cancer (BC) is the leading type of cancer in women with more than 1·7 million incident cases and more than 535 000 deaths in 2016(1). Despite efforts made in the fields of BC treatment and prevention, it still causes more than 200 000 deaths a year in developed countries(1).
Obesity is a risk factor specifically related to postmenopausal BC(Reference Senkus, Kyriakides and Ohno2), due to the increased production of oestrogens derived from adipose tissue(3). Peripheral adipose tissue produces oestrogens which act as growth factors in breast cells and may stimulate tumour progression(Reference McPherson, Steel and Dixon4). In addition, obese people usually have reduced levels of sex-hormone binding globulin, which increases the biologically active free-fraction of oestrogens(Reference Cleary and Grossmann5). In contrast to postmenopausal BC, available evidence suggests an inverse association between body fatness in early life and premenopausal BC(Reference Xue, Rosner and Eliassen6). However, the association between obesity and BC is complex and not fully understood. More specifically, the influence of changes in lifespan adiposity on BC risk is still controversial, and it is necessary to explore new perspectives that consider the patient’s vital trajectory in order to better understand the relation between adiposity and cancer(7).
New strategies have been designed based on the study of body shape in different stages of life, so they allow to correlate the body shape trajectories with the risk of developing chronic diseases(Reference Lee, Pilli and Gebremariam8). These different trajectories have been associated with all-cause and specific-cause mortality(Reference Song, Hu and Wu9). Previous studies have found that patients with a heavy body shape during childhood that was maintained or even increased during midlife have a higher risk of overall mortality and a higher risk of obesity-related cancers (oesophagus adenocarcinoma, colorectal cancer, pancreatic adenocarcinoma, postmenopausal BC, endometrial adenocarcinoma, ovarian cancer, advanced prostate adenocarcinoma, kidney, liver and gallbladder carcinoma)(Reference Song, Willett and Hu10). When this trajectory-based approach was used in a European cohort, the authors found no significant association between body shape trajectories and BC risk(Reference Fagherazzi, Guillas and Boutron-Ruault11). However, the available evidence is still limited, and previous studies are based on populations with a high baseline BMI. Evidence from a population with lower BMI levels is needed. Thus, we aimed to assess the association between trajectories of body shape and incident BC in a middle-aged Mediterranean cohort of university graduates.
Methods
Study population
The ‘Seguimiento Universidad de Navarra’ (University of Navarra Follow-up) (SUN) Project is a dynamic (recruitment permanently open) and multi-purpose cohort study entirely composed of university graduates(Reference Carlos, De La Fuente-Arrillaga and Bes-Rastrollo12). Participants completed a 556-item baseline questionnaire and are contacted biennially thereafter to inquire about changes in lifestyles and incident diseases.
Up to 2018, 22 790 participants answered the baseline questionnaire. For the present analysis, 8791 men were excluded (Fig. 1). We also excluded 229 women who answered the baseline questionnaire after 1 October 2015 to ensure a follow-up period of at least 2 years, and 1295 participants due to lack of information on follow-up (overall retention 91 %). We further excluded 142 women who reported a previous BC in the baseline questionnaire or had developed BC before the age of 40 years during the follow-up. Also, we excluded 1350 participants with total daily energy intake lower than 500 kcal/d or higher than 3500 kcal/d(Reference Willett13). We also excluded 204 participants because of age of menopause younger than 35 years due to an eventual special hormonal status. Participants with <3 registered body shape images were excluded (583 participants). Finally, women who did not reach the age of 41 years during the follow-up were also excluded (3698 participants), since the assessed exposure was body shape trajectories from age 5 to 40 years. Thus, 6498 women were included in our analyses. The present study was approved by the Institutional Review Board of the University of Navarra.
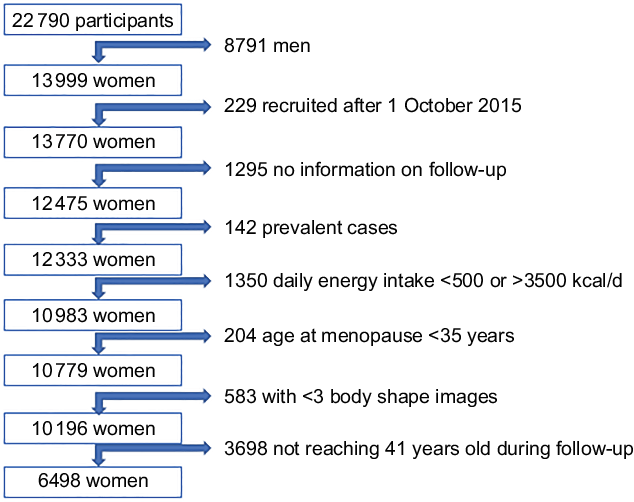
Fig. 1 Flow chart of participants in the SUN Project, 1999-2015
Assessment of body shape
In the baseline questionnaire, participants were asked to report which one of the nine pictorial body diagrams (Fig. 2) developed by Stunkard et al.(Reference Stunkard, Sorensen and Schlusinger14) best described their body shape at ages 5, 20, 30, and 40, and currently. Participants reported their height and weight at baseline and every other year during the follow-up. We converted BMI to the same scale as body shapes in those who still had missing information on body shape at ages 20, 30 and 40. This methodology was successfully used in previous studies(Reference Song, Hu and Wu9). In order to rescale the BMI at ages 20, 30 and 40 into nine categories consistently with the nine somatotypes, we built a prediction model for body shape on BMI at the age between 17 and 23 years among the subjects with available information at these ages for the body shapes at age 20. We proceeded similarly with the BMI at the age of 27–33 years and 37–43 years for the body shapes at 30 and 40 years, respectively. In our model, we found a strong correlation between BMI and body shape at baseline (Spearman’s rho = 0·755, P < 0·001).
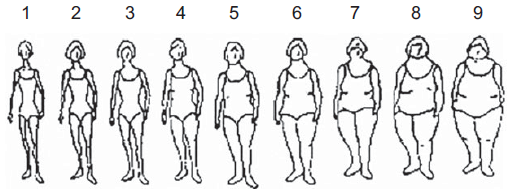
Fig. 2 Stunkard body diagram in women(Reference Stunkard, Sorensen and Schlusinger14)
Trajectory modelling
Among participants who had at least three different body shape data at different ages, we used group-based trajectory models (GBTM) to identify distinct body shape trajectories over age or time – from age 5 up to 40 years. The GBTM method fits longitudinal data as a discrete mixture of two or more trajectories via maximum likelihood(Reference Jones and Nagin15). To fit the models, we used the Stata traj plug-in, with body shape figures modelled as censored normal.
We used a censored normal model as a polynomial function of age (as time scale). Model selection was pursued in a two-stage approach assessed by change in the Bayesian Information Criterion(Reference Nagin16). In the first stage, we aimed to determine the number of groups using a quadratic form for all the trajectory groups. We stepwise decreased the number of groups in the model specification. We selected the model with the largest Bayesian Information Criterion as recommended(Reference Nagin16). Given our sample size, we compared the Bayesian Information Criterion of four groups with three, two and one groups. After identifying that the model with four groups best fitted our data, in the second stage, we determined the order of the polynomial functions specifying the shape of each trajectory. Different shapes for trajectories were tested, and we compared the Bayesian Information Criterion of the four-group models with different shapes (linear, quadratic and cubic). The model with the first and the fourth groups with up to cubic order, and the second and the third groups with up to quadratic order terms showed the best fit to the data. After obtaining the final model, we named the trajectory groups to describe their visual patterns (Fig. 3) as ‘childhood lean-midlife increase’, ‘childhood medium-midlife stable’, ‘childhood heavy-midlife stable’ and ‘childhood heavy-midlife increase’.
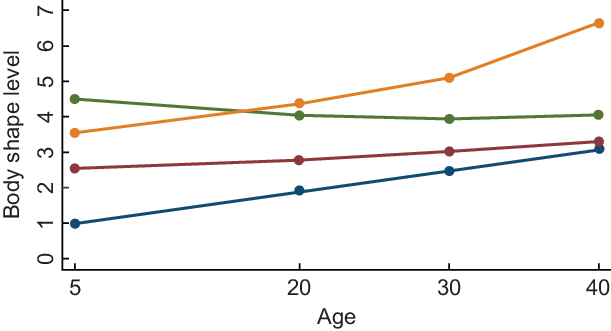
Fig, 3 Body shape trajectories among women in the SUN Project, 1999-2015. ![]() , Lean-increase 19·9 %;
, Lean-increase 19·9 %; ![]() , medium-stable 53 %;
, medium-stable 53 %; ![]() , heavy-stable 21 %;
, heavy-stable 21 %; ![]() , heavy-increase 6·1 %
, heavy-increase 6·1 %
Once the number and shape of groups were identified, we tested the model adequacy using the average posterior probability (APP) of group membership. The APP of group membership measured the likelihood for each participant to belong to its assigned group. Using the cut-off point of ≥ 0·70 as recommended by Nagin(Reference Nagin16), our final models demonstrated good discrimination in classifying individuals into distinctive trajectory groups: the APP for each group was 0·88, 0·91, 0·84 and 0·88. Finally, to assess the assignment accuracy, we calculated the odds of correct classification (OCC); the OCC is a ratio where the numerator is the OCC into the group on the basis of the maximum probability classification rule, and the denominator is the OCC based on random assignment, with the probability of assignment to the group equal to its estimated population base rate. Considering that an OCC >5·0 indicates that the model has high assignment accuracy(Reference Nagin16), our model suggested high assignment accuracy: the OCC for each trajectory group was 28·7, 9·3, 19·9 and 109·7.
Breast cancer assessment
The diagnosis of BC was initially self-reported. Patients who had reported a diagnosis of BC were asked to provide a copy of medical reports that were then confirmed as invasive carcinomas by an expert who was blinded to the exposure. Hereby, <10 % of the self-reported cases were not confirmed due to carcinomas ‘in situ’ or benign lesions of the breast. We also included as confirmed BC cases, deaths due to BC that had been identified through consultation of the National Death Index. Alternatively, we included both confirmed and self-reported BC cases as ‘probable BC cases’.
Covariate assessment
Information about sociodemographic, lifestyle and medical variables was obtained from the baseline questionnaire. Smoking habit was assessed as a categorical variable (never, current, former) and in a quantitative manner (number of cigarettes smoked at different ages to obtain the cumulative exposure to smoking as pack-years). In the baseline questionnaire, participants were asked to complete a previously validated physical activity questionnaire collecting information about seventeen activities(Reference Martínez-González, López-Fontana and Varo17). Participants also completed a previously validated 136-item FFQ at baseline that included, among others, information about alcoholic beverage consumption(Reference de la Fuente-Arrillaga, Vázquez Ruiz and Bes-Rastrollo18). The questionnaire included information on age of menopause, age of menarche, use of hormone replacement therapy – current or past use, and if ever, the duration of its consumption – pregnancies, time of breast-feeding, medication use and baseline chronic diseases. Assessment of family history of BC included mother, sister and grandmothers. Age at their BC diagnosis was recorded as <25, 25–44, 45–64 or ≥65 years. Imputation was applied for all missing values at baseline.
Menopause was assessed by asking participants at what age menstruations ceased and what caused this cessation – natural, surgical, chemotherapy/radiotherapy or other. Menopausal status was recorded, and for women being postmenopausal at baseline, we registered the age at menopause. It was updated in the questionnaire after 16 years of follow-up. For those women with no available information on age at menopause, we used as cut-off point the 75th percentile of the age of menopause (52 years in our sample)(Reference Shivappa, Sandin and Löf19). Adherence to the Mediterranean dietary pattern was evaluated using the score proposed by Trichopoulou et al. (Reference Trichopoulou, Costacou and Bamia20) but excluding the alcohol item (range 0–8).
Statistical analysis
Quantitative baseline characteristics of participants were summarised with means and standard deviations, and qualitative traits with proportions across different body shape trajectories. To assess the relationship between body shape trajectories and the risk of BC, we fitted Cox proportional hazards regression models. We estimated hazard ratios (HR) and their 95 % CI for the groups of ‘childhood lean-midlife increase’, ‘childhood heavy-midlife stable’ and ‘childhood heavy-midlife increase’, compared with the ‘childhood medium-midlife stable’ (reference category). This was only possible when we analysed all probable BC cases. For the other analyses, we excluded women in the ‘childhood heavy-midlife increase’ category because of the small number of incident BC cases in this category (2 confirmed BC cases). We used age as underlying time variable and stratified our analyses by recruitment period (1999–2003, 2004–2009 and 2009–2015) and age (decades).
We first fitted models for overall BC incidence and then separate analyses according to menopausal status. Inception date was considered as the date of the baseline questionnaire for women older than 40 years at baseline or the day they turned 40 years during follow-up if they had been recruited at younger ages. Exit time was defined as the date of BC diagnosis for both confirmed and probable cases, date of death or last contact, whichever occurred first. We adjusted a first multivariable model including as potential confounders height, family history of BC (3 categories), smoking habit (3 categories), lifetime tobacco exposure (pack-years), age of menarche (3 categories), age at menopause (3 categories), obstetric history (5 categories), lifetime breast-feeding, current use of oral contraceptives at baseline, hormone replacement therapy and years of university studies. In a second multivariable model, we additionally adjusted for physical activity (metabolic equivalent-hours (MET-h)/week), alcohol consumption (g/d), adherence to the traditional Mediterranean diet (0–8), total energy intake (kcal/d) and consumption of sugar-sweetened drinks (servings/d). Proportional hazards assumption was tested with Schoenfeld residuals test and time-dependent covariates. As sensitivity analysis, we repeated our analyses additionally adjusting for BMI and including only participants with an APP > 80 %. The included BMI was BMI at inception, considered as the BMI of the baseline questionnaire for women older than 40 years at baseline or the BMI at the age of 40 years during follow-up if they had been recruited at younger ages.
Analyses were performed using STATA/SE version 15.0 (StataCorp), we used two-sided P-values and the statistical significance threshold was set a priori at 0.05.
Results
In Table 1, the main baseline characteristics are described according to the different body shape trajectories. For the final analysis, 6498 women were included. The overall mean BMI at inception was 22·6 (sd 3·1) kg/m2. The most frequent body shape trajectory was the category named as ‘childhood medium-midlife stable’ (53 %) followed by ‘childhood heavy-midlife stable’ (21 %). Participants included in the ‘childhood lean-midlife increase’ category were older, had a similar number of pregnancies (with a higher proportion of parous women having had the first pregnancy before the age of 30 years), also a longer lifetime breast-feeding, and they showed a higher proportion of postmenopausal status at baseline, compared with the other three categories. Women included in the ‘childhood heavy-midlife increase’ category presented higher BMI values and tended to be less physically active.
Table 1 Baseline characteristics of female participants in the Seguimiento Universidad de Navarra (SUN) Project, according to body shape trajectories, n 6498
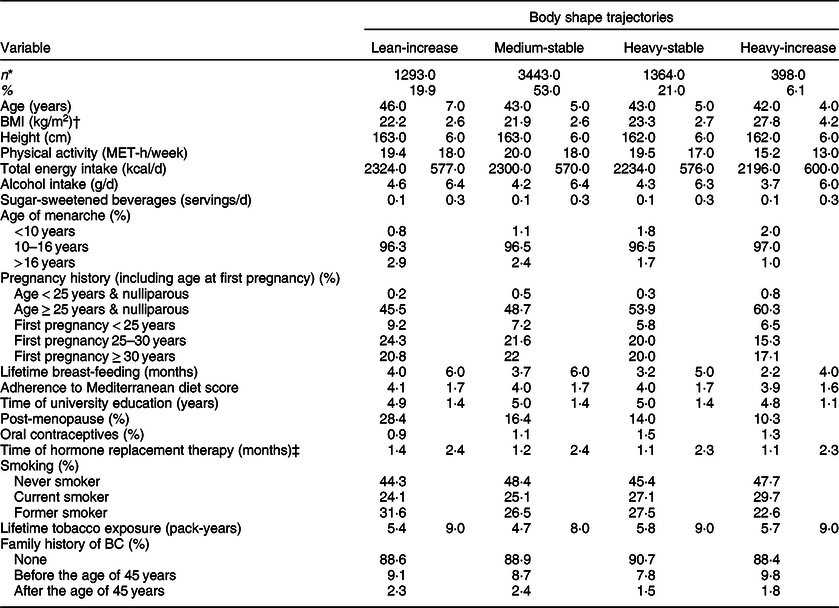
BC, breast cancer; MET, metabolic equivalent.
* Values represent means (standard deviations) unless otherwise stated.
† BMI at inception, considered as the BMI of the baseline questionnaire for women older than 40 years at baseline or the BMI at the age of 40 years during follow-up if they had been recruited at younger ages.
‡ Only among postmenopausal women.
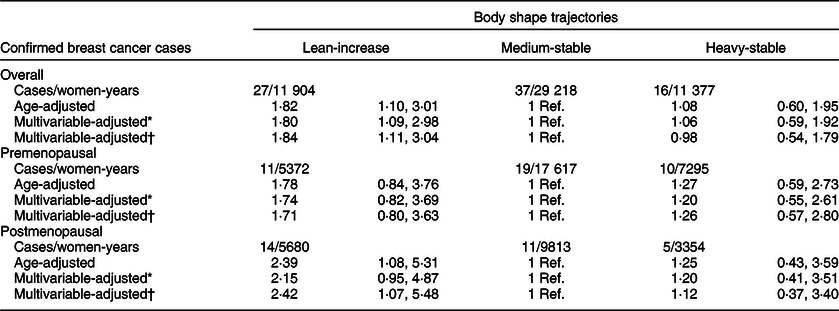
During a total follow-up of 54 978 women-years, 150 probable incident cases of BC were identified (eighty-two of these cases were confirmed). When we considered only confirmed BC cases (Table 2), the results showed a statistically significant higher risk for the women included in the ‘childhood lean-midlife increase’ trajectory (HR 1·84, 95 % CI 1·11, 3·04), after adjustment for potential confounders. Women in the ‘childhood heavy-midlife stable’ category showed no significant association with the risk of developing BC for confirmed cases (HR 0·98, 95 % CI 0·54, 1·79) when compared with the reference group.
Table 2 Hazard ratio (95 % CI) of breast cancer – confirmed cases – according to body shape trajectory in the Seguimiento Universidad de Navarra (SUN) Project
* Adjusted for height (cm), family history of breast cancer (no history, before 45 years, after 45 years), smoking habit (never, former or current smoker), lifetime tobacco exposure (pack-years), age at menarche (<10 years, 10–16 years or >16 years), obstetric history (5 categories), lifetime breast-feeding (months), use of oral contraceptives (yes/no) and years of university studies (years).
† Additionally, adjusted for Mediterranean diet adherence score (0–8), alcohol consumption (g/d), total daily energy intake (tertiles of kcal/d), physical activity (MET-h/week), consumption of sugar-sweetened beverages (servings/d). Only for postmenopausal women: hormone replacement therapy (yes/no), duration of hormone replacement therapy (months) and age at menopause (<50 years, 50–55 years or >55 years). Age as underlying time variable. Stratified analyses by recruitment period and age (decades).
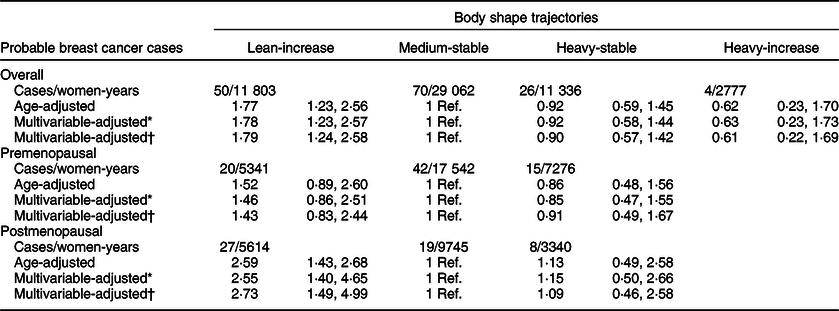
Table 3 shows the HR (95 % CI) for the risk of BC – probable cases – during follow-up according to body shape trajectories. After adjustment for potential confounders, compared with women who maintained medium during their midlife (‘childhood medium-midlife stable’ category (reference)), the HR (95 % CI) for BC was 1·79 (95 % CI 1·24, 2·58) in the ‘childhood lean-midlife increase’ group. The ‘childhood heavy-midlife stable’ and the ‘childhood heavy-midlife increase’ groups did not show a significant association with incident BC. These results barely changed when we additionally adjusted for BMI or when we restricted our analyses to participants with an APP > 80 %.
Table 3 Hazard ratio (95 % CI) of breast cancer – probable cases – according to body shape trajectory in the SUN Project
* Adjusted for height (cm), family history of breast cancer (no history, before 45 years, after 45 years), smoking habit (never, former or current smoker), lifetime tobacco exposure (pack-years), age at menarche (<10 years, 10–16 years or >16 years), obstetric history (5 categories), lifetime breast-feeding (months), use of oral contraceptives (yes/no) and years of university studies (years).
† Additionally, adjusted for Mediterranean diet adherence score (0–8), alcohol consumption (g/d), total daily energy intake (tertiles of kcal/d), physical activity (MET-h/week), consumption of sugar-sweetened beverages (servings/d). Only for postmenopausal women: hormone replacement therapy (yes/no), duration of hormone replacement therapy (months) and age at menopause (<50 years, 50–55 years or >55 years). Age as underlying time variable. Stratified analyses by recruitment period and age (decades).
When stratifying according to menopausal status, we separately estimated the risk for BC development for both confirmed and probable cases in the pre- and postmenopausal groups (Tables 2 and 3). The association between premenopausal BC risk and the analysed body shape trajectories was not statistically significant, neither for women in the ‘childhood heavy-midlife stable’ category (HR 1·26, 95 % CI 0·57, 2·80), nor for the participants in the ‘childhood lean-midlife increase’ group (HR 1·71, 95 % CI 0·80, 3·63) as compared with the reference category.
On the other hand, we found a significant higher risk of postmenopausal BC for both probable (HR 2·73; 95 % CI 1·49, 4·99) and confirmed cases (HR 2·42; 95 % CI 1·07, 5·48) when comparing the ‘childhood lean-midlife increase’ category with the reference ‘medium-stable’. No differences in the risk of postmenopausal BC were observed in the ‘childhood heavy-midlife stable’ category for both confirmed (HR 1·12, 95 % CI 0·37, 3·40) and probable cases (HR 1·09, 95 % CI 0·46, 2·58).
The results for both overall BC or pre-or postmenopausal BC barely changed when we additionally adjusted for BMI or when we restricted our analyses to participants with an APP > 80 %.
Discussion
In this Mediterranean cohort, four different trajectories were identified according to body shape evolution over life course. By comparing the risk of developing BC, we found a higher risk in those women who were lean during their childhood and experienced a marked increase during their midlife compared with those women who had a medium body shape during their lifespan.
The GBTM represents another way for studying the variation of the exposure over a life course. The main advantage of this new methodology is to facilitate causal inference by mapping long-term patterns. Song et al. (Reference Song, Willett and Hu10) performed a GBTM in two large ongoing US cohort studies: the Nurses’ Health Study and Health Professionals Follow-up Study(Reference Colditz, Manson and Hankinson21,Reference Rimm, Giovannucci and Willett22) . A higher risk of postmenopausal BC was observed for women in the lean-moderate (RR = 1·30, 95 % CI 1·17, 1·45) and lean-marked increase (RR = 1·41, 95 % CI 1·26, 1·58) groups compared with women in the lean-stable category(Reference Song, Willett and Hu10). In Europe, the GBTM was used in the French E3N cohort(Reference Fagherazzi, Guillas and Boutron-Ruault11). The authors estimated six lifetime body shape trajectories according to this approach, from ages 8 to 40 years. In this cohort, the investigators found no association between body shape trajectories and BC risk in the overall population and in the stratified analyses by menopausal status. Authors found an inverse association between adiposity at menarche and the risk for postmenopausal BC, independent of body fatness at other ages(Reference Fagherazzi, Guillas and Boutron-Ruault11).
Our findings are consistent with the Nurses’ Health Study and Health Professionals Follow-up Study(Reference Colditz, Manson and Hankinson21,Reference Rimm, Giovannucci and Willett22) and represent the first Mediterranean cohort to find an association between changes in body shape and the risk of developing BC. Furthermore, our cohort was younger (mean age 41 (sd 9·1) years), and our participants had a lower baseline BMI (mean BMI 22·6 (sd 3·1) kg/m2). These findings suggest that the risk of BC associated with changes in body shape of at least 2 points in body shape level – subsequently referred to as ‘heavy’ changes – is consistent across populations with different ages or BMI.
Body fatness can alter concentrations of many circulating hormones such as insulin, insulin-like growth factors, oestrogens, multiple adipokines and growth factors, creating an environment that may encourage breast carcinogenesis(Reference De Pergola and Silvestris23). More recent evidence has implicated obesity as associated with a low-grade chronic inflammatory state(Reference Feigelson, Patel and Teras24). Also, weight gain may lead to a relatively greater gain of fat mass compared with lean mass, especially with weight cycling(Reference Beavers, Lyles and Davis25). Both low muscle mass and increased adiposity may be metabolically linked to cancer via endocrine and inflammatory pathways mentioned above.
Early life (childhood and adolescence) has been hypothesised as a critical window for breast tumorigenesis(Reference Berkey, Frazier and Gardner26). At these ages, high rates of mammary gland tissue proliferation take place. Therefore, risk factors which act at this point may especially lead to molecular damage and, thus, increase BC risk later in life. When analysing separately pre- and postmenopausal BC, in our cohort, women who experienced a heavy change in their body shape in their early life and mid-adulthood were at the highest risk of developing specifically postmenopausal BC. Also, these results are in line with the available evidence showing a significantly increased risk of postmenopausal BC with increasing weight gain in adulthood(Reference Welti, Beavers and Caan27,Reference Keum, Greenwood and Lee28) , maybe due to a major influence of adipose tissue-derived oestrogen in breast carcinogenesis(Reference Rod, Hansen and Nielsen29).
On the other hand, for premenopausal BC, an inverse association between body fatness in childhood and adolescence and cancer risk has been described(Reference Michels, Terry and Willett30). In our cohort, women in the ‘heavy-stable’ trajectory showed a non-significant lower risk of premenopausal probable BC (HR 0·91, 95 % CI 0·49, 1·67). The lack of statistical significance may be due to limited statistical power.
The most important strength of this study is the prospective nature of the SUN Project ensuring temporal sequence between exposure and outcome. As far as we know, this is the first Mediterranean cohort to analyse the relationship between body shape trajectories and the risk of BC. Another important aspect in this study is the lifespan perspective that makes possible to compare body shape trajectories rather than BMI at a single measurement as an estimator of body fatness. The use of the BMI as a surrogate of adiposity might overestimate the amount of visceral adipose tissue in people with high BMI. This might be due to high lean mass. Therefore, BMI seems to have a limited ability in capturing the variation in body fat distribution. In addition, participants may not accurately recall their weight and height at different ages, but they may be more likely to better recall their body shape, an approach which allowed to use repeated measures of body shape throughout their lifespan. It is well known that cancer risk is a dynamic process where risk factors can impact in different ways according to life periods, making a life course perspective appealing. Another strength is that only incident BC cases were included in the final analysis. Last, self-reported cancer cases were confirmed via medical reports to ensure that the final diagnosis was an invasive breast carcinoma and not a benign tumour.
There are also some limitations that have to be acknowledged. First, the small number of incident BC cases in the cohort may limit the statistical power. Second, women in our study were relatively young, which may partially explain the low incidence of BC. Despite this, the identified age-adjusted BC incidence in the SUN Cohort was consistent with the reported incidence of BC in the Spanish population(Reference Galceran, Ameijide and Carulla31). Third, although a higher socio-economic status has also been associated with a higher incidence of BC, we had no available information on socio-economic status apart from years of university studies that were included in the multivariable analysis. Our sample was restricted to women with a high educational level since all were university graduates. Therefore, our sample is fairly homogeneous in this aspect, a fact that reduces the potential confounding effect by educational and socio-economic status. Fourth, a potential limitation of our study is the self-reported exposure that could be subject to recall bias and measurement error. Nevertheless, this tool has been previously validated(Reference Must, Willett and Dietz32), and since information on the exposure was collected before the BC diagnosis, any error could likely have attenuated the observed associations. Fifth, a misclassification in trajectory assignment might have happened. Nevertheless, we conducted a sensitivity analysis excluding participants whose trajectory assignment probability was <0·80, and this sensitivity analysis showed that our results were robust to modest trajectory misclassification. It must be acknowledged that the changes in body shape during the period comprised between the age of 5 and 20 years are not specifically assessed in the Stunkard’s pictograms. Given this, it is not possible to elucidate if these changes took place during childhood, early/late adolescence or if they have developed gradually. Sixth, the self-reported nature of the outcome assessment might have led to an underreporting of incident cases and thus to a lower sensitivity. Nevertheless, when we repeated our analyses considering only BC cases which had been blindly confirmed – with high specificity – by an oncologist, our results barely changed. With perfect specificity, the non-differential sensitivity of disease misclassification would not bias the measure of association(Reference Greenland, Lash, Rothman, Greenland and Lash33). Finally, information on potential confounders, such as physical activity, adherence to Mediterranean diet and alcohol consumption, was available only at study inception. If these variables are considered as surrogate markers of their values during childhood, they should be included as potential confounders in the multivariable-adjusted model. On the contrary, if these were posterior to body shape trajectories, adjustment for these variables could lead to over-adjustment. In any case, results barely changed when we adjusted for them.
In summary, women who were lean in their early life and experienced a marked increase in their body shape level had a significantly higher risk of developing breast carcinoma, especially for postmenopausal BC, when compared with women who remained stable in a medium body shape level. Together, these results emphasise the importance of a lifetime perspective when studying the impact of body fatness on cancer risk. Although further research should be fostered with the aim of better understanding the relationship between body shape changes and the precise impact on pre- and postmenopausal BC incidence, the existing knowledge can eventually be applied to health education and promotion interventions, through updating integrated instruments for cancer prevention (such as the European Code against Cancer)(Reference Schuz, Espina and Villain34) or even through the application of the operational findings to public health practice within the framework provided by National Cancer Control Programmes(Reference Espina, Soerjomataram and Forman35).
Acknowledgements
Acknowledgements: We thank other members of the SUN Group: Alonso A, Balaguer A, Barbagallo M, Barrientos I, Barrio-López MT, Basterra-Gortari FJ, Battezzati A, Bazal P, Benito S, Bertoli S, Bes-Rastrollo M, Beulen Y, Beunza JJ, Buil-Cosiales P, Canales M, Carlos S, Carmona L, Cervantes S, Cristobo C, de Irala J, de la Fuente-Arrillaga C, de la O V, de la Rosa PA, Delgado-Rodríguez M, Díaz-Gutiérrez J, Díez Espino J, Domínguez L, Donat-Vargas C, Donazar M, Eguaras S, Fernández-Montero A, Fresán U, Galbete C, García-Arellano A, García López M, GutiérrezBedmar M, Gomes-Domingos AL, Gómez-Donoso C, Gómez-Gracia E, Goñi E, Goñi L, Guillén F, Henríquez P, Hernández A, Hershey MS, Hidalgo-Santamaría M, Hu E, Lahortiga F, Leone A, López del Burgo C, Marí A, Marques I, Martí A, Martín Calvo N, Martínez JA, Martínez-Lapiscina EH, Mendonça R, Menéndez C, Molendijk M, Molero P, Murphy K, Muñoz M, NúñezCórdoba JM, Pajares R, Papadaki A, Parletta N, Pérez de Ciriza P, Pérez Cornago A, Pérez de Rojas J, Pimenta AM, Pons J, Ramallal R, Razquin C, Rico-Campà A, Ruano C, Ruiz L, Ruiz Zambrana A, Salgado E, San Julián B, Sánchez D, Sánchez-Tainta A, Sánchez-Villegas A, Santiago S, Schlatter J, Serrano-Martinez M, Toledo J, Tortosa A, Valencia F, Vázquez Z, Zarnowiecki D and Zazpe I. We thank very specially all participants in the SUN Cohort for their long-standing and enthusiastic collaboration and our advisors from Harvard TH Chan School of Public Health Walter Willett, Alberto Ascherio, Frank B. Hu and Meir J. Stampfer who helped us to design the SUN Project, the PREDIMED study and the PREDIMED-PLUS ongoing trial. Financial support: The SUN Project has received funding from the Spanish Government-Instituto de Salud Carlos III, and the European Regional Development Fund (FEDER) (RD 06/0045, CIBER-OBN, grants PI10/02658, PI10/02293, PI13/00615, PI14/01668, PI14/01798, PI14/01764, PI17/01795 and G03/140), the Navarra Regional Government (45/2011, 122/2014 and 41/2016) and the University of Navarra. Conflict of interest: None. Authorship: Conceptualisation, E.T. and R.S.-B.; methodology, C.S.-O.; validation, R.S.-B. and I.G.; formal analysis, R.S.-B. and E.T.; data curation, R.S.-B. and C.S.-O.; writing—original draft preparation, R.S.-B. and E.T.; writing—review and editing, all authors; supervision, A.G. and E.T.; project administration, E.T.; funding acquisition, E.T. All authors have read and agreed to the published version of the manuscript. Ethics of human subject participation: This study was conducted according to the guidelines laid down in the Declaration of Helsinki, and all procedures involving study participants were approved by the Institutional Review Board of the University of Navarra. Written informed consent was obtained from all subjects/patients.


