


Introduction
The concept of enzymatic conformational selection from ensembles of potential substrates generally envisions preferential interactions between discrete and/or inducible molecular states. The balance of kinetic and thermodynamic influences embedded within the respective energy landscapes of the interacting biological components dictates which species will most favorably interact to potentially illicit a particular biological outcome.
Efforts to explain such biological recognition events generally evoke selective interactions between multiple, discrete macro-states. This classic approach has yielded elegant cascades of inter- and intramolecular ‘binding events’ that map the ‘mechanisms’ or ‘modes of action’ of complex biological processes. However, within dynamic energy landscapes, macro-states can themselves be composed of probabilistic distributions and occupancies of potential substrates that depend on the state's energy, and the system's temperature. In such a statistical mechanical/ Boltzmann equilibrium distribution model, the lower energy states exhibit a higher probability of being occupied. That said, such enhanced occupancy does not ensure that these states will serve as the most favored binding partner (a.k.a. substrate, ligand, etc.). As proposed here, under kinetic and/or thermodynamic control, selective perturbation of a dynamic ensemble state distribution by the presence of a lesion, can induce a compensatory redistribution of other coupled dynamic states in a manner that alters the availability of enzyme competent substrates.
In this work, we expand the concept of conformational selection to include such dynamic considerations, while providing an experimental example of this phenomenon that evokes a redistribution of states within an ensemble of triplet repeat, DNA bulged-loop states. In such a Boltzman and Eyring-like assessment, we underscore the impact of dynamic energy landscapes on substrate selection. Specifically, we discuss the impact of such redistributions on the availability of enzyme competent substrates.
Experimental system: The dynamic DNA construct
We synthesized two partially complementary single strands; one 46-mer designated as [CAG]8, composed of eight central CAG triplet repeats sandwiched between two 11 base random sequence domains, and a 34-mer designated as [CTG]4 composed of four central CTG triplet repeats sandwiched between two 11mer domains that are Watson and Crick complementary to the 11 mer domains in the [CAG]8 46mer. As illustrated in Scheme 1, when these two strands are mixed, they form a duplex, [CAG]8⋅[CTG]4 , which formally contains a bulge loop composed of 4 CAG repeats. However, as we previously have demonstrated (Völker, Gindikin, Klump, Plum, and Breslauer, Reference Vőlker, Gindikin, Klump, Plum and Breslauer2012), due to the sequence degeneracy, individual molecules of this construct can dynamically adopt any one of 5 rollamer isomeric, bulged loop structures, where the position of the loop varies with respect to the 5′ end. Together these conformational isomers, named “rollamers’ to account for the dynamic interchange between them, comprise the overall ensemble of rollameric repeat bulge loop DNA states. In the second iteration of this construct, we inserted a chemically stable analog of the highly reactive naturally occurring abasic site, tetrahydrofuran (F) (Gelfand, Plum, Grollman, Johnson, and Breslauer, Reference Gelfand, Plum, Grollman, Johnson and Breslauer1998; Takeshita, Chang, Johnson, Will, and Grollman, Reference Takeshita, Chang, Johnson, Will and Grollman1987) in the 4th CAG repeat to assess the impact of this universal intermediate of DNA repair on the energy landscape of such a dynamic DNA domain. Abasic sites have been implicated in inducing triplet repeat expansion events in vivo (Lyons-Darden and Topal, Reference Lyons-Darden and Topal1999). To monitor the perturbation imposed by such a lesion, we also inserted two fluorescent bases as local reporters; (Datta, Johnson, LiCata, and von Hippel, Reference Datta, Johnson, LiCata and von Hippel2009; Datta, Johnson, and von Hippel, Reference Datta, Johnson and von Hippel2010; Jose, Datta, Johnson, and von Hippel, Reference Jose, Datta, Johnson and von Hippel2009) namely, 2-amino purine (2Ap) (Jean and Hall, Reference Jean and Hall2002; Jones and Neely, Reference Jones and Neely2015) for A in the 3rd CAG repeat, and pyrollo dC (pdC) (Berry et al., Reference Berry, Jung, Wise, Sercel, Pearson, Mackie and Somers2004; Hardman and Thompson, Reference Hardman and Thompson2006; Liu and Martin, Reference Liu and Martin2001) for C in the 6th CAG repeat of the dynamic 5 loop isomer domain. These features are illustrated in Scheme 1.

Scheme 1: [CAG]8⋅[CTG]4 Rollamer Isomers. Schematic representation of the 5 distinct rollamer isomers that can form when combining the [CAG]8 strand with its partially complementary [CTG]4 strand. Rollamer isomers are designated sequentially by roman numerals I-V starting from loop position at the 5′ end of the repeat domain (I) and ending with loop located at the 3′ end of the repeat domain (V). Loop position also determines the partitioning of the base-paired CAG/CTG triplets into either the 5′ and 3′ duplex stems upstream and downstream from the 4 (CAG) bulged loop as indicated by the numeric notation of X:Y for each isomer. Also the positions of the 2 intrinsically-fluorescent bases and the abasic site are color highlighted.
The schematic representation in Scheme 1 highlights how loop position determines the location in conformational space and local environment of the abasic site (F) (green dot) which replaces the G in the 4th CAG repeat, and the locations of the local spectroscopic probes, 2Ap (orange dot) in the 3rd CAG repeat, and pdC (blue dot) in the 6th CAG repeat. Specifically, the abasic site can partition into either the 3′ junction (Isomer I), a thermodynamically favorable position; the loop domain (Isomers II, III, and IV), a thermodynamically neutral position; or at the 5′ Junction (Isomer V), a thermodynamically unfavorable position as it leads to the loss of a base pair in the upstream duplex domain (Völker, Plum, Gindikin, and Breslauer, Reference Vőlker, Plum, Gindikin and Breslauer2019; Völker, Plum, Klump, and Breslauer, Reference Vőlker, Plum, Klump and Breslauer2009). Each of these loop isomers is characterized by a unique pattern of 2Ap and pdC fluorescence intensities determined by the corresponding partition of the fluorophores into either the loop or the duplex domain. In loop isomers I and II, 2Ap is located in the loop and pdC in the 3′ base-paired domain, whereas in loop isomers VI and V 2Ap is located in the 5′ base-paired domain and pdC located in the loop domain. For both fluorescent base analogous, which differ in their respective excitation and emission wavelength, fluorescence intensity is significantly quenched when the fluorophore partitions into the base-paired domain, and it is significantly enhanced when the fluorophore partitions into an unpaired loop domain. In loop isomer III both 2Ap and pdC are located in the loop domain, but stack upon one another on opposite sides of the loop and are consequently quenched. The use of light yellow/ light red coloring for individual repeat triplets in Scheme 1 is intended to indicate whether a given CAG repeat in a specific loop isomer belongs to the 5′ half or the 3′ half of the sequence in sequence space. Loop positions determine the number of base-paired CAG⋅CTG repeats that partition to either the upstream or downstream duplex domains, as indicated by the designations 0:4, 1:3, 2:2, 3:1 or 4:0 for upstream: downstream ratios. We find that this partitioning impacts the thermodynamic stability and melting temperature of the corresponding upstream and downstream duplex domains. The arrows indicate the reversible elementary loop migration steps between different isomers.
Note that as identified in Scheme 1 the 5 different loop isomers within the global, dynamic, bulged loop duplex ensemble macrostate of [CAG]8⋅[CTG]4, are energetically distinct due to the position-dependent thermodynamic impact of the abasic site and the two fluorescent base analogs (Völker et al., Reference Vőlker, Plum, Klump and Breslauer2009). They also are expected to be differentially recognized and processed by the APE1 repair enzyme (Li, Völker, Breslauer, and Wilson, Reference Li, Vőlker, Breslauer and Wilson2014). Based on studies with abasic site containing static repeat bulge loops, we anticipate the following differential outcomes: positioning of the abasic site at the thermodynamically favorable 3′ duplex junction (isomer I) does not yield a viable APE1 site; positioning of the abasic site at one of several thermodynamically neutral positions within the loop domain, (isomers II,III, & IV), also does not produce viable APE1 sites; positioning of the abasic site at the thermodynamically unfavorable 5′ junction of the loop (isomer V), however, yields a potential viable APE1 site. As outlined in table I, such loop distributions result in characteristic patterns of 2Ap and pdC fluorescent intensities based on the differential partitioning of the fluorophores into either the highly fluorescent loop or the highly quenched duplex domains. Consequently, these patterns allow us to identify the dominant loop isomer, while also revealing insight into loop isomer distribution for a given set of conditions.
Table I: Local spectroscopic consequences of loop isomers

In Isomer III, both 2Ap and pdC are found within the loop, yet they are opposite each other and likely stacking upon one another. Evidence suggests that such placement within the loop leads to a degree of quenching in both fluorophores. (see also single strand fluorescence).
Table I summarizes the thermodynamic and spectroscopic impact of the abasic site in the 4th CAG repeat (indicated in green), 2Ap in the 3rd CAG repeat (red) and pdC in the 6th CAG repeat (blue) for the 5 different rollamer isomers shown in Scheme 1. For each of the 5 isomers (identified by their roman numeral designation), we specify where the modification is located (upstream duplex = US duplex, Loop, Loop junction on 3′ or 5′ site, or downstream duplex = DS duplex), and the expected fluorescence signal (up arrow ↑ = increase in fluorescence intensities; down arrow ↓ = decrease in fluorescence intensity, horizontal arrow ↔ = no change in fluorescence intensity) at the respective excitation wavelength. The thermodynamic impact of the abasic site location ( + stabilizing, 0 unchanged, and - destabilizing) is based on prior DSC studies with static and dynamic bulge loops. (Völker et al., Reference Vőlker, Plum, Gindikin and Breslauer2019; Völker et al., Reference Vőlker, Plum, Klump and Breslauer2009).
Background
In a 2008 PNAS article, we introduced the concept of complex/rough DNA energy landscapes containing ensembles of microstates possessing different energy levels within a static, metastable, repeat, bulge loop macrostate (Völker, Klump, and Breslauer, Reference Völker, Klump and Breslauer2008). In a subsequent JACS article, we demonstrated the existence of multiple, isoenergetic, dynamic rollameric loop isomers, each with its own microstate energy distribution within a larger repeat domain (Völker et al., Reference Vőlker, Gindikin, Klump, Plum and Breslauer2012). In the nomenclature used here, macrostates are defined as dynamically interconverting bulge loops (i. e. the individual, ‘rollameric,’ isomers shown in Scheme 1), that each represents local minima on the energy landscape. As such, by definition, they are partially insulated by activation energy barriers. The magnitude of the activation energy barriers between dynamically interconverting bulge loops is as yet unknown but one can posit that the maximum barrier height is simply the free energy cost of unfolding the entire loop plus 3 base pairs needed to allow movement. One can also posit, based on recent single-molecule measurements (Hu, Morten, and Magennis, Reference Hu, Morten and Magennis2021; Xu, Pan, Roland, Sagui, and Weninger, Reference Xu, Pan, Roland, Sagui and Weninger2020) and our own unpublished data that a minimum barrier height is given by a sliding/migrating mini bulge of 3 nucleotides moving across the larger repeat bulge to allow migration. Conceptually, in a dynamic landscape, each macrostate consists of a ‘family’ of more rapidly interconverting/fluctuating, energetically similar conformations; a framework similar to that recently described for a different DNA construct as ‘microstates’ by von Hippel and co-workers (Israels et al., Reference Israels, Albrecht, Dang, Barney, von Hippel and Marcus2021). However, unlike the constructs studied by the von Hippel group, which exhibit relatively low energy barriers between fluctuating micro and macrostates and are characterized by fast lifetimes, the DNA states involved in our system are separated by significant energy barriers due to strong intraloop interactions between bases in the repeat loop. As such, the lifetimes of the different micro and macrostates in our constructs are significantly longer than those observed by von Hippel et al., and the ensembles can be evaluated using the slow time constant ensemble averaging methods employed here. This increased level of complexity/roughness in such microstate- macrostate dynamic interconversions can be represented using a Karplus/Wales discontinuity graph type analysis of the energy landscape (Krivov and Karplus, Reference Krivov and Karplus2002; Krivov and Karplus, Reference Krivov and Karplus2004; Wales, Miller, and Walsh, Reference Wales, Miller and Walsh1998; Wales, Reference Wales2012). Such an approach creates point and line-based reductionist profiles for continuous energy landscapes focused on fluctuations around local energy minima; a form of coarse-graining (Scheme 2). In this scheme, each node corresponds to a macrostate, and the rapidly interconverting microstates are those lines ending without a node. This representation is attractive for the study reported here, since it lends itself to demonstrate the increasing complexity and analysis of our ensemble average experimental data. In a subsequent Biomolecules paper (Völker et al., Reference Vőlker, Plum, Gindikin and Breslauer2019), we showed that DNA ‘lesions’ alter the equilibrium distribution of loop isomers by imposing an energy penalty/gain on certain isomeric states. We proposed how such lesion-induced redistribution of micro- and macrostates could influence biological processes by favoring bulged loop isomers that are either better or worse substrates for DNA processing enzymes. In this study, we expand this concept of conformational selection, while providing an experimental example of this phenomenon that evokes a redistribution of states within and between ensembles of dynamic, bulged-loop states that collectively constitute the average potential substrates most frequently considered. In such a Boltzman and Eyring-like assessment, we underscore the impact of dynamic energy landscapes. Specifically, we exploit a kinetic trap that occurs upon annealing of our DNA constructs, allowing us to distinguish between kinetically controlled ensemble (re)distributions versus thermodynamically controlled ensemble (re)distributions, a distinction of importance in defining the origins of DNA biological regulation. For protein systems, Frauenfelder has underscored this fundamental principle when distinguishing between relaxation and fluctuation motions to contrast motions from non-equilibrium to and within equilibrium distributions (Austin, Beeson, Eisenstein, Frauenfelder, and Gunsalus, Reference Austin, Beeson, Eisenstein, Frauenfelder and Gunsalus1975; Frauenfelder, Sligar, and Wolynes, Reference Frauenfelder, Sligar and Wolynes1991). In the DNA examples presented here, the fluctuation motions are the same as the relaxation motions. As a result, the only feature that changes is the fraction of molecules (e.g. the flux) that undergoes specific motions. Here we employ multi-parametric measurements to probe the balance between kinetic and thermodynamically controlled micro- and macro-state redistributions in our dynamic DNA system, while discussing the impact of this redistribution on the availability of enzyme-competent substrates. In this context, it is worth underscoring that the potential ‘biological’ existence of such metastable, frozen states, as well as the rollamer dynamics, are reflective of a level of longer-lived roughness/complexity within the DNA energy landscape that, in addition to fluctuations over faster time domains, collectively should be considered when mapping in vivo biological pathways.
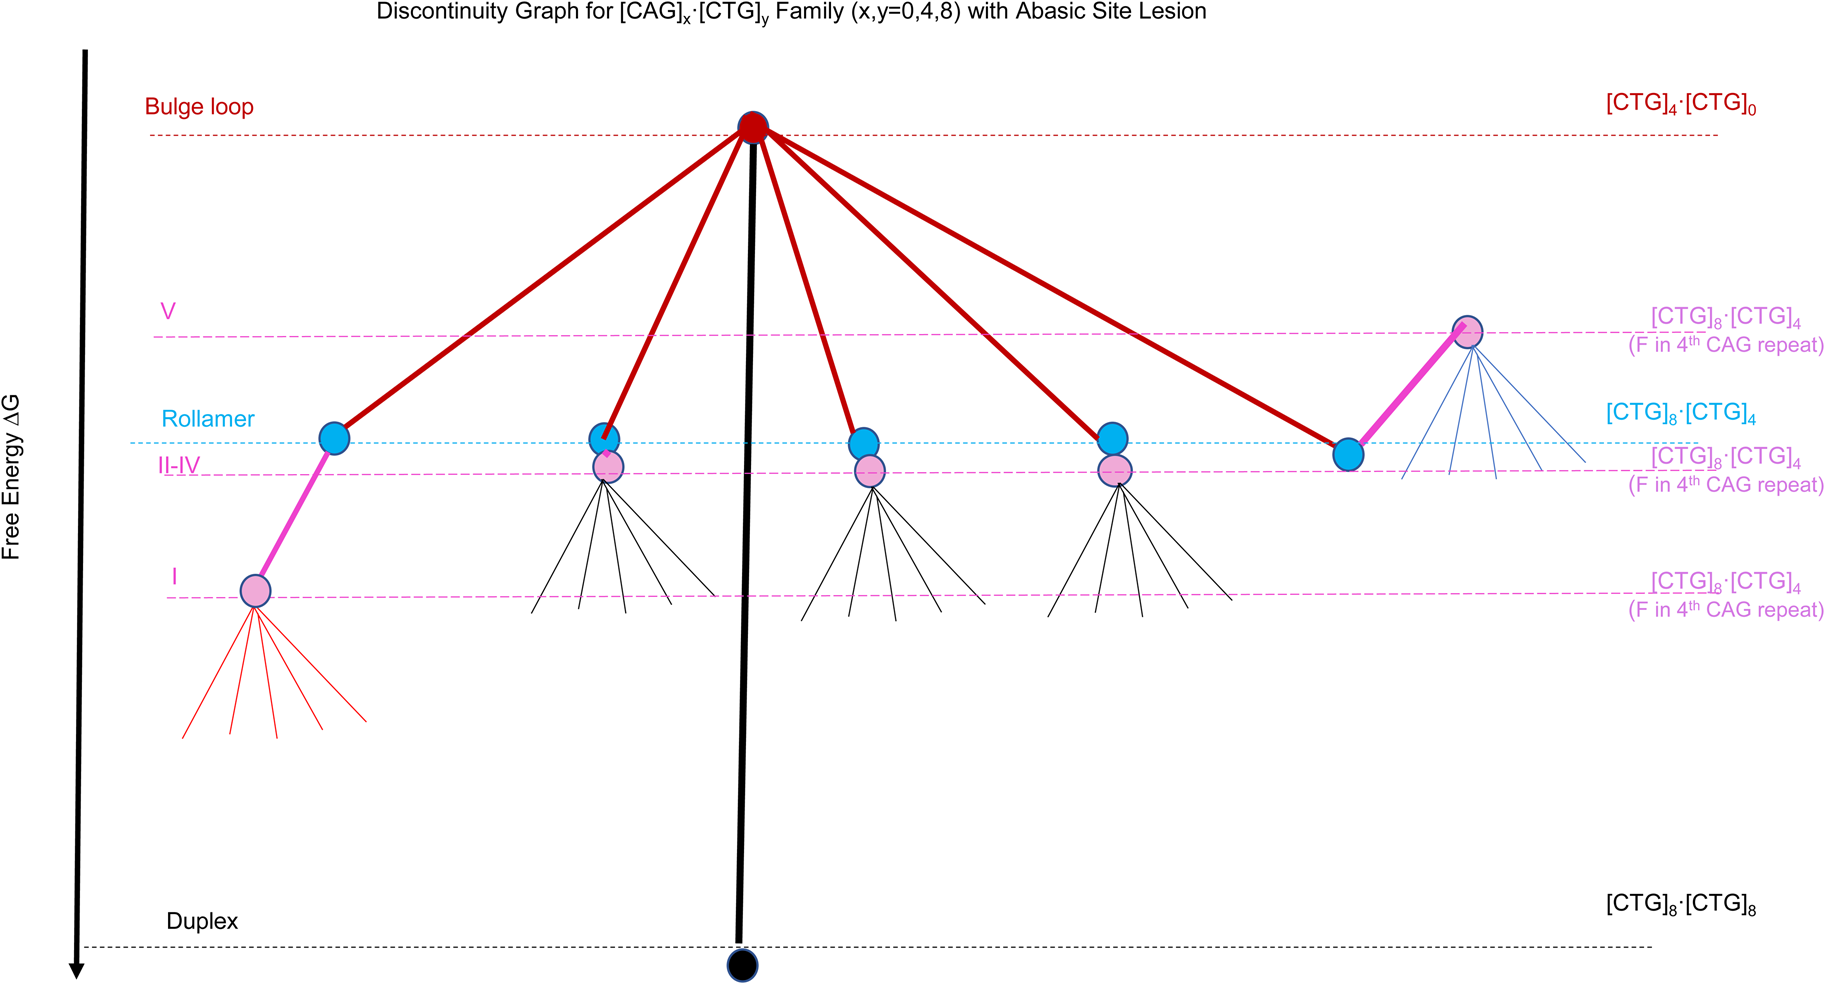
Scheme 2: Discontinuity graph representation of the complex energy landscape of triplet repeat DNA sequences as modeled by the example of the [CAG]x⋅[CTG]y (x, y = 0.4,8) oligonucleotide systems. The colored dots (nodes) represent the different DNA conformational states named on the left, with black for the Watson& Crick Duplex, red for a static bulge loop, light blue for the 5 (energetically equivalent) rollamer states, and magenta for the 5 (energetically non-equivalent) rollamer isomers when there is an abasic site in the 4th CAG repeat. Listed on the right hand side are the oligonucleotides complexes we used to model the different conformational states.
To assess general features of the different levels of complexity available to repetitive sequences we systematically generated model oligonucleotide constructs based on [CAG]x⋅[CTG]y (x,y = 0, 4, 8) sequences, with a focus on a unique bulge loop size of 4 (CAG) repeats. Specifically, we find that the lowest energy level is occupied by the singular, fully Watson and Crick base-paired duplex state ([CAG]8⋅[CTG]8 (indicated by the black dot/node in Scheme 2)). The partial unfolding of the duplex allows for the formation of a fold back bulge loop in competition with the duplex, here modeled by [CAG]4⋅[CTG]0 for a 4 repeat fold back bulge loop structure and indicated by the red dot/node in Scheme 2. Energy loss through disruption of Watson and Crick base pairing is partially offset by energy gain through intra loop base pairing (Völker, Makube, Plum, Klump, and Breslauer, Reference Vőlker, Makube, Plum, Klump and Breslauer2002; Völker, Klump, and Breslauer, Reference Vőlker, Klump and Breslauer2007; Völker et al., Reference Vőlker, Plum, Klump and Breslauer2009). The 4 repeat bulge loop fold back structure was chosen here specifically as it is the smallest loop structure that shows typical features of the CAG repeat loop self-structure (Völker, Plum, Gindikin, Klump, and Breslauer, Reference Vőlker, Plum, Gindikin, Klump and Breslauer2014). If such a fold-back bulge loop structure forms within a larger repeat sequence domain, it is not confined to a single position, but can redistribute to energetically equivalent positions within the repeat domain (ensemble of rollamers); here modeled by [CAG]8⋅[CTG]4, and indicated by light blue dots/nodes in Scheme 2. Such loop redistribution is favored through a gain in Boltzman entropy (Völker et al., Reference Vőlker, Gindikin, Klump, Plum and Breslauer2012). Chemical modification of the repeat sequences, here modeled through the incorporation of a site specifically incorporated abasic site in the center of the repeat domain (4th CAG repeat), shown in purple, disrupts the energy equivalence of the rollamer loop positions ((Völker et al., Reference Vőlker, Plum, Gindikin and Breslauer2019; Völker et al., Reference Vőlker, Plum, Klump and Breslauer2009), resulting in an energy gain for some isomers (here isomer I), no net effect for other isomers (isomers II-IV) or an energetic cost for some isomers (here isomer V), thereby differentially impacting the loop distributions/occupancies. For topological reasons, a similar position-dependent impact of the same DNA lesion is impossible within the Watson and Crick duplex domain. Finally, within a given loop isomer, we find different energy levels, here indicated as thin lines not ending in dots/nodes. This feature reflects the rough energy landscape due to ensembles of microstates possessing different energy levels within a given metastable, repeat bulge loop state, which is reflective of fluctuations around local energy minima of loop macrostates (Völker et al., Reference Völker, Klump and Breslauer2008). Here we focus our discussion on the complex energy landscape that results from considering a bulge of 4 triplet repeats in the CAG strand only. An equivalent argument also can be made for repeat bulge loops in the CTG repeat strand. As is apparent from the example discussed, the energy landscape for the simple [CAG]8⋅[CTG]8 repeat sequences is exceedingly complex, even when one allows only for defined bulge loop sizes as partially folded intermediates. When one takes into account the possibility of larger or smaller size repeat bulge loops with their correspondingly altered free energy levels and loop isomer distributions the complexity and roughness of the energy landscape substantially increases.
In summary, the presence of an abasic lesion and two fluorescent base analogs within the repeat domain disrupts the energetic degeneracy of the rollameric repeat DNA energy landscape. This occurs by either lowering or increasing the local energy minimum of specific rollameric isomers relative to the corresponding, degenerate lesion-free state. This lesion-induced disruption of degenerate rollameric states results in preferential occupancy of specific loop isomer positions relative to others. This impact, which can result from any chemical alteration that disrupts the triplet repeat, including sequence mutations, is a consequence of the 3-dimensional arrangement of the repeat bulge loop system, as opposed to the pseudo-2-dimensional arrangement of conventional Watson Crick duplex DNA. We expect and find the lesion impact on the repeat DNA energy landscape to be dominated primarily by contributions from the abasic site lesion (Gelfand et al., Reference Gelfand, Plum, Grollman, Johnson and Breslauer1998; Sagi, Guliaev, and Singer, Reference Sagi, Guliaev and Singer2001), considering the relatively smaller thermodynamic impact of replacing natural bases by their fluorescent base analogs (Jahnz-Wechmann et al., Reference Jahnz-Wechmann, Lisowiec-Wachnicka, Framski, Kosman, Boryski and Pasternak2017; Law, Eritja, Goodman, and Breslauer, Reference Law, Eritja, Goodman and Breslauer1996; Zhang and Wadkins, Reference Zhang and Wadkins2009). The combination of 2Ap and pdC fluorescence signals yields insight with respect to preferential loop occupancies and loop distributions. Below we describe how such lesion-induced complexity in the dynamic, rollameric energy landscape of potential DNA substrates can alter repair outcomes, despite the lesions always having the same sequence neighbors. To this end, we correlate the biophysical properties of these different micro- and macrostate characteristics with their ability to be recognized and processed as substrates by APE1, a critical DNA repair enzyme.
Materials and methods
Materials: Oligonucleotides were synthesized in our lab on a 10 μmole scale by standard phosphoramidite chemistry using an Äkta DNA synthesizer. Oligonucleotides were purified by DMT-on and subsequent repeated DMT-off reverse phase HPLC, as previously described.(Völker et al., Reference Vőlker, Makube, Plum, Klump and Breslauer2002; Völker et al., Reference Vőlker, Klump and Breslauer2007; Völker et al., Reference Vőlker, Plum, Klump and Breslauer2009; Völker, Plum, Klump, and Breslauer, Reference Vőlker, Plum, Klump and Breslauer2010; Völker et al., Reference Vőlker, Gindikin, Klump, Plum and Breslauer2012) The purities of the oligonucleotides were assessed by analytical HPLC and ion spray mass spectroscopy, and were found to be pure by analytical HPLC and better than 98% pure by mass spectroscopy. Purified oligonucleotides were dialyzed using dispo-dialyzers with MWCO 500 Da (Spectrum, CA) against at least two changes of pH 6.8 buffer containing 40 mM Cacodylic acid/Na-Cacodylate, and 0.1 mM Na2 EDTA and sufficient NaCl to yield a final concentration of 100 mM in Na+ ions. Molar extinction coefficients of the parent DNA oligomers were obtained by continuous variation titrations (Job plots)(Job, Reference Job1928) with the complementary parent oligonucleotide lacking repeats ([CAG]0, [CTG]0). The extinction coefficients established in this manner were ε[CAG]8 (260 nm, 90 °C) = 420 000 M−1 cm−1 and ε[CTG]4 (260 nm, 90 °C) = 271 100 M−1 cm−1. The oligonucleotide designated [CAG]8 contains two fluorescent bases analogs in place of normal Watson and Crick bases (2Ap and pdC) in the 3rd and 6th repeat, respectively, and an abasic site in place of G in repeat 4. Extinction coefficients of complementary parent oligonucleotide lacking repeats ([CAG]0, [CTG]0) were determined by phosphate assay under denaturing conditions (90 °C) as previously reported (Plum, Reference Plum2000; Snell and Snell, Reference Snell and Snell1972) and were found to be:; ε[CAG]0 (260 nm, 90 °C) = 190 400 M−1 cm−1; ε[CTG]0 (260 nm, 90 °C) = 186 200 M−1 cm−1.
Spectroscopy: Circular Dichroism spectra (CD), UV absorption spectra, 2-Amino purine and pyrollo dC fluorescent excitation spectra at their emission maximum of 370 nm and 460 nm, respectively, were recorded simultaneously using an Aviv 435 fluorescent CD spectrophotometer. The design of the instrument allows for the simultaneous detection of CD spectra and UV spectra in one direction and fluorescent spectra at right angles to the incident beam on the same sample. Spectra between either 360 nm and 205 nm (monitoring 2Ap excitation at 370 nm) or 400 nm and 205 nm (monitoring pdC excitation at 460 nm) as a function of temperature for all 4 observables were collected every 2°C in 1 nm increments using a 2 s averaging time, with a 60 s temperature equilibration time prior to the measurement. Buffer spectra obtained in the same manner were subtracted from sample spectra and the resulting wavelength/temperature/intensity matrix was subjected to singular value decomposition (SVD) (Haq, Chowdhry, and Chaires, Reference Haq, Chowdhry and Chaires1997; Johnson, Reference Johnson1992) in order to identify the minimum number of significant components needed to describe the data and to reduce experimental noise. Prior to these measurements, it was experimentally confirmed that the 2Ap- and pdC emission maxima are not significantly dependent on excitation wavelength and sample conformation, and as such excitation scans recorded at a fixed emission wavelength provide an accurate reflection of fluorophore emissions. We also did not detect any signs of photobleaching during the time course of our experiments. Oligonucleotide strand concentrations were either 2 μM (1 × 1 cm fluorescent cell) or 15 μM in strand (0.1× 1 cm fluorescent cell). Bulge loop samples were prepared on ice just prior to use by mixing the appropriate amount of the two strands from concentrated stock solutions obtained after extensive dialysis.
Preparation of Kinetically Trapped and Equilibrium Distributions of Ensemble States and their interconversions: Unless otherwise stated, kinetically-trapped samples were prepared by mixing cold (incubated in an ice bath) [CAG]8 strand with cold [CTG]4 strand in a 1:1 ratio and allowing initial annealing on ice to ensure the consistent formation of the kinetically trapped distribution of rollamers. Equilibrium distributions of the rollamer state were established by heat annealing the sample prepared as described above for 5 min at either 60°C (Cacodylate buffer) or 75°C (APE1 enzyme buffer containing MgCl2). The strong temperature dependence of all spectroscopic signals, but especially that of 2Ap fluorescence, required that, unless otherwise stated, spectra were recorded at a common reference temperature of 0 °C to allow comparison.
APE1 enzyme digestion: 1:1 mixtures of [CAG]8 and [CTG]4 ((2μM) was prepared in our conventional 100 mM Na+ buffer supplemented with 2 mM MgCl2 and incubated on ice or preheated to 75 °C to generate either the initial kinetically trapped rollamer distribution or the final equilibrium distribution. MgCl2 supplementation, necessary for APE1 activity (Wilson, Reference Wilson2005), does shift the temperature profiles of rollamer transitions to higher temperatures without altering the nature of the transitions. The sample was placed in a 1 × 1 cm fluorescent cell at 35 °C and was incubated with 10μl of APE1 enzyme (M0282L 10 000U/ml) purchased from New England Biolabs (Ipswich, MA), while monitoring the fluorescence of 2Ap at 370 nm (excitation at 305 nm) as a function of time. UV, CD and 2Ap (370 nm emission) and pdC fluorescence (460 nm emission) excitation spectra of the samples were obtained immediately prior to the addition of APE1, as well as after incubation for 20 000 s, and after heat equilibration/ denaturation of residual APE1 after digestion. Heating to 75 °C to heat equilibrate the rollamer distribution also heat dentures APE1 enzyme. CD and UV spectra, and 2Ap/pdC excitation spectra at their respective emission maximum, before and after APE1 digestion, as well as after heat annealing at 75°C after APE 1 digestion, were obtained as described. Spectra were always recorded at a common reference temperature of 0°C regardless of prior treatment to take account of the pronounced temperature dependence of the fluorescent properties in particular. After completion of the digestion, samples were also placed in an Aviv 14DS UV/VIS spectrophotometer and the absorbance at 260 nm averaged over 4 s was recorded as a function of temperature between 5 °C and 95 °C in steps of 0.5 °C. DNA samples digested by APE1 melt at a lower temperature than samples that remained undigested due to the break in the backbone catalyzed by APE1. From the relative proportions of the hypochromic shift at the low and high temperatures, we estimated the fraction of DNA digested by APE1 for each sample.
Results and discussion
Kinetically trapped versus equilibrium distributions of rollamers:
In this section, we present spectroscopic evidence that combining the [CAG]8 and [CTG]4 single strands leads to the formation of an initial ensemble distribution of (CAG)4 repeat loop rollamers that is strongly influenced by the nature of the [CAG]8 and [CTG]4 single strand order/structure; which, in turn, depends on the hybridization conditions. We also demonstrate that this initial distribution of loop isomers represents a kinetically trapped state.
Figure 1 compares the CD - and UV -spectra, and the 2Ap- and pdC fluorescence excitation spectra of the two single strands ([CAG]8 (red) and [CTG]4 (green)), with those of the 1:1 complex before (blue) and after heat annealing at 60°C (black). The set of four spectra for a given sample was measured simultaneously by our combined fluorescence /CD instrument, so that the four different spectral properties can be unambiguously assigned to the same sample state, and are not influenced by differences in sample preparation or instrument variation. The data presented in Fig. 1 reveal a number of significant points/observations that are elaborated on within the sections that follow below.

Figure 1: Shows the CD spectra (Panel A), UV spectra (Panel B), 2Ap fluorescence excitation spectra monitored at the 2Ap emission maximum of 370 nm (Panel C), and the pdC fluorescence excitation spectra monitored at the pdC emission maximum of 460 nm (Panel D), of the [CAG]8 single strand (red), that of the partially complementary [CTG]4 single strand (green), and that of the 1:1 complex before (blue) and after transiently heating to 60°C (black). All spectra were recorded at 0 °C.
Spectroscopic evidence for the distribution of loop isomers upon complex formation
The first observation worthy of note is that 1:1 complex formation leads to an increase in both 2Ap and pdC fluorescence relative to the single-stranded state. Since 2Ap and pdC fluorescence increases when these bases become solvent-exposed, clearly bulge loop formation leads to a decrease in the degree of order/stacking encountered by both fluorophores relative to the single strand structure. A high degree of single-strand order in the CNG repeat domains has been widely reported in the literature and is generally considered the basis for the propensities of CNG repeats to miss-fold (Amrane et al., Reference Amrane, Sacca, Mills, Chauhan, Klump and Mergny2005; Figueroa, Cattie, and Delaney, Reference Figueroa, Cattie and Delaney2011; Gacy, Goellner, Juranic, Macura, and McMurray, Reference Gacy, Goellner, Juranic, Macura and McMurray1995; Hu et al., Reference Hu, Morten and Magennis2021; Huang et al., Reference Huang, Chang, Kao, Chin, Ni, Hsu and Hou2017; Paiva and Sheardy, Reference Paiva and Sheardy2004; Petruska, Arnheim, and Goodman, Reference Petruska, Arnheim and Goodman1996; Xu et al., Reference Xu, Pan, Roland, Sagui and Weninger2020). Prior to bulge loop formation this high degree of single-strand order is also inferred by the strong CD signal of the two isolated single strands at low temperature, as well as by the single strand melting curves shown in the supplementary material. As outlined in Scheme 1 and table I, bulge loop formation either partitions 2Ap into the unquenched loop domain, while pdC simultaneously partitions into the fully quenched duplex domain (isomers I & II), or vise versa (Isomers IV & V). Only in Isomer III are both pdC and 2Ap in the loop domain. However, in this isomer both fluorophores are opposite one another in the loop domain and likely stack upon each another, resulting in significant quenching similar to what is seen in the [CAG]8 single strand. A simultaneous increase in the fluorescence intensity of both fluorophores is possible if, rather than forming a unique bulge loop structure, 1:1 complex formation at low temperature initially results in the simultaneous formation of some or all of the potential loop isomers proposed in scheme 1. The relative differences in the magnitude of the observed fluorescence change of the two local probes upon rollamer formation suggest that the proportion of loop isomers is not purely statistically distributed, with isomers containing 2Ap in the loop domain being somewhat preferred over loop isomers with pdC in the loop domain. The formation of a non-statistical distribution of loop isomers is impacted by the nature of the [CAG]8 single strand self-structure, where the abasic site can act as a central hinge in the repeat domain. Such a flexible hinge would favor specific fold-back alignment of the bases in the single strand repeat domain that leads to the preferential formation of specific repeat bulge loop isomers over others. In the aggregate, the fluorescence data, therefore, support the view that complex formation at low-temperature results in an ensemble distribution of loop isomers where the 5 potential loop isomers are variably populated.
Evidence for redistribution of loop isomers upon heat annealing after complex formation
A second significant observation in Fig. 1 is the similarity in the CD and UV spectra for the 1: 1 complex, versus the significant differences in fluorescence intensity of the local spectroscopic probes, 2Ap and pdC, before and after heat annealing at 60 °C. Specifically, there is no change in the CD or absorbance signal upon heat annealing the 1:1 complex relative to the spectra recorded prior to annealing. By contrast, we observe a very pronounced increase in 2Ap fluorescence, and some subtle changes in pdC fluorescence upon heat annealing. Note that the 60 °C annealing temperature is well below the melting temperature of the bulge loop complex (~78–80 °C), but above the temperature where fluorescent melting studies (not shown) indicate that all irreversible fluorescent changes have occurred. The lack of change in the UV and CD spectra upon heat annealing suggest that the global structure of the 1:1 complex is fully formed in the time it takes to record the spectra, irrespective of annealing conditions. The term ‘global structure’ as used here means that the basic pattern of base-paired and loop domains that contribute to the CD and UV signal is fully formed, without regard to the distribution of loop positions. The latter does not impact the CD or UV signals, which report global parameters such as the number of bases in the loop, the number of base pairs in the duplex domains, and the nature of the duplex/ loop junctions, all of which are the same in all rollamer isomers, regardless of loop position. By contrast, the significant increase in 2Ap fluorescence suggests that the local environment around the 2Ap base is altered significantly by heat annealing. The pdC excitation spectrum remains mostly the same before and after heat annealing, with the exception of the appearance of a new excitation band between 280 nm and 320 nm. This new pdC excitation band exactly corresponds to the excitation peak of 2Ap and likely can be ascribed to an energy transfer from the much enhanced 2Ap emission after heat annealing, rather than a change in the absorbance properties of pdC. Of note, the pdC excitation spectrum partially overlaps the 2Ap emission spectrum, such that radiative fluorescence energy transfer is a reasonable expectation.
Given that the global structure of our rollamer complex remains unchanged, we propose that the change we observe in 2Ap fluorescence upon heat annealing reflects the redistribution of the loop ensemble in favor of loop isomers that partition 2Ap in the bulge loop domain. Such a loop redistribution does not alter the global rollamer structure, as detected by the UV and CD spectra, but it does alter the environment around the local spectroscopic probes, 2Ap and pdC, as outlined in Scheme 1 and table I. From the temperature response of the 2Ap fluorescence, it is clear that the initial distribution of loop isomers in the rollamer ensemble differs from that after heat annealing, reflective of a kinetically trapped metastable distribution. In the following section, we show that the difference in the distribution of rollamer isomers before and after heat annealing depends on the temperature at which the rollamer is prepared from its component single strands.
The role of single-strand preorder in determining rollamer loop isomer distribution
To test to what extent hybridization conditions influence the initial rollamer distribution, we incubated the two single strands at a range of temperatures, mixed the strands and allowed rollamer formation to proceed at the incubation temperature for a few minutes before recording the CD -, UV-, 2Ap and pdC fluorescence excitation spectra. Although the mixing was performed at different temperatures, all spectra are collected at a common reference temperature (0°C), eliminating any temperature-dependent spectral effects, particularly from the fluorescence spectra. The maximum incubation temperature chosen was 35°C, where loop redistribution from the initial complex formed at lower temperatures is still very slow. Spectra for different incubation temperatures were compared to those of the heat annealed (60 °C) sample. Figure 2 shows that the 2Ap fluorescence intensity of the complex initially formed progressively increases as the incubation temperature for the formation of the initial rollamer complex is increased. This increase in 2Ap fluorescence however is not matched by a corresponding change in CD signal (Fig. 2B), regardless of incubation temperature. Not shown is a similar lack of response to incubation temperature and/or heat annealing for the UV spectrum and the pdC fluorescence excitation spectrum (except for the 2Ap fluorescence energy transfer band at 280–340 nm).

Figure 2: (A) Shows the 2Ap excitation spectra and (B) the corresponding CD spectra for the 1:1 complex measured simultaneously at 0 °C after preincubation of the [CAG]8 and [CTG]4 single strands on ice (0 °C, red curve), at 29 °C (green curve) and 35 °C (blue curve) followed by 1:1 mixing to allow complex formation. Samples were then cooled to 0 °C and the CD and fluorescence excitation spectra were recorded. Subsequently, we also recorded the CD and fluorescence excitation spectra at 0 °C of each sample after heat annealing at 60 °C (here shown in black). Note the incubation temperature dependence of the 2Ap fluorescence spectra that is not seen in the corresponding CD spectra recorded at the same time.
Collectively, these results are consistent with the global structure, as measured by CD and UV spectra, being unaffected by the initial incubation conditions, whereas the distribution of rollamer loop isomers, as reflected primarily by changes in 2Ap fluorescence intensity, depends strongly on the incubation temperature of the single strands prior to mixing.
In the aggregate, our observations suggest that rollamer formation is composed of two separate kinetic processes. A fast (on the timescale of our measurements) bimolecular reaction that leads to the formation of the global rollamer structure with a particular distribution of loop isomers, identified by its common CD spectrum and variable, condition-dependent, 2Ap fluorescence intensities. The variable 2Ap fluorescence reflects variable loop occupancies within the global bulge loop macrostate. This fast kinetic process is followed by a slow intramolecular rearrangement of the distribution of loop isomers to the final equilibrium state, characterized by the same CD spectrum as seen initially and a gradual change in 2Ap fluorescence intensity to a common (equilibrium) intensity that does not undergo further changes with incubation times. This slow kinetic step can be speeded up by heat annealing at 60 °C. The initial distribution of rollamer isomers that form during the fast bimolecular association reaction is determined by the impact of the formation conditions on the nature of the single strand ensembles from which the rollamer is formed. Temperature-dependent changes in the nature of single-strand ensembles in the incubation temperature range are confirmed by the single strand melting curves shown in the supplementary materials. This process is summarized schematically in Scheme 3 which cartoons the macrostates as dynamically interconverting loop isomers, labeled I through V. Using a Boltzman statistical representation, each macrostate is a bin, with the relative population of each macrostate scaling with the number of balls.

Scheme 3: Schematic representation of the triplet repeat energy landscape for our [CAG]8⋅[CTG]4 construct. Cartoon representation of the 5 possible rollamer isomers are shown below each energy well, with the roman numerals assigned to these isomers listed above. The depth of the free energy wells reflect the thermodynamic impact of the abasic site for each rollamer isomer. The relative populations of different loop isomers for the kinetically trapped and thermodynamically stable rollamer distribution are indicated by blue and red colored balls, respectively. The distribution of kinetically trapped isomers (blue balls) depends critically on the conditions, primarily incubation temperature, under which the rollamer was formed initially, whereas the thermodynamic distribution of loop isomers is essentially constant once the thermodynamic equilibrium has been established. Also indicated are the dominant/ most highly populated isomers for the thermodynamic (light red) and kinetically trapped (light blue) rollamer distribution, as well as the preferred APE1 substrate (light green). The position of the abasic site lesion in the upstream duplex domain at the 5′ junction of the bulge loop in rollamer isomer V makes it a preferred APE1 substrate compared to the other rollamer isomers where no cleavage could be observed in static versions of such bulge loops (Li et al., Reference Li, Vőlker, Breslauer and Wilson2014).
Because of the different dependencies of the two kinetic processes (rollamer formation and rollamer redistribution) on time and temperature, we are able to separate the kinetically distributed rollamer ensemble and the thermodynamically distributed rollamer ensemble experimentally, thereby allowing us to study them independently. In all subsequent experiments focused on the kinetically distributed rollamer ensemble, we prepared samples on ice immediately prior to the experiment to ensure consistent distribution of kinetically trapped rollamer isomers. Samples for experiments focused on the thermodynamically distributed rollamer isomers were prepared by preheating the sample to 60 °C after mixing.
The important point to emphasize here is that, depending on sample history, we obtain different distributions of rollamers with different occupancies of potentially repair competent and incompetent loop isomers within the ensemble. As elaborated below, we find that the equilibrium distribution of rollamer isomers does not include a significant population of the APE1 competent substrate, while the initial kinetically trapped rollamer distribution does contain some fraction of the APE1 competent substrate.
Further inspection of Scheme 3 reveals that among the five different possible loop isomers, the thermodynamically least favorable isomer (here shown on the far right, highlighted in green), is a potential APE1 substrate, whereas the thermodynamically most favored species (highlighted in red) and the isomeric, kinetically preferred species (highlighted in blue) are non-viable APE 1 substrates (Li et al., Reference Li, Vőlker, Breslauer and Wilson2014). In the following section we monitor the ability of the abasic site repair enzyme APE 1 to recognize and process such dynamic DNA substrates and its capability to alter loop isomer distribution through binding/processing of the minor APE1 competent loop isomer. As described below, we assessed this differential behavior by monitoring the conformationally sensitive fluorophores 5′ (2Ap) and 3′ (pdC), which allow optical detection of any APE1 induced alterations/digestion of the rollameric ensemble. The resulting fluorescence data are consistent with APE1 not altering the isomer distribution in favor of the digestion competent isomer.
APE1 enzyme digestion of DNA states: relevant background of known enzymatic properties
Apurinic/apyrimidinic endonucloase 1 (APE 1) is a crucial repair enzyme for processing abasic site lesions in DNA, which are universal intermediates at the crossroads of multiple DNA repair pathways (Loeb, Preston, Snow, and Schaaper, Reference Loeb, Preston, Snow and Schaaper1986; Loeb and Preston, Reference Loeb and Preston1986). It has been estimated that in mammalian cells APE1 processes up to 95% of all abasic site lesions(Li and Wilson, Reference Li and Wilson2014), and as such APE1 efficiency is critical for correct repair outcomes. APE1 is a multifunctional DNA repair and stress response protein. APE1′s primary function in DNA repair appears to be the ‘cleaning up’ of abasic site lesions formed by the loss of a purine or pyrimidine base to generate substrates suitable for repair polymerases. Such abasic site lesions can arise spontaneously, through loss of a (mostly purine) base or through the actions of one of the numerous glycosylases that cleave chemically damaged bases in BER. As part of lesion repair processes, APE1′s primary function is to incise 5′ of abasic site lesions to generate a backbone nick, where one strand contains a 3′OH group and the other strand a 5′phosphate sugar moiety called dRP (Scheme 4). APE1 also has a reported 3′–5′ exonuclease, 3′-repair diesterase, nucleotide incision repair, damaged or site-specific RNA cleavage, and multiple transcription regulatory roles (Wilson and Barsky, Reference Wilson and Barsky2001). However, its primary endonucleoase activity is the incisions of the DNA backbone 5′ of abasic sites, resulting in a backbone nick. The APE1 induced nick at abasic sites provides suitable substrates for DNA pol β repair of the abasic site in BER (Beard and Wilson, Reference Beard and Wilson2006; Prasad et al., Reference Prasad, Batra, Yang, Krahn, Pedersen, Beard and Wilson2005). Furthermore, within the BER pathway, APE1 is part of a tightly controlled sequential and intricate ‘handover’ process by which APE1 displaces glycosylases bound to abasic site products and, in turn, it is displaced by pol β while bound to the newly generated nick site (Wilson and Kunkel, Reference Wilson and Kunkel2000). APE1's ability to processively scan along DNA to find free or glycosylase bound abasic sites appears important to its BER function (Carey and Strauss, Reference Carey and Strauss1999; Howard and Wilson, Reference Howard and Wilson2018; López, Rodríguez, and Bañuelos, Reference López, Rodríguez and Bañuelos2021). A range of BER helper proteins can aid in the various steps of the process, but are not obligatory; at least in vitro. Interestingly, APE does not appear to form stable complexes with either the glycosylases that precedes its activity nor with the polymerases that follow its activity in solution; nor do they appear to form stable co-crystals (Beard, Horton, Prasad, and Wilson, Reference Beard, Horton, Prasad and Wilson2019). It is conceivable that the ability to freely bind to abasic sites or get recruited to displace glycosylases from bound abasic sites generated by the glycosylase action may be important for allowing APE to process the toxic abasic site lesions generated by many different pathways within the cell; particularly given that in mammalian cells up to 95% of all abasic site lesions, regardless of their origins, are processed only by APE1. In our study, we are concerned with the ability of APE1's DNA incision activity 5′ of abasic sites in dynamic triplet repeat bulge loops. Note that the equivalent lesions within the corresponding repeat Watson and Crick duplex are processed normally by APE1, as outlined in Scheme 4.

Scheme 4: Schematic representation of the primary endonuclease function of APE1 in duplex DNA
It has been proposed that faulty DNA repair is one of the pathways by which DNA expansion can be triggered in repetitive DNA domains (Budworth and McMurray, Reference Budworth and McMurray2013; McMurray, Reference McMurray2008; Panigrahi, Lau, Montgomery, Leonard, and Pearson, Reference Panigrahi, Lau, Montgomery, Leonard and Pearson2005; Usdin, House, and Freudenreich, Reference Usdin, House and Freudenreich2015). This coupling makes understanding the interactions of APE1 with a lesion embedded in repeat sequences of fundamental importance. We previously have employed static repeat bulge loop DNA constructs, containing a single site specifically incorporated abasic site lesion at multiple positions within the repeat, to demonstrate that the position of the abasic site relative to the bulge loop significantly effects processing by APE1 (Li et al., Reference Li, Vőlker, Breslauer and Wilson2014). Specifically, we showed that abasic sites located 5′ of the bulge loop are processed, albeit possibly with reduced rates, while abasic sites within the bulge loop or 3′ of the bulge loop are not viable APE1 substrates, and therefore are not processed. This latter observation is in agreement with the known sensitivity of APE1 to distortions in the DNA within the DNA binding footprint 5′ of the abasic site (Mol, Izumi, Mitra, and Tainer, Reference Mol, Izumi, Mitra and Tainer2000; Paap, Wilson, and Sutherland, Reference Paap, Wilson and Sutherland2008; Weinfeld, Rasouli-Nia, Chaudhry, and Britten, Reference Weinfeld, Rasouli-Nia, Chaudhry and Britten2001). Further, we also showed that abasic site lesions absent APE1 enzyme can cause a dynamic redistribution of bulge loop positions in dynamic rollameric ensembles (Völker et al., Reference Vőlker, Plum, Gindikin and Breslauer2019), and we proposed that such redistribution might alter repair outcomes. Specifically, we proposed that such lesion-induced redistribution of repeat bulge loops impacts APE1 recognition and processing of the abasic site lesion substrate. Here we present experimental results consistent with this hypothesis.
Differential APE 1 digestion of the dynamic substrate ensembles:
The equilibrium distribution of rollamer isomers does not include a significant population of the APE1 competent substrate, while the initial kinetically trapped rollamer distribution includes at least a small population of a competent substrate.
As detailed above, loop distribution in the [CAG]8⋅[CTG]4 rollamer ensemble can consist of either a non-equilibrium, kinetically trapped distribution, or an equilibrium, thermodynamically stable equilibrium loop distribution, depending on the sample history. As such, the [CAG]8⋅[CTG]4 rollamer DNA construct constitutes a complex dynamic system that can provide insights into how the crucial APE1 repair enzyme processes or does not process complex dynamic substrates, as elaborated below.
Fluorescent bases as probes of the impact of APE1 binding/processing on alterations in and digestion of the DNA rollameric ensemble
Figure 3 shows the kinetic traces obtained when monitoring 2Ap fluorescence after the addition of APE1 to either the kinetically trapped rollamer distribution, or the equilibrium rollamer distribution of [CAG]8⋅[CTG]4. The experiments were performed at 35 °C near the optimum temperature for mammalian APE1 activity. At this temperature, spontaneous reorganization of the kinetically trapped rollamer distribution is sufficiently slow relative to the expected enzyme processing rate that only a marginal net impact from nonenzymatic dynamic redistribution is expected during enzyme activity. The corresponding traces using heat-inactivated APE1 enzyme serve as a convenient control for any APE1 buffer induced impact on the redistribution kinetics not caused by enzyme action. It is important to note that, unlike in conventional fluorescent detected enzyme assays, our fluorescent signal does not directly record the progress in the enzyme cleavage reaction. The fluorescence intensity of a given rollamer substrate (say substrate isomer I) and its cleaved product (product isomer I) remains essentially the same. Instead, our fluorescence signal records changes in the ensemble distribution of either the DNA substrate or the DNA product caused by the enzyme action (i.e. isomer I becoming isomer II or III). Progress in the formation of a product instead is monitored by recording changes in the temperature dependence of the hyperchromicity detected in melting studies discussed below.
As is apparent from inspection of Fig. 3, we observe that APE1 does not cause any changes in the 2Ap fluorescence of the rollamer ensemble in its thermodynamic equilibrium distribution. By contrast, we observe fairly significant but slow, time-dependent changes in 2Ap fluorescence in the kinetically trapped rollamer distribution. The comparatively small 2Ap fluorescence change with time in the control experiment using heat-inactivated APE1 enzyme shows that the change in 2Ap fluorescence in the kinetically trapped rollamer distribution is due to active APE1 and not due to the spontaneous redistribution of the rollamer ensemble from the kinetically trapped distribution to the thermodynamically stable distribution.

Figure 3: Time-dependent changes in 2Aminopurine fluorescence (excitation at 305 nm/ emission at 370 nm) for the kinetically distributed (red) and equilibrium distributed (blue) rollamer ensemble upon addition of APE1 enzyme. The vertical line after 1200sec preincubation at 35 °C indicates the time point where APE1 was added to the solution. The preincubation period establishes the rate of change in 2Ap fluorescence prior to the addition of enzyme, given the expectation for slow redistribution at 35 °C from the kinetic to a thermodynamic ensemble of the kinetically trapped state. The green curve corresponds to the 2Ap trace obtained when adding irreversibly heat-denatured APE1 to the kinetically distributed rollamer ensemble. Note that, counter to our expectations, the observed change in 2Ap fluorescence for the kinetically trapped ensemble is identical to that seen upon redistribution from kinetic to the equilibrium distribution of rollamers. Approximately 60% of the 2Ap fluorescence of the equilibrium distribution is recovered for the kinetically trapped distribution during the time course of APE1 digestion. We obtain similar outcomes when incubating our samples at 25 °C (not shown) rather 35 °C .
The significant change in 2Ap fluorescence for the kinetically trapped rollamer distribution caused by native APE1 is, at first glance, surprising. Based on our prior studies on static bulge loops with site-specifically incorporated abasic site lesions (Li et al., Reference Li, Vőlker, Breslauer and Wilson2014), the APE1 digestion-competent bulge loop isomer is characterized by quenched 2Ap fluorescence and enhanced pdC fluorescence, whereas the loop isomers with the enhanced 2Ap fluorescence and quenched pdC fluorescence are not considered viable APE1 substrates. Table II summarizes the fluorescence signals for the 5 different APE 1 rollamer isomer ‘substrates’ and the anticipated signals for the corresponding APE1 digestion ‘products’. This table also indicates which rollamer isomer is expected to be a viable APE1 substrate based on our prior studies with static repeat bulge loops containing site specifically incorporated abasic sites. One noticeable consequence is that an enhanced 2Ap fluorescence signal is associated only with those isomers (and hypothetical digestion products) that are considered nonviable APE1 substrates.
Table II: Defining APE1-Competent DNA Substrates: Correlations Between Biophysical Properties of Potential APE1 Competent Rollamer Substrates and their Anticipated Products based on Experimentally Observed APE1 Processing Activity

Table II: Summary of the expected 2Ap and pdC fluorescent signals for the 5 rollamer isomers, identified by their roman numeral designation, (left 4 columns) and the anticipated APE1 digestion products of each rollamer isomer (3 rightmost columns). The position of the two fluorophores and the abasic site are indicted by colored blocks (red – 2Ap, blue –pdC, and green –F (substrate), dRP (product)) in the schematic pictures of the substrate and product isomers. The expected fluorescence signals at the respective excitation wavelength of the two fluorophores are indicated by up arrow ↑ = increase in fluorescence intensities; down arrow ↓ = decrease in fluorescence intensity, horizontal arrow ↔ = no change in fluorescence intensity. The center column lists whether a given isomer is considered a viable APE1 substrate based on prior data derived from static bulge loops with site-specifically incorporated abasic sites (Li et al., Reference Li, Vőlker, Breslauer and Wilson2014). Note that, unlike in conventional kinetic experiments, no significant changes in fluorescence intensity upon cleavage of a given loop isomer to its nicked product (across the line) is expected, only changes in loop isomer distribution (down the column) can give rise to significant fluorescent changes. Cleavage of isomers by APE1, which results in a single cut 5′ of the abasic site to form two shorter oligonucleotides with 3′ OH and 5′deoxyribose phosphate moiety is detected by UV melting experiments.
To better understand the origins of the observed APE1 induced fluorescence changes, we also measured the excitation spectra of 2Ap and pdC for our rollamer substrates before digestion, after digestion, and after heat equilibration. These results are shown in Fig. 4. The significant observation is that the increase in 2Ap fluorescence for the kinetically trapped ensemble is also accompanied by a small but reproducible increase in intensity in the pdC fluorescence spectra. No such change in either 2Ap or pdC spectra is observed for either the equilibrium distribution of rollamers, nor in the kinetically distributed rollamer sample treated with heat-inactivated APE1. The placement of the fluorophores in sequence space relative to the abasic site in our [CAG]8⋅[CTG]4 rollamer construct, however, suggests that any loop redistribution that gives rise to an increase in 2Ap fluorescence should simultaneously also cause pdC fluorescence to decrease. Our observation for the kinetically distributed rollamer sample, that both fluorophores exhibit increases in fluorescence, albeit to different degrees, reflects an intriguing level of complexity of APE1 interactions with the dynamic rollamer.

Figure 4: Observed changes in 2Ap (left column) and pdC (right column) fluorescence excitation spectra recorded at their respective emission maxima (370 nm, 460 nm) of the initial kinetically trapped rollamer ensemble (panels A & B), the equilibrium distributed rollamer ensemble (Panels C &D) and the kinetically trapped ensemble treated with heat-inactivated APE1 enzyme (Panels E & F). Spectra were recoded before incubation with APE1 (black line), after digestion with APE1 for 20000 s (blue line) and after heat equilibration to 75 °C after digestion (red line). Heat equilibration also inactivates the APE1 enzyme. Note the large change in 2Ap fluorescence upon APE1 digestion seen in the kinetically trapped ensemble (Panel A) that is also accompanied by a small change in pdC fluorescence excitation spectra (panel B). A similar change in pdC spectra is not seen for the equilibrium distribution or a kinetically distributed sample treated with heat-inactivated APE1 enzyme. Heat equilibration at 75 °C shows that the APE1 induced change in 2Ap fluorescence intensity in the kinetically trapped rollamer distribution is incomplete after the arbitrarily chosen 20 000 s incubation time. By contrast, we do not detect any significant changes in either 2Ap or pdC fluorescence after APE1 digestion or heat equilibration of the equilibrium distribution of rollamers. The small peak seen between approximately 330 nm and 290 nm in some pdC spectra correlate with increased intensity in the corresponding 2Ap fluorescence spectra and most likely reflects energy transfer from the 2Ap to pdC. Note also that the maximum 2Ap fluorescence achieved for the kinetically trapped ensemble after digestion and heat equilibration is approximately 10% smaller than that for the equilibrium distributed rollamer. The corresponding CD spectra (not shown) are unchanged by either APE1 digestion or heat equilibration and are identical for all three rollamer samples.
Further inspection of the data shown in Fig. 4, reveals that the total 2Ap fluorescence after APE1 digestion and heat annealing of the kinetically distributed sample is about 10–12% smaller than that of the thermodynamically distributed rollamer; even though both samples exhibit identical CD spectra (not shown). As discussed earlier, heat equilibration causes a redistribution of loop isomers to those characterized by maximum 2Ap fluorescence. The apparent difference in maximum 2Ap fluorescence after heat equilibration, therefore, is consistent with an APE1 induced change in the nature of the equilibrium rollamer distribution; most likely due to APE1 cleavage of the APE1-competent isomer. Below, we elaborate on this interpretation. To monitor Ape1 digestion, we also measured pdC fluorescence after the addition of the APE1 enzyme. These latter experiments were inconclusive, for the following reasons: The total fluorescence of pdC in these constructs in the native rollamer state is small; there is no noticeable change associated with the pdC fluorescence prior to and immediately after digestion for the equilibrium distributed rollamer sample; in the kinetically trapped sample, the final post digestions pdC fluorescence signal is reached before the fluorescence change could be recorded (data not shown). The latter observation suggests that APE1-induced changes in pdC fluorescence occur over a faster timescale than those that are detected by monitoring 2Ap fluorescence.
Melting studies before and after APE 1 digestion
We next performed melting experiments on the rollamer samples before and after digestions. We reasoned that APE induced cleavage of the central (in sequence terms) abasic site should thermally destabilize the resulting product relative to the undigested parent sample. Cleavage of the abasic site in the [CAG]8 strand results in two shorter/ less stable strands hybridized to the [CTG]4 strand that do melt at lower temperatures. The results of these studies are shown in Fig. 5.

Figure 5: UV melting curves of the initial kinetically trapped rollamer ensemble after APE digestion at two different APE concentrations (red & green curves), the equilibrium distribution of rollamer ensemble after APE digestion (blue curve) and a rollamer not exposed to APE1 (black curve). APE1 digestion of the abasic site in the center of the [CAG]8 strand in the 4th (CAG) repeat creates a backbone break in the strand that should lower the melting temperature of the digested substrate without significant impact on the hyperchromic change associated with the overall melting process, as no base-pairing/ stacking interactions are disrupted by the enzyme's activity at the abasic site. From the relative intensities of the low and high-temperature hyperchromic change upon heat denaturing the sample one can therefore estimate the fraction of rollamer digested by APE1. Figure 3 reveals that only for the kinetically trapped rollamer ensemble do we detect a small (roughly 10% of the total hyperchromic change) low-temperature transition that can be assigned to APE1 digestion – a much smaller change than that observed for the kinetic 2Ap fluorescence change. There is no indication of digestion by APE1 for the equilibrium distribution of the rollamer.
Inspection of Fig. 5 reveals that we detect a lower temperature transition (representing roughly 10–12% of the total hyperchromic change) only for the kinetically trapped distribution of rollamers. This transition is largely independent of the amount of enzyme added, suggesting that all available substrate is cleaved and very little redistribution occurs in favor of more cleavable substrate. The remainder of the rollamer melts at the same temperature as the sample not digested with APE1, and the APE1 ‘digested’ equilibrium ensemble. The latter shows no evidence of any digestion in either the UV melting curves or the fluorescence signals. These melting studies are consistent with a fraction of the kinetically trapped rollamer distribution being digested, whereas none of the thermodynamically equilibrated distribution is digested.
Concluding remarks: APE1-induced redistribution creates a preferred pathway to an equilibrium ensemble of enzymatically incompetent states
In the aggregate, our APE1 digestion experiments reveal that the thermodynamic equilibrium rollamer distribution is entirely resistant to APE1 processing. Our collective observations are consistent with the equilibrium distribution consisting primarily of loop isomers that accommodate the abasic site in positions resulting in unsuitable APE1 substrates. These incompetent substrate states are characterized by high 2Ap fluorescence and low pdC fluorescence (see Table I & II). By contrast, we find that the kinetically trapped rollamer distribution is at least partially digestible by APE1; namely, 10–12% as judged by the UV melting curve and pdC signal change. The fraction that can be digested by APE 1 appears to be independent of enzyme concentration and is digested very quickly. We also observe a much slower change in 2Ap fluorescence that is dependent on active APE1 enzyme, and whose fluorescence change closely resembles that observed for the spontaneous kinetic rearrangement, absent enzymes, to the equilibrium distribution at much higher incubation temperature (supplementary materials).
Based on these collective enzymatic digestions and biophysical characterizations, we propose that APE1 cuts a fraction of the rollamer substrate it encounters, specifically the fraction that is APE1 competent in the initial kinetic distribution formed. APE1 interactions also ‘induce’ rollamer redistribution from the kinetically trapped distribution to the equilibrium distribution that does not contain viable APE1 substrates. As such, one can envision APE1 acting both as a catalyst and as a reagent. Such intriguing behavior may seem counterintuitive, as Le Chateliers principle leads one to expect that the enzyme binding/process should shift a dynamic equilibrium from the initial distribution toward the species/state with which the enzyme preferentially interacts. Based on our data, such is not the case for this dynamic landscape of potential substrates.
In short, we propose that APE1 activity catalyzes rollamer redistribution to form nonviable substrate states. This intriguing activity of APE1 perhaps can be understood if one considers that APE1 binding/processing of an abasic site consists of two interrelated processes. The enzyme first needs to identify the abasic site in a vast background of canonical DNA bases, followed by tight binding/processing of the abasic site once located. (Howard and Wilson, Reference Howard and Wilson2018; López et al., Reference López, Rodríguez and Bañuelos2021). The former process involves the enzyme surveilling the DNA as it precesses along the helix in a process generally understood to be regulated by nonspecific interactions (Carey and Strauss, Reference Carey and Strauss1999). By contrast, the latter process involves shorter-range, specific enzyme-DNA interactions (Freudenthal, Beard, Cuneo, Dyrkheeva, and Wilson, Reference Freudenthal, Beard, Cuneo, Dyrkheeva and Wilson2015; Mol et al., Reference Mol, Izumi, Mitra and Tainer2000). It is conceivable that nonspecific probing of the bulge loop structure to identify abasic site lesions provides sufficient energy to partially overcome the activation energy barrier that significantly slows down loop redistribution at/near-physiological temperatures. If such nonspecific probing of the bulge loop ensemble does not lead to specific binding (and processing) of the abasic site lesion, the lowering of the activation energy barrier simply speeds up loop redistribution to the thermodynamically optimal loop isomer distribution. As we have discussed above, this thermodynamically optimal loop distribution is not an APE1 substrate. In this context, it is worth noting that APE1 has been reported to recognize, bind, and process abasic sites accidentally incorporated within RNA (Berquist, McNeill, and Wilson, Reference Berquist, McNeill and Wilson2008; Kim et al., Reference Kim, Berquist, Chohan, Uy, Wilson and Lee2011; Malfatti, Antoniali, Codrich, and Tell, Reference Malfatti, Antoniali, Codrich and Tell2021). The latter may require at least partial unfolding of RNA secondary structure. Thus APE1 activity that lowers the transition state barrier for secondary structure may well be part of the normal repertoire of this repair enzyme. However, in the case of the repeat bulge loop rollamers, an activity that lowers the transition state for secondary structure does have the detrimental impact (in terms of repair outcomes) of facilitating the dynamic redistribution of loops to those DNA species that are not suitable APE1 substrates. Thus we propose, for further consideration, that the enzyme's initial function of scanning for DNA damage actually reduces the available substrate competent states for it to process from amongst the dynamic loop isomers. Such a consequence could have a profound impact on slowing down and/or misdirecting DNA repair within dynamic energy landscapes, such as are exemplified here within triplet repeat domains.
We propose, and demonstrate by the example of APE1 interacting with dynamic rollameric bulge loop substrates, the existence of novel complexity within the process of enzymatic substrate selection. This complexity presents when the energy landscape of potential substrates creates an ensemble of interconverting, closely related, but non-identical substrates that collectively constitute a dynamic ensemble, at both the micro- and macro-state levels. In the presence of such a dynamic ensemble of potential substrates, enzyme interactions can lead to either increased or decreased populations of enzyme-competent substrates, thereby controlling the catalytic process. In effect such behavior may be described as a regulatory mechanism via enzymatic self-repression or self-activation. In the case of abasic site lesions within rollameric repeat bulge loops, APE1-induced redistribution creates a preferred pathway to an equilibrium ensemble of enzymatically incompetent states; an example of enzymatic self-repression.
Biological implications of our observations
In cells, metastable repeat bulge loops may form spontaneously, perhaps anywhere within the repeat, perhaps preferentially at select positions, in response to some cellular process that involves partial denaturation of the repeat domain (Lenzmeier and Freudenreich, Reference Lenzmeier and Freudenreich2003; McMurray, Reference McMurray2010; Panigrahi et al., Reference Panigrahi, Lau, Montgomery, Leonard and Pearson2005; Pearson et al., Reference Pearson, Tam, Wang, Montgomery, Dar, Cleary and Nichol2002). However, the significant activation energy barrier for loop migration we observe in our systems suggests that once formed, the initial loop distribution within the repeat is likely dictated kinetically rather than thermodynamically by virtue of the kinetic trap caused by loop formation. In this respect, the initial bulge loop distribution that occurs as a consequence of some biological process is not dissimilar to the kinetically trapped loop distribution caused by our preordered single strands. It would appear that APE1, and perhaps other enzymes that scan along the DNA helix in search for their cognate biological substrates/binding sites (Berg, Winter, and von Hippel, Reference Berg, Winter and von Hippel1982; Breyer and Matthews, Reference Breyer and Matthews2001; Dowd and Lloyd, Reference Dowd and Lloyd1990; Halford and Marko, Reference Halford and Marko2004; Hippel, Fairfield, and Dolejsi, Reference Hippel, Fairfield and Dolejsi1994), might provide part of the activation energy needed to speed up loop migration, and eventually cause the loop distribution to be thermodynamically determined.
Abasic site lesions most likely arise more or less stochastically anywhere within a repeat domain in vivo (Lindahl and Nyberg, Reference Lindahl and Nyberg1972; Lindahl, Reference Lindahl1993), while there is some evidence that bulge loops have higher frequencies of DNA damage than corresponding Watson and Crick duplex regions (Jarem, Wilson, and Delaney, Reference Jarem, Wilson and Delaney2009; Volle, Jarem, and Delaney, Reference Volle, Jarem and Delaney2012). If an abasic site arises by chance within a preexisting bulge loop, its fate is sealed and no repair will occur until the bulge loop has been resolved by some other process. However, if an abasic site forms spontaneously within the Watson and Crick paired portion of the repeat domain, its fate depends on whether APE1 recognition/ binding of the abasic site precedes APE1-induced loop redistribution to the thermodynamically most stable loop isomer, i.e. APE1 induced loop migration to position the lesion at the 3′ loop /duplex junction. The latter process would be strongly influenced by the relative distance between the lesion site and the bulge loop position and the direction of loop migration. In short, we propose that success or failure of abasic site repair outcomes within repeat domains depends on two stochastic events: abasic site formation, and bulge loop formation; as well as the time it takes for the bulge loop to redistribute to its thermodynamically favored distribution. Both such events are catalyzed by the repair enzyme (and perhaps other DNA-active enzymes or DNA-binding proteins), albeit at different rates. Thus, for abasic sites within repeat domains, repair outcome is a stochastic rather than a deterministic process, with a much higher potential for faulty repair outcomes than an equivalent repair process in a non-repeat domain.
Acknowledgements
This work was supported by NIH grants GM23509, GM34469 and CA47995 all to K.J.B. The authors wish to dedicate the manuscript to the memory of Professor Horst H. Klump. The authors also wish to thank Drs. Barbara Gaffney and Roger Jones (Rutgers University) for help with DNA synthesis and purification, and Dr. Craig A. Gelfand for helpful discussions. At the time we submitted this manuscript, a perspective article appeared in the Journal of Physical Chemistry B that presents dynamic ensemble conceptualizations consistent with the features elaborated on in this paper. (Kolimi et al., 2021).
Conflict of interest
Kenenth J. Breslauer and Jens Völker declare none.
Supplementary Material
The supplementary material for this article can be found at https://doi.org/10.1017/S0033583521000093


 Open access