


Pellagra is a clinical syndrome characterised by ‘three or four Ds’, namely dermatitis, diarrhoea, dementia or, if left untreated, death(Reference Wan, Moat and Anstey1–Reference Hegyi, Schwartz and Hegyi3). Nausea is also observed(Reference Pitche4) in patients with pellagra. This syndrome has two types. One type may result from a defect in intake of niacin or tryptophan from the diet (primary pellagra) and the other from a defect in the use of niacin or tryptophan (secondary pellagra)(Reference Prabhu, Dawe and Mponda5). Secondary pellagra is thought to be caused by drugs, alcoholism or disease of the gastrointestinal tract. Isoniazid (INH), an anti-tuberculosis drug used globally, causes pellagra-related photosensitivity(Reference Wan, Moat and Anstey1–Reference Hegyi, Schwartz and Hegyi3,Reference Prabhu, Dawe and Mponda5,Reference Forget and Menzies6) . However, there have been few reports on whether INH-related gastric symptoms, such as nausea, indicate pellagra. Furthermore, these patients could be treated more accurately if INH-related nausea is a pellagra-like condition.
Niacin is an umbrella term for nicotinamide (NAM) and nicotinic acid (NA). NAM and NA are biosynthesised from tryptophan in the liver(Reference Fukuwatari and Shibata7) (Fig. 1). During NAM synthesis, phosphorylated vitamin B6 acts as a coenzyme to catabolise conversion of 3-hydroxykynurenine to 3-hydroxyanthranilic acid(Reference Brown2,Reference Mascolo and Vernì8) . The structure of INH is similar to that of vitamin B6 and can therefore act as a competitive inhibitor of pyridoxal phosphokinase(Reference Rodà, Rozas and Fortuny9). Serum and urine levels of niacin are decreased in patients who take INH compared with those who do not(Reference Bender10,Reference Shibata, Marugami and Kondo11) . Interestingly, a lower incidence of INH-induced pellagra is observed in developed countries than in some developing countries, such as Malawi(Reference Nabity, Mponda and Gutreuter12). This finding might be partially related to the nutritional (niacin) status of the patient. Malawians rely on maize as a staple food and often have highly restricted diets before the maize harvest, which appears to cause niacin deficiency.
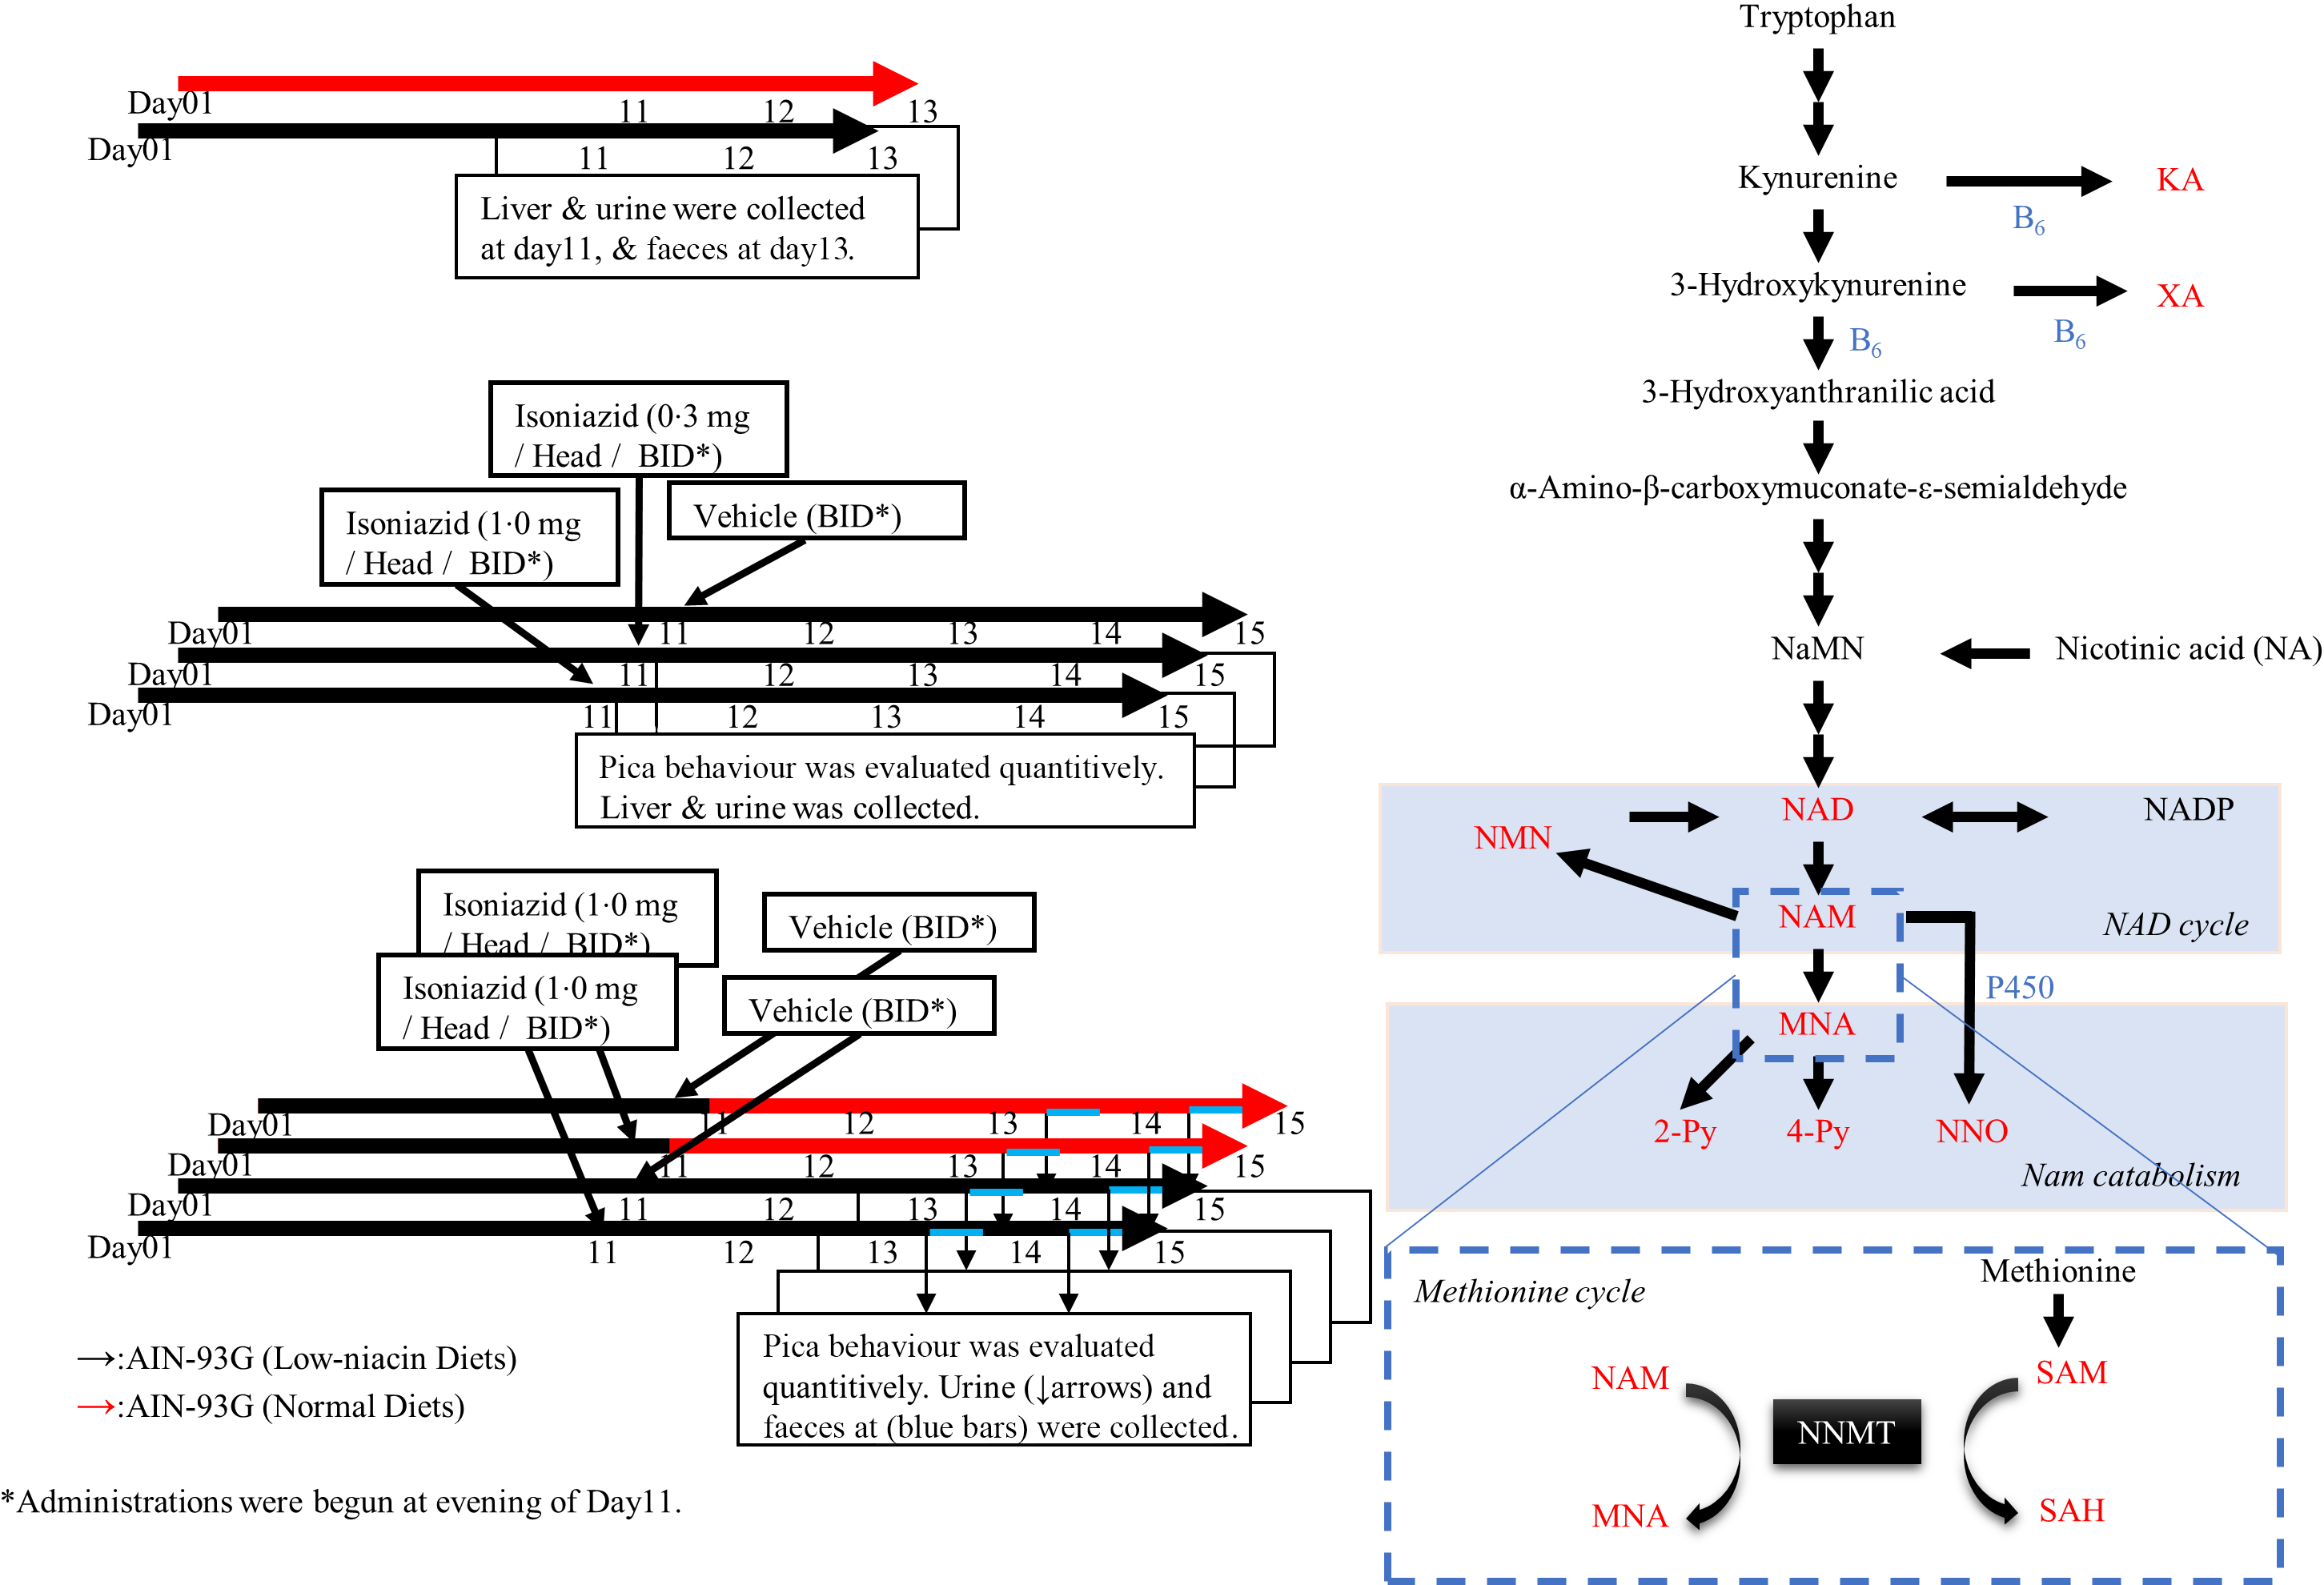
Fig. 1. Pharmacological study procedure and niacin metabolism pathway. (a)–(c) Pharmacological experiment protocol. The red arrows indicate normal diets, and the black arrows indicate low-niacin diets. (a) Protocol used to confirm the effect of the low-niacin diet. In each group, five mice in a plastic cage were kept under appropriate conditions and this repeated twice. (b) Protocol used to confirm whether administration of isoniazid (INH) induced pica. INH was administered after feeding mice a low-niacin diet for 10 d. Pica was quantified, urine and faeces were collected daily and livers were collected at day 15. In each group, 10 mice in 2 plastic cages were kept under appropriate conditions and this repeated twice. (c) Protocol used to confirm the beneficial effects of niacin supplementation on pica. As in (b), after mice were fed a low-niacin diet for 10 d, INH was administered and the mice were fed a normal or low-niacin diet. In each group, 5 or 10 mice in 1 or 2 plastic cages were kept under appropriate conditions and this repeated twice. (d) Niacin synthesis from tryptophan in vivo. The metabolites measured in this study are shown in red. Steps in which vitamin B6 acts as coenzyme are labelled as B6 in blue.
Patients with pellagra tend to recover after supplementation with niacin. Therefore, this condition is often diagnosed on the basis of medication or nutritional history and symptoms (mainly skin)(Reference Hegyi, Schwartz and Hegyi3). Additionally, urine levels of niacin metabolites, specifically 1-methylnicotinamide (MNA) and 1-methyl-2-pyridone-5-carboxamide (2-Py)(Reference Creeke, Dibari and Cheung13), are good biomarkers for pellagra. Therefore, a definitive diagnosis of pellagra is possible, and the cause is evident. However, the detailed molecular mechanism underlying this condition has not been determined. Using an appropriate experimental animal model, Sugita et al. reported that increased prostaglandin E synthase levels play a role in the development of pellagra-related photosensitivity(Reference Sugita, Ikenouchi-Sugita and Nakayama14). However, digestive symptoms caused by pellagra, such as nausea, have not yet been fully investigated because there is no suitable experimental animal model. To resolve this problem, we focused on ‘pica’ behaviour in mice. Pica is a psychological disorder that, in humans, is characterised by an appetite for non-food substances. Pica is also observed in mice (or rats) when they are injected with an emetogen such as cisplatin(Reference Yamamoto, Nakai and Nohara15) and can be effectively inhibited by pre-treatment with ondansetron(Reference Takeda, Hasegawa and Morita16). This murine pica behaviour has been proven pharmacologically to mimic human vomiting(Reference Yamamoto, Nakai and Nohara15–Reference Yamamoto and Yamatodani17). Consequently, mice with pica appear to be a useful model for researching nausea and vomiting induced by emetogen.
Therefore, the main objective of the present study was to investigate whether pellagra/INH-induced nausea can be quantitatively assessed using our pica model. We believe that this model will be useful for investigating the mechanism underlying pellagra-related nausea and for identifying the putative phenotypes of pellagra, which remain unknown.
Experimental methods
Experimental animals and diets
All animal studies were approved by the Institutional Animal Care and Use Committee at Shionogi & Co. Ltd. All experimental procedures were conducted in a facility accredited by the Association for Assessment and Accreditation of Laboratory Animal Care International (S20150C-0001). The results of the experiments are reported in accordance with the ARRIVE guidelines(Reference Kilkenny, Browne and Cuthill18). Six-week-old female Balb/c mice were obtained from Japan SLC (Hamamatsu, Japan) and housed in groups of five per cage under controlled environmental conditions (24 ± 2°C; 50 ± 20 % relative humidity; 12 h light–12 h dark cycle, lights on at 08.00 hours). The group-housed mice were fed an AIN-93G diet (normal diet) (Oriental BioService) or a modified AIN-93G diet (low-niacin diet) (online Supplementary Tables S1 and S2). Body weight was measured every 2 or 3 d to check whether they weighed 16–22 g. The range in weight was decided using the mean ± 2 sd (body weight of age-matched Balbc mice without any treatment). When the weight of mice was not within this range (especially < 16 g), their clinical features were checked and we decided whether they should be removed from the experiment. Further, the experimental periods, such as dosing terms, were decided using these criteria because continuation of INH treatment for 5 d or more causes considerable loss of body weight. A total of 145 mice were used.
Experimental design
Six-week-old mice were fed a normal or low-niacin diets for 2 weeks. Body weight, the levels of niacin-related metabolites and faeces were compared between these two groups to elucidate the impact of a low-niacin diet on murine pathology and physiology (Fig. 1(a)). The design of in vivo study, which was used to investigate a mouse model of pellagra-related nausea and/or emesis, is outlined in Fig. 1(b) and (c). As shown in Fig. 1(b), after 10 d of being fed the low-niacin diet, each mouse was treated with vehicle or INH (0·3 or 1·0 mg/mouse) (Tokyo Chemical Industry Co. Ltd) twice a day for 5 d. As shown in Fig. 1(c), on day 11, half of these mice were then transitioned to a normal diet, while the rest continued to be fed the low-niacin diet. After day 10, each mouse was treated with vehicle or INH (1·0 mg/mouse) twice a day for 5 d. Urine samples were collected from all mice 3 h after the first administration every day and stored at –80°C for later analysis of tryptophan–nicotinamide pathway metabolites. Faeces were collected and photographed using a digital camera (Nikon). After the final treatment, liver samples were collected.
Quantification of pica behaviour
Each mouse was placed into a 500-ml glass beaker with 20–30 thin strips of paper, and the number of times each mouse nibbled on a strip was counted for 15 min every 30 min following the first administration of each day. When a mouse was observed nibbling a paper strip, the strip was checked for tooth marks. Pica was defined as a mouse holding a paper strip in its forepaws and observation of tooth marks on the strip.
To accurately quantify the level of pica behaviour, mice were fed paper tips stained with carminic acid (Tokyo Chemical Industry Co. Ltd) and the faeces were recovered and evaluated. To stain the strips, an aqueous carmine solution (0·05 w/v%) was prepared and the paper strips were soaked in the solution overnight at room temperature. Then, excess carmine solution was removed, and the strips were dried using a vacuum freeze drier at a constant temperature. Next, the dried paper strips were sterilised by autoclaving. When the mice ate these stained paper strips, their faeces turned red. The pigment from 50 to 100 mg of faeces was extracted with 2–6 ml (1 ml × 2–6) of an ammonia solution (2·0 m ammonia in 100 % ethanol:water (1:9, v/v)), and the extract, in a 2-ml or 10-ml tube, was incubated at 45°C for 30 min while blowing gaseous nitrogen to remove the ammonia. The extracts were then cleaned up on an InertSep MA-2 column (GL science) in accordance with the manufacturer’s instructions. Briefly, each column was washed with 1 ml of distilled water and 1 ml of methanol. After the column was washed, the extract was loaded onto the column and the flow-through was recovered. Finally, the recovered samples containing carminic acid were measured using Benchmark Plus (BioRad), and the concentrations were determined using the #x019B;max method (online Supplementary Fig. S01) and an appropriate calibration curve (online Supplementary Fig. S02).
LC/MS-MS analyses
Mouse liver and urine samples were frozen at –80°C immediately after collection. To analyse liver samples, the liver was cut into ×30 100 mg pieces on dry ice and added to 2-ml tubes (ST-0250F-0) (YASUIKIKI) with metal corn (MC-0218R(S), YASUIKIKI). The sample tubes were set into a metal holder and incubated in liquid N2 for 5 min. After incubation, the samples were crushed using a MALTI-Beads shocker at 2500 rpm for 30 s (MB2000, YASUIKIKI) at room temperature. Three volumes (v/w) of methanol containing 6 % perchloric acid and 4 % phosphoric acid were then added to the tube and crushed again using the MALTI-Beads shocker at 2500 rpm for 10 s at room temperature. A 20-µl aliquot of liver homogenate was combined with 60 µl of an internal standard solution (methanol spiked with deuterium-labelled internal standard: NAM-d4, 2-Py-d3, 4-Py-d3, MNA-d3, creatinine-d3, NNO-d3, NA-d4, tryptophan-d5, KA-d5, kynurenine-d4 and XA-d4), vortexed for 5 min and centrifuged at 12 000 g for 5 min at 4°C. After centrifugation, 50 µl of the supernatant was diluted with 200 µl of Milli-Q water and 3 µl of each sample was injected into an LC/MS-MS system (API400; AB Sciex LLC.). To analyse urine samples, the urine was thawed on ice, diluted 20 times with Milli-Q water and vortexed to mix. A 10-µl aliquot of urine was combined with 70 ul of the internal standard solution, vortexed for 5 min and centrifuged at 12 000 g for 5 min at 4°C. After centrifugation, 50 µl of the supernatant was diluted with 200 ul of Milli-Q water and 3 µl of each sample was injected into an LC/MS-MS system. The standard solution for the calibration curve (final concentrations of 0·05, 0·15, 0·5, 1·5, 5, 15, 50, 150 and 500 µm) and the quality control samples (QC sample: urine added to a standard solution with a predetermined concentration) were prepared in the same way as the urine samples, as described above. The QC test was performed using the following formula: QC accuracy = (Concentration of the urine-containing standard) – (Concentration of the urine alone)/Concentration of the standard alone. A 3-µl aliquot of each sample was injected into the LC/MS-MS system.
Two separation conditions were used for the LC system (Nexera) (Shimazu Corp.). Briefly, water/UFHA/HCOOH = 1000/0·2/0·1 (mobile phase A) and 100 % methanol (mobile phase B) were used for NAM, MNA, 2-Py, 4-Py, NNO, NMN, SAH, SAM (Fig. 1) and Cre. An aliquot of the sample was loaded onto the column (YMC Triart C18, 3 × 150 mm, 5 μm) (YMC Corp.), which was maintained at 50°C. The gradient conditions are shown in Table 1. Water/HCOOH/TFA = 1000/1/0·1 (mobile phase A) and ACN/HCOOH/TFA = 1000/1/0·1 (mobile phase B) were used for KA and XA (Fig. 1). An aliquot of the sample was loaded onto the column (VisionHT-C18 HighLoad, 100 × 2·1 mm, 3 μm, Dr. Maisch) (Ammerbuch), which was maintained at 15°C. The gradient conditions are shown in Table 2. After separation by LC system, the aliquot reached the MS/MS system (API5000) (AB Sciex). The electrospray ion source was operated in positive mode. Metabolites were quantified using the following transitions: NAM (m/z = 123·100 > 80·000), MNA (m/z = 137·200 > 94·100 or 110·000), NNO (m/z = 139·000 > 78·000), 2-Py (m/z = 153·100 > 110·100), 4py (m/z = 153·100 > 136·000), Cre (m/z = 114·100 > 86·100 or 86·009), XA (m/z = 206·110 > 178·068) and KA (m/z = 190·149 > 162·093). For the MNA and Cre transitions, the higher value was used based on the QC accuracy calculation (%). Furthermore, the areas of the detected metabolite peaks were normalised to the IS peak areas, and the concentrations were calculated based on the standard curve. These analyses were performed using Analyst Software (AB Sciex).
Table 1. Gradient conditions for LC/MS-MS analysis of niacin synthesis downstream metabolites
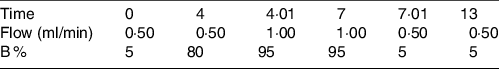
Table 2. Gradient conditions for LC/MS-MS analysis of niacin synthesis upstream metabolites

Statistical analysis
No previous reports have determined the appropriate sample size for pica behaviour in mice because these studies are rare. Therefore, we tentatively set the number of required mice as ten for each group. On the basis of previous results of pica behaviour, we decided that the maximum number of mice studied should be 5 (vehicle treatment) or 10 (INH treatment) to evaluate the significance. Data are expressed as mean values with their standard errors. Statistical analysis was performed by GraphPad Prism 8 software (GraphPad Software). Comparisons between two groups were carried out by the paired or unpaired t test. Multiple comparisons were carried out by two-way ANOVA (Tukey–Kramer post hoc test) or two-way repeated-measured ANOVA (Bonferroni post hoc test).
Results
Impact of a low-niacin diet
INH-induced pellagra has been reported in residents of countries at risk of poor nutrition, such as Malawi(Reference Nabity, Mponda and Gutreuter12); therefore, patient niacin levels seem to be associated with INH-induced pellagra. To elucidate the impact of a low-niacin diet on mouse pathology and physiology, mice were fed a CE-2 diet (CLEA Japan, Inc.) for 1 week and then transitioned to raise a normal diet or a low-niacin diet (Fig. 1(a)). The body weights of all the mice increased significantly from day 3 onwards compared with day 1 (Fig. 2(a)), and unexpectedly, there was no difference in body weight loss (or gain) between the two groups. In addition to body weight, we analysed niacin metabolites in the liver and urine by LC-MS/MS (Fig. 1(d)). Urine samples were collected from mice on day 11 and every day thereafter, and the concentrations of niacin-related metabolites were determined (Fig. 2(b)). Urine levels of MNA, NNO, 2-Py and 4-Py were significantly lower in mice fed the low-niacin diet compared with the mice fed a normal diet. Although there was no significant difference in the urine level of NAM between the two groups, the concentration of this metabolite tended to be lower in mice fed the low-niacin diet than in those fed a normal diet. On day 13, the mice were killed and their livers were collected to investigate liver levels of niacin-related metabolites (Fig. 2(c)). Liver levels of 4-Py, NAD and SAH were significantly lower in mice fed the low-niacin diet compared with those fed a normal diet. Although there was no significant difference in the levels of 2-Py and SAM between the two groups, the concentrations of these two metabolites tended to be lower in the mice fed the low-niacin diet compared with those fed a normal diet. Conversely, NAM and NMN liver levels were significantly higher in the mice fed the low-niacin diet compared with the mice fed a normal diet. Although there was no significant difference in MNA level between the two groups, the values tended to be higher in the low-niacin group compared with the normal diet group. Finally, there was no significant difference in the features of the faeces collected from the two groups’ cages from day 13 onwards (Fig. 2(d)).
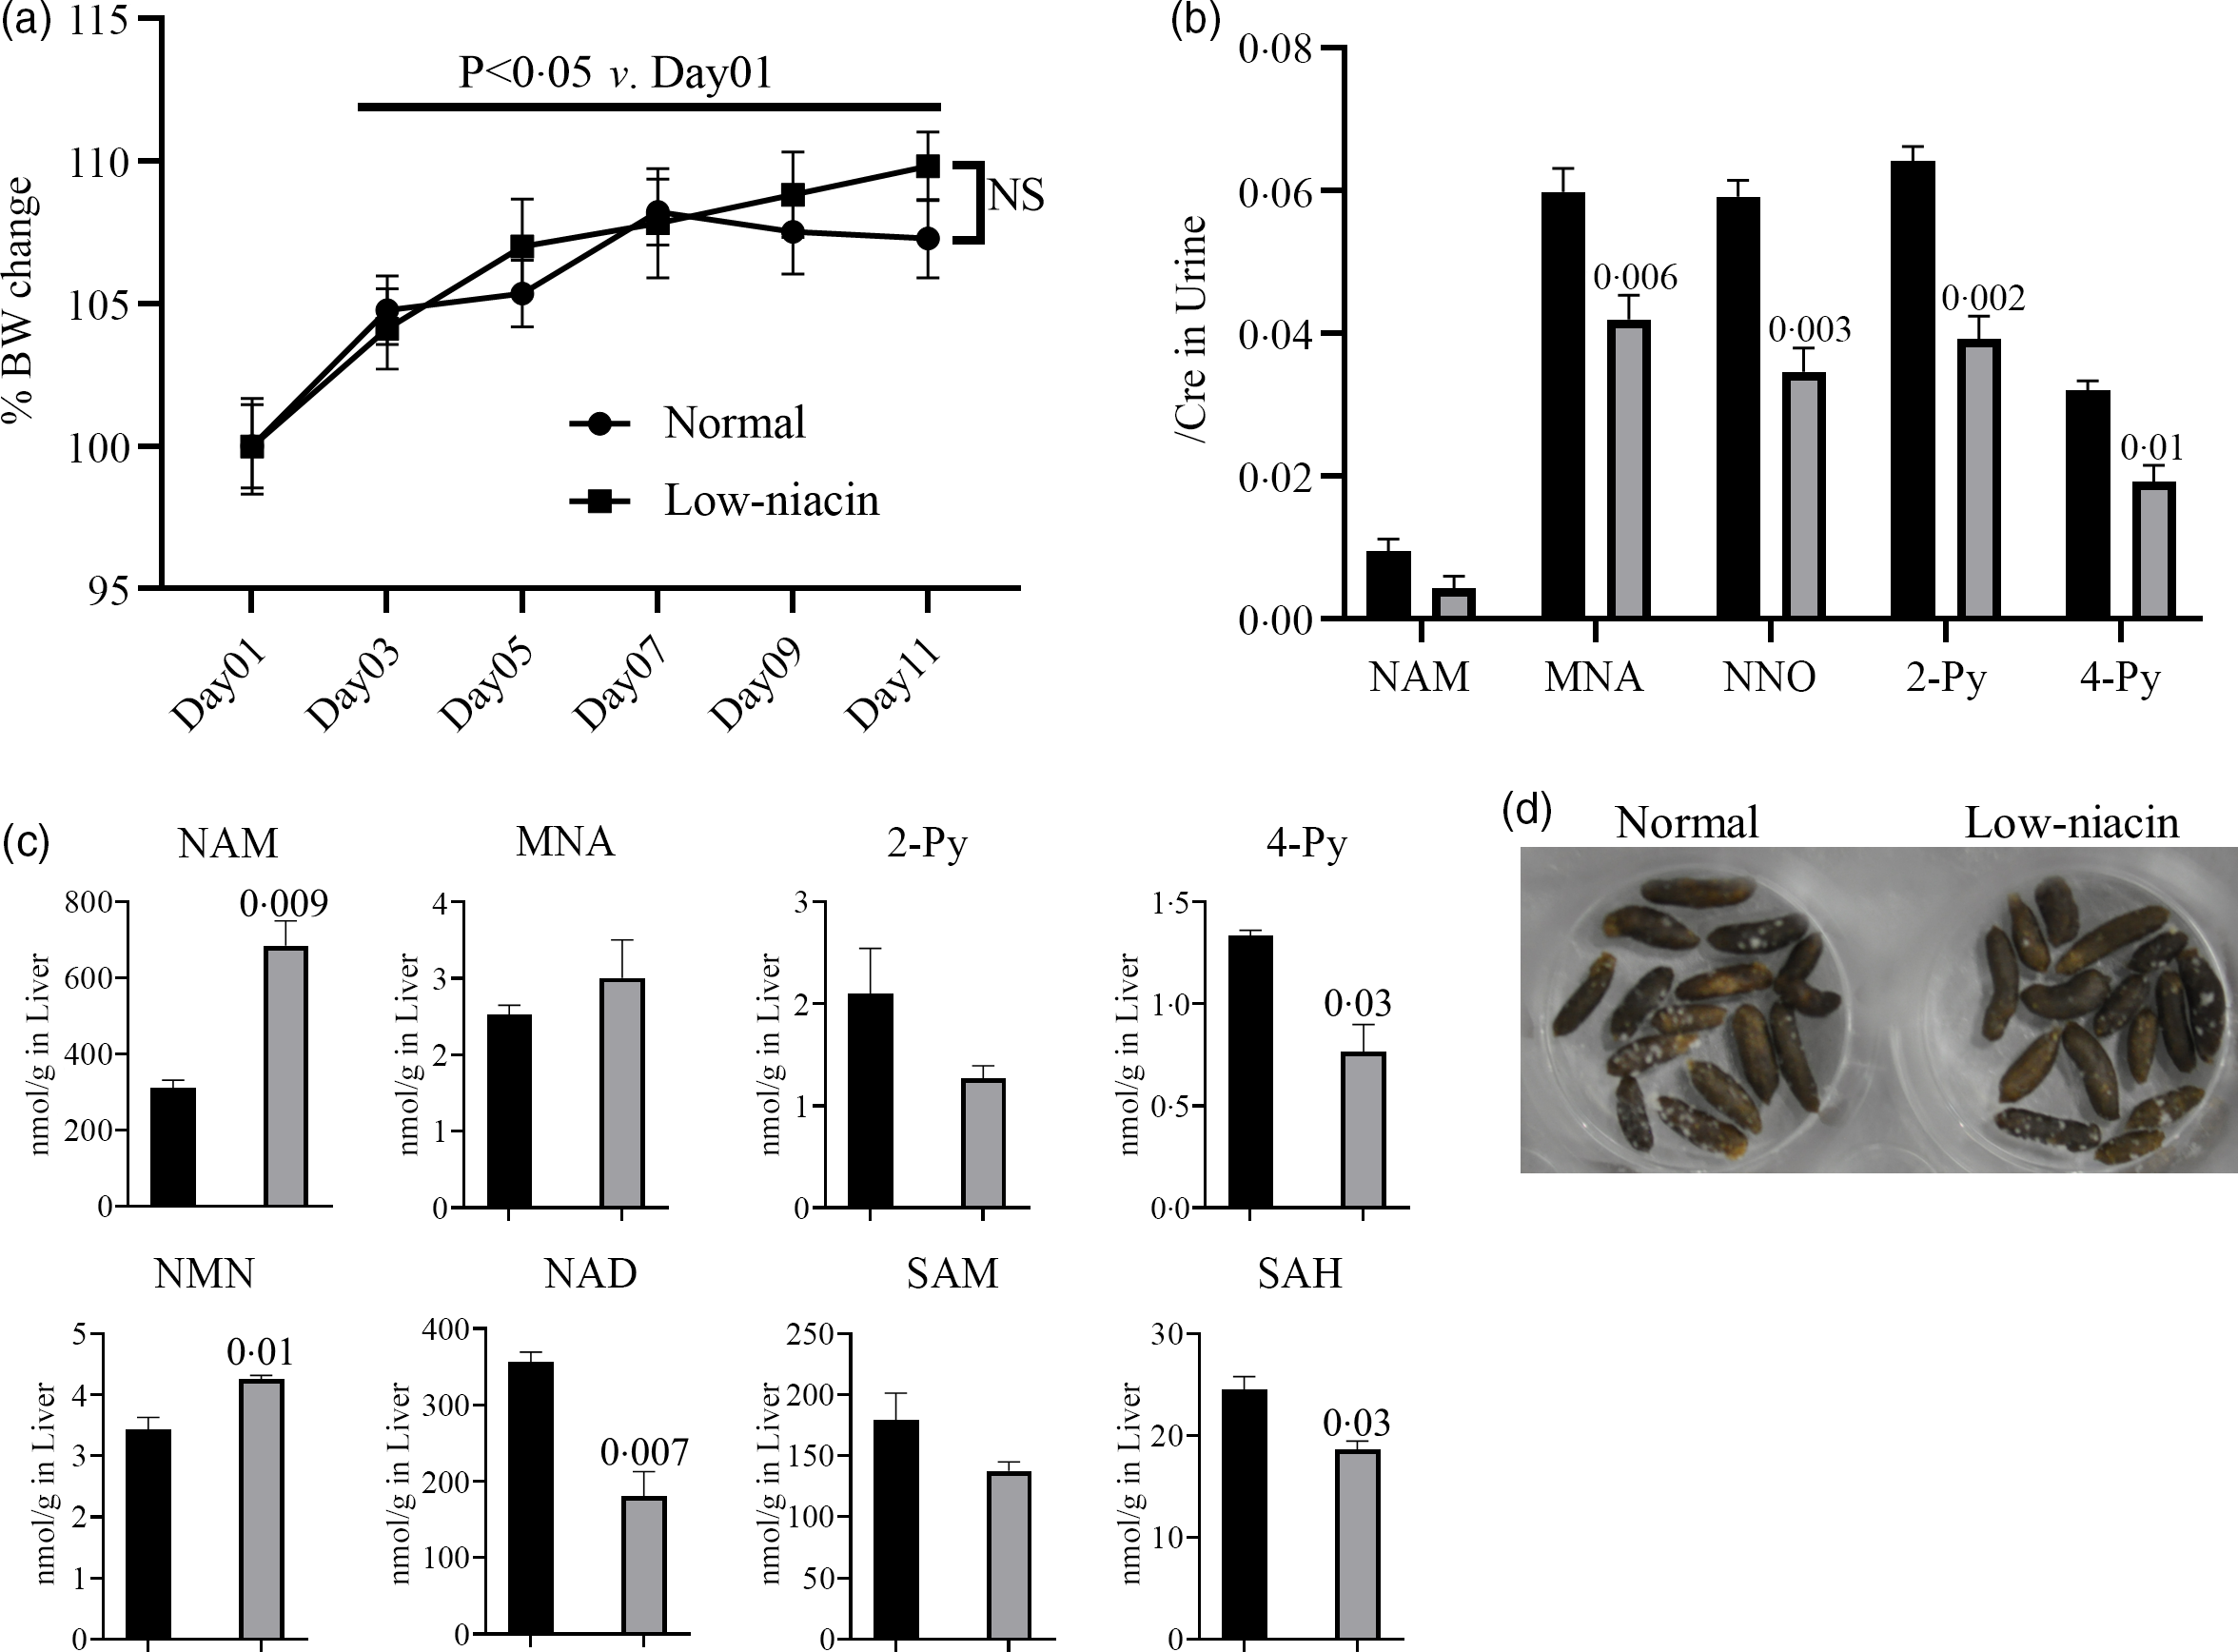
Fig. 2. Effect of low-niacin diets on mice. Feeding mice a low-niacin diet altered niacin metabolite levels in the urine and liver, although pica behaviours and faeces shape remained unchanged. These factors were evaluated according to the protocol shown in Fig. 1(a). (a) Growth curve for the normal diet group (n 5) and low-niacin diet group (n 5). No significant changes were observed in the low-niacin diet group compared with the normal diet group. (b) Urine levels of niacin metabolites, namely nicotinamide (NAM), 1-methylnicotinamide (MNA), nicotinamide-N-oxide (NNO), N'-methyl-2-pyridone-3-carboxamide (2-Py) and N'-methyl-4-pyridone-3-carboxamide (4-Py), were determined in both groups at day 11 (n 5). Vertical bars indicate the creatinine correction value of each metabolite. (c) Liver levels of niacin metabolites, namely NAM, MNA, 2-Py, 4-Py, N1-methylnicotinamide (NMN), nicotinamide adenine dinucleotide (NAD), S-adenosylmethionine (SAM) and S-adenosylhomocysteine (SAH), were determined in both groups at day 11 (n 5). Vertical bars indicate the amount of each metabolite (nmol/1 g of liver). (D) Shape of faeces at day 13. No significant differences between the two groups were observed. Data represent mean values with their standard errors, and statistical analysis was carried out as stated in the Methods section. The numbers in the graph were compared with a normal diet. The experiments were repeated twice. ![]() , Normal;
, Normal; ![]() , Low niacin
, Low niacin
Pica behaviour
Pellagra-related photosensitivity has been reported in a clinical situation, in an animal model(Reference Sugita, Ikenouchi-Sugita and Nakayama14) and in response to INH administration(Reference Brown2). However, other types of pellagra-related phenotypes such as nausea have not been reported in rodent models. In general, rodents did not possess an emetic reflex, unlike humans, dogs and ferrets(Reference Horn, Kimball and Wang19), but their pica behaviours are thought to be an emetic reflex(Reference Andrews and Horn20). Therefore, we assessed pellagra-related nausea in mice receiving INH and fed a low-niacin diet by evaluating pica (Fig. 1(b)). As shown in Fig. 3(a), body weight decreased significantly compared with pre-treatment (day 11) body weight in mice treated with INH for 5 d (1·0 mg twice a day). This pronounced change in body weight was not observed in mice treated with vehicle or a lower dose of INH (0·3 mg twice a day). On the basis of this result, we decided to administer INH for <5 or 6 d. The number of pica behaviours exhibited over a 15-min period was quantified 30 min after the first administration of INH every day (Fig. 3(b)). Obvious pica was observed beginning on days 13–15 in mice that received 1·0 mg of INH but was not observed in age-matched mice that received vehicle or 0·3 mg of INH. We defined pica as mice holding paper strips in their forepaws and observation of tooth marks on the paper strips (Fig. 3(c)). Given the quantity of paper consumed by each mouse during the observation periods, we speculated that there would be a corresponding change in the shape of their faeces. Therefore, we collected the nocturnal faeces from each cage to investigate their shape. Interestingly, the colour of the faeces produced on days 13–15 and onwards by mice that received 1·0 mg of INH changed noticeably from brown to white; this change was not observed in the faeces of mice that received vehicle or 0·3 mg of INH (Fig. 3(d)).

Fig. 3 Isoniazide (INH)-induced pica in mice fed a low-niacin diet. INH-induced pica in mice fed a low-niacin diet. This was evaluated using the protocol shown in Fig. 1(b). The day when mice started a low-niacin diet is referred to as ‘day 1’. (a) Kinetics of the percentage body weight (%BW) change from days 11–15 are shown as growth curves after each treatment (n 5 or n 10). The dosing period was 5 d because some mice that received 1·0 mg/head/twice daily (BID) died after receiving INH for more than 6 d or BW were greatly reduced in the remaining mice. (b) Kinetics of numbers of pica behaviour from days 11 to 15 are indicated to evaluate the amount of nausea. We quantified pica as the number of paper strips that exhibited evidence of having been nibbled or eaten, as shown in panel (c). (d) The effect of pica on the shape of faeces from days 11 to 15 was evaluated in mice with vehicle and INH (0·3 mg or 1·0 mg/head). Some faeces are indicated here. The colour of the faeces was correlated with pica and quantified as described in panel B. Data represent mean values with their standard error, and statistical analysis was carried out as stated in the Methods section. The experiments were repeated three times. ![]() , 0·3 mg/heade;▲, Vehicle;
, 0·3 mg/heade;▲, Vehicle; ![]() , 1.0 mg/head
, 1.0 mg/head
Niacin and niacin metabolites in mice with and without pica
Defects in niacin metabolism have been observed in patients with pellagra(Reference Nabity, Mponda and Gutreuter12), and therefore, we analysed liver and urine levels of niacin metabolites to determine whether INH caused pellagra-like symptoms (pica) in mice. MNA, NAD, NAM, NMN, 2-Py, 4-Py, SAH and SAM were detected in mouse livers 5 d after treatment with vehicle or INH (0·3 or 1·0 mg twice a day). The liver levels of NAM and NAD were significantly lower, and the levels of NMN, 2-Py and 4-Py were lower (but not statistically significant) in mice that received INH (1·0 mg twice a day) than those that received vehicle (Fig. 5(a)). Conversely, SAM and SAH levels were significantly higher in mice that received INH (0·3 or 1·0 mg twice a day) than those that received vehicle. The increase in SAH concentration was particularly pronounced. KA, XA, MNA, NAM, NNO, 2-Py and 4-Py urine levels were analysed on day 1 (pre-treatment), as well as 2, 3, 4 and 5 d after treatment with vehicle or INH (1·0 mg twice a day). The urine levels of KA, XA and NNO were significantly lower on day 2 in mice that received INH compared with the vehicle-only group and pre-treatment values. NNO urine levels were slightly increased on days 3 and 4 but were almost undetectable on day 5 and onwards. XA and KA urine levels remained low throughout the experimental period. Interestingly, MNA and NAM urine levels in mice that received INH were significantly lower compared with the vehicle-only group and pre-treatment values for only a limited period of time (on day 2). Conversely, 2-Py and 4-Py urine levels were significantly higher on day 5 in mice that received INH compared with the vehicle-only group and pre-treatment values.
Therapeutic effect of niacin
Pellagra is defined on the basis of whether niacin treatment cures its phenotypes(Reference Wan, Moat and Anstey1–Reference Hegyi, Schwartz and Hegyi3). Therefore, we investigated the effect of niacin supplementation on pica to validate our animal model for evaluating pellagra-related nausea (Fig. 1(c)). To quantify the effects, we collected nocturnal faeces from mice that received vehicle or INH and were fed stained paper strips. Interestingly, the colour of the faeces produced by mice that received 1·0 mg of INH twice a day and were fed a low-niacin diet changed noticeably from brown to red (pink) on days 13–14 and onwards; this colour change was not observed in the faeces of mice that received vehicle (Fig. 5(a)). Mice receiving INH clearly exhibited positive behavioural changes in response to niacin treatment, which was begun on day 11, compared with those that received vehicle instead of the niacin supplement (Fig. 5(a)). As shown in Fig. 5(b), pica behaviour was significantly increased in mice that received INH compared with those that received vehicle from days 13 to 14 onwards and significantly decreased in mice with pica that then received niacin supplementation compared with control mice that did not receive niacin supplementation. Finally, we quantitatively evaluated the effects of niacin supplementation by evaluating the carminic acid content of faeces produced by these mice. On the basis of our colorimetric analysis, the mice that received INH and were fed a low-niacin diet consumed more paper strips from days 13–14 onwards than did those that received vehicle. Pica was significantly decreased in mice that received niacin supplementation compared with those that did not receive supplementary niacin (Fig. 5(c)).
Next, we performed LC/MS-MS analysis of niacin metabolites in the urine to identify surrogate markers for pellagra-related nausea and validate the therapeutic effects of niacin supplementation (Fig. 6). Urine levels of KA, XA, NAM, NNO, 2-Py, 4-Py and MNA in mice fed a low-niacin diet that received INH were significantly lower than in mice that were fed a low-niacin diet but did not receive INH at day 13 onwards, and KA, XA, NNO and 2-Py levels were significantly lower at day 14 onwards (Fig. 6). Conversely, the levels of NAM, MNA, 2-Py and 4-Py in mice fed a normal diets that received INH were significantly higher on day 13 onwards than those observed in mice fed a low-niacin diet that received INH, and MNA, 2-py and 4py levels were significantly higher at day 14 onwards. Furthermore, although a significant increase in the level of SAH at days 13–14 onwards was observed in mice that received INH compared with those that received vehicle, the SAH level decreased after the mice were transitioned to a normal diet. This result shows that niacin supplementation has a positive therapeutic effect on NAM, MNA, 2-Py, 4-Py and SAM levels at day 13 and/or 14 onwards. Conversely, XA, KA and NNO levels were decreased in mice fed the low-niacin diet that received INH and did not increase even when the mice were transitioned to a normal diet.
Discussion
Although pellagra causes nausea(Reference Hegyi, Schwartz and Hegyi3) and INH is a putative cause of pellagra(Reference Bilgili, Karadag and Calka21,Reference Kipsang, Choge and Marinda22) , it is unclear whether INH-related symptoms such as nausea are directly related to pellagra. In this study, using an in vivo murine nausea model, we investigated the impact of INH on the development of pellagra-related nausea and the therapeutic effect of niacin supplementation. Our pharmacological data indicate that the pica observed in mice treated with INH and fed a low-niacin diet was caused, directly or indirectly, by pellagra.
Niacin-deficient diets cause body weight loss in rats and severe pathological conditions such as pellagra(Reference Rawling, Jackson and Driscoll23,Reference Shibata24) . To avoid these severe phenotypes, in our model, we used a low-niacin diet, but not a niacin-free diet (Tables S1 and S2). Our results indicate that the low-niacin diet did not cause body weight loss or pellagra in mice, suggesting that the low levels of niacin provided by this modified diet were enough to prevent the appearance of symptoms in this mouse model. As shown in Figs. 3 and 4, mice fed a low-niacin diet and treated with INH exhibited decreased levels of niacin metabolites, as well as pica. These results suggest that INH treatment exacerbates low-niacin levels and induces pica. Additionally, in clinical practice, undernourished patients who are treated with INH may be diagnosed with pellagra(Reference Kilkenny, Browne and Cuthill18,Reference Horn, Kimball and Wang19) . Furthermore, supplementation with niacin improved both symptoms (pica) and metabolite levels (Fig. 5 and 6). Thus, our findings suggest that INH-induced pica in mice fed a low-niacin diet mimics pellagra-related nausea. In humans, patients with pellagra appear to have both primary and secondary situations(Reference Prabhu, Dawe and Mponda5), but not just one of them.
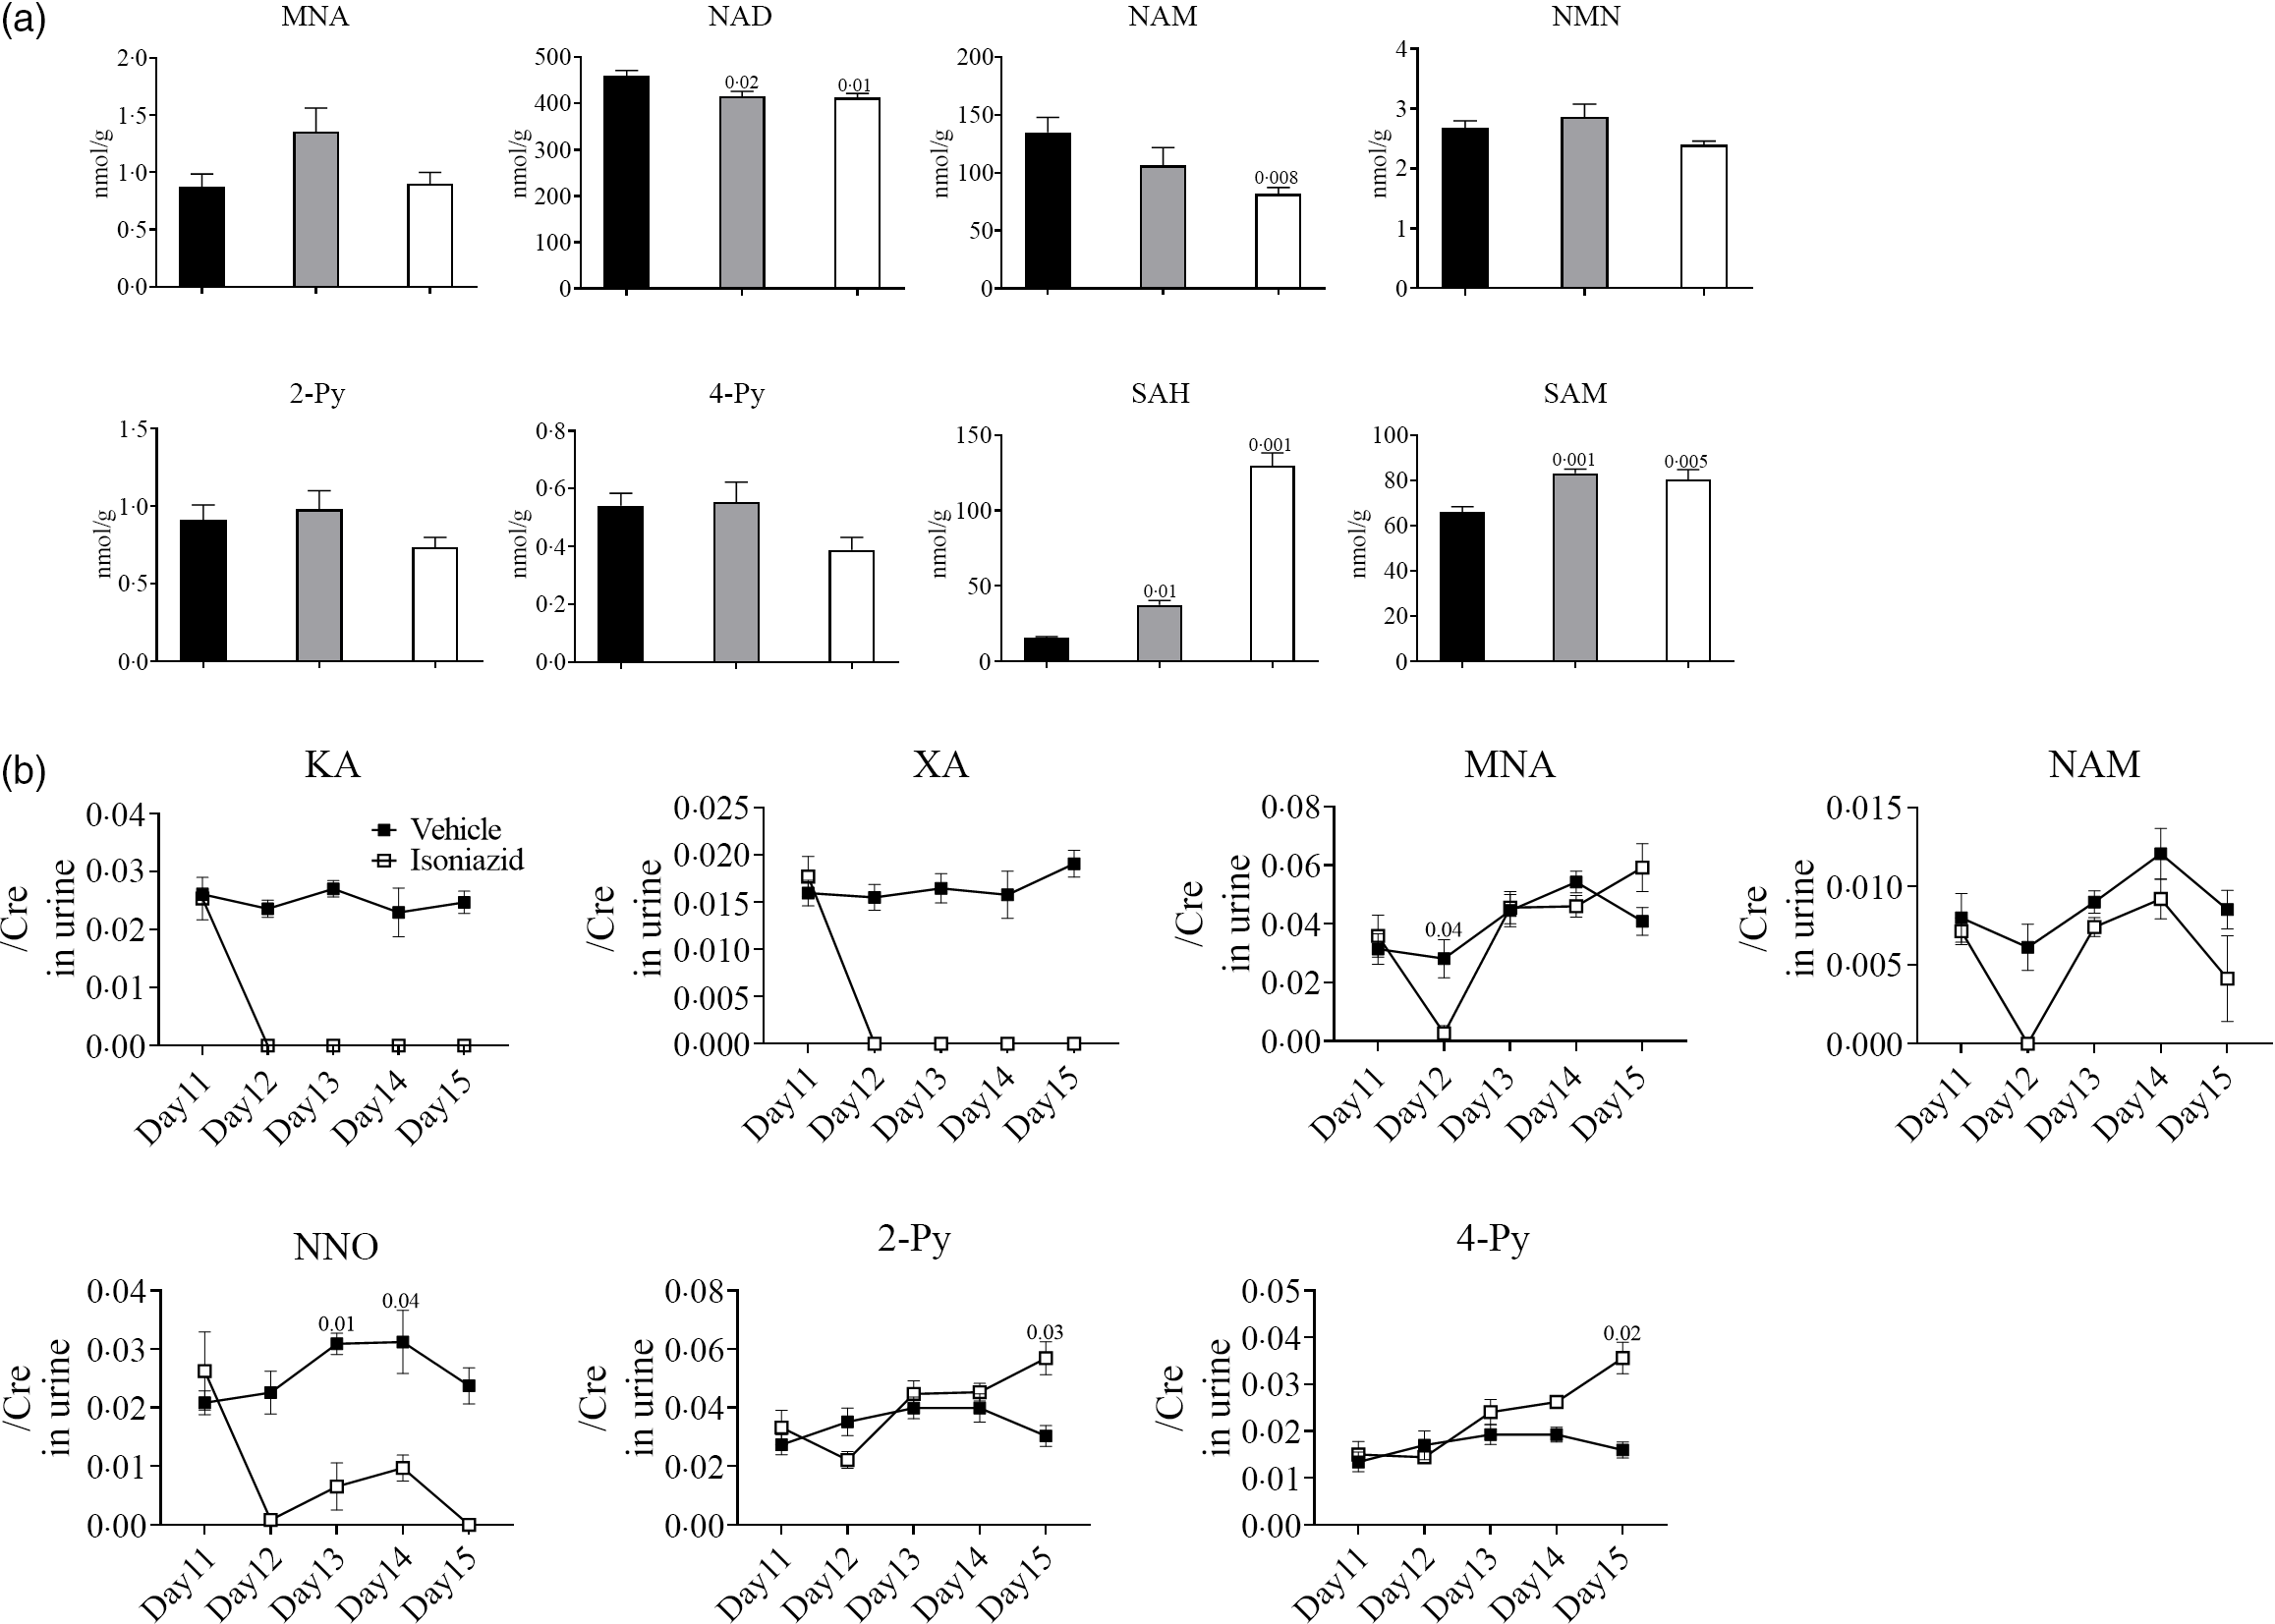
Fig. 4. Urinary and liver metabolites in mice exhibiting INH-induced pica. Analysis of metabolites by LC/MS-MS, performed as shown in Fig. 1(b). The day when mice started a low-niacin diet is referred to as ‘day 1’. Livers were collected on day 13, and urine was collected daily just after first administration. (a) Liver levels of niacin metabolites, namely N-methylnicotinamide (MNA), nicotinamide adenine dinucleotide (NAD), nicotinamide (NAM), N1-methylnicotinamide (NMN), N'-methyl-2-pyridone-3-carboxamide (2-Py), N'-methyl-4-pyridone-3-carboxamide (4-Py), S-adenosylhomocysteine (SAH) and S-adenosylmethionine (SAM), are indicated. The vehicle group is shown in black (n 5), and the INH groups are shown in grey (0·3 mg/head per BID, n 10) or white (1·0 mg/head per BID, n 10). Vertical bars indicate the amount of each metabolite (nmol/1 g of liver). (b) Urine levels of niacin metabolites, namely kynurenic acid (KA), xanthurenic acid (XA), MNA, NAM, NNO, 2-Py and 4-Py, are indicated. The vehicle group is shown in black (n 5), and the INH group is shown in white (1·0 mg/head per BID, n 10). Vertical bars indicate the creatinine correction value of each metabolite. Data represent mean values with their standard error, and statistical analysis was carried out as stated in the Methods section. The numbers in the graph were compared with a normal diet. The experiments were repeated twice. ![]() Vehicle;
Vehicle; ![]() , 1·0 mg/head
, 1·0 mg/head

Fig. 5. Beneficial effects of niacin supplementation on isoniazid (INH)-induced pica. This experiment was performed according to the protocol shown in Fig. 1(c). The day when mice started a low-niacin diet is referred to as ‘day 1’. (a) Faeces were collected on days 13 and 14 from mice on a normal diet for 4 d after being on a low-niacin diet for 11 d with vehicle or INH (1 mg/head) and mice on a low-niacin diet with vehicle or INH (1 mg/head). Some of the faeces are indicted. (b) Nausea was quantitatively evaluated by pica behaviour at days 13 and 14 in mice on a normal diet for 4 d after being on a low-niacin diet for 11 d with vehicle (n 5) or INH (1 mg/head, n 10) and mice on a low-niacin diet for 15 d with vehicle (n 5) or INH (1 mg/head, n 9). (C, D) INH-induced pica was decreased after mice were changed to a diet with an appropriate amount of niacin (normal diet). To quantitatively determine pica, the amount of paper strips (mg/100 mg of faeces) was calculated using a calibration curve (online Supplementary Fig. S2). (c) The colour of extracted carmine from faeces is shown in (d). Data represent mean values with their standard error, and statistical analysis was carried as stated in the Methods section. The numbers in the graph were compared with a normal diet. The experiments were repeated twice.
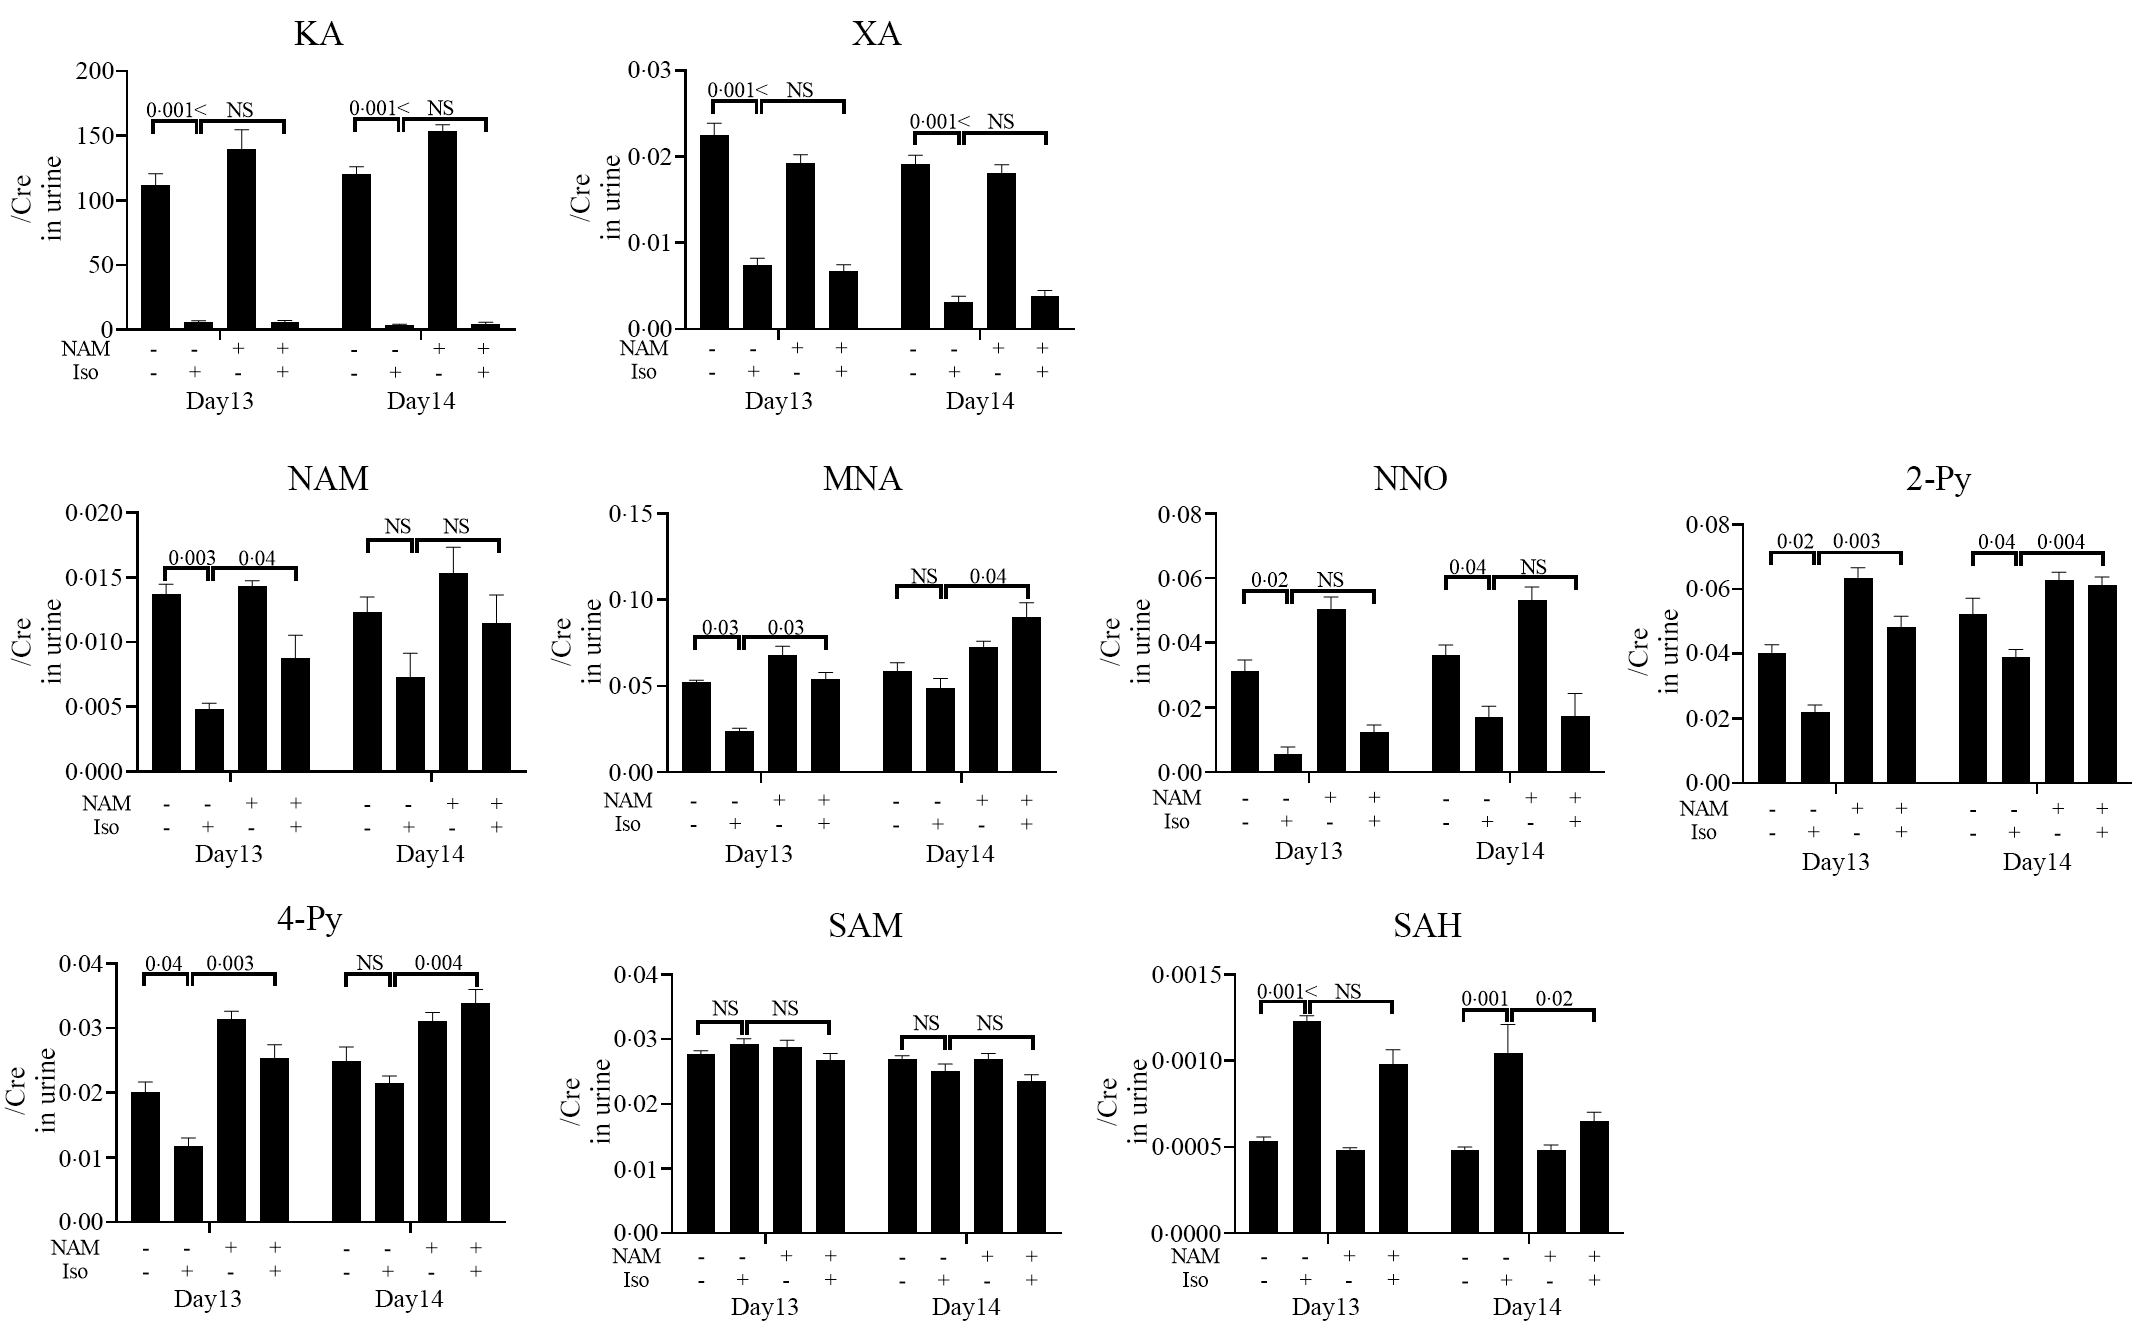
Fig. 6. Urinary niacin metabolites in mice that exhibited INH-induced pica after being fed a normal diet. This experiment was performed according to the protocol shown in Fig. 1(c). The day when mice started a low-niacin diet is referred to as ‘day 1’. LC/MS-MS analysis of niacin metabolites in urine at days 13 and 14. (a) Nausea was quantitatively evaluated using urine levels of niacin metabolites, namely kynurenic acid (KA), xanthurenic acid (XA), nicotinamide (NAM), N-methylnicotinamide (MNA), nicotinamide-N-oxide (NNO), N'-methyl-2-pyridone-3-carboxamide (2-Py), N'-methyl-4-pyridone-3-carboxamide (4-Py), S-adenosylmethionine (SAM) and S-adenosylhomocysteine (SAH), from mice on a normal diet for 4 d after being on a low-niacin diet for 11 d with vehicle (n 5) or INH (1 mg/head, n 10) and mice on a low-niacin diet for 15 d with vehicle (n 5) or INH (1 mg/head, n 9). Vertical bars indicate the creatinine correction value of each metabolite. Data represent mean values with their standard error, and statistical analysis was carried out as stated in the Methods section. The numbers in the graph were compared with a normal diet. The experiments were repeated twice.
Pellagra is easy to diagnose if patients present with all the main symptoms (dermatitis, diarrhoea, dementia) but can be more difficult to identify if only one or two symptoms are present(Reference Brown2,Reference Cao, Wang and Cestodio25,Reference Yahata, Abe and Tsunoda26) . Pellagra-related photosensitivity has been reported in some clinical cases of pellagra, such as a patient suffering from chronic alcohol dependence(Reference Badawy27), a patient with restricted dietary intake due to an eating disorder(Reference Zaenglein, Martin and Carlson28) and an undernourished patient treated with INH(Reference Bilgili, Karadag and Calka21,Reference Kipsang, Choge and Marinda22) . In all these cases, nutritional status was a key factor in the development of pellagra. Similarly, feeding mice a low-niacin diet induced pellagra-like nausea, while nausea-like symptoms were not observed in mice that received INH but were fed a normal diet (data not shown). It is possible that the incidence of pellagra is underestimated due to low rates of photosensitivity in these patients because some patients may live in areas with little sunlight and therefore may not exhibit this symptom. Furthermore, patients with mild pellagra may exhibit digestive symptoms but not dermatitis, and a diagnosis of pellagra is usually based on dermatological symptoms. Hence, we analysed niacin metabolites using LC/MS-MS to identify potential surrogate markers for mild pellagra, similar to a previous study(Reference Irie, Inagaki and Fujita29), and found that 2-Py and 4-Py(Reference Bender10) were good markers for mild pellagra in our model (Fig. 2(b)). We expect that these biomarkers will be useful clinically for the diagnosis of pellagra in the future.
Pellagra patients improve dramatically after being treated with niacin; therefore, early diagnosis is important. We expect that our model and biomarker contribute to the development of diagnosis for pellagra. Additionally, there are many kinds of medicine, which cause photosensitivity and/or nausea. Using our system, we could evaluate whether each medicine causes mild pellagra or not. Furthermore, previous studies indicated that mice with cisplatin-related pica were improved by antiemetic agents such as ondansetron, which were used in a clinical site(Reference Tohei, Kojima and Ikeda30). Because this INH-related pica was significantly attenuated after niacin treatment only in rodents, it needs further investigations in clinical research.
In our study, we found that a low-niacin diet caused changes in urinary and liver metabolite levels. Liver levels of NAM, NMA and MNA were increased in mice fed a low-niacin diet (Fig. 3(c)), which seems to have been due to the need to maintain homoeostasis. In mammals, NAM is mainly biosynthesised in liver and converted to NAD, which is an essential coenzyme for the multiple redox reaction(Reference Fukuwatari and Shibata7). Therefore, we presume that NAM and NMN levels in the liver increased to facilitate the NAD cycle (Fig. 1). There was no significant difference in urine NAM levels between the groups. Interestingly, treatment with INH reduced liver levels of most niacin metabolites, with the exception of SAM and SAH, which were increased (Fig. 5(a)). It has been proposed that INH is a competitive inhibitor of vitamin B6 (Reference Mascolo and Vernì8,Reference Rodà, Rozas and Fortuny9) . Another study showed that SAH levels are increased in the liver of rats fed a low-vitamin B6 diet(Reference Nguyen, Hayakawa and Tsuge31). Thus, it seems likely that SAH levels increased due to INH inhibition of vitamin B6. Additionally, NAM catabolism to MNA is mediated by nicotinamide N-methyltransferase, and this reaction facilitates the SAM cycle (SAM→SAH) (Fig. 1). Therefore, we presume that SAM accumulation occurred because NAM levels, and hence NAM catabolism by nicotinamide N-methyltransferase, decreased and that this effect was greater than that induced by the competitive inhibition of vitamin B6 by INH. Urine levels of all metabolites analysed except for NNO, XA and KA increased from day 2 onwards (Fig. 5(b)). It seems that NAM biosynthesis increased to maintain homoeostasis. However, NNO, XA and KA levels were almost undetectable at day 5 onwards. NAM is catabolised to NNO by Cytochrome P450 (P450)(Reference Real, Hong and Pissios32), and INH inhibits P450(Reference Desta, Soukhova and Flockhart33). Therefore, we presume that NNO levels did not recover because NAM catabolism to NNO was inhibited by INH. Furthermore, vitamin B6 acts as a coenzyme in XA and KA synthesis. Because vitamin B6 is inhibited by INH, XA and KA levels did not increase after treatment with INH. We suspect that urinary levels of NNO, XA and KA did not increase despite transitioning to a normal diet for the reasons mentioned above.
The molecular mechanism underlying the development of pellagra-related photosensitivity is unclear. Recently, Sugita et al. reported that prostaglandin E2 is a key player in the development of the pellagra-related photosensitivity, using an appropriate animal model(Reference Sugita, Ikenouchi-Sugita and Nakayama14). Here, we developed a murine model to investigate the molecular mechanism responsible for pellagra-related nausea, as described previously(Reference Yamamoto, Nakai and Nohara15). In this earlier study, kaolin stained with carminic acid was used to quantitate pica. Although we attempted to use the same evaluation system, we found that mice without pica often played with and sometimes ate the kaolin, so in practice, faeces from some of the control mice turned pink. Hence, we used paper strips stained with carminic acid that were not consumed by the control mice (Fig. 5(a)) because almost all the faeces collected from this group were brown, not pink. When faeces are collected from cages for evaluation, it is important to avoid coprophagia, which is often seen in mice(Reference Soave and Brand34). Thus, cages with wire mesh floors were used. Prior to using these specialised cages, we found that less faeces were collected from mice treated with INH and fed a low-niacin diet compared with those that did not receive INH because undernourished mice tend to eat faeces to obtain vitamins(Reference Soave and Brand34). Furthermore, while rodents such as mice are typically nocturnal in nature(Reference Hoogenboom, Daan and Dallinga35–Reference Gattermann, Johnston and Yigit37), a diurnal pattern of activity is rare in experimental environments and mice therefore eat and drink freely throughout the day and night(Reference Hut, Pilorz and Boerema38). In our experiments, we did not place any restrictions on feeding conditions. We found that semi-quantitative evaluation of diurnal pica behaviour was difficult to achieve because activity levels varied widely among mice and between experiments. Thus, we used faeces to quantitatively evaluate pica, which is typically thought of as a nocturnal behaviour. Using this approach, we found that faeces collected from mice with INH-induced pica contained huge amounts of paper strips. Thus, a colorimetric method, which is easy to perform but has low sensitivity, was used to evaluate pica quantitatively, as described previously(Reference Yamamoto, Nakai and Nohara15). When higher sensitivity is required, LC- or LC/MS-based methods should be developed. Using cages with wire mesh floors had a drawback in that pica behaviour was reduced in mice kept in these cages compared with those kept in standard cages (Fig 3 and 5). This suggests that mouse behaviour is affected by environment.
One of the strengths of our experiments is that we used a paper strip stained with carminic acid to quantitatively evaluate pica. This reduced the background signal compared with that of kaolin(Reference Yamamoto, Nakai and Nohara15). However, our method also has several limitations. First, avoiding coprophagia in some mice was difficult. Second, the sensitivity of our colorimetric method was insufficient to distinguish subtle differences. Finally, and perhaps most importantly, our data were from rodents rather than humans.
Overall, our study shows that INH-related nausea is similar to pellagra. We also believe that our newly established method for quantifying pica is useful for investigating the mechanisms of pellagra-related nausea. Furthermore, using this model, we were able to determine pellagra-related phenotypes, which had not previously been recognised as pellagra, and its putative cause.
Acknowledgements
The authors would like to thank C. Nekomoto (Shionogi Co. Ltd) for scientific advice regarding photosensitivity. We thank Emily Crow, PhD, and Ellen Knapp, PhD, from Edanz (https://jp.edanz.com/ac) for editing a draft of this manuscript.
This work was supported by joint research funding from Shionogi Co. Ltd.
The authors have no conflicts of interest.
Conception and design of the work: K. K., N. S., T. I., T. K. and T. Y.; acquisition, analysis or interpretation of data for the work: N. S., T. K. and T. Y.; drafting of the manuscript revising for intellectual content: K. K., N. S., T. I., T. K. and T. Y. and critically reviewing the manuscript: K. K., N. S., T. K. and T. Y. All authors have approved the final version of the manuscript.
Supplementary material
To view supplementary material for this article, please visit https://doi.org/10.1017/S0007114521001835


