


Malnutrition is widely identified among cirrhotic patients. Nevertheless, its prevalence varies greatly because it depends upon the methods used for the nutritional assessment and the characteristics of the study population(Reference Tandon, Raman and Mourtzakis1). Malnutrition is more prevalent in the decompensated stage of cirrhosis(2) and seems to represent a crucial factor for disease prognosis, justifying its initial inclusion in the original Child–Pugh score, although it was soon removed for practical reasons. Poor nutritional state of cirrhotic patients has been associated with lower quality of life(Reference Shiraki, Nishiguchi and Saito3), increased risk of complications and higher mortality rate(Reference Maharshi, Sharma and Srivastava4, Reference Alberino, Gatta and Amodio5).
Deterioration of nutritional status in cirrhotic patients is multifactorial. It could be the result of inadequate dietary intake; insufficient nutritional quality; disorders of digestion, absorption and metabolism of nutrients; as well as a potential increase of energy needs(Reference Bemeur, Desjardins and Butterworth6). Elevated levels of proinflammatory cytokines, gastrointestinal disturbances due to the presence of ascites or multiple medication use, along with low palatability of low-salt diet frequently prescribed in cirrhotic patients are the most common reasons for decreased appetite. As a consequence, it is common that those patients do not meet the dietary requirements, especially the 15–30 % of patients who are hypermetabolic(Reference Mouzaki, Ng and Kamath7).
As malnutrition is considered a modifiable condition, it is crucial to be identified early in cirrhotic patients so that they can receive adequate nutritional intervention whenever needed. In 2018, the Global Leadership Initiative on Malnutrition published global diagnostic criteria for malnutrition(Reference Jensen, Cederholm and Correia8). Meanwhile, the European Association for the Study of the Liver (EASL) released clinical practice guidelines regarding nutritional management in chronic liver disease(9). Both publications suggest that an initial rapid screening tool should be implemented to all cirrhotic patients, and those identified at risk for malnutrition should be referred for a detailed nutritional assessment. So far, there are only two nutritional screening tools developed especially for liver disease patients, namely the Liver Disease Undernutrition Screening Tool (LDUST)(Reference Booi, Menendez and Norton10) and the Royal Free Hospital Nutritional Prioritizing Tool (RFH-NPT)(Reference Arora, Mattina and McAnenny11). However, further validation is needed for these two tools in different populations, as acknowledged both by EASL and the European Society for Clinical Nutrition and Metabolism (ESPEN)(9, Reference Plauth, Bernal and Dasarathy12). Furthermore, given that malnutrition risk screening is a routine procedure often implemented on a hospital-level for screening of all the inpatients and outpatients, studies evaluating the validity of non-liver disease-specific screening tools in detecting cirrhotic patients at risk for malnutrition are also important.
An ideal screening tool should be easily implemented in the clinical setting and should show adequate sensitivity and specificity. Thus, the aim of the present study was to assess the effectiveness of eight screening tools in detecting malnutrition risk, by comparing them with a more sophisticated method of malnutrition diagnosis, that is, the Subjective Global Assessment (SGA), in a group of cirrhotic patients of various disease stages and aetiology. Moreover, the predictive validity of within 1-year mortality of the most accurate tools was also calculated.
Materials and methods
Study sample
One hundred seventy patients (97 males) from the KIRRHOS study (study for the evaluation of dietary intake, body composition and performance status in cirrhotic patients) participated in this cross-sectional evaluation. All patients were adults (>18 years; mean age 59·4 (sd 10·5) years) and they were consecutively enrolled from three outpatient liver clinics (Academic Department of Gastroenterology, Laiko General Hospital of Athens; Second Academic Department of Internal Medicine, Hippokratio General Hospital of Athens; and First Department of Internal Medicine and Department of Gastroenterology, Army Share Fund Hospital of Athens) from June 2015 to July 2018. The diagnosis of cirrhosis was based on a liver biopsy or a combination of clinical, laboratory and imaging data (Fibroscan values >12KP, or clinical picture of decompensated cirrhosis). Exclusion criteria included the period of gestation and lactation, presence of hepatocellular or other forms of cancer, hepatic coma, diagnosed acquired immunodeficiency syndrome, renal or pancreatic insufficiency and active enteral feeding. Patients with alcoholic cirrhosis were included in the study only if alcohol intake had already been ceased for at least 1 month before study enrolment. Participants were fully informed about the aims of the study and signed a consent form. All patients underwent a baseline nutritional assessment and afterwards they were followed up for 1 year, and data regarding mortality were prospectively collected. The protocol has been approved by the Bioethics Committee of Harokopio University and the Scientific Committees of all participating hospitals, and it has been registered in the ClinicalTrials.gov system (ID: NCT03242798). The study’s flow chart is presented in Fig. 1.
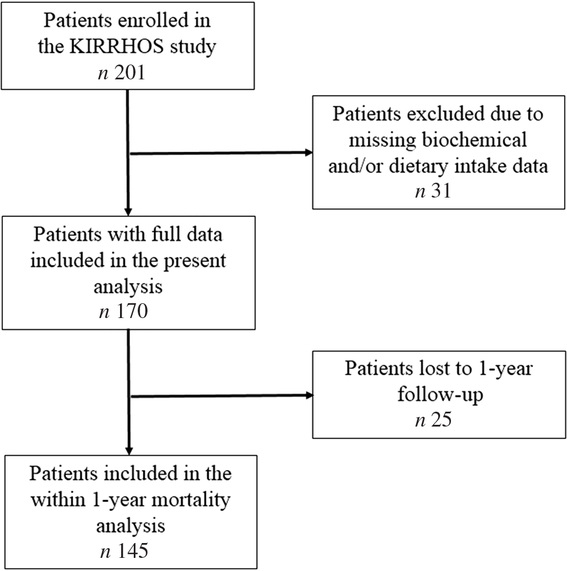
Fig. 1. Flow chart of the study.
Medical assessment
Co-morbidities, any medical treatment received as well as supplements used were recorded during the medical assessment implemented by study physicians after participant recruitment. Any clinical manifestation related to cirrhosis, such as ascites, oedema, oesophageal or gastric varices and encephalopathy, were also recorded, as well as their severity. Patients were classified as compensated or decompensated based on the absence or presence, respectively, of the above-mentioned clinical complications. Information about aetiology of cirrhosis, potential therapeutic interventions, as well as recent levels (within a month prior to baseline evaluation) of total protein, albumin, total bilirubin, serum creatinine and prothrombin time were also collected from the medical records. Based on the biochemical data collected, Model for End-stage Liver Disease (MELD)(Reference Freeman, Wiesner and Harper13) and Child–Pugh scores(Reference Pugh, Murray-Lyon and Dawson14) were calculated for the estimation of disease severity. At the 1 year of follow-up, mortality data and data on disease progression and manifestation of complications (ascites, encephalopathy, jaundice and variceal bleeding) were collected.
Anthropometry
A detailed anthropometric assessment was performed in all study participants. Body weight (BW) was measured using an analogue scale and height using a stadiometer (Seca 711). Dry BW was calculated, as suggested by the recent EASL guidelines(9), by subtracting 5 % of the measured BW for mild ascites, 10 % for moderate ascites and 15 % for tense ascites, with an additional 5 % subtracted if bilateral pedal oedema was present. Dry BMI was calculated dividing dry weight (in kilograms) by the square of height (in metres)(Reference Garrow and Webster15).
Data regarding weight history and any recent loss, deliberately or involuntarily, over the last year, 6 and 3 months and 2 weeks were also recorded. Patients were asked for any observed loss of muscle or fat mass, but also for a feeling of fatigue or decreased functionality. Possible gastrointestinal disturbances or chewing and swallowing problems affecting their appetite and dietary intake were also recorded.
Dietary assessment
Dietary intake was assessed using three 24-h recalls, a method already acknowledged by EASL as an optimal one for dietary assessment in patients with cirrhosis(9). In particular, for each patient, three non-consecutive 24-h recalls (2 weekdays and 1 weekend day) were recorded by an experienced dietitian, thus limiting the risk of bias. The recall interview was based on the ‘five-step multiple pass’ method proposed by the US Department of Agriculture(Reference Moshfegh, Borrud and Perloff16). Data were analysed for energy and macronutrient intake using the Nutritionist Pro software (Axxya Systems, version 2.2). Energy intake was compared with the total daily energy requirements to assess the adequacy of dietary intake. Basal metabolic rate was computed by implementing the equations for energy requirement estimation by FAO/WHO/UNU(17). As inserted BW, we used dry BW for patients with dry BMI ≥20 and <25 kg/m2. For patients with dry BMI <20 kg/m2, desired BW was used, estimated as the BW corresponding to BMI 20 kg/m2. For overweight and obese patients, with dry BMI ≥25 kg/m2, desired BW was used, estimated as the BW corresponding to BMI 25 kg/m2.
Patients were evaluated at baseline and received written nutritional advice on balanced eating according to relevant dietary guidelines(Reference Plauth, Merli and Kondrup18, Reference Amodio, Bemeur and Butterworth19). No other dietary intervention was offered to them from baseline until the 1-year follow-up.
Nutrition risk screening tools
Eight prominent screening tools were assessed for their effectiveness in detecting malnutrition risk. Out of those, the six non-disease-specific tools were designed to be implemented to either inpatients, outpatients or the geriatric population (i.e. the Malnutrition Universal Screening Tool (MUST)(Reference Elia20), the Nutritional Risk Index (NRI)(Reference Buzby, Knox and Crosby21), the Malnutrition Screening Tool (MST)(Reference Ferguson, Capra and Bauer22), the Nutritional Risk Screening (NRS-2002)(Reference Kondrup, Rasmussen and Hamberg23), the Birmingham Nutritional Risk Score (BNR)(Reference Reilly, Martineau and Moran24) and the Short Nutritional Assessment Questionnaire (SNAQ)(Reference Kruizenga, Seidell and de Vet25)). The other two were specifically designed for patients with advanced liver disease, namely the RFH-NPT(Reference Arora, Mattina and McAnenny11) and the LDUST(Reference Booi, Menendez and Norton10). To certify the adequacy of translation for the three self-completed questionnaires (MST, SNAQ and LDUST), before handing them to any patient, they were translated by two independent translators into the Greek language and then back-translated into English. The backward translation was then assessed by a native English speaker for comments, and the final versions were administered to the patients. For the use and translation of all the above-mentioned questionnaires, written licences have been obtained either by the lead researchers who had designed them or their publishers.
Nutritional assessment
Subjective Global Assessment. The SGA questionnaire is the most broadly utilised nutritional assessment tool for patients irrespective of disease aetiology(Reference Detsky, McLaughlin and Baker26) and is included as one of the recommended nutritional assessment tools for liver disease patients both by ESPEN and EASL(9, Reference Plauth, Bernal and Dasarathy12). It comprises questions regarding weight loss, unintentional reduction of dietary intake, gastrointestinal disturbances, physical function, muscle and fat mass loss and fluid retention. Adequate nutritional state is indicated as grade A, moderate malnutrition as grade B and severe malnutrition as grade C.
Statistical analysis
A total of 162 patients were required to evaluate two-sided differences at 5 % significance level (i.e. 95 % CI) based on the following assumptions: (i) malnutrition prevalence was about 20 % in compensated and 50 % in decompensated cirrhosis(2), (ii) mean malnutrition prevalence was 35 % in a mixed population equally derived from both disease stages, and (iii) the annual population size of cirrhotic patients visiting the outpatient clinics and eligible for recruitment were 300. The achieved statistical power (i.e. type II error) was 99 %.
Categorical variables were presented as absolute numbers and relative frequencies. The normality of continuous variables was examined with the Shapiro–Wilk test and graphically through histograms. Normally distributed continuous variables were expressed as means and standard deviations. Sensitivity, specificity, positive and negative predictive values (PPV and NPV) and positive and negative likelihood ratios (PLR and NLR) were calculated for the various screening tools against SGA.
For all screening tools, receiver operating characteristic (ROC) curves were developed using SGA as the reference method of comparison. The ROC AUC was computed for each screening tool and the optimum cut-off point based on the calculation of the Youden index, which is the maximum vertical distance between the ROC curve and the diagonal line, was also estimated. The Youden index (J) was calculated as J = max (sensitivity + specificity − 1)(Reference Youden27, Reference Fluss, Faraggi and Reiser28). Using the new cut-off point for each screening tool, sensitivity, specificity, PPV, NPV, PLR and NLR with their 95 % CI and the new prevalence of malnutrition risk were calculated. Generalised linear models for predicting the binary outcome were applied to assess the relative risk (RR) of within 1-year mortality in relation to the baseline risk of malnutrition according to the SGA and the screening tools that proved to be accurate in identifying malnutrition, after adjusting for the following confounders: age (years), sex (male/female), disease aetiology (alcoholic/viral/non-alcoholic steatohepatitis) and MELD score or Child–Pugh score.
Statistical analysis was performed using IBM SPSS Statistics for Windows, version 24.0 (IBM Corp. 2016). The statistical significance threshold was set at 0·05.
Results
Participants’ basic characteristics per nutritional status according to the SGA are presented in Table 1. Among the total study sample, 30 % of the patients were overweight and 38·8 % obese. Chronic infection with hepatitis B or C virus was the leading cause of cirrhosis among the study participants, accounting for 55·9 % of disease aetiology. The study sample was evenly distributed according to disease stage, with 49·4 % of patients having decompensated cirrhosis. There was a significant association between nutritional status according to the SGA and occupational status and BMI. Moreover, patients with decompensated cirrhosis had almost double rates of malnutrition according to the SGA, whereas malnourished patients had higher disease severity scores both according to MELD and Child–Pugh (all P < 0·001). Regarding the cause of cirrhosis, malnutrition was more prevalent in patients with alcoholic cirrhosis (Table 1).
Table 1. Descriptive characteristics of the total study sample and by nutritional state, as identified by the Subjective Global Assessment (SGA)
(Numbers and percentages; mean values and standard deviations or 1st–3rd quartiles)
HCV, hepatitis C virus; HBV, hepatitis B virus; NASH, non-alcoholic steatohepatitis; PBC, primary biliary cholangitis; MELD, Model for End-stage Liver Disease.
* Probability values as derived by χ 2 test or two-samples t test or Mann–Whitney test for comparisons between well-nourished and malnourished patients.
Prevalence of malnutrition risk and malnutrition status based on the different methods applied
Estimated percentage of patients being at risk for malnutrition varied according to the screening tools used ranging between 13·5 and 54·1 % of the total sample (Table 2). More specifically, MST showed the lowest prevalence of malnutrition risk, while LDUST the highest. The SGA estimated malnutrition at 23 % with 131 patients categorised as class A (77 %), twenty-nine patients as class B (17 %) and ten patients as class C (6 %).
Table 2. Diagnostic evaluation of the nutritional screening tools compared with the Subjective Global Assessment (SGA)*

Se, sensitivity; Spe, specificity; PPV, positive predictive value; NPV, negative predictive value; PLR, positive likelihood ratio; NLR, negative likelihood ratio; MUST, Malnutrition Universal Screening Tool; NRI, Nutritional Risk Index; MST, Malnutrition Screening Tool; NRS-2002, Nutritional Risk Screening; BNR, Birmingham Nutritional Risk Score; SNAQ, Short Nutritional Assessment Questionnaire; RFH-NPT, Royal Free Hospital Nutritional Prioritizing Tool; LDUST, Liver Disease Undernutrition Screening Tool.
* Malnutrition prevalence as assessed by the reference method (SGA) was 22·9 %.
† P value of the receiver operating characteristic curves generated for the assessment of the diagnostic accuracy of the screening tools when SGA was used as a benchmark.
Diagnostic evaluation of the screening tools against nutritional assessment
Based on the AUC in the ROC curves generated for the ability of the screening tools in estimating malnutrition, compared with SGA which is considered the benchmark for malnutrition diagnosis, LDUST followed by RFH-NPT offered the most accurate detection of malnutrition (AUC 0·892 and 0·885, respectively) (Fig. 2 and Table 2). Accordingly, RFH-NPT (97·4 %) and LDUST (94·9 %) presented the highest sensitivity, and NRS-2002 the lowest (46·2 %). It is noteworthy that both RFH-NPT and LDUST showed similar effectiveness in detecting malnutrition risk irrespective of participants’ sex and compensated or decompensated stage (data not shown).
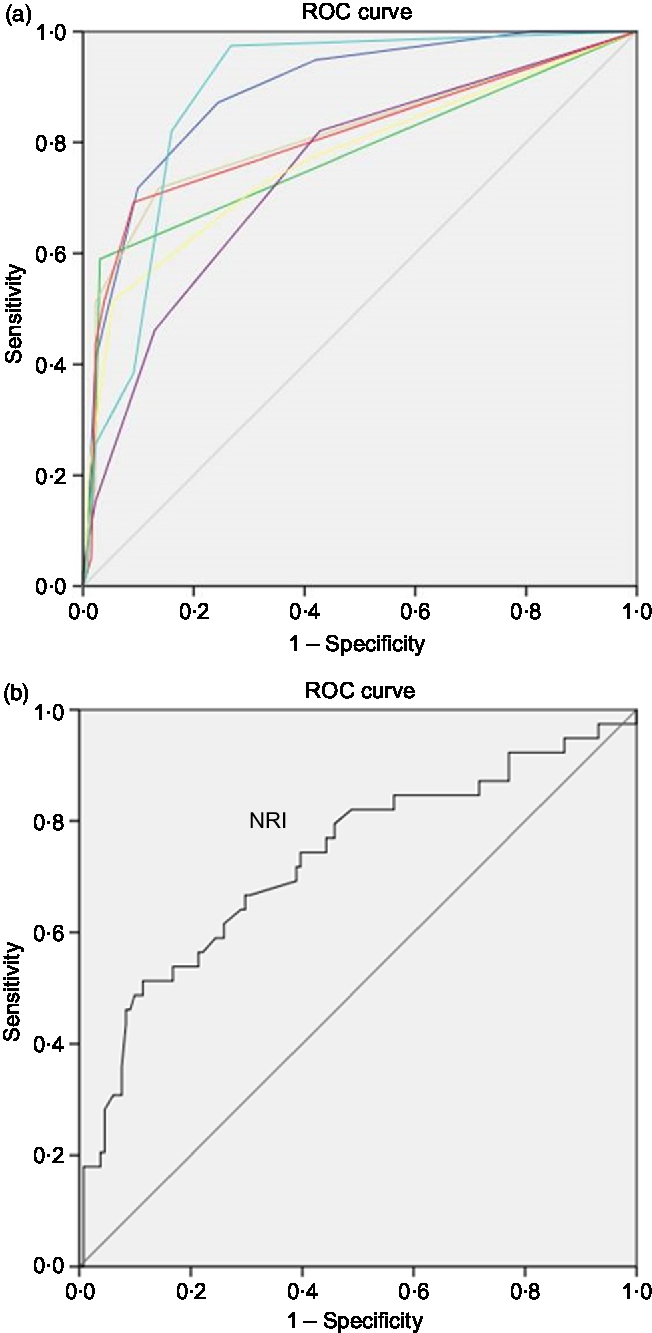
Fig. 2. (a and b) Receiver operating characteristic (ROC) curves of the screening tools for the diagnosis of malnutrition using the Subjective Global Assessment as benchmark. (a) Source of the curve: (![]() ), Liver Disease Undernutrition Screening Tool (LDUST); (
), Liver Disease Undernutrition Screening Tool (LDUST); (![]() ), Malnutrition Universal Screening Tool (MUST); (
), Malnutrition Universal Screening Tool (MUST); (![]() ), Malnutrition Screening Screen (MST); (
), Malnutrition Screening Screen (MST); (![]() ), Nutritional Risk Screening (NRS-2002); (
), Nutritional Risk Screening (NRS-2002); (![]() ), Birmingham Nutritional Risk Score (BNR); (
), Birmingham Nutritional Risk Score (BNR); (![]() ), Short Nutritional Assessment Questionnaire (SNAQ); (
), Short Nutritional Assessment Questionnaire (SNAQ); (![]() ), Royal Free Hospital Nutritional Prioritizing Tool (RFH-NPT); (
), Royal Free Hospital Nutritional Prioritizing Tool (RFH-NPT); (![]() ), reference line. NRI, Nutritional Risk Index. Diagonal segments are produced by ties.
), reference line. NRI, Nutritional Risk Index. Diagonal segments are produced by ties.
Estimation of optimal cut-off points for six non-disease-specific screening tools in detecting malnutrition based on receiver operating characteristic curve analysis
Considering that the non-liver disease-specific screening tools, that is, MUST, NRI, MST, NRS-2002, BNR and SNAQ, did not show good diagnostic ability, we examined whether the implementation of another cut-off point could improve their sensitivity. The ROC curves were generated considering the SGA as the reference standard for nutritional status of these patients. As shown in Table 3, the sensitivity of MST, NRS-2002 and SNAQ increased when the optimal cut-offs were applied, but only NRS-2002 reached an acceptable level of sensitivity (82·1 %), but with low specificity (57·4 %).
Table 3. Diagnostic accuracy of the nutritional screening tools using proposed cut-off values derived from receiver operating characteristic (ROC) curves using the Subjective Global Assessment as a benchmark
(Prevalences or ratios and 95 % confidence intervals)
MUST, Malnutrition Universal Screening Tool; NRI, Nutritional Risk Index; MST, Malnutrition Screening Tool; NRS-2002, Nutritional Risk Screening; BNR, Birmingham Nutritional Risk Score; SNAQ, Short Nutritional Assessment Questionnaire; PPV, positive predictive value; NPV, negative predictive value; PLR, positive likelihood ratio; NLR, negative likelihood ratio.
* A higher score indicates a higher nutritional risk.
† No available score range; a lower score (<100) indicates a higher nutritional risk.
‡ Optimal cut-off point as indicated by a higher Youden index in the ROC curve analysis.
§ Corresponding proposed cut-off point in the scoring scale of each screening tool (due to a lack of half-points in the scoring scale).
Prediction accuracy of the screening tools for within 1-year mortality based on generalised linear models
As depicted in Fig. 1, of the 170 patients, 145 competed the 1-year evaluation (56·6 % men, mean age 59·3 (sd 9·97) years, 51·7 % compensated cirrhosis); fourteen patients were dead (9·7 % mortality rate). Twenty-five patients who were lost to follow-up (17 % of the study participants) did not differ from those with available survival data in terms of age, sex, BMI category, aetiology of cirrhosis, compensated or decompensated stage, MELD and Child–Pugh scores (all P > 0·05). Moreover, these 145 patients did not differ significantly from the whole study sample in terms of age, sex, BMI category, aetiology of cirrhosis, compensated or decompensated stage, MELD and Child–Pugh scores (all P > 0·05).
For those participants with available 1-year follow-up data, generalised linear models were applied to explore the predictive value of the baseline diagnosis of malnutrition according to the SGA and the baseline risk of malnutrition according to the three screening tools that proved to be accurate in detecting malnutrition (i.e. RFH-NPT, LDUST and NRS-2002 with the proposed cut-off of 2 points), for the RR of within 1-year mortality, after adjustment for multiple confounding factors, namely, age, sex, disease aetiology and disease severity (either expressed by MELD or Child–Pugh score) (Table 4). Malnutrition according to the SGA was an independent prognostic factor of within 1-year mortality, when adjusted for sex, age, disease aetiology and MELD score (multivariable-adjusted RR was 2·17 (95 % CI 1·3, 4·7), P = 0·049). From the three screening tools evaluated, only the risk of malnutrition according to RFH-NPT tended to be associated with mortality when adjusted for the above-mentioned confounders (RR for within 1-year mortality equal to 2·17 (95 % CI 1·0, 5·1), P = 0·057).
Table 4. Estimated relative risk for 1-year mortality of patients at nutritional risk or diagnosed with malnutrition based on generalised linear models analysis (n 145)
(Relative risks (RR) and 95 % confidence intervals)
MELD, Model for End-stage Liver Disease; SGA, Subjective Global Assessment; RFH-NPT, Royal Free Hospital Nutritional Prioritizing Tool; LDUST, Liver Disease Undernutrition Screening Tool; NRS-2002, Nutritional Risk Screening here applied with the proposed cut-off of 2 points for identifying nutrition risk.
Discussion
In the present study the accuracy of eight screening tools in detecting malnutrition as diagnosed by the SGA was explored. The results confirmed that RFH-NPT and LDUST, the two screening tools developed for cirrhotic patients, were the most accurate in detecting the risk of malnutrition in patients with advanced liver disease, compared with six other non-disease-specific screening tools but quite prominent in clinical practice.
Nutrition risk screening is a procedure aiming to identify patients at risk of poor nutritional status in order to refer them for dietary assessment and potential nutritional intervention. It is a standard procedure for any patient coming in contact with healthcare services, as proposed by many scientific committees, as malnutrition is an independent prognostic factor for most diseases(Reference Norman, Pichard and Lochs29) and nutritional risk is considered to be a condition negatively affecting survival per se (Reference Cederholm, Barazzoni and Austin30). Therefore, valid screening tools are very important. These tools should certainly show high sensitivity, in order to ensure that malnourished patients are identified for subsequent nutritional intervention and support(Reference Lawson, Campbell and Dimakopoulos31). Regarding specificity, this is also anticipated to be as high as possible, although a lower specificity implies false classification of a well-nourished patient as being at risk and would just lead to a redundant detailed nutritional assessment.
Although RFH-NPT and LDUST are the only screening tools specifically developed for patients with advanced liver disease, they have not been widely used in the clinical setting or for research purposes yet; however their use in liver disease patients has been recently supported both by EASL and ESPEN(9, Reference Plauth, Bernal and Dasarathy12). Compared with SGA, RFH-NPT and LDUST showed the best sensitivity (97·4 and 94·9 %, respectively), whereas RFH-NPT showed higher specificity than LDUST (73·3 and 58 %, respectively). This is an expected finding, considering that RFH-NPT and LDUST have been specifically developed for cirrhotic patients and thus a good concurrent validity should be anticipated. In the original study in which RFH-NPT was developed, the diagnostic performance of the tool against malnutrition as diagnosed by the Royal Free Hospital Global Assessment tool was similar with the present study (100 % sensitivity and 73 % specificity)(Reference Arora, Mattina and McAnenny11). Accordingly, LDUST showed 72 % sensitivity and 75 % specificity in detecting undernutrition as identified by a registered dietitian in the original study who developed and validated the tool(Reference Booi, Menendez and Norton10); thus its diagnostic performance was further and more strongly validated in the present study. RFH-NPT is completed by the healthcare specialist, while LDUST is self-completed by the patient. Thus, considering that they show equally sufficient diagnostic performance, these tools can be used interchangeably in the clinical setting, depending on the availability of time for healthcare professionals and the available dietary and weight data of the patients.
Regarding the tools that are not disease-specific but widely used in clinical practice, none of them showed a high sensitivity in detecting malnutrition. In a recent study assessing the ability of MUST in detecting undernutrition in cirrhotic patients, the tool showed a lower level of performance compared with LDUST against dietetic assessment as the reference method(Reference McFarlane, Hammond and Roper32). Furthermore, when different cut-off points for the non-disease-specific screening tools were examined to test whether these would improve their concurrent validity, only NRS-2002 showed a high sensitivity in detecting malnutrition with a wider cut-off of 2 points instead of 3.
Further to the above-mentioned findings, we explored the predictive validity for within 1-year mortality of malnutrition diagnosis according to the SGA as well as of malnutrition risk according to the three screening tools that proved to be accurate in detecting malnutrition, that is, RFH-NPT, LDUST and NRS-2002, using the new proposed cut-off of 2 points that increased the tool’s sensitivity. According to the results, only malnutrition diagnosis according to the SGA proved to be an independent prognostic factor of mortality, and this has been also found in several disease states(Reference Norman, Pichard and Lochs29). On the contrary, although RFH-NPT was found to be an independent predictor of transplant-free survival in a recent study by Borhofen et al. (Reference Borhofen, Gerner and Lehmann33), in the present study, the RFH-NPT only tended to be associated with within 1-year mortality, while the LDUST presented no association. Moreover, NRS-2002, which reached adequate sensitivity with the estimated optimum cut-off point for cirrhotics, did not show good predictive validity regarding within 1-year mortality. As mentioned previously, the aim of a screening tool is to sufficiently identify patients at nutritional risk for further referral to a detailed nutritional assessment rather than detecting the outcome. As such, both RFH-NPT(Reference Arora, Mattina and McAnenny11) and LDUST(Reference Booi, Menendez and Norton10), in the original studies that they were developed, were assessed for their validity against a reference method for nutritional assessment (Royal Free Hospital Global Assessment and dietetic assessment, accordingly) rather than against mortality, indicating that concurrent validity is important when assessing the performance of such screening tools.
Interestingly, the prevalence of overweight and obesity recorded in the present study sample was quite high, reaching 69 %. This could be attributed to a high prevalence of overweight and obesity in the general Greek population(Reference Hettle, Borrill and Suri34, Reference Panagiotakos, Pitsavos and Chrysohoou35). Moreover, other studies have also reported a high prevalence of overweight and obesity in patients with cirrhosis (Reference Bellentani, Saccoccio and Masutti36– Reference Everhart, Lok and Kim38). Finally, the mortality rate estimated in the present study was about 10 %, similar to that reported in recent large studies with outpatient ambulatory cirrhotics ranging from 11·6 to 16·1 %(Reference Kalafateli, Zisimopoulos and Vourli39– Reference Zipprich, Garcia-Tsao and Rogowski41).
The present study has both strengths and limitations. This is the first study to ever assess the concurrent validity of eight different nutritional screening tools in cirrhotic patients. Moreover, the study sample consisted of cirrhotics of various causes and stages, allowing results to be extrapolated to the whole range of disease, and had a prospective design for mortality. Regarding limitations, the absence of a ‘gold standard’ for undernutrition is a barrier in every study on this topic, creating a risk for bias. Nutritional assessment by the SGA applied in the present study, although exhibiting some drawbacks such as the lack of a criterion for assessing muscle mass, is suggested both by EASL and ESPEN as a method of nutritional status assessment in liver disease(9, Reference Plauth, Bernal and Dasarathy12) and is generally considered a standardised, widely known and valid reference method to assess the concurrent validity of screening tools(Reference van Bokhorst-de van der Schueren, Guaitoli and Jansma42). Thus, it was chosen in the present study as the reference method for nutritional status assessment. Moreover, the SGA showed fair agreement with anthropometric measurements, such as mid-arm muscle circumference and area (both k = 0·314, P < 0·001). Finally, the lack of blood samples remains a limitation although we retrieved important information regarding recent biochemical data (within 1 month prior to baseline evaluation) to estimate MELD and Child–Pugh scores for the participants.
In conclusion, the present findings confirm that the two screening tools developed for advanced liver disease patients, that is, RFH-NPT and LDUST, were the most accurate in detecting malnutrition. Thus, it seems more appropriate to use disease-specific screening tools, if available, than tools developed for patients of different disease aetiology. Moreover, malnutrition according to the SGA was proven to be an independent prognostic factor of within 1-year mortality, but that was not true for nutrition risk according to RFH-NPT and LDUST. Screening tools, no matter how accurate, do not comprise nutritional assessment methods, but only facilitate the first step of nutritional screening; therefore, a detailed nutritional assessment should be provided to those identified at risk based on a clinical judgement of the patient’s overall nutritional status.
Acknowledgements
A. G. is co-financed for this research by Greece and the European Union (European Social Fund) through the Operational Programme ‘Human Resources Development, Education and Lifelong Learning’ in the context of the project ‘Strengthening Human Resources Research Potential via Doctorate Research’ (MIS-5000432), implemented by the State Scholarships Foundation (IKY).
This research received no specific grant from any funding agency, commercial or not-for-profit sectors.
G. V. P. and M. D. K. contributed to the conception and design of the study and supervised the study with the support of M. Y., A. G., G. V. P., A. A., M. D., I. V., P. I., M. V. P., N. P., P. T., A. P. contributed to data acquisition; A. G. analysed the data and drafted the manuscript. All authors critically revised the manuscript, gave final approval and agreed to be accountable for all the aspects of the work ensuring integrity and accuracy.
None of the authors has any conflicts of interest to declare.


