


The number of New Zealanders aged 85+ years is projected to increase 6-fold by 2051 – an increase from 9 to 22 % of the 65+ population. Māori are the indigenous people of Aotearoa, New Zealand, comprising 14 % of the total population and 2 % of those aged over 80 years( 1 ). However, the population of Māori aged over 80 years is increasing faster than the non-Māori octogenarian population( 2 ). With the anticipated increase in the population aged 80 years and over, the nutrition-related health of the oldest old, both Māori and non-Māori, is a major public health concern( 3 ).
People in advanced age experience a significant variation in age-related functional changes and have a diverse range of nutritional needs. They also experience a disproportionately high risk of malnutrition and nutrition-related health problems as a result of inadequate food and nutrition intakes( Reference Donini, Savina and Rosano 4 ). In a cohort study of those in advanced age (Te Puāwaitanga o Ngā Tapuwae Kia ora Tonu, Life and Living in Advanced Age: A Cohort Study in New Zealand (LiLACS NZ)), half (49 %) of indigenous Māori and 38 % of non-Māori octogenarians were assessed as being at high nutrition risk using a validated questionnaire – Seniors in the Community: Risk Evaluation for Eating and Nutrition( Reference Wham, Teh and Moyes 5 ).
Micronutrient deficiencies tend to arise because of a reduction in food intake in response to a decline in energy needs with age. Basal metabolism and energy expenditure for physical activity may be reduced( Reference Roberts and Rosenberg 6 ), whereas vitamin and mineral needs remain unchanged or are increased( Reference Zhu, Devine and Suleska 7 ). Physiological changes may impact the absorption, transport, metabolism and excretion of nutrients( Reference Drewnowski and Evans 8 ), and poor health and medications can cause nutrient malabsorption( Reference Genser 9 , Reference Donini, Savina and Cannella 10 ). Eating habits affected by poor oral health and social isolation may further contribute to lower food intake and nutrient deficiency( Reference Elmadfa and Meyer 11 – Reference Locher, Ritchie and Robinson 13 ). Older people are especially susceptible to vitamin D insufficiency due to reduced mobility, decreased sun exposure and a decline in cutaneous synthesis of vitamin D with age( Reference Heaney 14 ). As micronutrient deficiencies are associated with adverse functional outcomes( Reference Inzitari, Doets and Bartali 15 ), they may impact the independence of older adults. Therefore, an understanding of micronutrient intakes of those in advanced age is needed.
In New Zealand, there are no nutrients for which the recommended dietary intake (RDI) for older adults aged 71+ years is less than that for younger adults( 16 ). Of the micronutrients, the RDI for riboflavin and Ca are higher for adults over 70 years than for younger adults. The adequate intake (AI) for vitamin D (for which there is no RDI) is also higher for this age group.
Data on micronutrient intake in advanced age are limited. Older people in the New Zealand Adult Nutrition Survey (NZANS) are under-represented; data from participants over 70 years and Māori aged over 50 years were aggregated, thus reducing the utility of the data for those in advanced age. This is problematic, as many micronutrient recommendations differ for adults aged over 50 years and beyond( 17 ). Further, older Māori consume different foods according to their cultural preferences, and this may result in different nutrient intakes( Reference Wham, Maxted and Dyall 18 ). On the basis of the estimated average requirement (EAR) for men and women aged over 70 years, data from the latest NZANS 2008/09 showed a higher estimated prevalence of low intakes of Ca, Zn, Se, riboflavin and vitamin B6 compared with younger age groups( 19 ). Multiple micronutrient inadequacies in older people have been reported elsewhere( Reference Zhu, Devine and Suleska 7 , Reference de Groot, van den Broek and van Staveren 20 ). A relevant comprehensive analysis to identify micronutrient intake and food sources of micronutrients in people of advanced age is lacking. The aim of this study was to examine energy and micronutrient intakes, and the contribution of food groups towards these intakes, in Māori and non-Māori participating in LiLACS NZ.
Methods
LiLACS NZ is a population-based cohort study of Māori aged 80–90 years and non-Māori aged 85 years at inception in 2010. Detailed methods have been reported previously( Reference Dyall, Kepa and Hayman 21 , Reference Hayman, Kerse and Dyall 22 ). Maori participants were recruited at a younger age, as the gap in life expectancy between Maori and non-Maori was 8·2 years for men and 8·8 years for women( 23 ). At inception (wave 1), the sample consisted of 421 Māori and 516 non-Māori. In brief, participants were identified from the electoral roll, healthcare databases and extensive family and personal networks, and were recruited by personal invitation from the general practitioner or community contact. Those meeting age criteria and living within geographical boundaries of the District Health Boards of the Bay of Plenty and the northern part of the Lakes areas were eligible for participation. The sample recruited was roughly representative of the age structure of the Māori population. Non-Māori women were slightly under-represented compared with the New Zealand population( Reference Dyall, Kepa and Hayman 21 ).
Wave 2, the 12-month follow-up visit, was completed in 2011 and dietary intake was assessed in 216 Māori and 362 non-Māori octogenarians using two 24-h multiple-pass recalls (24 h×2 MPR) on two different days. Of the 267 Māori who took part in the 12-month interviews, 216 (81 %) completed the dietary assessment. Māori who completed the dietary assessment did not differ from those who did not with respect to living arrangement, sex, age or depression status. Of the 403 non-Māori who took part in the 12-month interviews, 362 (90 %) completed the dietary assessment; those who completed the dietary assessment did not differ from those who did not complete the assessment with respect to living arrangement, sex, age or depression status.
Supplement use (vitamins, minerals and multivitamins) was recorded by direct observation of pill bottles and recorded in detail by trained interviewers. This study was conducted according to the guidelines laid down in the Declaration of Helsinki, and all procedures involving human subjects were approved by the Northern X Regional Ethics Committee (NXT 09/09/088) in 2009. Written informed consent was obtained from all study participants.
Measures
In brief, socio-demographic information was collected at Wave 1, baseline interview; living arrangement was categorised as living alone, with spouse only or with others (family members or in residential care). The New Zealand deprivation index was used to estimate socio-economic position( Reference Salmond, Crampton and Atkinson 24 , Reference Salmond, Crampton and Sutton 25 ). Weight was measured using the Tanita digital measuring scale (BC-541; Tanita Corporation), and height was measured using a portable stadiometer following established protocols( 26 ). Demispan was used to estimate height for those who were not able to stand( Reference Hirani and Mindell 27 ). BMR was calculated using the Fredrix equation( Reference Fredrix, Soeters and Deerenberg 28 ). Functional status was assessed using the Nottingham Extended Activities of Daily Living (NEADL)( Reference Essink-Bot, Krabbe and Bonsel 29 ), which is a measure of independence in physical function. The NEADL asks whether the older person ‘does’ a range of activities ‘on their own, on their own with difficulty, with help, or not at all’. There are twenty-two items covering four domains: mobility, in the kitchen, domestic tasks and leisure activities. A higher score indicates a higher level of function.
Dietary assessment, nutrient and food group analysis
At Wave 2, 12-month follow-up, LiLACS NZ participants completed a 24-h MPR( Reference Adamson, Collerton and Davies 30 ) on two separate days of the week conducted by trained interviewers, and FOODfiles (2010), an electronic subset of data from the New Zealand Food Composition Database, was used as the main source of food composition data( 31 ) to calculate mean daily energy and micronutrient intakes.
Nutrient analysis
The medians and interquartile ranges of daily energy, vitamin A, β-carotene, vitamin B2, B6, folate, vitamin B12, E, C and D, Ca, Fe, Mg, K, Na, Se and Zn intakes were calculated for all participants and repeated after excluding participants with energy intake (EI):BMR <0·9 (as potential under-reporters) and >2·0 (as potential over-reporters). Nutrient reference values (NRV) for Australia and New Zealand were used to report the proportion of participants meeting the EAR, RDI or AI for the selected nutrients( 16 ). Supplement users were compared with non-supplement users on intake of micronutrients from diet only – that is, not including the contribution from supplements.
Food groups
Food items reported in the 24-h MPR were allocated to food groups in order to calculate sources of nutrients by the type of food. Recipes were separated into their individual ingredients and these were assigned to separate food groups. The thirty-three food groups used in the 2008/09 NZANS( 26 ) were used to allow national comparisons.
The data analyses were carried out using SAS/STAT software 12.1, version 9.3 of the SAS System for 64-bit Windows 7 Professional. Models were either the univariate non-parametric Mann–Whitney Wilcoxon’s test or multivariate generalised linear models controlling for age, sex, physical function (as measured by the NEADL score) and ethnicity as indicated in the text. A P value of <0·05 was considered statistically significant.
Results
Table 1 provides an overview of the social and physical characteristics of the participants and use of dietary supplements. Only 13 % (n 29) of Māori participants took vitamin supplements, 17 % (n 37) mineral supplements and 9 % (n 21) multivitamin and mineral supplements. Nearly a quarter (24 %) of Māori participants took fish oils, glucosamine and herbal supplements. A quarter of non-Māori participants took vitamin (24 %) and mineral (23 %) supplements and 14 % took multivitamin and mineral supplements. Other supplements, for example, glucosamine and herbal supplements, were taken by 37 % of non-Māori participants.
Table 1 Social, physical and health characteristics of Māori and non-Māori participants by sex (Numbers and percentages; medians and interquartile ranges (IQR))
NEADL, Nottingham Extended Activities of Daily Living score( Reference Essink-Bot, Krabbe and Bonsel 29 ).
* With others includes living with extended family, and eight participants in residential care.
† Fish oils, glucosamine and herbal.
The median daily energy, vitamin and mineral intakes for Māori and non-Māori participants by sex and per MJ of daily total EI are shown in Tables 2 and 3. Although men generally had a higher EI, women had intakes of higher nutrient density (nutrient/MJ) in folate, vitamin C, Ca, Mg, K, vitamin A (non-Māori) and β-carotene (Māori) compared with men (P<0·05). The median EI was higher for Māori men than Māori women, whereas intakes per MJ of β-carotene, folate, vitamin C, Ca, Mg and K were higher in Māori women compared with Māori men. When controlling for age and physical function, β-carotene, folate, vitamin C, Ca and Mg were no longer significantly different but vitamins B2, B12, E and D, Fe, Na, Se and Zn became significantly different for Māori (Table 2). Among non-Māori, median energy, vitamin and mineral intakes were higher for men than for women; however, when expressed per MJ energy, intakes of vitamin A, vitamin B6, vitamin C, Ca, Mg and K were higher in women than in men. When controlling for age and physical function, vitamins A, C and Ca were no longer significantly different, but vitamin B2, Fe, Na and Zn became significantly different for non-Māori (Table 3).
Table 2 Daily energy, vitamin and mineral intakes from food for Māori participants by sex and per MJ of energy (Medians and interquartile ranges (IQR))
RE, retinol equivalents.
* Mann–Whitney U test for no sex difference (per 1 MJ of energy).
† Comparing all men and all women, multivariate generalised linear model controlling for age and functional status from the Nottingham Extended Activities of Daily Living Scale score( Reference Essink-Bot, Krabbe and Bonsel 29 ).
‡ Does not include intake from supplements, energy from alcohol, table salt and salt used for cooking.
Table 3 Daily energy, vitamin and mineral intakes from food for non-Māori participants by sex and per MJ of energy (Medians and interquartile ranges (IQR))

RE, retinol equivalents.
* Mann–Whitney U test for no sex difference (per 1 MJ of energy).
† Comparing all men and all women, multivariate generalised linear model controlling for physical functional status from the Nottingham Extended Activities of Daily Living Scale score( Reference Essink-Bot, Krabbe and Bonsel 29 ).
‡ Does not include intake from supplements, energy from alcohol, table salt and salt used for cooking.
The daily energy, vitamin and mineral intakes by living situation and level of education for Māori and non-Māori participants are reported in Tables 4 and 5. Māori participants who lived with others (extended family n 40 or in residential care n 4) had significantly lower intakes of vitamin A, β-carotene, vitamin B6, folate, vitamin C, Mg and K compared with those who lived alone or with a spouse (Table 4). Non-Māori participants who lived with others (extended family n 23 or in residential care n 18) had significantly lower intakes of Mg and K compared with those who lived alone or with a spouse after controlling for age, sex and EI. Non-Māori participants with tertiary education compared with primary or secondary education only had higher intakes of vitamin B2, folate, Ca and K after controlling for age, sex and EI (Table 5).
Table 4 Daily energy, vitamin and mineral intake from food for Māori participants by living situation and education
* P<0·05, ** P<0·01, comparing all living situations or all education levels, multivariate generalised linear model controlling for age, sex and energy intake.
† Does not include intake from supplements, table salt and salt for cooking.
Table 5 Daily energy, vitamin and mineral intakes from food for non-Māori participants by living situation and education

* P<0·05, ** P<0·01, *** P<0·001 comparing all living situations or all education levels, multivariate generalised linear model controlling for age, sex and energy intake.
The percentages of Māori and non-Māori who did not meet the estimated average intake (EAR) or AI for each of the vitamins and minerals included in the analysis (both for those taking supplements or not; intake from food alone reported) are shown in Table 6. Table 6 includes all participants and also presents intakes excluding 35 % of the participants as potential misreporters – that is, reporting EI:BMRest<0·9 and >2·0. Over half of Māori participants had dietary intakes (excluding intake from supplements) of vitamin B6, Mg, Se and Zn (men only) below the EAR. Over half did not meet the AI for vitamin E and K. More than 80 % of Māori had intakes below the EAR for Ca, and most of them did not meet the AI for vitamin D (Table 6). Over half of non-Māori participants had intakes of folate (women only), Mg and Se below the EAR, whereas over 80 % had intakes below the EAR for Ca and Zn (men only). For vitamin E, over 40 % of men and women did not meet the AI (Table 6). Women were significantly more likely than men to have folate and vitamin B12 intakes below the EAR, and significantly less likely than men to have vitamin E, Mg, K and Zn intakes below the EAR after controlling for ethnicity. Māori were significantly more likely to have vitamin B6 intakes below the EAR after controlling for sex.
Table 6 Proportion of all Māori and non-Māori participants who did not meet the nutrient reference values (NRV) and, for participants with an energy intake (EI):BMR of between 0·9 and 2·0, who did not meet the NRV for Australia and New Zealand( 16 ) for daily intake of micronutrients (Numbers and percentages)

EAR, estimated average requirement; AI, adequate intake.
* AI for all adult men and women.
Differences in intake changed after we adjusted to include participants with a EI:BMR between 0·9 and 2·0 only (Table 6), with several of the significant contrasts between Māori and non-Māori becoming non-significant; only vitamin B6 intake remained significantly different between the two ethnic groups. Sensitivity analysis was conducted excluding subjects whose average EI suggested potential misreporting. Those excluded had significantly lower intakes of vitamins B6 and E, Fe, Mg, K, Na and Zn; although their reported intake was lower for all other micronutrients, it was not significantly so. This is expected as 88 % of Māori excluded and 70 % of non-Māori excluded were deemed to be potentially under-reporting (the difference between Māori and non-Māori was significant, P=0·03).
Māori who took supplements (vitamins, multivitamins or minerals) were less likely to have a food intake deficient in vitamin A, folate and Mg (Table 7). Non-Maori who took supplements (vitamins, multivitamins or minerals) were less likely to have a diet deficient in Mg, K and Zn but were more likely to have a diet deficient in vitamin B12.
Table 7 Percentage of Māori and non-Māori participants who did not meet the nutrient reference values for Australia and New Zealand( 16 ) for daily intake of micronutrients from food only by whether the participants used supplements or not
* P value calculated using the Cochrane–Mantel–Haenszel test for comparison of two groups on a dichotomous response. Eighty-three Maori took supplements and ninety-seven did not. 203 non-Maori took supplements and 145 did not.
The food groups that contribute to ≥75 % of vitamin and mineral intakes for Māori and non-Māori men and women are presented in Fig. 1. Fig. 2 and 3 show the distribution of intakes for Se and folate for Māori and non-Māori by sex with the EAR and recommended daily intake (RDI) indicated. Se and folate are known to be of particular concern in this population, and over half of both Māori and non-Māori had intakes below the EAR (except folate for non-Māori men). Se is known to be low in New Zealand soil, and older people are especially vulnerable to folate deficiency( Reference Lökk 32 ). Sex differences in food group sources of folate were found.

Fig. 1 Percentage of food groups contributing to micronutrient intake by ethnic group and sex for vitamin A, folate, vitamin B12, vitamin D, calcium, iron, magnesium, potassium, selenium, zinc. Milk: all milk (cow, soya, rice, goat and flavoured milk), milkshakes, milk powder. Dairy products: cream, sour cream, yogurt, dairy food, ice-cream, dairy-based dips. Cheese: Cheddar, Edam, specialty (Blue, Brie, Feta, etc.), Ricotta, cream cheese, cottage cheese, processed cheese. ![]() , Non-Māori men;
, Non-Māori men; ![]() , Māori men;
, Māori men; ![]() , Non-Māori women;
, Non-Māori women; ![]() , Māori women.
, Māori women.
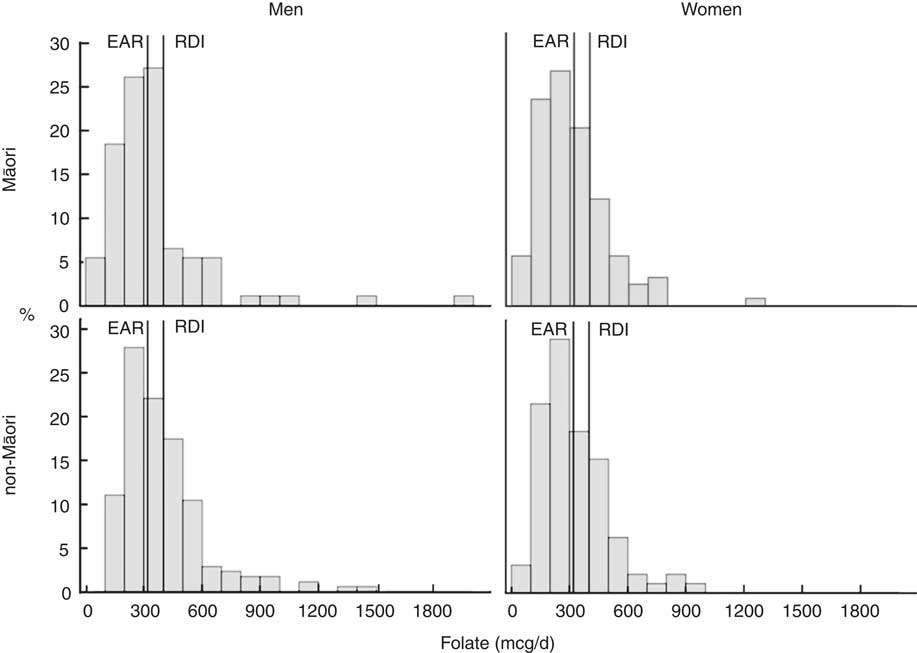
Fig 2 Intake distribution of folate with the estimated average requirement (EAR) and recommended daily intake (RDI) marked for Māori and non-Māori by sex.
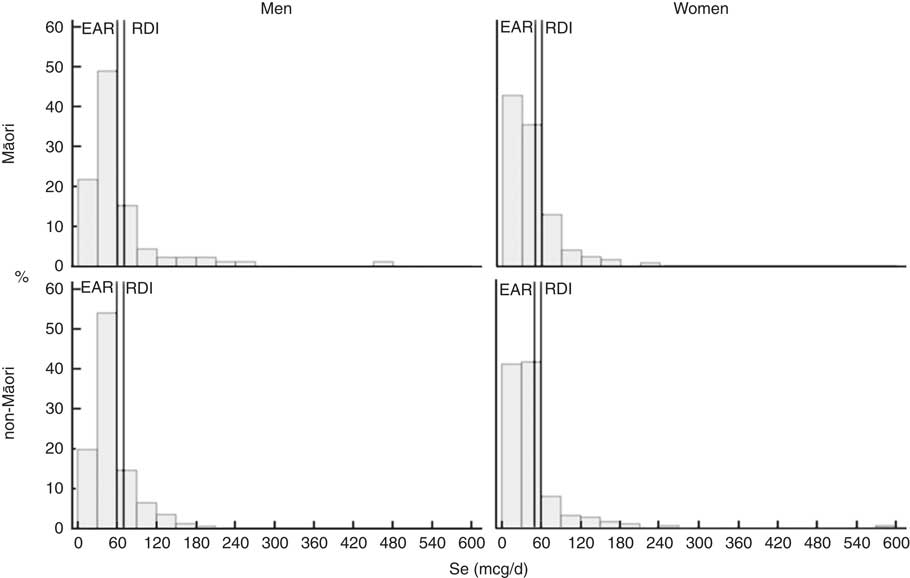
Fig 3 Intake distribution of selenium with the estimated average requirement (EAR) and recommended daily intake (RDI) marked for Māori and non-Māori by sex.
Food sources: Māori participants
As shown in Fig. 1, vegetables provided the largest percentage of food group contribution of vitamin A (42 % for women and 35 % for men) followed by butter and margarine (approximately 11 %). Cereals (approximately 19 %), bread (approximately 19 %) and vegetables (approximately 15 %) were the three main food sources for folate intake. The main food sources of vitamin B12 were milk, fish and seafood, and beef and veal. These three food groups contributed to more than half of the vitamin B12 intake among Māori men (52 %) and Māori women (54 %). The three main food group contributors of vitamin D were milk (approximately 26 %), butter and margarine (approximately 10 %), and fish and seafood (approximately 14 %). Milk was the largest contributor to dietary Ca intake for men (33 %) and women (34 %) followed by bread for Māori women (10 %). Cereals contributed about 17 % to dietary Fe intake followed by bread (men 12 %, women 15 %), vegetables (men 7 %, women 8 %), beef and veal (8 % for both men and women), and non-alcoholic beverages (5 % for both men and women). For Māori women, the main food groups for Mg were bread (16 %), fruits (10 %) and cereals (10 %); for Māori men, the three main sources were bread (14 %), cereals (11 %), and potatoes, kumara and taro (9 %). The main food group contributing to K intake in men was potatoes, kumara and taro (>16 %); for women this was fruit (14 %), followed closely by vegetables (13 %). Fish and seafood (about 21 %) and bread (12 % for men and 15 % for women) were the two main food sources of Se for both sexes, followed by eggs for Māori women and poultry for Māori men. Beef, bread and milk were the three main food groups contributing to Zn intake for Māori women and beef, bread and pork were the three main sources for Māori men.
Food sources: non-Māori participants
Vegetables were the main food sources of vitamin A for men (35 %) and women (36 %) followed by butter and margarine (men 13 %; women 12 %). Cereals, bread and vegetables were the three main food sources of folate intake for men. Contributions from these three food groups were in reverse order for women with milk also providing 10 % of folate. The main food groups of vitamin B12 were milk (23 %), beef and veal (21 %), and fish and seafood (12 %) for men, contributing to more than half of their vitamin B12 intakes (55 %). Milk (24 %) and beef and veal (16 %) were also main food sources of vitamin B12 for women with other food group contributions more widely spread. Milk, butter/margarine and seafood were the three main food groups of vitamin D for men. Eggs and egg dishes replaced seafood in the top three food groups for women. Milk (34, 33 %) and cheese (11, 12 %) were the main contributors to dietary Ca for men and women. The main food sources contributing to Fe intake were cereals (20, 15 %) and bread (14, 12 %) for men and women, respectively. The beef and veal group was the third main contributor of Fe for men, while it was vegetables for women. For men, bread, cereals and milk were the main sources of Mg, and bread, followed by fruit and cereals, were the main sources for women. The main food sources of K for men were potatoes, kumara and taro, vegetables and fruits, and for women the main source was fruits, followed closely by vegetables. The fish and seafood (17 %) group was the main contributor to Se for men, while the main source was bread (12 %) for women. Eggs and poultry were other important food sources. Beef and veal, bread and milk were the three main food groups contributing to Zn intake for both men and women.
Discussion
This is the first comprehensive assessment of micronutrient intake in Māori and non-Māori of advanced age. Overall, although most of the participants obtained an adequate EI, they met only some of the recommendations for micronutrient intake. As EI decreases with age( Reference de Groot, van den Broek and van Staveren 20 ), obtaining adequate micronutrient intake presents a challenge for the oldest old, especially when recommendations are higher for older adults compared with younger age groups. Low intakes of folate, vitamin E, Ca, Mg, Se and Zn were observed as reported in the diets of community-living older adults (≥65 years) in Western countries( Reference ter Borg, Verlaan and Hemsworth 33 ).
Further, ethnic and sex differences in micronutrient intakes were evident. More than half of Māori participants did not meet the EAR for vitamin B6; more than half of Māori and non-Māori women did not meet the EAR for folate. More than half of all participants did not meet EAR for Ca, Mg and Se, and more than half of men did not meet EAR for Zn. Similarly, the AI for vitamin E was not met by more than half of Māori participants. Seafood is a traditional food among Māori and was a main source of vitamin B12, vitamin D and Se. Colonial imposed restrictions on the gathering of seafood( Reference Lock and Leslie 34 ) may impact on the ability to maintain a desirable diet for Māori. Efforts of Māori to negotiate acceptable self-determination have been fraught( Reference Durie 35 ) and those related to food gathering may contribute to inequities in health outcomes( Reference Teh, Kerse and Kepa 36 ). Micronutrient intake for Māori and non-Māori also differed by living situation, where lower intakes were observed among those who lived with others compared with those who lived alone or with a spouse. Māori had lower intakes of vitamin A, β-carotene, vitamin B6, folate, vitamin C, and both Māori and non-Māori had lower intakes of Mg and K. Participants who lived with others may have had a higher degree of dependency than those who lived alone or with a spouse. Their lower micronutrient intakes may reflect higher nutritional risk commonly observed in the dependent elderly( Reference Fernández-Barrés, Martín and Canela 37 ). A deeper understanding of the nutrient density of food intake among this vulnerable group is required.
Comparison with other studies
The NZANS surveyed a representative sample of New Zealanders in 2008/09 using the 24-h MPR method of dietary assessment. Data were aggregated for those over age 71 years (159 men and 123 women) and for Māori over age 51 years (thirty-one men and forty-seven women)( 19 ). Two studies provided FFQ data for comparison: a longitudinal study in Mosgiel, New Zealand, in 1988 for men and women aged 65 and over( Reference Horwath, Campbell and Busby 38 ); and an Australian longitudinal study of 911 free-living older women aged 70–85 years( Reference Zhu, Devine and Suleska 7 ). The National Health and Nutrition Examination Survey (NHANES) study in the USA provides specific details about intake and deficiency( Reference Ford and Mokdad 39 ) and European studies provide some comparative opportunities( Reference de Groot, van den Broek and van Staveren 20 ). Overall, there are very little data on people in advanced age to provide adequate comparator data for LiLACS NZ. This highlights the importance of this study and other similar studies such as the Newcastle 85+ study( Reference Davies, Kingston and Robinson 40 ).
Low intake of vitamin B6 in Māori women participating in LiLACS NZ confirms NZANS (42 % low intake) and the Australian cohort( Reference Zhu, Devine and Suleska 7 ) findings. More than half of Māori women and all men in the current study appeared to consume less vitamin E than the recommended levels and less than older Australian women( Reference Zhu, Devine and Suleska 7 ); a level of inadequacy was not found in the NZANS.
Dietary Ca has recently been emphasised in favour of supplementation because of an unexpected finding that Ca supplementation is associated with increased cardiovascular events in osteoporosis trials( Reference Grey, Bolland and Reid 41 , Reference Grey, Bolland and Reid 42 ). However, across most studies of older people, dietary Ca intake does not meet dietary recommendations( Reference Zhu, Devine and Suleska 7 , Reference Bailey, Dodd and Goldman 43 , Reference Ahmed, Arcand and Schermel 44 ), as in LiLACS NZ; NZANS for women over 70 years( 19 ), women in Mosgiel( Reference Horwath, Campbell and Busby 38 ) and older women in Australia( Reference Zhu, Devine and Suleska 7 ). Ca is not as well absorbed by the oldest age group( 16 ) and thus suggestions that increased intake is needed seem reasonable. New ways of increasing dietary intake and intervention trials that study dose–response relationships to outcomes are needed, as not enough is known about Ca requirements during ageing( Reference Burckhardt 45 ).
The EAR for Mg was not met by most LiLACS NZ participants. Mg requirements may change with age( Reference Hunt and Johnson 46 ) but clear conclusions are absent to set higher requirements( 47 ). Data from the NHANES III showed a progressive decrease in daily Mg intake with age( Reference Ford and Mokdad 39 ) with mean intakes for older men (225 mg) and women (166 mg) being well below the RDA. A comprehensive review suggests that the dietary intake of Mg is inadequate in other elderly populations( Reference Vaquero 48 ), as was observed by Mosgiel( Reference Horwath, Campbell and Busby 38 ). Although Mg is widely distributed in the food supply, it seems that older adults are less likely than younger adults to consume sufficient Mg to meet their needs( Reference Barbagallo, Belvedere and Dominguez 49 ).
Se intakes were similarly marginal with over two-third of participants falling below the EAR, similar to the NZANS for those aged over 70 years. Se intake of the Mosgiel population was reported as adequate( Reference Horwath, Campbell and Busby 38 ); however, the level of intake was lower than that observed in LiLACS NZ participants. Whole population estimates from NHANES do not show similar low intakes( Reference Fulgoni, Keast and Bailey 50 , Reference Nobmann, Ebbesson and White 51 ) and Alaskans are not deficient in Se( Reference Johnson, Nobmann and Asay 52 ). New Zealand soils are low in Se, and the New Zealand population’s blood Se concentrations remain lower than those reported in other Western countries( Reference Thomson 53 ). However, in the USA, frail older people have been found to be more likely to be deficient in Se than other population groups( Reference Smit, Winters-Stone and Loprinzi 54 ). Intakes observed here need to be examined in relationship to serum levels and outcomes over time to fully understand the significance of low intake.
Most men did not meet the EAR for Zn intake, similar to the NZANS, where the highest prevalence of low intake for Zn across all age groups was for men aged 71+ years (90 %) compared with only 28 % of women. The Mosgiel study reported that 26 % of men and 53 % women had intakes below two-third of the RDA( Reference Horwath, Campbell and Busby 38 ). However, these findings should be interpreted with caution, as the EAR for those aged over 70 years is based on experimental data from younger age groups and may be set too high for men.
Micronutrient density
Analysis by nutrient density showed that, although men in general consumed more energy than women, the micronutrient intake per MJ of energy was lower for men for several vitamins and minerals – for example, folate and Mg. Food group intake analysis showed that vegetables and fruits are more common sources of folate and Mg for women compared with cereals (folate) and potatoes, kumara and taro (Mg) for men. Sex-related differences in food group contributions to Ca were not as apparent. The utility of using micronutrient density per MJ of EI, compared with absolute intakes, will be examined against longitudinal outcomes.
Micronutrients of concern
Vitamin B6 was lower in Māori women compared with other groups and may reflect their relatively lower EI compared with other subgroups of LiLACS NZ. As vitamin B6 is widely distributed in food, deficiency is rare, although it may be precipitated by anticonvulsant drugs that react with pyridoxal phosphate( Reference Clayton 55 ). Dietary folate was low in women and may relate to their lower consumption of cereals and bread compared with men. However, fruit and vegetables were a common source of folate for women, and bioavailability of folates from these foods may be higher than that previously assumed( Reference Winkels, Brouwer and Siebelink 56 ). Māori overall tended to have low intakes of vitamin E compared with non-Māori women, and this may reflect the consumption of smaller portions of plant foods high in fat, such as vegetable oils. Ca was the micronutrient with the highest prevalence of low intake in the diets of participants. Reduced supplies of Ca are associated with reduced bone mass and osteoporosis( Reference Gennari 57 ), and a significant inverse association has been shown between total Ca intake and colorectal cancer( Reference Chung, Balk and Brendel 58 ). Milk, cheese and bread were the main food sources of Ca in the current study with small contributions from other dairy products. As the optimal way to achieve adequate Ca intake is through diet, strategies are needed to increase milk and milk products intake in older people and to reduce high Na intakes, which may increase urinary Ca excretion. Both Ca and vitamin D are needed to ensure adequate absorption of Ca( Reference Heaney 59 ). Vitamin D status in the New Zealand population is usually maintained by exposure to sunlight, and dietary sources of vitamin D are likely to make a relatively small contribution( Reference Rockell, Skeaff and Williams 60 ). However, older people are at risk of insufficiency if they have limited sun exposure, are house bound or live in residential care. To ensure adequate vitamin D status of some older people, supplementation and food fortification may be needed. Targeting those at high risk of insufficiency and providing vitamin D supplementation will likely be a cost-effective approach.
The high prevalence of low Mg intake observed in LiLACS is potentially important and of concern because of its role in muscle function and age-related decline in physical performance( Reference Veronese, Berton and Carraro 61 ). Low Mg intakes are also associated with lower bone mineral density in women( Reference Orchard, Larson and Alghothani 62 ). Chronic Mg deficiency results in oxidative stress and low-grade inflammation( Reference Barbagallo and Dominguez 63 ) and through activating the inflammatory process it is proposed to be involved in the ageing process itself( Reference Barbagallo, Belvedere and Dominguez 49 ). Bread was the main food source of Mg; further efforts may be needed to ensure older people have an AI of green vegetables, peas, beans, nuts and other sources of Mg such as fish and seafood.
Se has a vital role as an antioxidant in the regulation of the thyroid and immune function and may be important for maintenance of brain function( Reference Zhang, Rocourt and Cheng 64 ). For Māori, traditional foods such as seafood were the highest source of Se, which reinforces the importance of culturally significant foods. The inclusion of two Brazil nuts daily has been proposed as an effective way to improve Se status and negate the need for fortification or supplementation( Reference Thomson, Chisholm and McLachlan 65 ), and can be acceptable to older people, especially if ground and incorporated into other foods.
For Zn, the highest prevalence of low intake was for non-Māori men. Expressed on a MJ food energy basis, Zn intake was 1·2 mg/MJ slightly lower compared with European men (aged 70+ years) in the Zenith study( Reference Andriollo-Sanchez, Hininger-Favier and Meunier 66 ). Data are lacking on Zn status during normal ageing, and the implications of low intake are unknown; however, an AI of Zn is important for oxidative stress, immunity and cognitive functions( Reference Prasad, Bao and Beck 67 ). We found that beef and veal, bread and milk were the main contributors to Zn intake, which is similar to findings for adults aged 71+ years in the NZANS.
Supplement usage
Supplements users tended to have overall better dietary intakes, being more likely than non-users to meet micronutrient requirements from their diet alone. Māori men and women who took supplements were less likely to be deficient in their intake from food alone for vitamin A, folate and Mg, whereas non-Maori were less likely to be deficient in Mg, K and Zn, but more likely to be deficient in vitamin B12.
In New Zealand, about a third of adults over 65 years have previously been reported to be regular dietary supplement users( 68 ). Data from the USA suggest that more than half of older adults use dietary supplements( Reference Qato, Alexander and Conti 69 ) and supplement use increases with age( Reference Dickinson, Blatman and El-Dash 70 ). Supplement users are cited to be more likely to eat a balanced diet than non-users( Reference Dickinson, Blatman and El-Dash 70 ), and this may reflect that taking supplements is part of an overall effort to improve health and wellness. Micronutrient requirements can, however, be achieved within a healthy well-balanced diet, which meets energy and macronutrient recommendations. Educational efforts to decrease the prevalence of micronutrient shortfalls need to focus on improving dietary intake and dietary variety and on improving the opportunity for older people to eat with others, which has been shown to improve dietary intake( Reference Locher, Ritchie and Robinson 13 ). Dietary supplement usage was lower among Māori than among non-Māori. This may reflect socio-economic disparities for Māori( Reference Chan, Wright and Riddell 71 , Reference Jatrana and Blakely 72 ) due to the high cost of dietary supplements. Further, disparities in dietary intake may contribute to inequity, which impacts health outcomes( Reference Jatrana and Blakely 72 ).
Limitations, strengths and weaknesses
This study provides the first detailed examination of micronutrient intakes in Māori and non-Māori octogenarians. Dietary assessment has been conducted within a comprehensive longitudinal study, where attention to appropriate recruitment resulted in an acceptable engagement for both Māori and non-Māori participants. Data from this study add to the body of evidence to inform appropriate NRV in the very old.
The micronutrient reference values and recommendations for intakes for New Zealanders were developed on the basis of very low number of people in the older age groups or extrapolation from younger age groups and may bear no relationship to positive nutrition-related outcomes in older people. The micronutrient reference values and recommendations for intakes are presented as units of intake or a range of intakes regardless of body size or functional status factors, which are arguably more variable in older people than younger groups. Our study showed large variability in both absolute and energy-adjusted intakes. One main limitation of comparing absolute intakes to recommendations must be that interpretation is difficult for this age group where the variation in underlying functional and anthropometric status is so great and data on actual micronutrient requirements are lacking.
A further limitation is the lack of qualitative dialogue to accompany the quantitative data presented here, telling only a part of the story, particularly for Māori. Food is an important cultural activity for Māori. This design does not take into account the cultural value of food, the wairua, and spiritual significance of foods from a Māori perspective, which may equally impact nutrition-related outcomes.
Results need to be interpreted in light of considerations of potential inaccuracy in dietary recall related to cognitive decline in advanced age. We used the most acceptable and validated dietary assessment available( Reference Adamson, Collerton and Davies 30 ) and provided training, support and quality assurance. It is of concern that potential misreporting was more prevalent among Māori – a greater proportion of reports were outside the EI:BMR of between 0·9 and 2·0 – and this may have impacted the observed ethnic differences in dietary intake for some micronutrients (Table 6). However, the relevance and accuracy of the EI:BMR developed for younger age groups and applied to octogenarians in this study are not known. In further sensitivity analyses, we will examine differences in associations with outcomes.
Conclusions
A lack of evidence for age-specific NRV hinders the interpretation of nutrient adequacy; nonetheless, Ca, Mg, Se and folate (especially for women) are key micronutrients of concern in New Zealand. Milk and cheese provide important contributions to Ca intake, whereas bread is a key source of Mg and Se. Examination of dietary intake related to biochemical status and health outcomes will establish the utility of these observations.
Acknowledgements
Betty McPherson advised nutrition assessment for Māori and with Hone and Florence Kameta assisted with translation of the interview. The authors thank the organisations contracted to conduct the LiLACS NZ study in the communities of origin: Western Bay of Plenty PHO, Ngā Matāpuna Oranga Kaupapa Māori PHO, Rotorua Area Primary Health Services, Te Korowai Aroha Trust and Te Rūnunga o Ngati Pikiao, Te Rūnunga o Ngati Awa Research and Archives Trust, Te Rūnunga o Ngati Iripuaia and Te Whānau a Apanui Community Health Centre. The authors acknowledge the support of the Ministry of Health for manuscript production, and the authors thank all participants and their whānau for participation.
The Health Research Council of New Zealand programme grant (HRC 09/068B; main funding body) and Ngā Pae o te Māramatanga (the New Zealand National Centre for Research Excellence for Māori; funded Māori engagement and project management). A. A. is funded by the National Institute of Health Research UK as a Research Professor in translational research. The funders had no role in the design, analysis or writing of this article.
N. K. and A. A. conceived of the study and led its design; A. R. and M. M.-L. provided Māori leadership for the study; N. K., R. T., C. W. and K. H. were involved in formulating the research question; A. A. provided specialist training for MPR; K. H. provided project management oversight; C. W., R. T. and K. H. participated in data collection; S. A. M. and R. T. provided statistical analyses; C. W., R. T., N. K., A. A. and A. R. participated in manuscript preparation.
The authors declare that there are no conflicts of interest.


