

Evaluating the Spatial Quality of Urban Living Streets: A Case Study of Hengyang City in Central South China

College of Architecture and Design, University of South China, Hengyang 421001, China
*
Author to whom correspondence should be addressed.
Sustainability 2023, 15(13), 10623; https://doi.org/10.3390/su151310623
Submission received: 10 May 2023
/
Revised: 30 June 2023
/
Accepted: 4 July 2023
/
Published: 5 July 2023
(This article belongs to the Section Sustainable Urban and Rural Development)
Abstract
:Evaluating the spatial quality of a living street entails identifying and assessing the outdoor space that influences residents’ leisure and recreation, which may contribute to urban renewal. The application of multi-source data and deep learning technology enables an objective evaluation of large-scale spatial quality as opposed to the traditional questionnaire survey or experts’ subjective evaluation. Based on street view images, points of interest, and road network data, this study developed subjective and objective evaluation indicators for the central city of Hengyang using semantic segmentation and ArcGIS spatial analysis. This study then assigned weights to each indicator and calculated the spatial quality score for living streets. In addition, the subjective evaluations of the street view images were compared to test and verify the validation of the objective evaluation model. Finally, the study analyzed the accessibility within 500 m of the study area using Spatial Syntax and ArcGIS to overlay the low spatial quality score with the highest accessibility to identify the streets with the highest priority in the subsequent urban plan. The results indicate that the spatial quality of living in the west of Hengyang is higher than that in its northeast region. In addition, Xiao Xia Street, Guanghui Street, and Hengqi Road comprised the majority of the areas that required a priority update. Correspondingly, our research is expected to be a useful management tool for identifying urban street space issues and guiding urban renewal.
1. Introduction
“The greatness of a city is measured by the quality of its public spaces”.John Ruskin
An urban street not only serves as a means of transportation but also provides residents with vital public spaces. A better public space encourages greater participation in outdoor activities and strengthens communities [1]. Historically, streets have been gathering places for people. Despite the gradual increase in the number of vehicles in the city, many streets remain popular places for residents to spend time outdoors.
In recent decades, as a result of China’s rapid urbanization, the quality of urban streets has been frequently neglected, despite the fact that streets have a significant impact on the well-being of residents [2]. Due to the beneficial effects of high-quality streets on residents, scholars are beginning to prioritize the quality of streets designed for people [3]. Therefore, assessing the quality of street space is conducive to updating low-quality street space as a matter of urgency.
The majority of previous studies on the evaluation of street quality relied on in-person interviews and questionnaires [4,5]. Nonetheless, evaluating the quality of large-scale spaces was inefficient and inconvenient [6]. The advent of geoinformation technology, computer technology, and big data has created unprecedented opportunities for studying urban spatial quality [7,8]. Big data describes the urban environment with objective, dynamically accessible, and updated physical information. In addition, big data from multiple sources, such as street view images (SVIs), points of interest (POIs), and road network data (OSM), can be used to evaluate urban spatial quality more comprehensively and efficiently. Moreover, the new technical data and information can be used to evaluate urban vitality and human perception [9,10].
In the majority of existing studies, the evaluation of living street space is conducted from two perspectives. The primary objective is to develop an evaluation system based on semantic segmentation of street physical environment elements extracted from street view images (SVIs) [11,12,13]. The second objective is to quantify the subjective human reaction to SVIs using measurements derived from deep learning technology [14,15,16]. However, the first strategy disregards urban functions and the subjective perceptions of individuals [17]. Additionally, although the second method is a quantitative study, it still relies on the subjective evaluation of humans [18]. The majority of studies on the spatial quality of streets have analyzed all street samples and collectively ignored the influence of street type characteristics on spatial quality and the heterogeneity of different types of streets. There is a significant distinction, for example, between the quality characteristics of urban expressways dominated by traffic behavior and urban feeder roads dominated by human interactions [17]. This results in a vague and generalized evaluation that cannot provide a compelling recommendation for urban construction. In order to establish a spatial evaluation system for living streets based on subjective perceptual and objective material dimensions, this study employs multi-source big data to quantitatively analyze the street space. The findings can serve as a valuable resource for revitalizing living streets and enhancing urban planning and administration.
2. Study Area and Data
2.1. Study Area
Hengyang is a Type II city in Hunan Province (110°32′16″–113°16′32″ E, 26°07′05″–27°28′24″ N) and a major transportation hub in south China. As of November 2021, the city had a resident population of 6.621 million people. The study area is located in the central region of the city, where the population density is high and the streetscape data is complete. In order to improve the spatial quality of living streets, this study identified living street spaces based on the detailed classification of street types in the OpenStreetMap (OSM) road network data [19] and specific neighborhoods with superior living characteristics.
2.2. Data Collection and Processing
2.2.1. Acquisition and Processing of the OSM Road Network
OpenStreetMap (OSM) is a renowned free and open crowdsourced geodatabase administered by the non-profit OSM Foundation [20,21]. The researchers downloaded road network data for the study area from OSM and extracted the road network’s centerline using ArcGIS. The original OSM street network data requires merging, simplification, and topology so that errors can be detected and the road network can be corrected [22]. Additionally, the sDNA spatial syntax was used to evaluate street accessibility [14].
2.2.2. Baidu Street View Images Data Collection and Processing
The SVI data were collected from a human perspective to measure the spatial characteristics of urban streets [23]. The research extracted the data from the application programming interface (API) platform services of the Baidu Street View Map. The Baidu Street View Map is utilized for a variety of urban analyses due to its numerous advantages, including broad coverage, a large data volume, and low cost [24,25]. Moreover, to evaluate the spatial quality of the living streets in the study area, sampling points were established at 100-meter intervals on the OSM road network to collect SVI data [17]. Subsequently, a Python program was created to automatically merge the SVIs so that the data represents a complete panorama from each sampling point. Python and the Baidu Street View Map API were used to collect a total of 1049 SVIs.
2.2.3. Acquisition of POI data
The AutoNavi data on POIs was retrieved using Python. In addition, a 500-meter-radius buffer zone was established using ArcGIS and centered on the sampling point. The buffer contained 8689 shopping services, 4392 food services, 692 automobile services, and 23 motorbike services. Additionally, a total of 218 bus stops were included in the study area.
3. Methodology
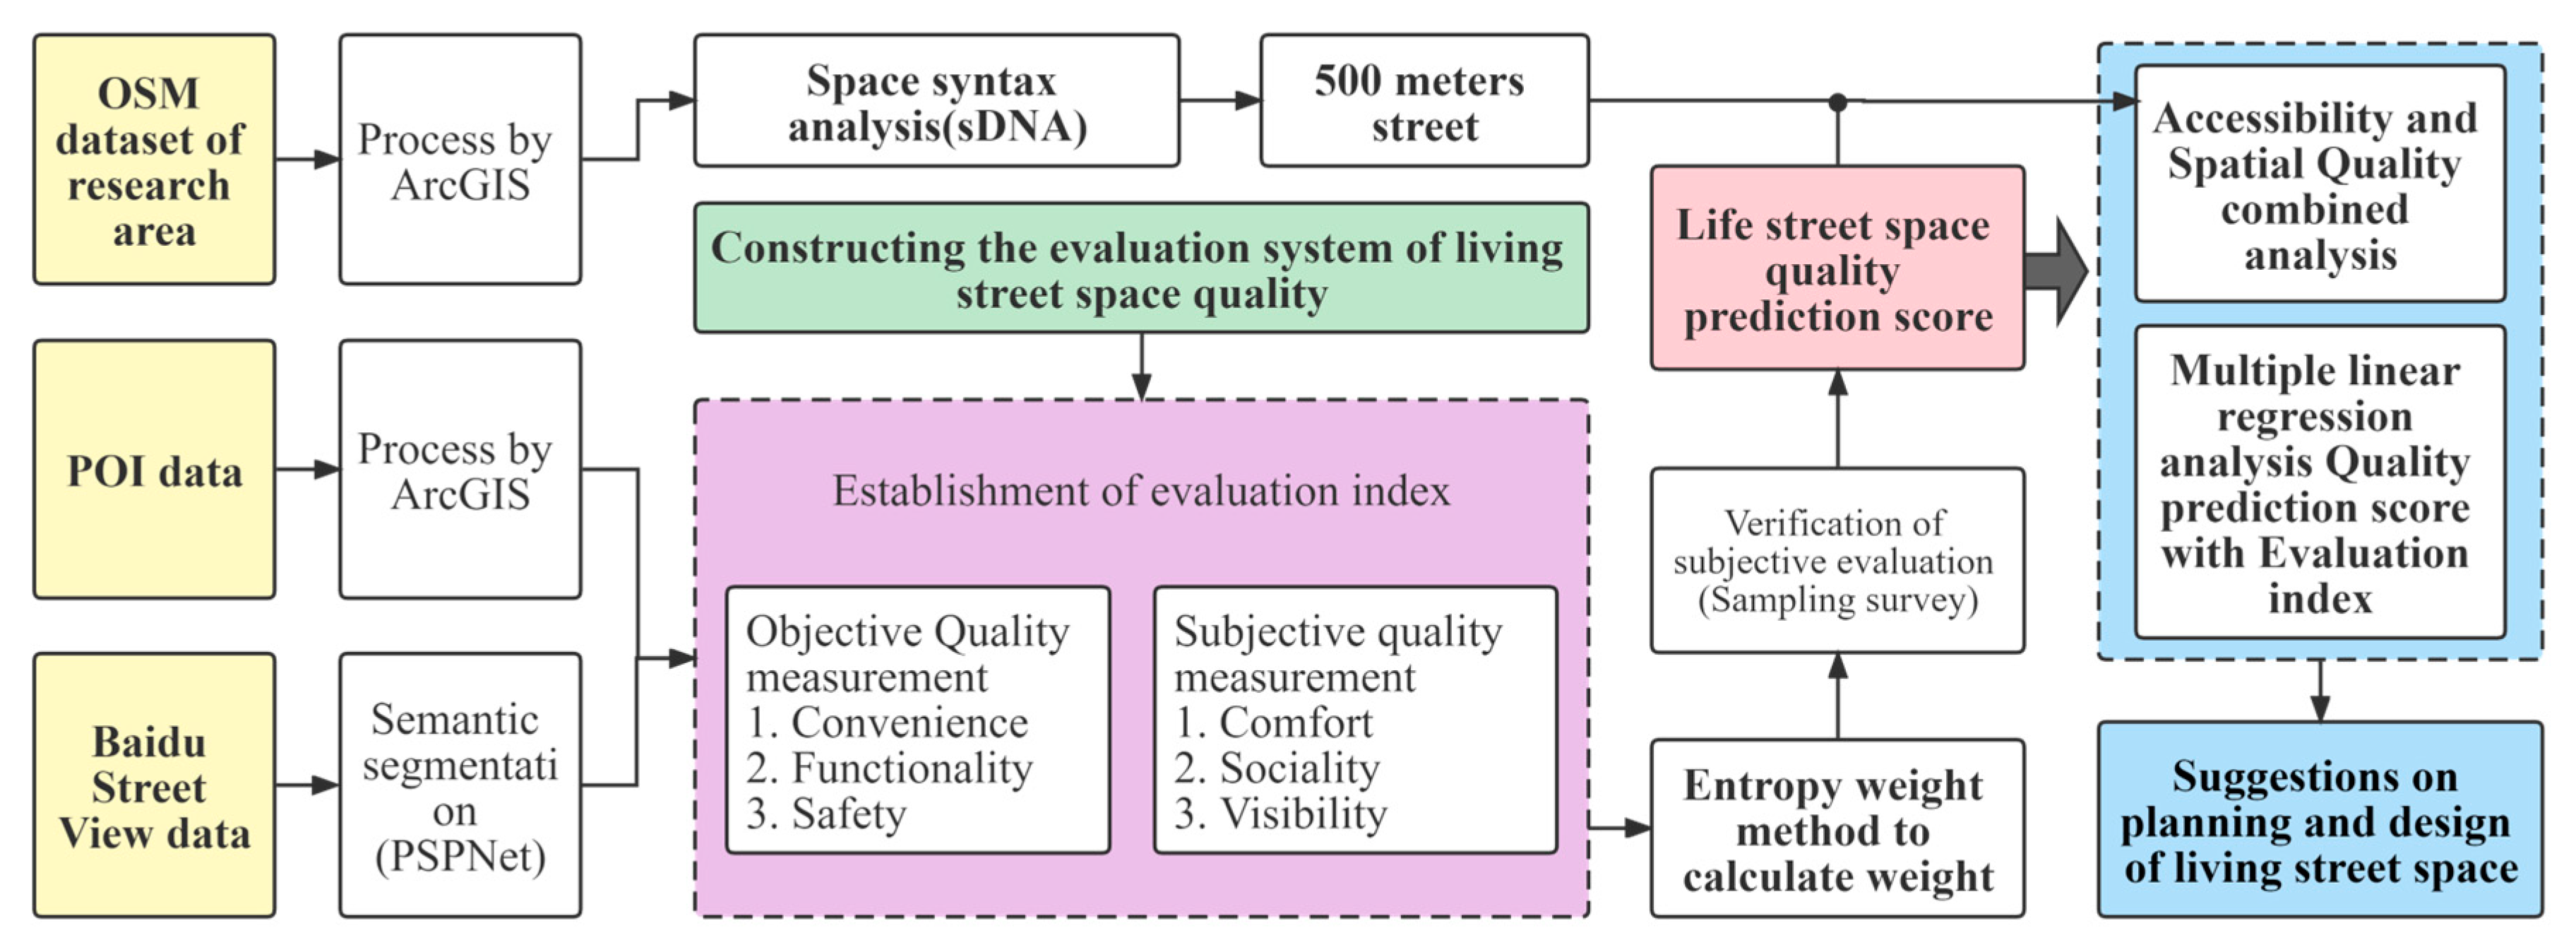
This study employs OSM data, SVI data, and POI data to create spatial quality evaluation indicators for living streets. These indicators were utilized to develop an evaluation system based on subjective perception and objective materiality dimensions in order to conduct a comprehensive evaluation of the spatial quality of living streets. Similarly, SVIs were segmented by the PSPNet model to extract the street spatial environment indicator. Subsequently, the POIs were employed to develop indicators of street spatial quality. We then calculated the weights of each indicator using the entropy weighting method (EWM) to determine the spatial quality score of the living street [26]. The SVI data from sampling points separated by 500 m were then used as the basis for subjective evaluation to confirm the results of the overall evaluation. Using a linear regression analysis of all evaluation indicator scores and indicators, the significance of these indicators was then determined. It relied on standardized Beta coefficients, which formed the basis of planning recommendations.
In addition, Spatial Syntax was used to assess the accessibility of streets in the study area using a 500-m accessibility radius, and 30% of streets with the highest accessibility scores were designated as high-accessibility spaces [27]. In addition, 30% of the streets with the lowest spatial quality scores were overlaid with high-accessibility streets to identify those with a high update priority [28]. Figure 1 depicts the structure of the research.
3.1. PSPNet-Based Street View Image Segmentation
Image semantic segmentation comprises the recognition and classification of image content at the pixel level; it is capable of identifying information about objects with extremely minute shapes [29]. On the other hand, semantic segmentation of street scene images based on the pyramid scene parsing network (PSPNet) can make full use of prior global feature knowledge [30]. Thus, by training on ADE20K data, 150 scene target categories were semantically segmented [31,32]. PSPNet completes the semantic segmentation task for scene parsing by extracting appropriate global features and fusing local and global information using a pyramid pooling module. Therefore, a strategy for optimization with a moderate supervised loss was proposed in the current study. In terms of the accuracy of segmenting multiple data sets, PSPNet outperforms FCN, DeepLab-v2, DPN, CRF-RNN, and other models [30].
3.2. Construction of the Evaluation System
The complexity of street space quality is reflected in both the objective nature of its physical space and the subjective feelings of its residents [33]. To construct an evaluation system that more accurately reflects the characteristics of a living street, the study selected a variety of dimensional indicators based on the perspective of the residents. The evaluation system was developed after consulting Wan et al. (2022) and other studies on spatial quality measurement [34].
3.2.1. Evaluation Indicators Based on the Objective Physical Dimension
- 1.
- Convenience
Distance to Nearest Bus Stop (DB)
Geographic network analysis is a core function of ArcGIS, where Euclidean distance is utilized to calculate the distance between the midpoint of each street segment and the nearest bus stop. The calculation is as follows:
where represents the coordinates of the midpoint of the road and represents the coordinates of the bus stop.
- 2.
- Functionality
Public-facility Convenience Index (PCI)
The street space’s facilities are the basis of the activities and have a significant impact on the space’s quality. Typically, a street’s amenities consist of public service facilities and art installations. The calculation is as follows:
where represents the total number of pixels of street facilities in the street view image and represents the total number of pixels in the image.
Convenience of Living Service Facilities (COLSF)
Street space not only serves as a traffic function but also serves as a location where residents engage in the majority of their daily activities, such as basic and recreational pursuits. These activities depend on the nearby business that provides life services. The calculation is as follows:
where Ln represents the number of the life service POI category in street buffers (500 m), and S represents the area of the street buffer.
- 3.
- Safety
Vehicle Interference Index (VII)
The fewer vehicles on the road, the fewer pedestrians will be affected [35], and the safer individuals will feel. In this study, the ratio of vehicle pixels to the total number of street view images is used to determine the street’s safety as the vehicle interference index. The calculation is as follows:
where represents the sum of vehicle pixels in the street view image; represents the total number of pixels in the image.
3.2.2. Evaluation Indicators Based on the Subjective Perception Dimension
- 4.
- Comfort
Interface Closure Index (ICI)
If the buildings surrounding a street are tall and close together, there will be a strong feeling of confinement [35]. Taller buildings tend to produce a larger shadow area, which creates a wind funnel and degrades the local wind environment. The calculation is as follows:
where represents the sum of the pixels of four elements in the street scene image, i.e., buildings, walls, fences, and electric poles; represents the total number of pixels in the image.
Pavement Walkability Index (PWI)
The higher the index, the better the walking experience. It is calculated as follows:
where represents the number of pixels of pedestrian pavement in the image; represents the number of pixels of vehicle pavement in the image.
- 5.
- Sociality
Crowd Concentration Index (CCI)
A high-quality public space attracts more people and promotes increased social interaction. This study employs the CCI to illustrate the clustering and non-random distribution of individuals in street space. The calculation is as follows:
where represents the total number of color pixels in the street view image and represents the total number of pixels in the image.
- 6.
- Visuality
Sky Visibility Index (SVI)
The SVI is the proportion of sky elements within a street view image, although it is necessary to maintain a suitable threshold as sky visibility decreases as urban skyscrapers rise. The calculation is as follows:
where represents the number of sky pixels in the street view image and represents the total number of pixels in the image.
Green Visual Index (GVI)
The Green Visual Index (GVI) accurately reflects the green quality of a street [36]. The calculation is as follows:
where represents the number of green vegetation pixels in the street view image and represents the total number of pixels in the image.
Color Richness Index (CRI)
The richness of street color indicates the visual complexity and variety of the street’s elements. It is determined by the Simpson Index [28]; the higher the value of the Simpson Index, the greater the color richness. The calculation is as follows:
where represents the total number of color pixels in the street view image; represents the total number of color elements contained within the viewable area of the street view image.
3.3. Spatial Quality Evaluation of Living Streets
The entropy weighting method (EWM) assigns evaluation indicator weights based on the amount of objective information provided by the entropy value of each indicator, thereby increasing the objectivity of evaluation results [37]. Both positive and negative indicators exist within the evaluation system. Significant differences in the measurements of the indicators can skew the results. Due to the different tendencies and magnitudes of the evaluation indicators, the sample data must be normalized and dimensionless in order to facilitate indicator comparison and data calculation [34]. The method of calculation is as follows:
Positive indicators: ; Negative indicators: .
In the formula, there are indicators in systems, i.e., , , …, are the values obtained after standardization.
Find the information entropy of each indicator: , if = 0, then define = 0.
Determine the weighting value of each indicator: : ( = 1, 2, …, k), Calculating the overall value of the quality of living streets : , get the weight results of each indicator (Table 1).
3.4. Overlay Analysis of Accessibility and Visible Spatial Quality
Spatial syntax provides an effective method for analyzing urban systems, as it is frequently used to analyze the structure of urban road networks. The spatial syntax is concerned with the nature of space and its relationship to space and movement [38]. The combination of spatial syntax and ArcGIS offers new perspectives and benefits for the study of urban morphological development [39]. Accessibility with varying radius distances reflects the residents’ preference for roads. The average daily distance traveled by urban residents in China is approximately 500 m [40]; consequently, a distance of 500 m was chosen from the center of each street line segment to determine accessibility. In order to identify high-priority street spaces for improvement, the accessibility results were imported into ArcGIS [41], and the streets with the top 30% accessibility values were overlaid with the next 30% spatial quality scores.
3.5. Multiple Linear Regression Analysis Process
Using SPSS, the study created a regression model for all evaluation system indicators and then used the model’s results to determine the spatial quality’s influence mechanism. In addition, the study employed standardization coefficients to assess the degree of influence of multiple indicators in formulating an optimization strategy.
4. Results
4.1. Results of the Spatial Quality of Streets
Using the natural interval method, the QOLSS scores range from 0.130 to 0.596 and are classified into five categories in ArcGIS (Figure 2a). Based on the value of the interval, they are categorized as high quality, medium-high quality, medium quality, medium-low quality, and low quality. Figure 2b illustrates the results of a kernel density analysis performed on the QOLSS results to analyze the distribution characteristics of various qualities [42,43]. The proportion of each quality type is summarized in Figure 3. As observed, high-quality and medium-quality street spaces represented a relatively small proportion of the total area, whereas medium-quality and low-quality street spaces account for a relatively large proportion; the majority of street spaces, therefore, require improvement. Changhu Street and Guanghui Street are high-quality streets with superior environmental features and construction. In the eastern portion of the city center, where the street infrastructure is older and the road network is more complex, there is a concentration of low-quality areas. The lack of vitality in space is due to massive efforts to standardize in the past. From the QOLSS distribution across the entire study area, the high-value area is located in the west, and the low-value area is located in the east.
4.2. Evaluation Results Based on Subjective and Objective Dimensions
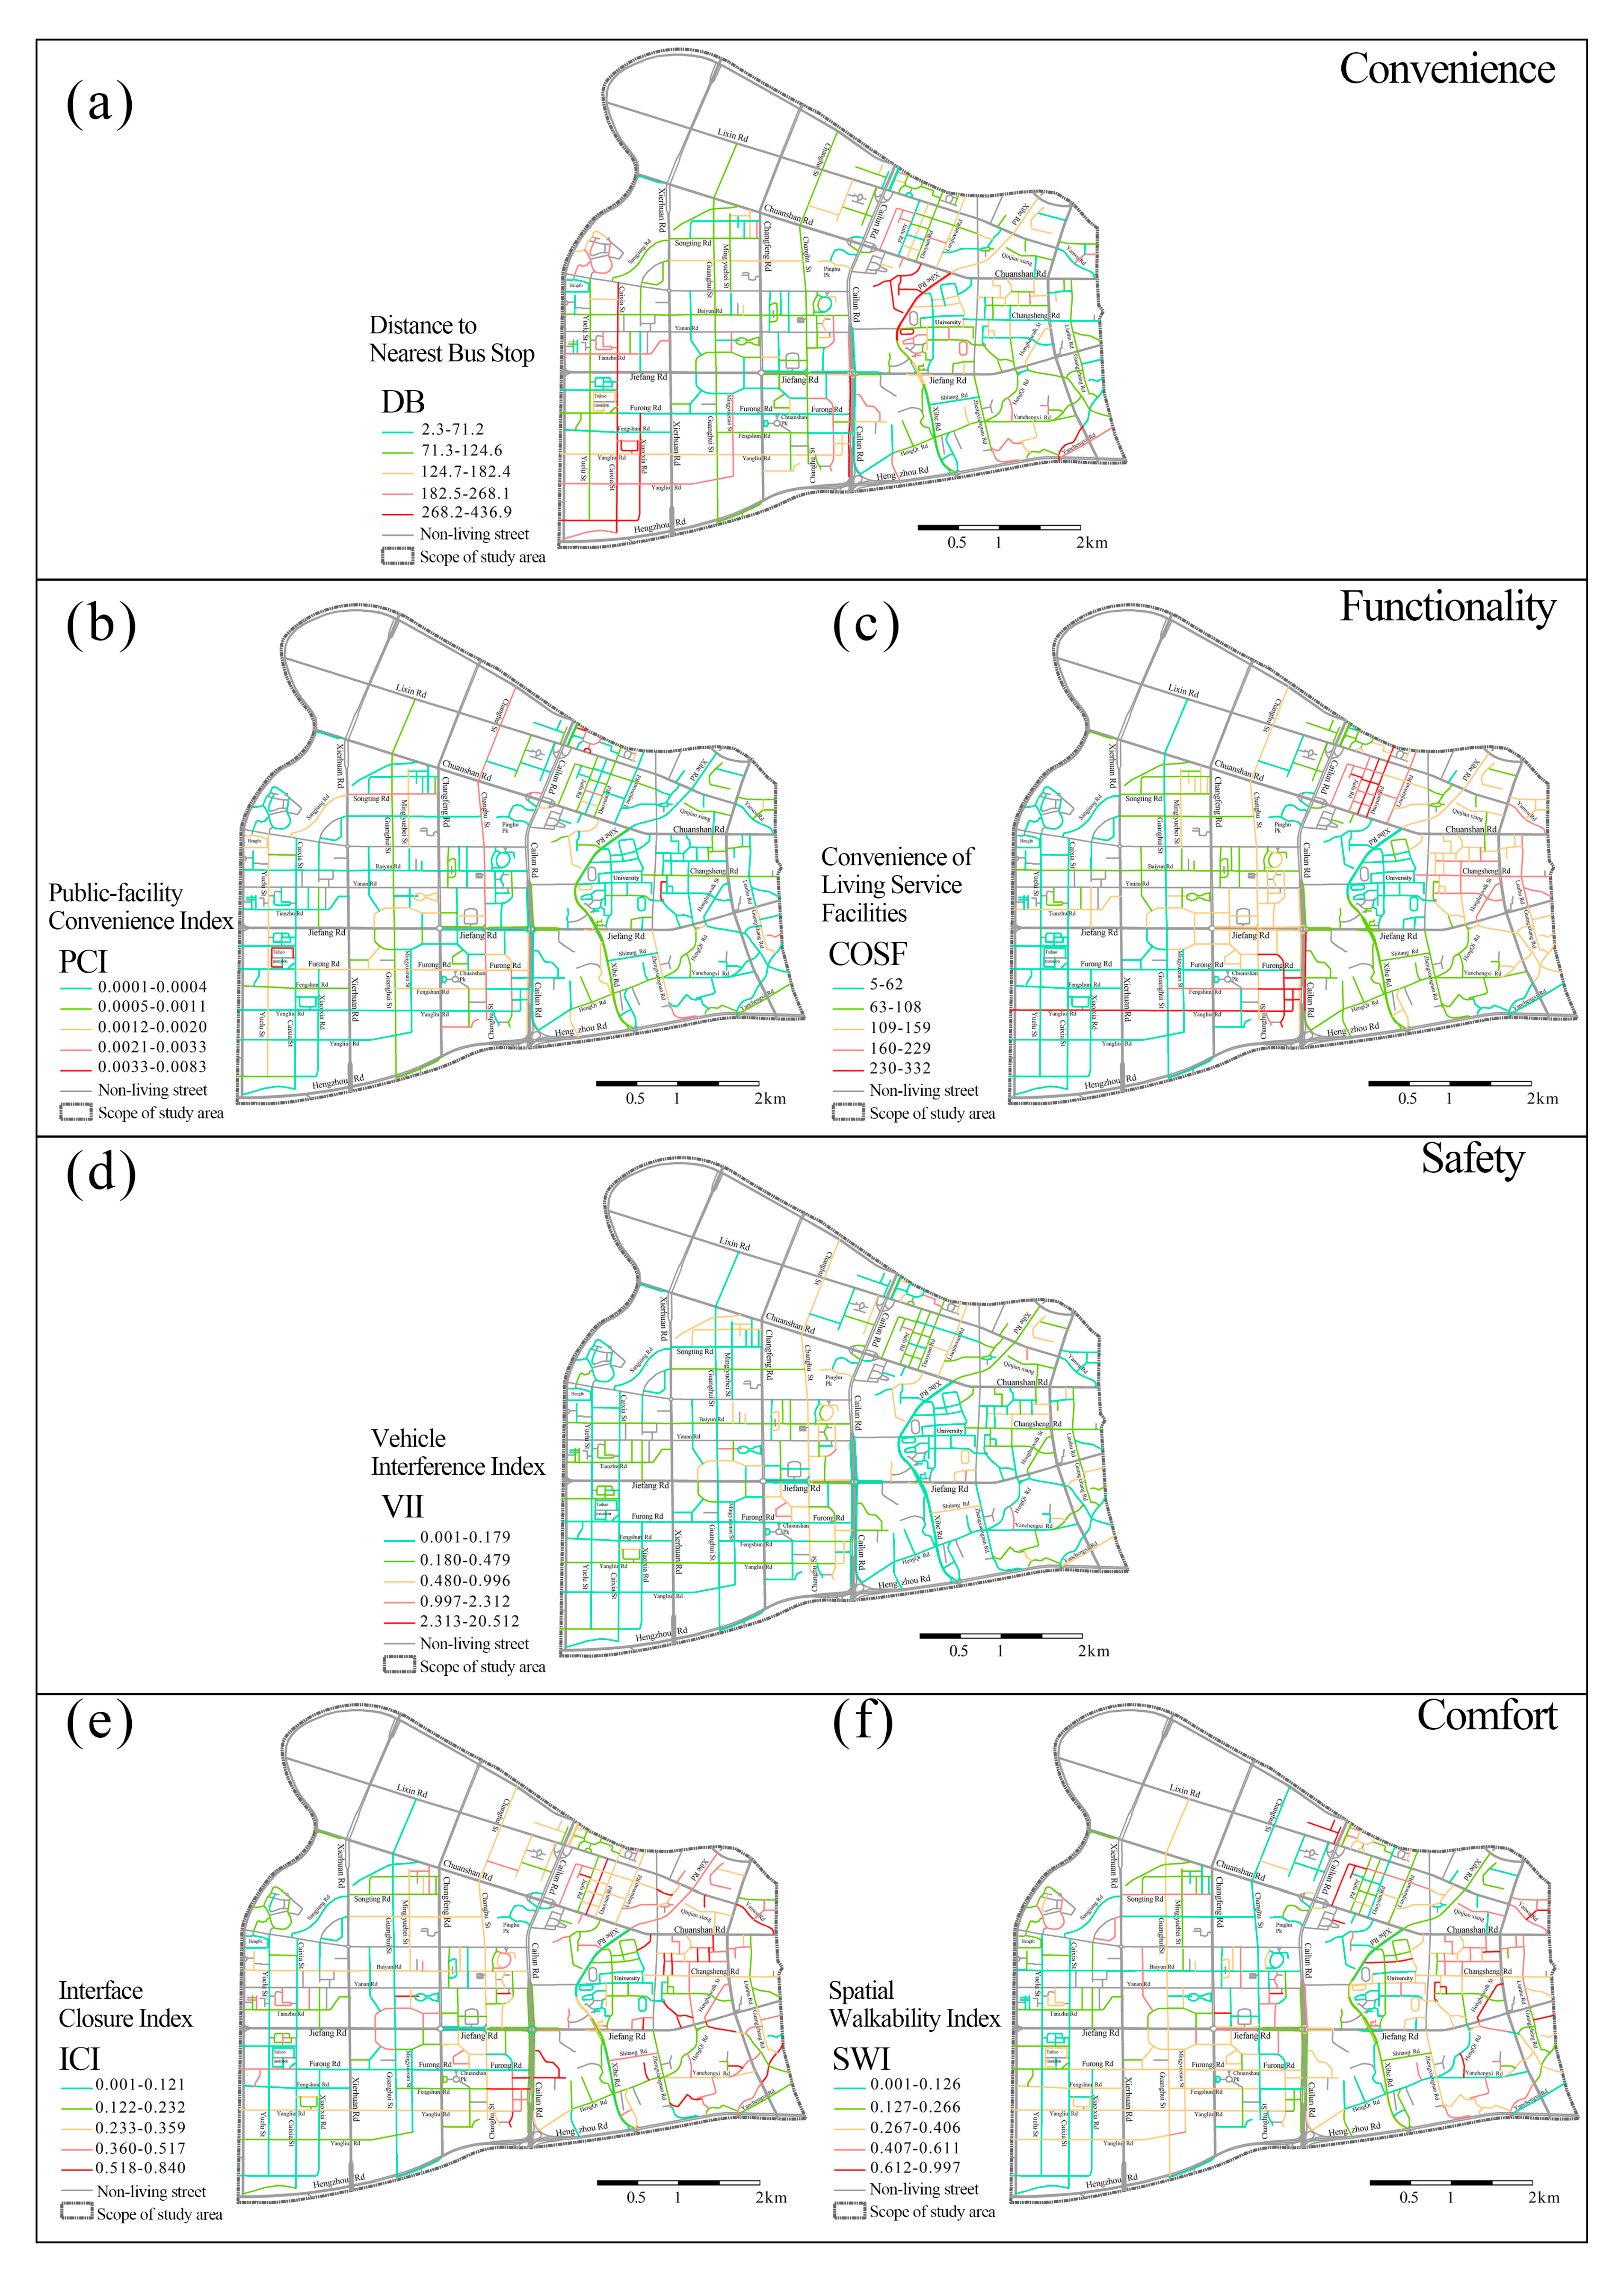
(1) At the level of street convenience, Caixia Street, Xiaoxia Street, and Xihe Road are far from bus stops but all within five minutes of their respective centers (Figure 4a).
(2) The PCI was low at the level of street functionality throughout the study area, with the highest concentration near Changhu Street (Figure 4b). Therefore, it was necessary to upgrade the street infrastructure in the area under study. In addition, the distribution of commercial outlets providing life service functions was quite disparate, with high-value areas located east of Yangliu Street, Fengshun Road, near the City Express Passenger Terminal, and Changsheng Road, near the University of South China (Figure 4c). The aforementioned regions were densely populated and had a high rate of population mobility; as a result, they had superior commercial service facilities.
(3) At the level of street safety, VII had few high-value areas, which were dispersed on roads with lower integration and better performance on small-scale streets (Figure 4d). In addition, extremely low concentrations of VII were found on thoroughfares with a high degree of connectivity and greater depth.
(4) At the comfort level, the majority of areas with a high concentration of ICI were located in the eastern portion of the study area, and these areas were predominantly residential (Figure 4e). They had older architecture, narrower streets, taller trees, and more enclosed street spaces. Figure 4f shows that the SWI and ICI exhibited a consistent regional distribution, with high-value areas located in the eastern portion of the study area. Smaller-scale streets are typically more pedestrian-friendly because vehicles avoid entering them as much as possible, and the proportion of pedestrian road area is relatively high.
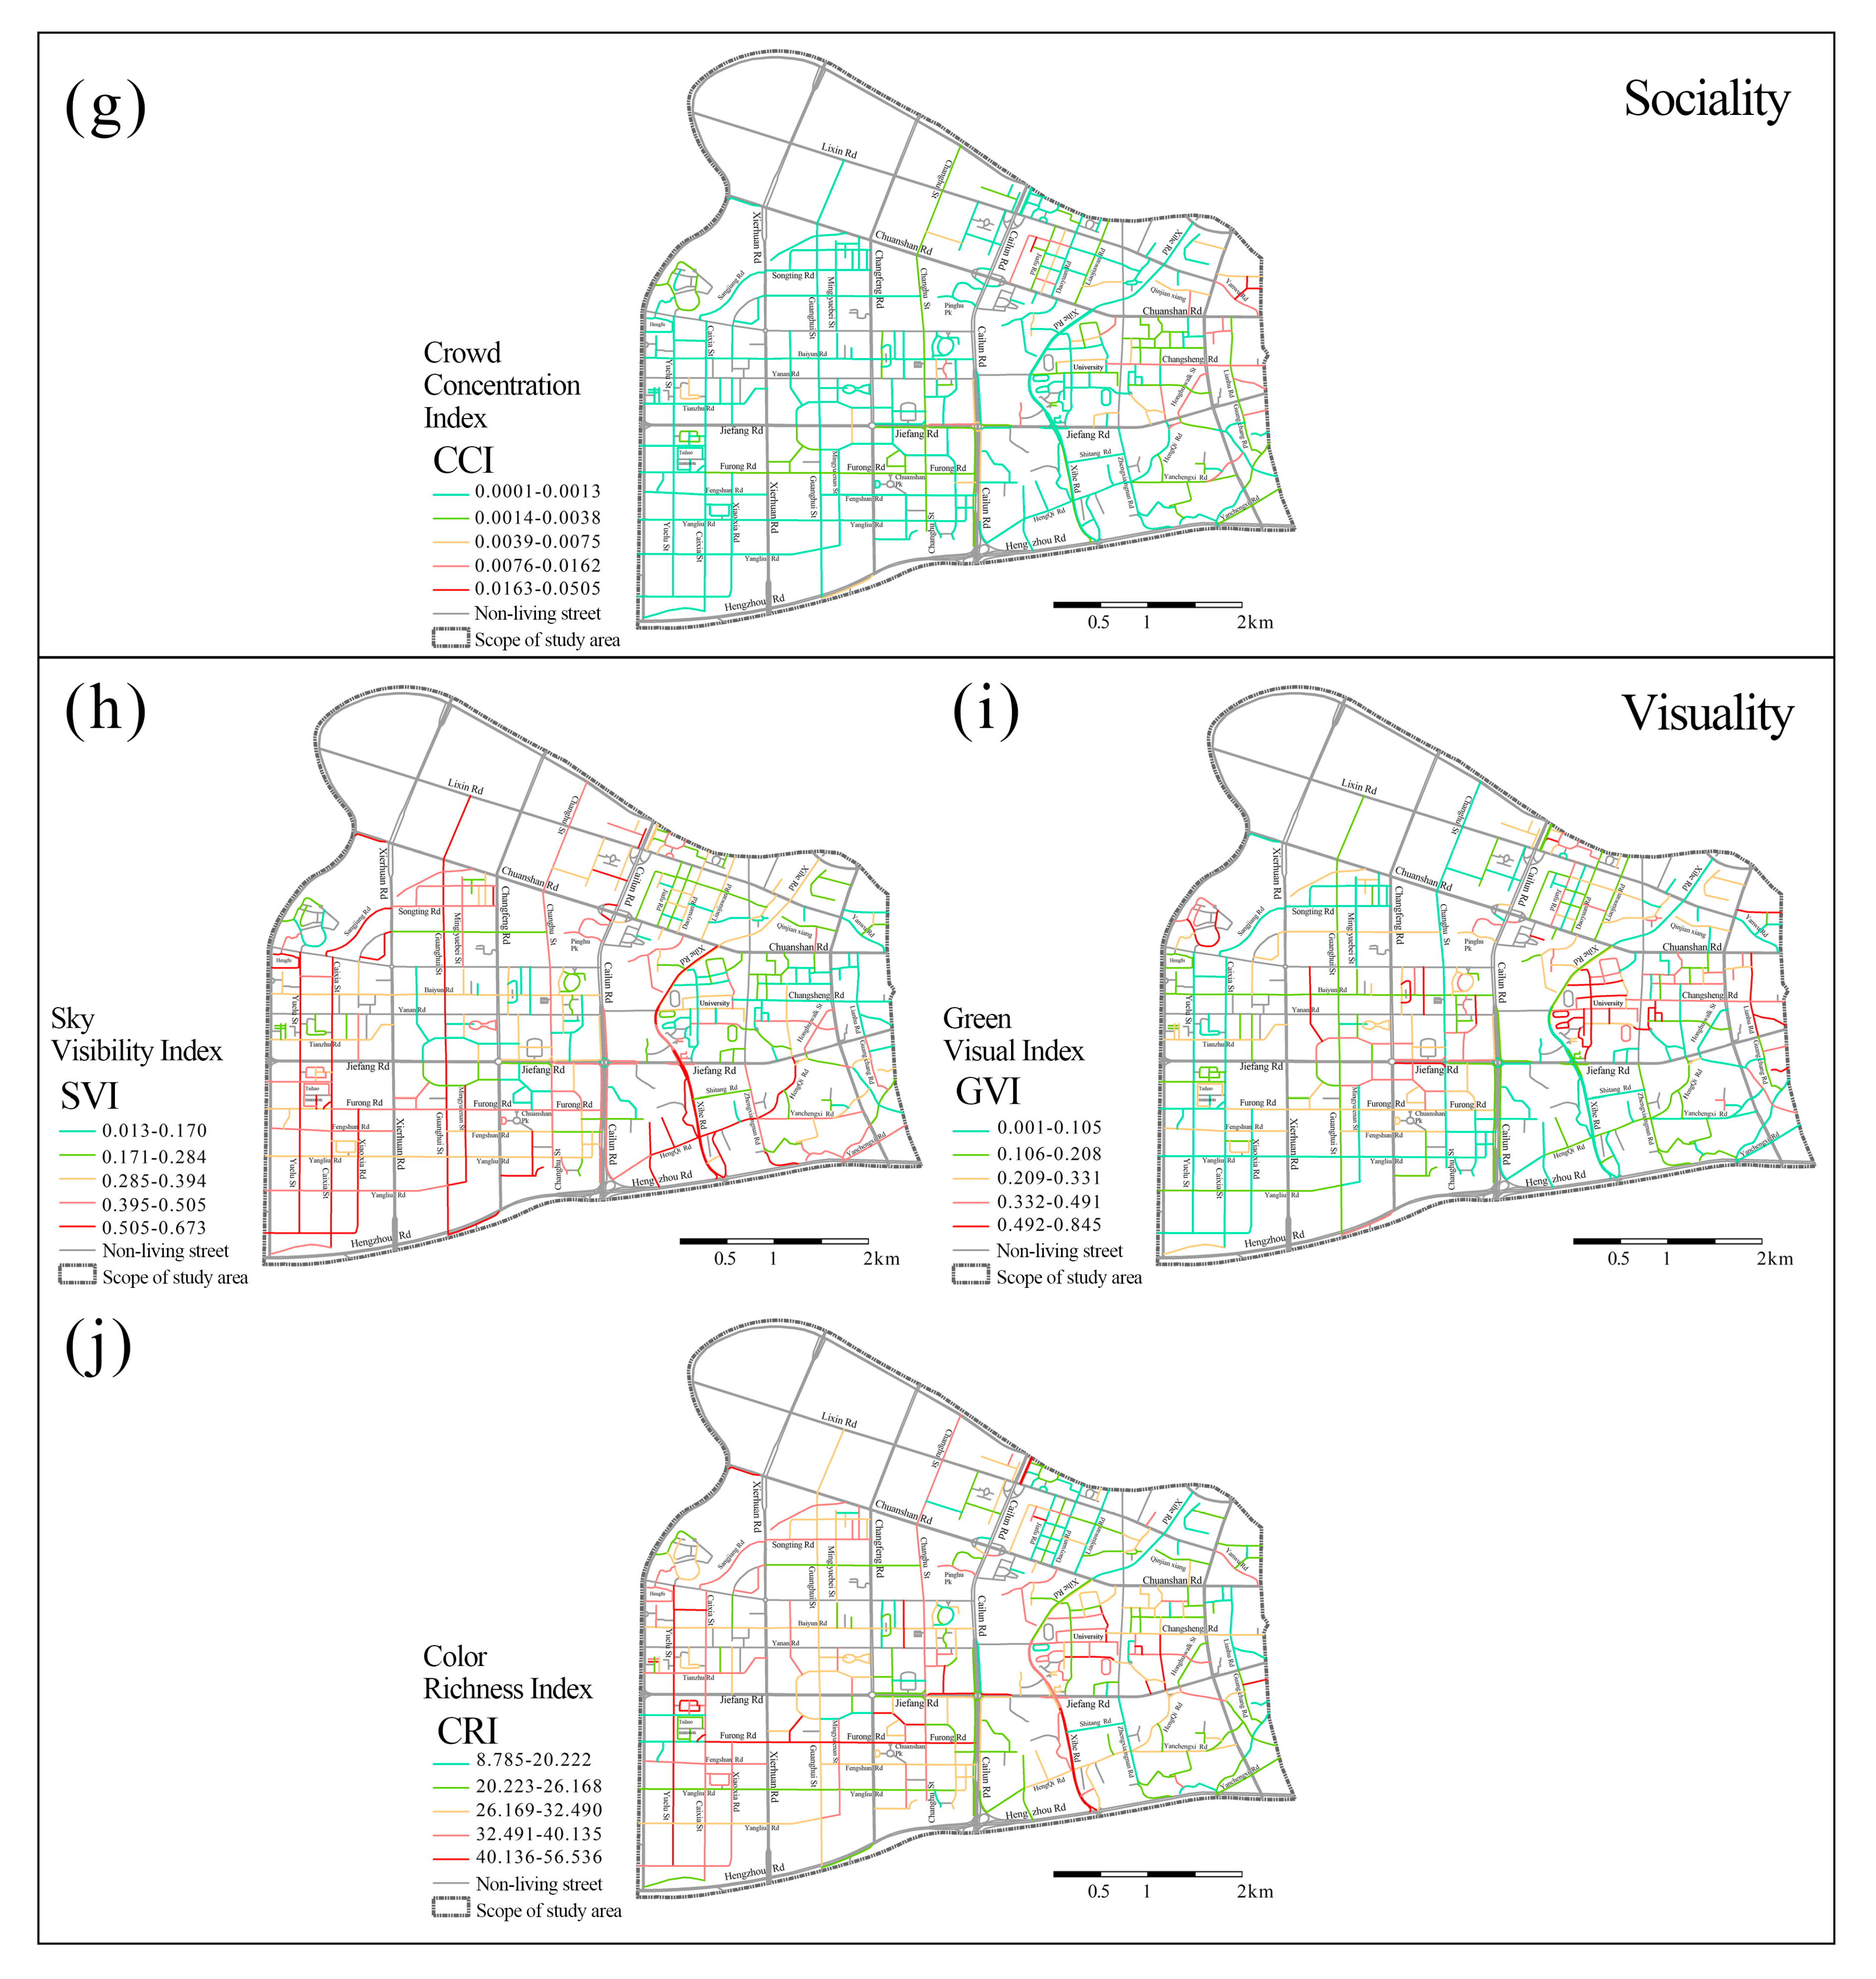
(5) The CCI did not differ significantly between individuals with high and low levels of Sociality (Figure 4g). Due to the proximity of schools and hospitals in the eastern region, a modest amount of the greater value is distributed.
(6) On the level of visuality, the spatial distribution of the SKI is the opposite of the ICI, with areas of high sky visibility located in the west, where they were developed relatively late. They are more open and have smaller trees, resulting in a greater amount of visible sky (Figure 4h). Predictably, the majority of high-value GVI areas are located in schools and a few parks. Since the rate of greening in these areas is relatively high (Figure 4i). In terms of the overall CRI, the low value is concentrated in the northeast, where the buildings are outdated and the streetscape is devoid of sufficient vitality (Figure 4j).
4.3. Validating the Evaluation Results
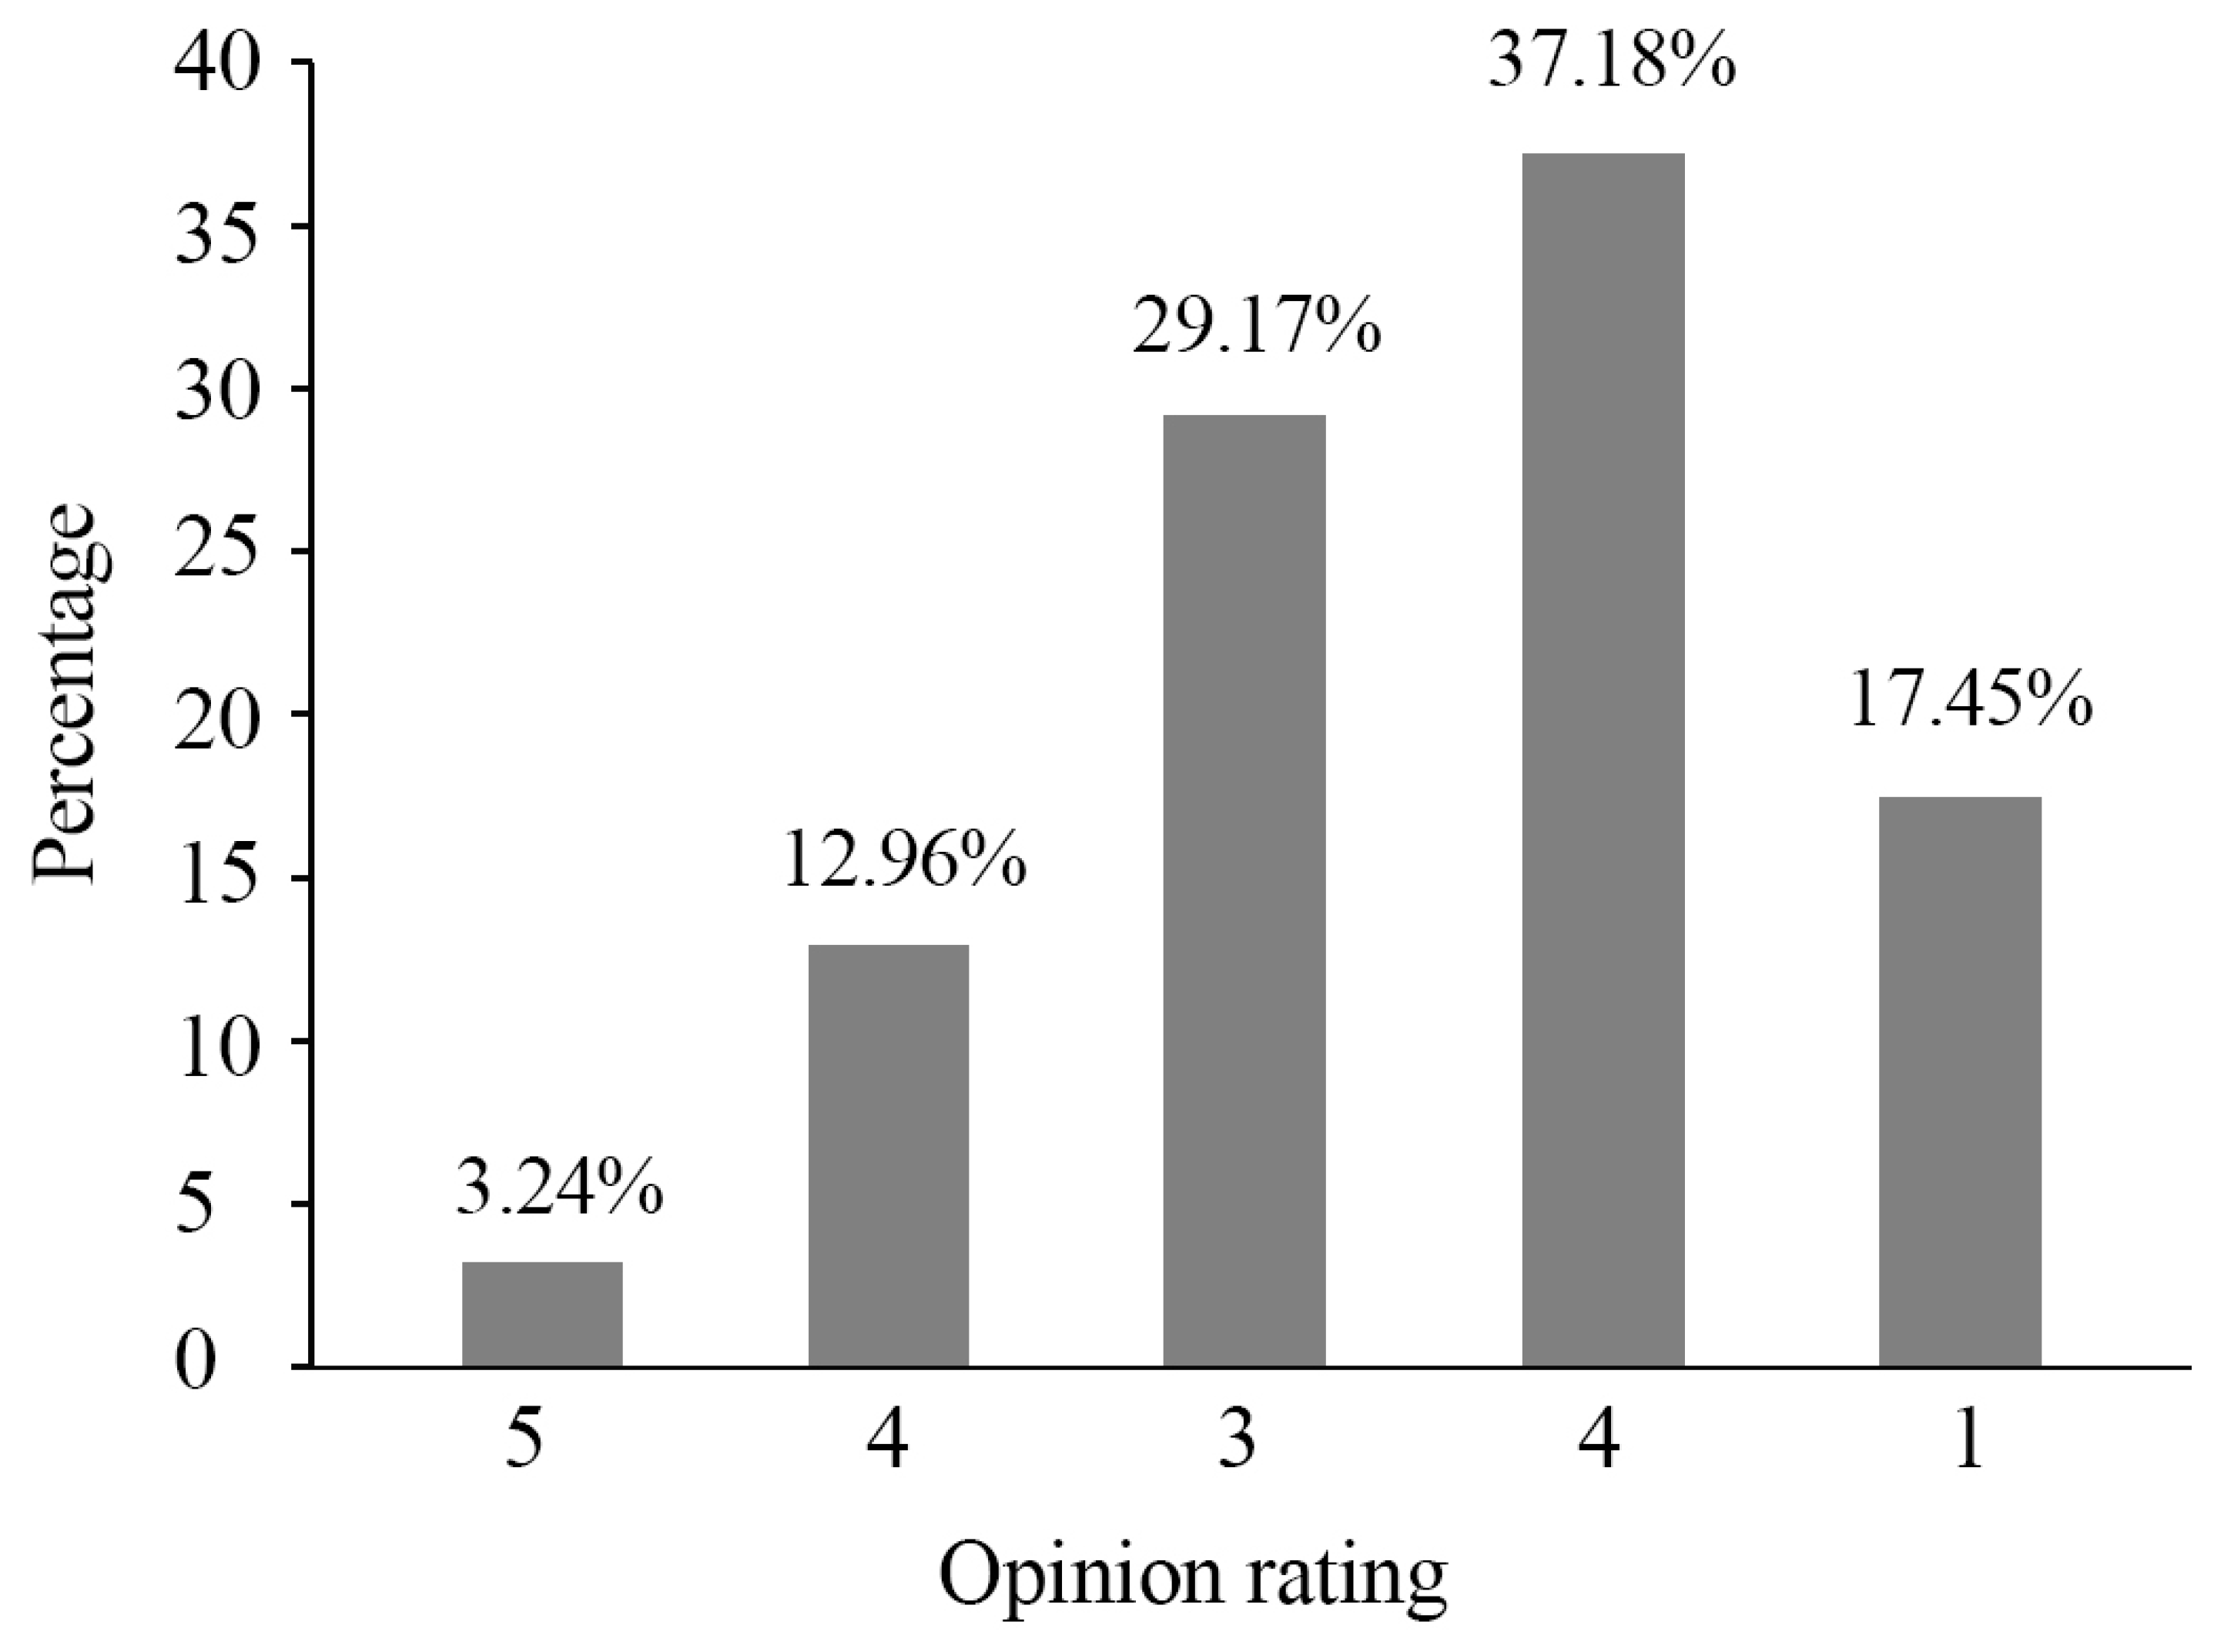
Random samples of SVI data collection points in the study area were taken to confirm the accuracy of the evaluation results. All sampling points were selected at 500-m intervals, and a total of 105 sampling points were selected. Six volunteers from relevant fields were tasked with constructing a subjective evaluation of the SVIs based on 105 sampling points. Volunteers make subjective evaluations according to the six evaluation dimensions of the evaluation system. These include convenience, functionality, safety, comfort, sociality, and visuality. In order to guarantee that the evaluation results are reasonable, a seminar was held beforehand to clarify the rules of the evaluation method. The possible score range was from 1 to 5, which corresponded to low quality, medium-low quality, medium quality, medium-high quality, and high quality.
The results of the scatter plot indicate that volunteers’ subjective and objective evaluations were highly congruent. Table 2 presents the average R2 values greater than 0.8 and the five SVI evaluation levels selected for presentation. In addition, there was a high level of agreement between the volunteers’ subjective and objective evaluation scores. Therefore, the objective evaluation results were reasonably constructed and accurate.
4.4. Linear Regression Analysis of Evaluation Indicators
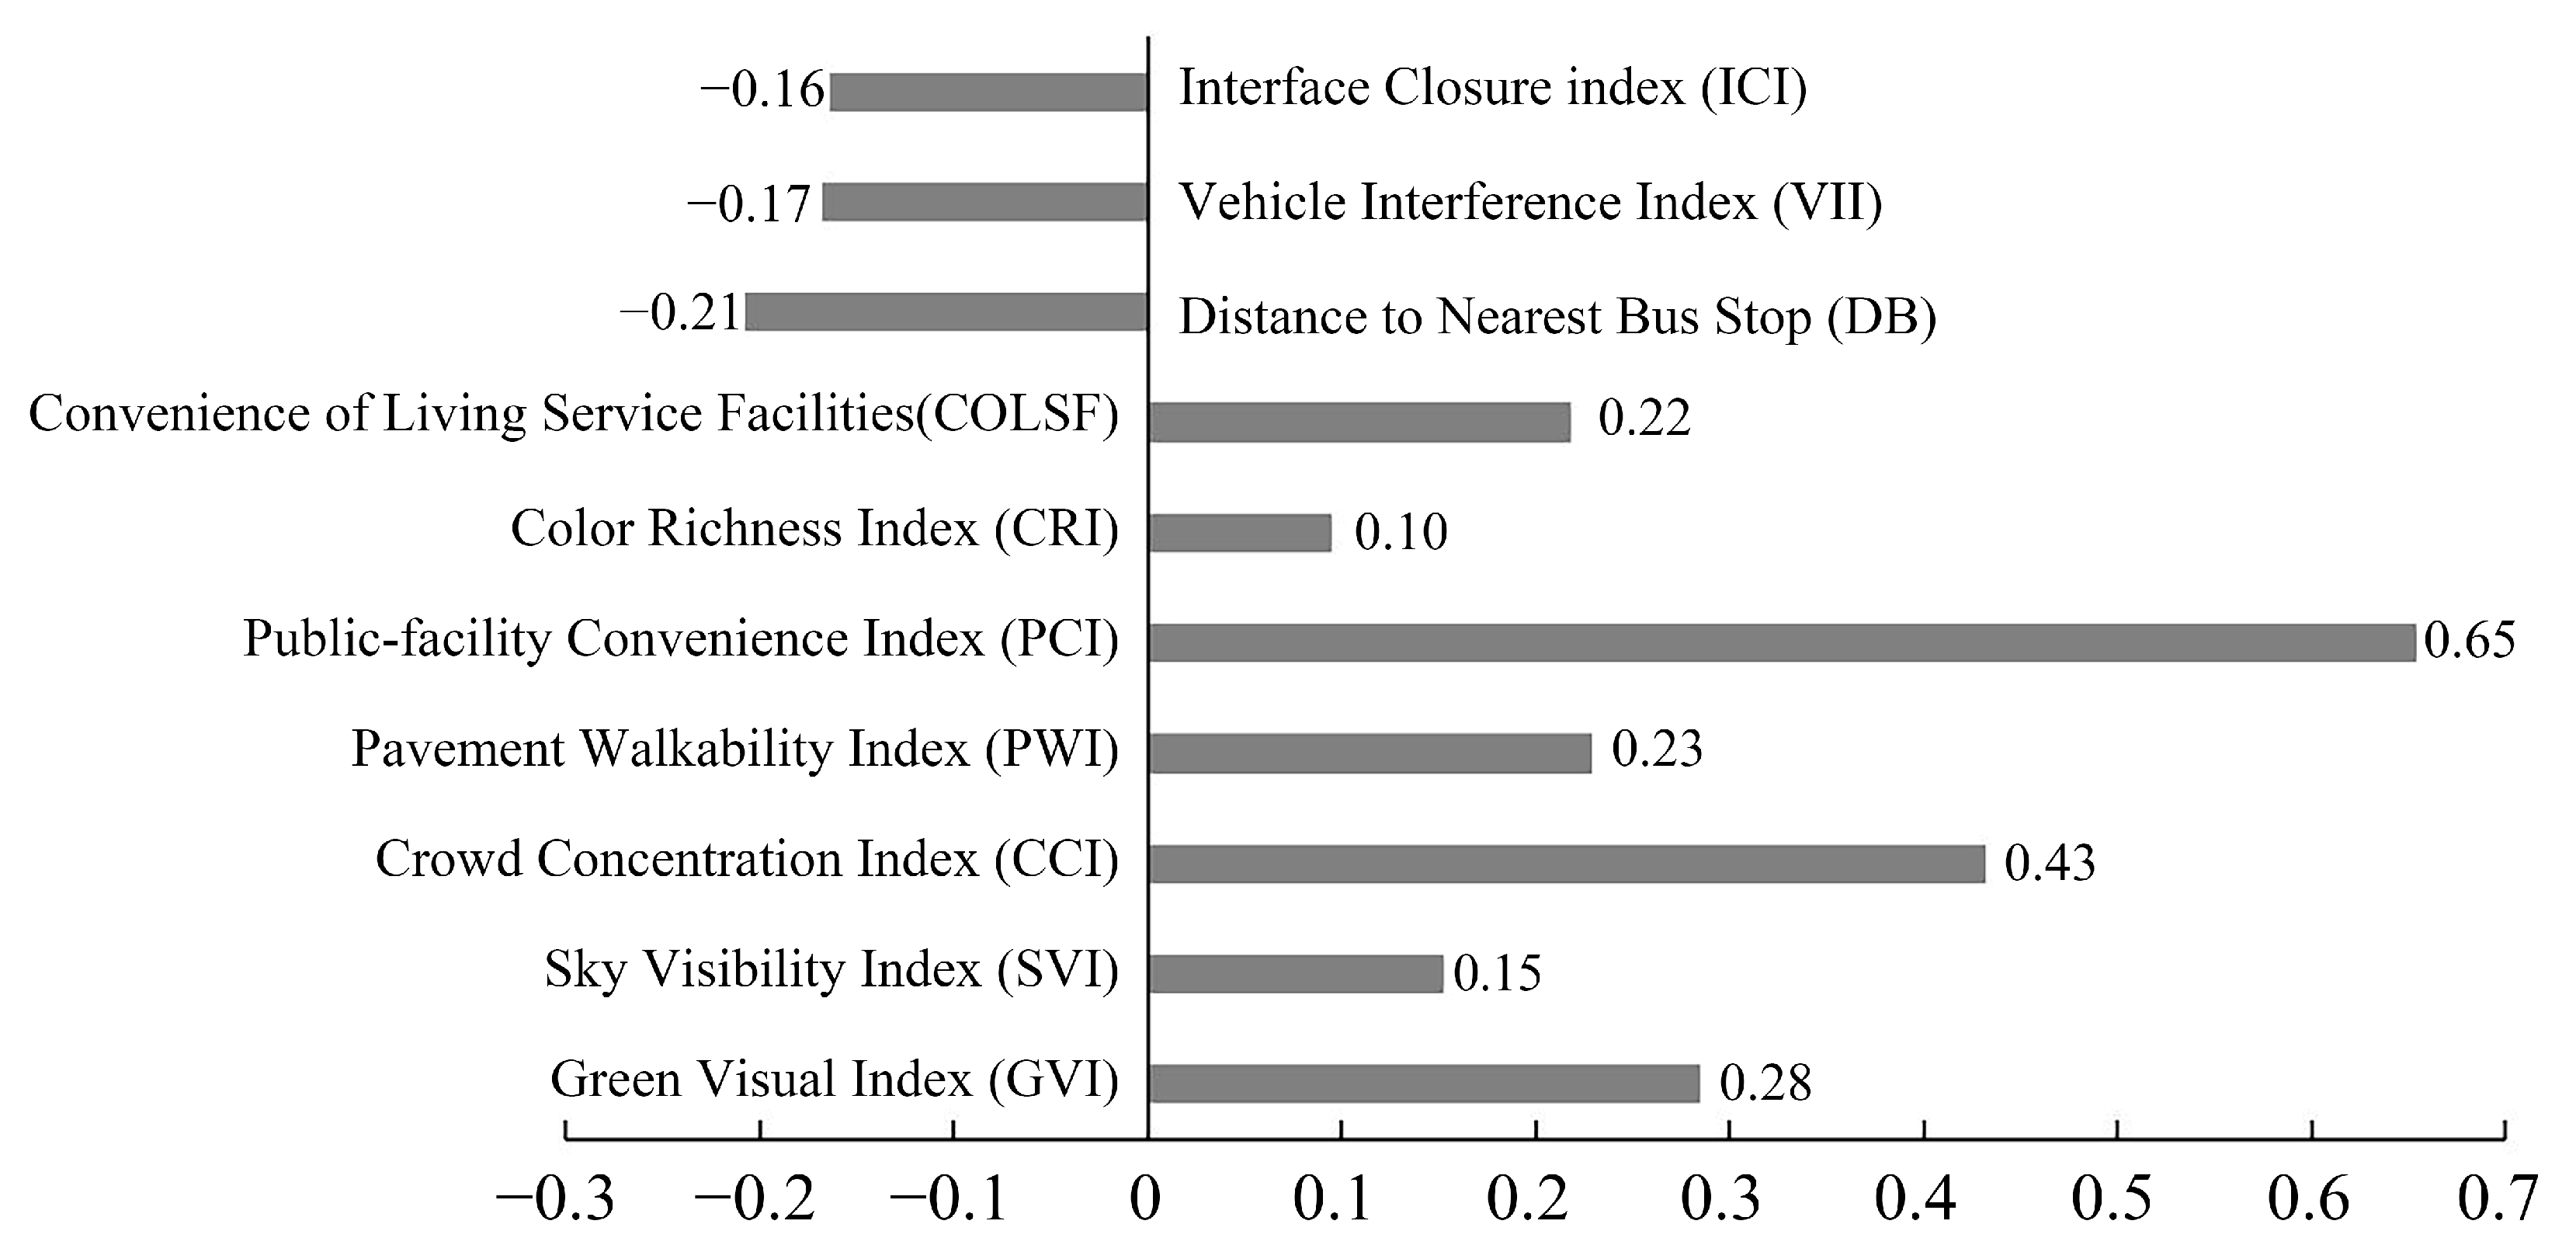
The significance of Beta for each coefficient standardization in the multiple linear regression analysis was less than 0.05 (there was no need to focus on values greater than 0.05) [14,44]. The COSF, CRI, PCI, SWI, CCI, SKI, and GVI had significant positive effects on residential street space quality, whereas the ICI, VII, and DB had negative effects (Figure 5). Among the indicators positively correlated with street space quality, PCI had the greatest impact on the quality scores, and perfect street facilities are essential to people’s daily lives. The second metric was the CCI, which indicated that the space was of a higher quality to a certain extent based on the length of time people remained there. COSF, SWI, and GVI are also significant factors that positively influence the quality of the space. In contrast to these indicators, the CRI and SKI play a significant role despite their low numerical values. The DB was the highest of the three negatively correlated indicators and was directly related to the ease of daily travel. Comparatively, the ICI and the VII were less influential than the DB, and there was little variation in numerical value between the DB, ICI, and VII.
4.5. Results of the Accessibility Analysis Based on the Spatial Syntax
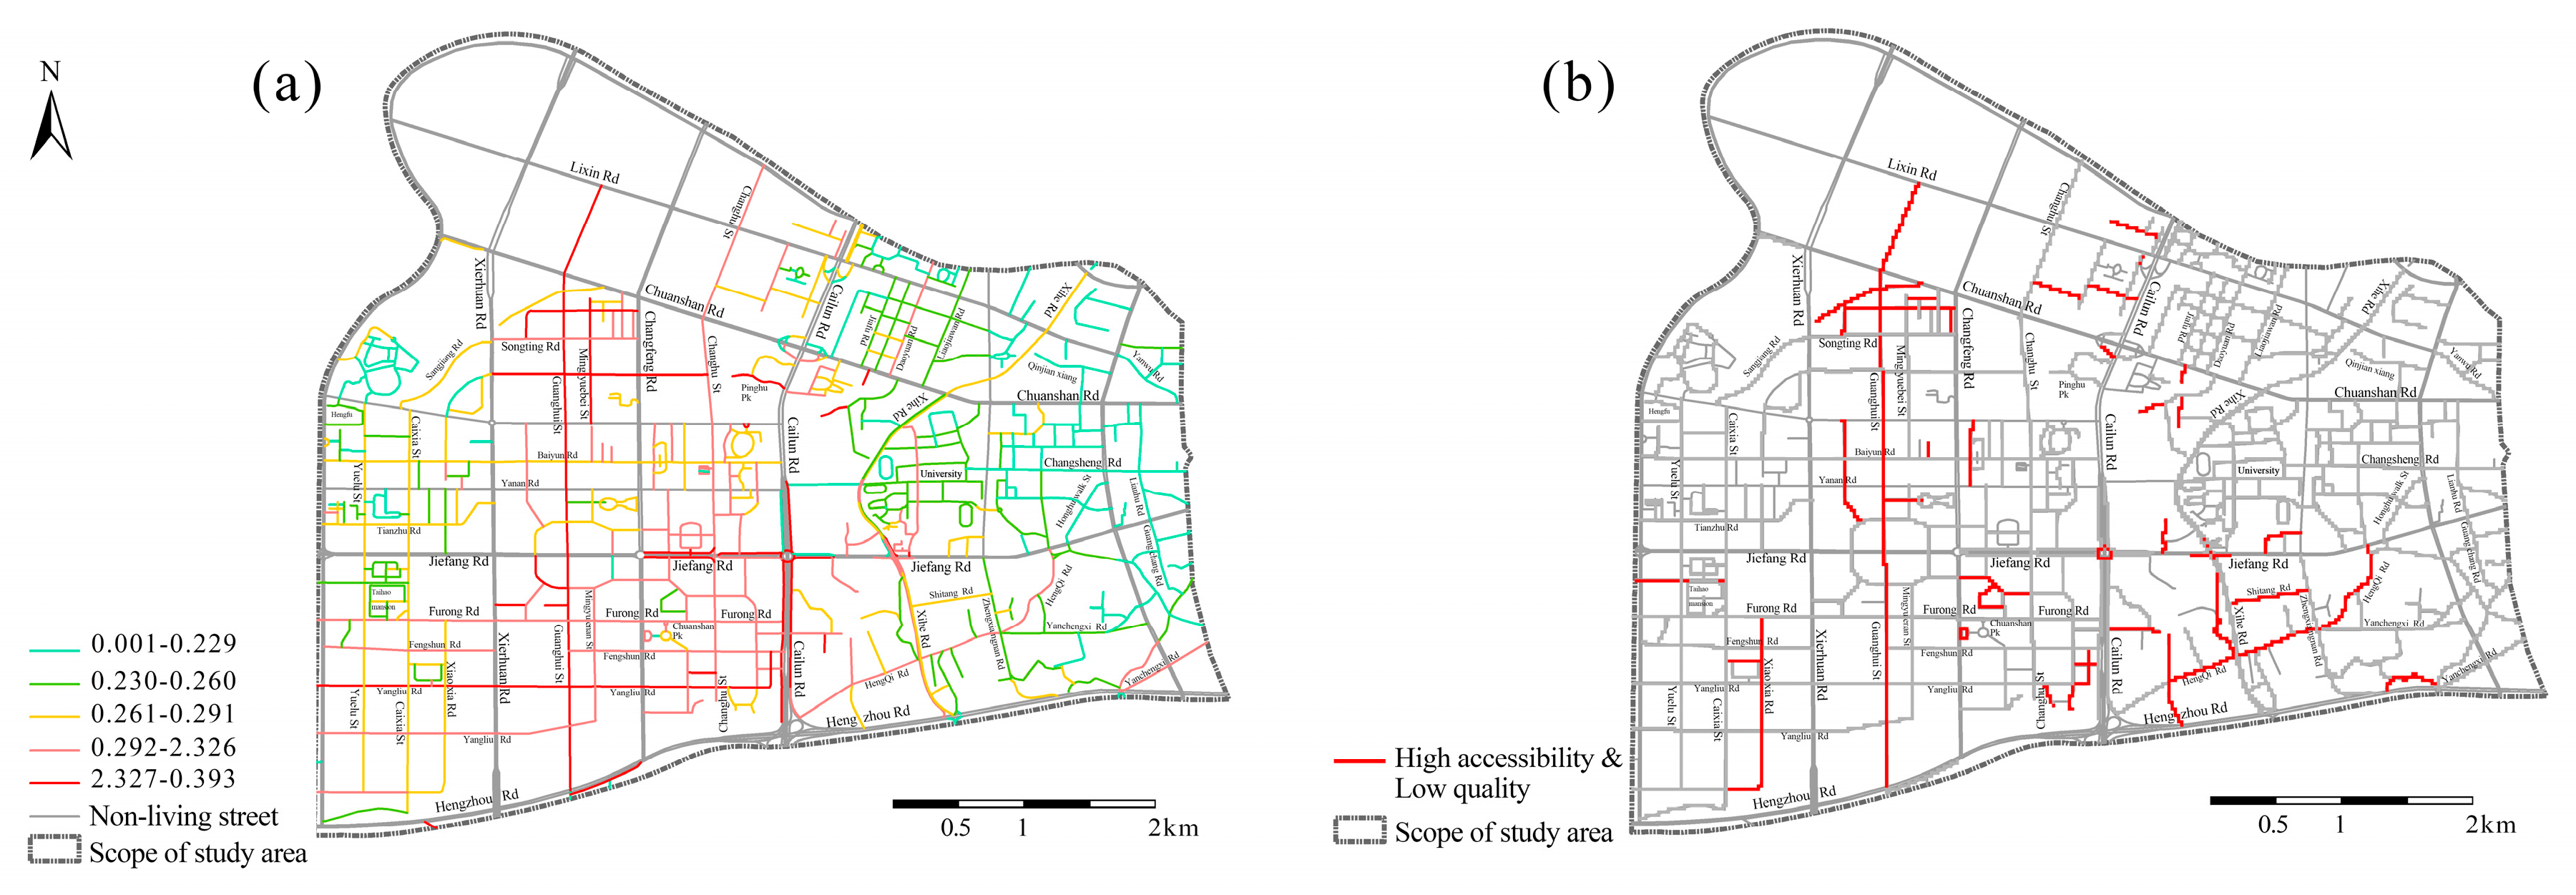
Figure 6a illustrates the accessibility of the residential streets within a 500-m radius. Guanghui Street, Cailun Avenue, and Yangliu Road constituted the majority of highly accessible areas in the central west. In addition, these roads connected north-south and west-east over considerable distances. The majority of low-accessibility living streets in the study area were located in the eastern region, where they were built in an older environment with a relatively complex street network and a low level of integration.
The top 30% of streets with high accessibility values were overlaid with the bottom 30% of streets with low spatial quality evaluation scores, and it was deemed a priority update (Figure 6b). These streets include Xiaoxia Street, Guanghui Street, and Hengqi Road; the rest are scattered throughout the study area.
5. Conclusions
Through an analysis of the results of the spatial quality of living streets and related indicators, the spatial quality distribution of living streets in Hengyang’s central area is determined, both generally and for each evaluation indicator. Hengyang City is a model for China’s comprehensive reform of the service sector and a showcase for ecological civilization. Since the end of the 1990s, urban development in Hengyang City has been hampered by factors such as deficient infrastructure. In recent years, Hengyang has taken advantage of the opportunity to establish the “National Civilized City” and the “National Excellent Tourism City” and has begun to comprehensively manage the urban environment [45]. According to the results of the overall evaluation of the spatial quality of the living streets in the study area, the spaces with the highest quality are located in the eastern portion of the study area. These streets were newly constructed or renovated compared to the older urban areas in the eastern region.
High accessibility reflects the high value of street space, so the implementation of the plan to renew street space should be phased and categorized. The overlay analysis of accessibility and spatial quality scores should therefore prioritize “high accessibility-low quality” for street renewal. In addition, Xiaoxia Street, Guanghui Street, and Hengqi Road should be prioritized for improvement due to their poor spatial quality, high accessibility, and high importance.
The street network in the west of the study area is well integrated, and these streets can be enhanced from a broader standpoint. The complexity of the street network in the eastern region hinders the viability of urban renewal; consequently, various space types require corresponding measures. Based on the results of a linear regression analysis of 10 evaluation indices, the significance of each index can be determined. Moreover, spatial quality will be enhanced more precisely by enhancing the spatial components of indicators with a significant impact on spatial quality.
Based on the findings of our study, the following suggestions are provided to guide the revitalization and enhancement of the living street space:
(1) Numerous studies have demonstrated that people prefer open and transparent environments [46]. Reducing the CCI value requires decreasing the perception of spatial occlusion, planting intelligently, and avoiding the depressing effect that tall trees can have. The interface between buildings and streets should be aesthetically pleasing, and the permeability of the street surface should be considered so as to enhance the physical and psychological spatial experience.
(2) The issue of vehicle interference has a substantial effect on pedestrian perception and the spatial quality of streets. In today’s urban environment, the difficulty of parking and the abundance of vehicles pose a challenge. The space designated for resident activities is largely occupied by motor vehicles, whose movement compromises the safety of residents using the space. The planning and construction of parking spaces must be rational, and the phenomenon of indiscriminate parking must be strictly regulated.
(3) According to the DB, the current stops are all within 500 m of the center of the street. Nonetheless, the difference between the indicator’s low and high values is significant; therefore, this disparity can be reduced through future planning.
(4) In this study, the number of living service POIs within the selected 500-meter street buffer zone indicated the convenience of the business. Although traffic function is a road’s primary function, a good street environment can attract business behavior, and commercial services also influence its spatial quality [17]. Therefore, revitalization efforts should prioritize the commercial function of the street. The PCI is an important measure of spatial quality that permits designers to arrange urban furnishings and artifacts according to the street’s lifestyle function. Adding wayfinding signs, sculptural elements, trash cans, and rest areas is likely to enhance the experience and atmosphere, as well as contribute to the establishment of a civilized city.
(5) The visual quality of the street can be improved in three ways: (a) By increasing the number of plants. Greenery can make urban spaces more hospitable, reduce the impact of heat islands, and contribute to a more aesthetically pleasing streetscape [47]. (b) Reduce the feeling of confinement in small spaces by optimizing plants, buildings, and facades to achieve reasonable sky visibility and increase the permeability of the space. (c) The CRI indicates the colorfulness of the interface within the street space, and a variety of colors can contribute to enhancing the ambiance of the space and the quality of the street [48]. This can be achieved by enhancing the spatial interface’s details, including textures, colors, and the matching of various materials.
(6) Walking is beneficial to the health of residents [49]. A street environment that encourages urban walking is beneficial to the health of residents. Studies show that greening rates have a positive effect on walking intentions [50]. In China, urban street construction shifted from a focus on vehicular traffic to a focus on people and from a focus on vehicular access as the dominant function to an emphasis on outdoor activity [51]. Consequently, enhancing and securing pedestrian space in public spaces is both a policy directive and an urgent need for current residents.
6. Discussion
6.1. Implications of the Study for Urban Construction
In order to evaluate the quality of space, our research begins with the public space of urban streets and then selects a category of living-type streets that have a daily impact on residents. We identified the quality of living street space in the study area and which streets require renovation with the highest priority. This work will contribute to the government’s efforts to improve the urban environment. This study developed multidimensional assessment metrics. They are a more objective and comprehensive reflection of the diverse elements of the streetscape. These indicators affect the spatial quality rating and play an important guiding role in the creation of spatial optimization strategies for living streets. We hoped that this design could serve as a template for the construction of living streets in other urban areas.
6.2. Limitations of the Study
The current study has yielded largely satisfactory results; however, it is not devoid of limitations. Due to the issue with shooting time, the SVIs data may not accurately reflect the current situation of the living street space in a timely and comprehensive manner. Our objective evaluation of the spatial elements of the street environment avoided, to some extent, the influence of subjective evaluation. People utilize space, and their subjective perceptions cannot be disregarded. In order to make a more reasonable spatial evaluation in the future, incorporating indicators based on people’s subjective feelings must be considered. In recent years, numerous psychophysics-based research methods have been developed to quantify people’s subjective spatial perception [52]. A space quality evaluation system may also include indicators for acoustic and thermal comfort [53,54]. In conclusion, the study of urban-living street spatial quality can be conducted by incorporating a number of relevant factors from other disciplines to establish a more comprehensive evaluation standard.
Author Contributions
Conceptualization, J.D. and Z.H.; methodology, J.D. and Z.H.; software, X.G.; validation, J.L. (Jianjun Liao), J.L. (Jing Liu), and A.S.; formal analysis, J.D.; data curation, J.L. (Jing Liu) and X.G.; writing—original draft preparation, J.D. and Z.H.; writing—review and editing, J.D., Z.H., and J.L. (Jianjun Liao); visualization, A.S.; supervision, Z.H.; project administration, Z.H. All authors have read and agreed to the published version of the manuscript.
Funding
This research was funded by the Fundamental Scientific Foundation of the University of South China (grant number 190XQD098), the Hunan Innovative Province Construction Special Innovation Platform Project (grant number 2019TP2072), the National Natural Science Foundation of China (grant number 31700196), and the Natural Science Foundation of Hunan Province (grant number 2020JJ5477).
Institutional Review Board Statement
Not applicable.
Informed Consent Statement
Not applicable.
Data Availability Statement
The data presented in this study are available on request from the corresponding author.
Conflicts of Interest
The authors declare no conflict of interest.
References
- Bain, L.; Gray, B.; Rodgers, D. Living Streets: Strategies for Crafting Public Space; John Wiley & Sons, Inc.: Hoboken, NJ, USA, 2012. [Google Scholar]
- Tang, J.; Long, Y. Measuring visual quality of street space and its temporal variation: Methodology and its application in the Hutong area in Beijing. Landsc. Urban Plan. 2019, 191, 103436. [Google Scholar] [CrossRef]
- Hagen, O.H.; Tennøy, A. Street-space reallocation in the Oslo city center: Adaptations, effects, and consequences. Transp. Res. Part Transp. Environ. 2021, 97, 102944. [Google Scholar] [CrossRef]
- Cresswell, T. The Crucial ‘Where’ of Graffiti: A Geographical Analysis of Reactions to Graffiti in New York. Environ. Plan. Soc. Space 1992, 10, 329–344. [Google Scholar] [CrossRef]
- Montello, D.R.; Goodchild, M.F.; Gottsegen, J.; Fohl, P. Where’s Downtown?: Behavioral Methods for Determining Referents of Vague Spatial Queries. Spat. Cogn. Comput. 2003, 3, 185–204. [Google Scholar]
- Chen, L.; Lu, Y.; Sheng, Q.; Ye, Y.; Wang, R.; Liu, Y. Estimating pedestrian volume using Street View images: A large-scale validation test. Comput. Environ. Urban Syst. 2020, 81, 101481. [Google Scholar] [CrossRef]
- Liu, M.; Han, L.; Xiong, S.; Qing, L.; Ji, H.; Peng, Y. Large-scale street space quality evaluation based on deep learning over streetview image. In Proceedings of the Image and Graphics: 10th International Conference, ICIG 2019, Beijing, China, 23–25 August 2019; pp. 690–701. [Google Scholar]
- Stubbings, P.; Peskett, J.; Rowe, F.; Arribas-Bel, D. A hierarchical urban forest index using street-level imagery and deep learning. Remote Sens. 2019, 11, 1395. [Google Scholar] [CrossRef] [Green Version]
- Ewing, R.; Clemente, O.; Neckerman, K.M.; Purciel-Hill, M.; Quinn, J.W.; Rundle, A. Measuring Urban Design: Metrics for Livable Places; Island Press: Washington, DC, USA, 2013. [Google Scholar]
- Yao, Y.; Li, X.; Liu, X.; Liu, P.; Liang, Z.; Zhang, J.; Mai, K. Sensing spatial distribution of urban land use by integrating points-of-interest and Google Word2V ec model. Int. J. Geogr. Inf. Sci. 2017, 31, 825–848. [Google Scholar] [CrossRef]
- Kelly, C.; Wilson, J.; Baker, E.; Miller, D.; Schootman, M. Using google street view to audit the built environment: Inter-rater reliability results. Ann. Behav. Med. 2013, 45, 108–112. [Google Scholar] [CrossRef] [Green Version]
- Tang, J.; Long, Y. Metropolitan Street Space Quality Evaluation: Second And Third Ring Of Beijing, Inner Ring of Shanghai. Planners 2017, 33, 68–73. [Google Scholar]
- Gustat, J.; Anderson, C.E.; Chukwurah, Q.C.; Wallace, M.E.; Broyles, S.T.; Bazzano, L.A. Cross-sectional associations between the neighborhood built environment and physical activity in a rural setting: The bogalusa heart study. BMC Public Health 2020, 20, 1426. [Google Scholar] [CrossRef]
- Wang, L.; Han, X.; He, J.; Jung, T. Measuring residents’ perceptions of city streets to inform better street planning through deep learning and space syntax. ISPRS J. Photogramm. 2022, 190, 215–230. [Google Scholar] [CrossRef]
- Ma, X.; Ma, C.; Wu, C.; Xi, Y.; Yang, R.; Peng, N.; Zhang, C.; Ren, F. Measuring human perceptions of streetscapes to better inform urban renewal: A perspective of scene semantic parsing. Cities 2021, 110, 103086. [Google Scholar] [CrossRef]
- Han, X.; Wang, L.; Seo, S.H.; He, J.; Jung, T. Measuring perceived psychological stress in urban built environments using Google Street View and deep learning. Front. Public Health 2022, 10, 891736. [Google Scholar] [CrossRef] [PubMed]
- Hu, F.; Liu, W.; Lu, J.; Song, C.; Meng, Y.; Wang, J.; Xing, H. Urban function as a new perspective for adaptive street quality assessment. Sustainability 2020, 12, 1296. [Google Scholar] [CrossRef] [Green Version]
- He, N.; Li, G. Urban neighbourhood environment assessment based on street view image processing: A review of research trends. Environ. Chall. 2021, 4, 100090. [Google Scholar] [CrossRef]
- Du, Y.; Huang, W. Evaluation of Street Space Quality Using Streetscape Data: Perspective from Recreational Physical Activity of the Elderly. ISPRS Int. J. Geo-Inf. 2022, 11, 241. [Google Scholar] [CrossRef]
- Alvarez Leon, L.F.; Quinn, S. The value of crowdsourced street-level imagery: Examining the shifting property regimes of OpenStreetCam and Mapillary. GeoJournal 2019, 84, 395–414. [Google Scholar] [CrossRef]
- Mooney, P.; Minghini, M. A review of OpenStreetMap data. Mapp. Citiz. Sens. 2017, 37–59. [Google Scholar] [CrossRef] [Green Version]
- Sun, L.; Wang, J.; Xie, Z.; Li, R.; Wu, X.; Wu, Y. Evaluating the Street Greening with the Multiview Data Fusion. J. Sens. 2021, 2021, 2793474. [Google Scholar] [CrossRef]
- Cheng, L.; Chu, S.; Zong, W.; Li, S.; Wu, J.; Li, M. Use of Tencent Street View Imagery for Visual Perception of Streets. ISPRS Int. J. Geo-Inf. 2017, 6, 265. [Google Scholar] [CrossRef] [Green Version]
- Zhang, M.; Liu, Y.; Luo, S.; Gao, S. Research on Baidu Street View Road Crack Information Extraction Based on Deep LearningMethod. In Proceedings of the Journal of Physics: Conference Series, Mangalore, India, 1 August 2020; p. 012086. [Google Scholar]
- Chang, S.; Wang, Z.; Mao, D.; Guan, K.; Jia, M.; Chen, C. Mapping the Essential Urban Land Use in Changchun by ApplyingRandom Forest and Multi-Source Geospatial Data. Remote Sens. 2020, 12, 2488. [Google Scholar] [CrossRef]
- Qiu, J.; Cao, J.; Gu, X.; Ge, Z.; Wang, Z.; Liang, Z. Design of an Evaluation System for Disruptive Technologies to Benefit Smart Cities. Sustainability 2023, 15, 9109. [Google Scholar] [CrossRef]
- Peng, Y.; Qiu, H.; Wang, X. The Influence of Spatial Functions on the Public Space System of Traditional Settlements. Sustainability 2023, 15, 8632. [Google Scholar] [CrossRef]
- Wang, J.; Hu, Y.; Duolihong, W. Diagnosis and Planning Strategies for Quality of Urban Street Space Based on Street View Images. ISPRS Int. J. Geo-Inf. 2023, 12, 15. [Google Scholar] [CrossRef]
- Badrinarayanan, V.; Kendall, A.; Cipolla, R. SegNet: A deep convolutional encoder-decoder architecture for scene segmentation. IEEE Trans. Pattern Anal. Mach. Intell. 2017, 39, 2481–2495. [Google Scholar] [CrossRef] [PubMed]
- Zhao, H.; Shi, J.; Qi, X.; Wang, X.; Jia, J. Pyramid Scene Parsing Network. In Proceedings of the IEEE Conference on Computer Vision and Pattern Recognition. 2017, pp. 2881–2890. Available online: https://openaccess.thecvf.com/content_cvpr_2017/html/Zhao_Pyramid_Scene_Parsing_CVPR_2017_paper.html (accessed on 3 July 2023).
- Zhou, B.; Zhao, H.; Puig, X.; Xiao, T.; Fidler, S.; Barriuso, A.; Torralba, A. Semantic understanding of scenes through the ade20k dataset. Int. J. Comput. Vis. 2019, 127, 302–321. [Google Scholar] [CrossRef] [Green Version]
- Yi, Z.; Chang, T.; Li, S.; Liu, R.; Zhang, J.; Hao, A. Scene-aware deep networks for semantic segmentation of images. IEEE Access. 2019, 7, 69184–69193. [Google Scholar] [CrossRef]
- Di, D.; Jiang, Y.H.; Ye, D.; Ye, Y. Street Space Quality Evaluation Supported by New Urban Science: The Central District of Shanghai. Planners 2021, 37, 5–12. [Google Scholar]
- Wan, T.; Lu, W.; Sun, P. Constructing the Quality Measurement Model of Street Space and Its Application in the Old Town in Wuhan. Front. Public Health 2022, 10, 816317. [Google Scholar] [CrossRef]
- Wang, M.; He, Y.; Meng, H.; Zhang, Y.; Zhu, B.; Mango, J.; Li, X. Assessing street space quality using street view imagery and function-driven method: The case of Xiamen, China. ISPRS Int. J. Geo-Inf. 2022, 11, 282. [Google Scholar] [CrossRef]
- Xuan, W.; Zhao, L. Research on Correlation between Spatial Quality of Urban Streets and Pedestrian Walking Characteristics in China Based on Street View Big Data. J. Urban. Plan. Dev. 2022, 148, 05022035. [Google Scholar] [CrossRef]
- Kumar, R.; Singh, S.; Bilga, P.S.; Singh, J.; Singh, S.; Scutaru, M.L.; Pruncu, C.I. Revealing the benefits of entropy weights method for multi-objective optimization in machining operations: A critical review. J. Mater. Res. Technol. 2021, 10, 1471–1492. [Google Scholar] [CrossRef]
- Barke, M.; Ünlü, T.; Conzen, M.R.G.; Cataldi, G.; Marzot, N.; Pont, M.B.; Conzen, M.P.; Gu, K.; Strappa, G.; De Holanda, F.R. Teaching Urban Morphology; Oliveira, V., Ed.; Springer: Cham, Switzerland, 2018. [Google Scholar]
- Atakara, C.; Allahmoradi, M. Investigating the urban spatial growth by using space syntax and GIS—A case study of Famagusta city. ISPRS Int. J. Geo-Inf. 2021, 10, 638. [Google Scholar] [CrossRef]
- Lyu, Y.; Forsyth, A. Attitudes, perceptions, and walking behavior in a Chinese city. J. Transp. Health 2021, 21, 101047. [Google Scholar] [CrossRef]
- Bathrellos, G.D.; Gaki-Papanastassiou, K.; Skilodimou, H.D.; Papanastassiou, D.; Chousianitis, K.G. Potential suitability for urban planning and industry development using natural hazard maps and geological–geomorphological parameters. Environ. Earth Sci. 2012, 66, 537–548. [Google Scholar] [CrossRef]
- Okabe, A.; Satoh, T.; Sugihara, K. A kernel density estimation method for networks, its computational method and a GIS-based tool. Int. J. Geogr. Inf. Sci. 2009, 23, 7–32. [Google Scholar] [CrossRef]
- Guo, Y.; Lei, G.; Zhang, L. Quality Evaluation of Park Green Space Based on Multi-Source Spatial Data in Shenyang. Sustainability 2023, 15, 8991. [Google Scholar] [CrossRef]
- Turp, G.A.; Ozdemir, S.; Yetilmezsoy, K.; Oz, N.; Elkamel, A. Role of Vermicomposting Microorganisms in the Conversion of Biomass Ash to Bio-Based Fertilizers. Sustainability 2023, 15, 8984. [Google Scholar] [CrossRef]
- Li, B.; He, Q.; Liu, P. The Dynamic Measurement and Empirical Research of the Recycling-City Construction: A Case Study of Hengyang City. Ecol. Econ. 2010, 12, 24–27, 31. [Google Scholar]
- Huang, J.; Liang, J.; Yang, M.; Li, Y. Visual Preference Analysis and Planning Responses Based on Street View Images: A Case Study of Gulangyu Island, China. Land 2023, 12, 129. [Google Scholar] [CrossRef]
- Klemm, W.; Heusinkveld, B.G.; Lenzholzer, S.; van Hove, B. Street greenery and its physical and psychological impact on ther-mal comfort. Landsc. Urban Plan. 2015, 138, 87–98. [Google Scholar] [CrossRef]
- Qiu, W.; Li, W.; Liu, X.; Huang, X. Subjectively Measured Streetscape Perceptions to Inform Urban Design Strategies for Shanghai. ISPRS Int. J. Geo-Inf. 2021, 10, 493. [Google Scholar] [CrossRef]
- World Health Organization. Global Recommendations on Physical Activity for Health; World Health Organization: Geneva, Switzerland, 2010. [Google Scholar]
- Lu, Y.; Sarkar, C.; Xiao, Y. The effect of street-level greenery on walking behavior: Evidence from Hong Kong. Soc. Sci. Med. 2018, 208, 41–49. [Google Scholar] [CrossRef] [PubMed]
- Cai, B. Street Landscape Practice under the Perspective. Chin. Landsc. Archit. 2021, 37, 62–66. [Google Scholar]
- Wei, N.; Jiangxu, J.; Mimi, W.; Jin, S.; Gang, L. Research on the Impact of Panoramic Green View Index of Virtual Reality Environments on Individuals’ Pleasure Level Based on EEG Experiment. Landsc. Archit. Front. 2022, 10, 36–51. [Google Scholar] [CrossRef]
- Yilmaz, S.; Külekçi, E.A.; Mutlu, B.E.; Sezen, I. Analysis of winter thermal comfort conditions: Street scenarios using ENVI-met model. Environ. Sci. Pollut. Res. 2021, 28, 63837–63859. [Google Scholar] [CrossRef]
- Li, W.; Zhai, J.; Zhu, M. Characteristics and perception evaluation of the soundscapes of public spaces on both sides of the elevated road: A case study in Suzhou, China. Sustain. Cities Soc. 2022, 84, 103996. [Google Scholar] [CrossRef]
Figure 1.
Research framework.

Figure 2.
(a) Spatial distribution of QOLSS; (b) Kernel density analysis of QOLSS.

Figure 3.
The street proportion of QOLSS within the interval of Jenks natural breaks classification.
Figure 3.
The street proportion of QOLSS within the interval of Jenks natural breaks classification.

Figure 4.
Measurement results of 10 evaluation indicators based on subjective and objective dimensions (a–j).
Figure 4.
Measurement results of 10 evaluation indicators based on subjective and objective dimensions (a–j).


Figure 5.
Multiple linear regression analysis results of the QOLSS score and 10 indicators.

Figure 6.
(a) Accessibility of living streets within 500 m of the study area; (b) Overlay of the top 30% of accessibility and the top 30% of spatial quality scores.
Figure 6.
(a) Accessibility of living streets within 500 m of the study area; (b) Overlay of the top 30% of accessibility and the top 30% of spatial quality scores.


Table 1.
Evaluation index and weight results.
| Establishing Dimensions | Primary Indicators | Secondary Indicators | Weights | Related Attributes |
|---|---|---|---|---|
| Objective material | Convenience | Distance to Nearest Bus Stop (DB) | 0.041 | Negative correlation |
| Functionality | Public facility Convenience Index (PCI) | 0.242 | Positive correlation | |
| Convenience of living service facilities (COLSF) | 0.048 | Positive correlation | ||
| Security | Vehicle Interference Index (VII) | 0.203 | Negative correlation | |
| Subjective perception | Comfort | Pavement Walkability Index (PWI) | 0.054 | Positive correlation |
| Interface Closure Index (ICI) | 0.048 | Negative correlation | ||
| Sociality | Crowd Concentration Index (CCI) | 0.256 | Positive correlation | |
| Visuality | Color Richness Index (CRI) | 0.021 | Positive correlation | |
| Green Visual Index (GVI) | 0.060 | Positive correlation | ||
| Sky Visibility Index (SVI) | 0.027 | Positive correlation |
Quality of living street space (QOLSS) is calculated as follows: QOLSS = DB × 0.041 + PCI × 0.242 + COSF × 0.048 + VII × 0.203 + PWI × 0.054 + ICI × 0.048 + CCI × 0.256 + CRI × 0.021 + GVI × 0.060 + SVI × 0.027.
Table 2.
Verification of QOLSS evaluation results.
| ID | Street View Picture | Coordinates | os 1 | ss1 2 | ss2 2 | ss3 2 | ss4 2 | ss5 2 | ss6 2 |
|---|---|---|---|---|---|---|---|---|---|
| 14 |  | 112.568, 26.906 | 5 | 5 | 5 | 5 | 4 | 4 | 5 |
| 134 |  | 112.594, 26.896 | 4 | 3 | 3 | 5 | 3 | 4 | 4 |
| 901 |  | 112.588, 26.911 | 3 | 4 | 4 | 3 | 3 | 3 | 3 |
| 774 |  | 112.548, 26.884 | 2 | 2 | 3 | 2 | 2 | 3 | 2 |
| 1020 |  | 112.576, 26.919 | 1 | 1 | 1 | 1 | 1 | 1 | 1 |
1 os is the objective scoring result. 2 ss1–6 are the subjective scoring results of each of the six volunteers.
Disclaimer/Publisher’s Note: The statements, opinions and data contained in all publications are solely those of the individual author(s) and contributor(s) and not of MDPI and/or the editor(s). MDPI and/or the editor(s) disclaim responsibility for any injury to people or property resulting from any ideas, methods, instructions or products referred to in the content. |
© 2023 by the authors. Licensee MDPI, Basel, Switzerland. This article is an open access article distributed under the terms and conditions of the Creative Commons Attribution (CC BY) license (https://creativecommons.org/licenses/by/4.0/).
Share and Cite
MDPI and ACS Style
Duan, J.; Liao, J.; Liu, J.; Gao, X.; Shang, A.; Huang, Z. Evaluating the Spatial Quality of Urban Living Streets: A Case Study of Hengyang City in Central South China. Sustainability 2023, 15, 10623. https://doi.org/10.3390/su151310623
AMA Style
Duan J, Liao J, Liu J, Gao X, Shang A, Huang Z. Evaluating the Spatial Quality of Urban Living Streets: A Case Study of Hengyang City in Central South China. Sustainability. 2023; 15(13):10623. https://doi.org/10.3390/su151310623
Chicago/Turabian StyleDuan, Jingpeng, Jianjun Liao, Jing Liu, Xiaoxuan Gao, Ailin Shang, and Zhihuan Huang. 2023. "Evaluating the Spatial Quality of Urban Living Streets: A Case Study of Hengyang City in Central South China" Sustainability 15, no. 13: 10623. https://doi.org/10.3390/su151310623
Note that from the first issue of 2016, this journal uses article numbers instead of page numbers. See further details here.