
B-FGC-Net: A Building Extraction Network from High Resolution Remote Sensing Imagery


1
State Key Laboratory of Resources and Environmental Information System, Institute of Geographical Sciences and Natural Resources Research, Chinese Academy of Sciences, Beijing 100101, China
2
College of Resources and Environment, University of Chinese Academy of Sciences, Beijing 100049, China
*
Author to whom correspondence should be addressed.
Remote Sens. 2022, 14(2), 269; https://doi.org/10.3390/rs14020269
Submission received: 7 December 2021
/
Revised: 2 January 2022
/
Accepted: 5 January 2022
/
Published: 7 January 2022
(This article belongs to the Special Issue Remote Sensing Based Building Extraction II)
Abstract
:Deep learning (DL) shows remarkable performance in extracting buildings from high resolution remote sensing images. However, how to improve the performance of DL based methods, especially the perception of spatial information, is worth further study. For this purpose, we proposed a building extraction network with feature highlighting, global awareness, and cross level information fusion (B-FGC-Net). The residual learning and spatial attention unit are introduced in the encoder of the B-FGC-Net, which simplifies the training of deep convolutional neural networks and highlights the spatial information representation of features. The global feature information awareness module is added to capture multiscale contextual information and integrate the global semantic information. The cross level feature recalibration module is used to bridge the semantic gap between low and high level features to complete the effective fusion of cross level information. The performance of the proposed method was tested on two public building datasets and compared with classical methods, such as UNet, LinkNet, and SegNet. Experimental results demonstrate that B-FGC-Net exhibits improved profitability of accurate extraction and information integration for both small and large scale buildings. The IoU scores of B-FGC-Net on WHU and INRIA Building datasets are 90.04% and 79.31%, respectively. B-FGC-Net is an effective and recommended method for extracting buildings from high resolution remote sensing images.
1. Introduction
Building extraction from high resolution remote sensing images plays a critical role in natural disaster emergency and management [1], land resource utilization and analysis [2], and intelligent city construction and planning [3], etc. With the ongoing development of earth observation technology, automatically extracting buildings from high resolution remote sensing imagery has gradually become one of the most vital research topics [4]. Despite the wealth of spectral information provided by high resolution remote sensing imagery [5], the spectral discrepancy among the various buildings coupled with complex background noise poses a significant challenge to automatic building extraction [6]. Therefore, a high precision and high performance extraction method for building extraction automation is urgently needed.
According to the different classification scales, there are two leading conventional approaches for the extraction of buildings from high resolution remote sensing imagery: pixel based and object based [7]. Pixel based thought regards a single pixel or its neighbouring pixels as a whole, which can extract building information by the spectral similarities principle [8]. Commonly used pixel based methods include maximum likelihood classification [9,10], decision tree, random forest, and support vector machine [11]. However, these methods may result in extremely serious salt and pepper noise [12] because of the characteristics of the same spectrum foreign matter and the same object heterogenic spectrum in remote sensing imagery. An object based approach normally takes the homogeneous pixels obtained by image segmentation [13] as basic units and classifies these homogeneous pixels on the basis of the variability of spectral, shadow, geometric, and other characteristics [14]. Although this method exploits the spatial information of buildings and effectively avoids the phenomenon of salt and pepper noise, the method is applicable only to the extraction of buildings with small areas and simple types; it is rather difficult to extract buildings with large ranges and high complexity because of the vulnerability to human factors [5]. The conventional methods may seem to have difficulty meeting the requirements of high precision, high performance, and automatic building extraction.
Recently, with the rapid advancement of artificial intelligence technology such as deep learning (DL), significant progress has been made in the extraction of various ground objects using convolutional neural networks (CNNs) [6]. CNNs have the potentiality to automatically learn the correlation features among ground objects from the input remote sensing imagery, avoiding the influence of human factors in conventional methods. Therefore, CNNs are widely applied in some files of feasibility prediction, classification extraction, and the automatic identification of ground objects [15], such as automatic mapping of cone karst [16], landslide susceptibility mapping [17] and automatic road extraction [18]. CNNs, which consist of multiple interconnected layers, including convolution layers, pooling layers, and activation functions [19], obtain hierarchical features of buildings by automatically encoding remote sensing imagery with the merits of local perception and parameter sharing [20]. CNNs have emerged as a building extraction method with high accuracy, great performance, and excellent automation capability. Simultaneously, the large amount of high resolution remote sensing imagery data provides sufficient training samples [21]. The performance of CNN based approaches is promoted in the data driven model, which dramatically enhances the generalization of building extraction. Notably, some studies showed that adding attention modules to CNNs can help the network pay more attention to and perceive contextual information and global features [22,23,24,25].
U-Net [26], as representative of CNN based approaches, has powerful feature extraction capability and superior recognition performance in the field of medical image segmentation. However, it is still extremely challenging to directly use U-Net to extract buildings from high resolution remote sensing images due to the spectral discrepancy, background, and complex noise interference of different buildings. Possible issues are as follows: (1) The difficulty of model training. U-Net acquires robust local information using continuous convolution; nevertheless, deep stacked convolutions tend to hinder model training and cause the degradation of the model performance [27,28]. (2) The lack of capacity for low level features (obtained by the U-Net encoder) representation. Due to the variety and complexity of buildings, the low level features acquired by the encoder convey less spatial detail information about the building features with much redundant information. Previous studies have shown that low level features may fail to convey the spatial detail information of ground objects in the face of high complexity ground objects [29,30]. (3) The insufficient integration of global information. U-Net aggregates the feature information extracted by the convolution layer through four max pooling steps, which not only reduces the computational complexity but increases the receptive fields of the feature maps. However, the standard convolution operation could capture only local neighborhood information and not effectively perceive global semantic information, for feature maps with large receptive fields [31]. (4) The inadequate cross level aggregation. Although U-Net employs skip connections to enhance the utilization of low level features, this method, with a simple concatenation operation, ignores the influence of redundant information and the semantic gap between low and high level features, which in turn limits the building extraction performance [6,21,32].
To solve the issues mentioned, a building extraction network (B-FGC-Net) based on residual learning, aggregated spatial attention (SA) units, global feature information awareness (GFIA) modules, and cross level feature recalibration (CLFR) modules is proposed in this work. The residual learning and SA unit is introduced in the encoder, which accelerates the convergence rate of gradient descent and highlights the features of spatial detail information of the buildings. The GFIA module captures the contextual information and improves the global awareness capability. The CLFR module, thoroughly considering the semantic gap between low and high level features, completes the effective fusion of cross level feature information from the channel dimension, suppresses the redundant information of low level features, and improves the building extraction performance of the model. Compared with the conventional building extraction methods, the B-FGC-Net, integrating residual learning, SA, GFIA, and CLFR, outperforms the capacity of feature highlighting, global awareness, and cross level information fusion, achieving superior performance in the building extraction from high resolution remote sensing imagery.
2. Related Work
Since fully convolutional neural network (FCN) [33] was proposed, the end to end deep convolutional neural network (DCNN) has received great attention. To solve the problem that spatially detailed information is difficult to recover in image segmentation, the low level features are mapped gradually by skip connection [26,34,35,36] and decoded in the decoder part. The methods based on skip connection allow the direct utilization of detailed low level features to restore the spatial resolution without additional parameters. However, using too much and stacked convolution in the encoder while obtaining more effective and sufficient low level features poses a risk of hindering the convergence speed and decreasing the prediction performance of the model. On this basis, residual learning was introduced into the end to end DCNN to alleviate the degradation problem due to multiple convolutional layers [31,37,38]. This scheme not only speeds up the training of the model but also effectively facilitates the utilization of low level features [39].
The DCNN with residual learning obtains rich low level features (e.g., semantic information) but the semantic information is less strong with significant redundant information [29]. The simple convolution operator, with the characteristic of focusing only on local regions, in addition to the difficulty of obtaining the spatial location relationship of each feature point, may fail to effectively capture detail rich spatial location information in low level features [40]. Therefore, it is urgent to design a new scheme in the encoder to capture the spatial relationship of feature points and highlight the expression of building features at the spatial level. The self attention mechanism [41], for example, was applied in the encoder of the GCB-Net [30] and the NL-LinkNet [42], which filtered the interference of noisy information and constructed the long range dependencies among each pixel. Furthermore, due to the semantic gap between low and high level features in the end to end DCNN, a simple cross level fusion method, such as channel concatenation in U-Net [26] and pixel addition in LinkNet [37], may cause the model to ignore the usefulness of all features and limit the propagation of spatial information between the encoder and decoder. For instance, LANet proposed an attention embedding module to bridge the gap in spatial distribution between high and low level features [43].
The encoder part of the end to end DCNN generates a feature map with small spatial resolution and large receptive fields. Actually, the standard convolution is weak in global information awareness for this feature map. A possible way to remedy the issues is to apply multiparallel dilated convolution or other submodules, which could capture the multiscale contextual and global semantic information, and enlarge the receptive fields to improve global information awareness. For instance, the pyramid pooling module (PPM) of PSPNet [44] captures multiscale information; DeepLabV3+ [45] constructs the atrous spatial pyramid pooling (ASPP) module based on dilated convolution to obtain contextual information; D-LinkNet [31] designs a specific cascaded operation of the dilated convolution unit (DCU) according to the spatial resolution of feature maps, which effectively obtains a larger range of feature information; HsgNet [46] proposes the high order spatial information global perception module to adaptively aggregate the long range relationships of feature points. However, the above methods have low extraction accuracy, excessive memory consumption, or computational complexity, which make it difficult to promote their application.
3. Methodology
In this section, we will describe the proposed method in detail. Firstly, the overall architecture of the model is described. Then, the spatial attention units, global feature information awareness modules, and cross level feature recalibration modules, and loss functions are elaborated.
3.1. Model Overview
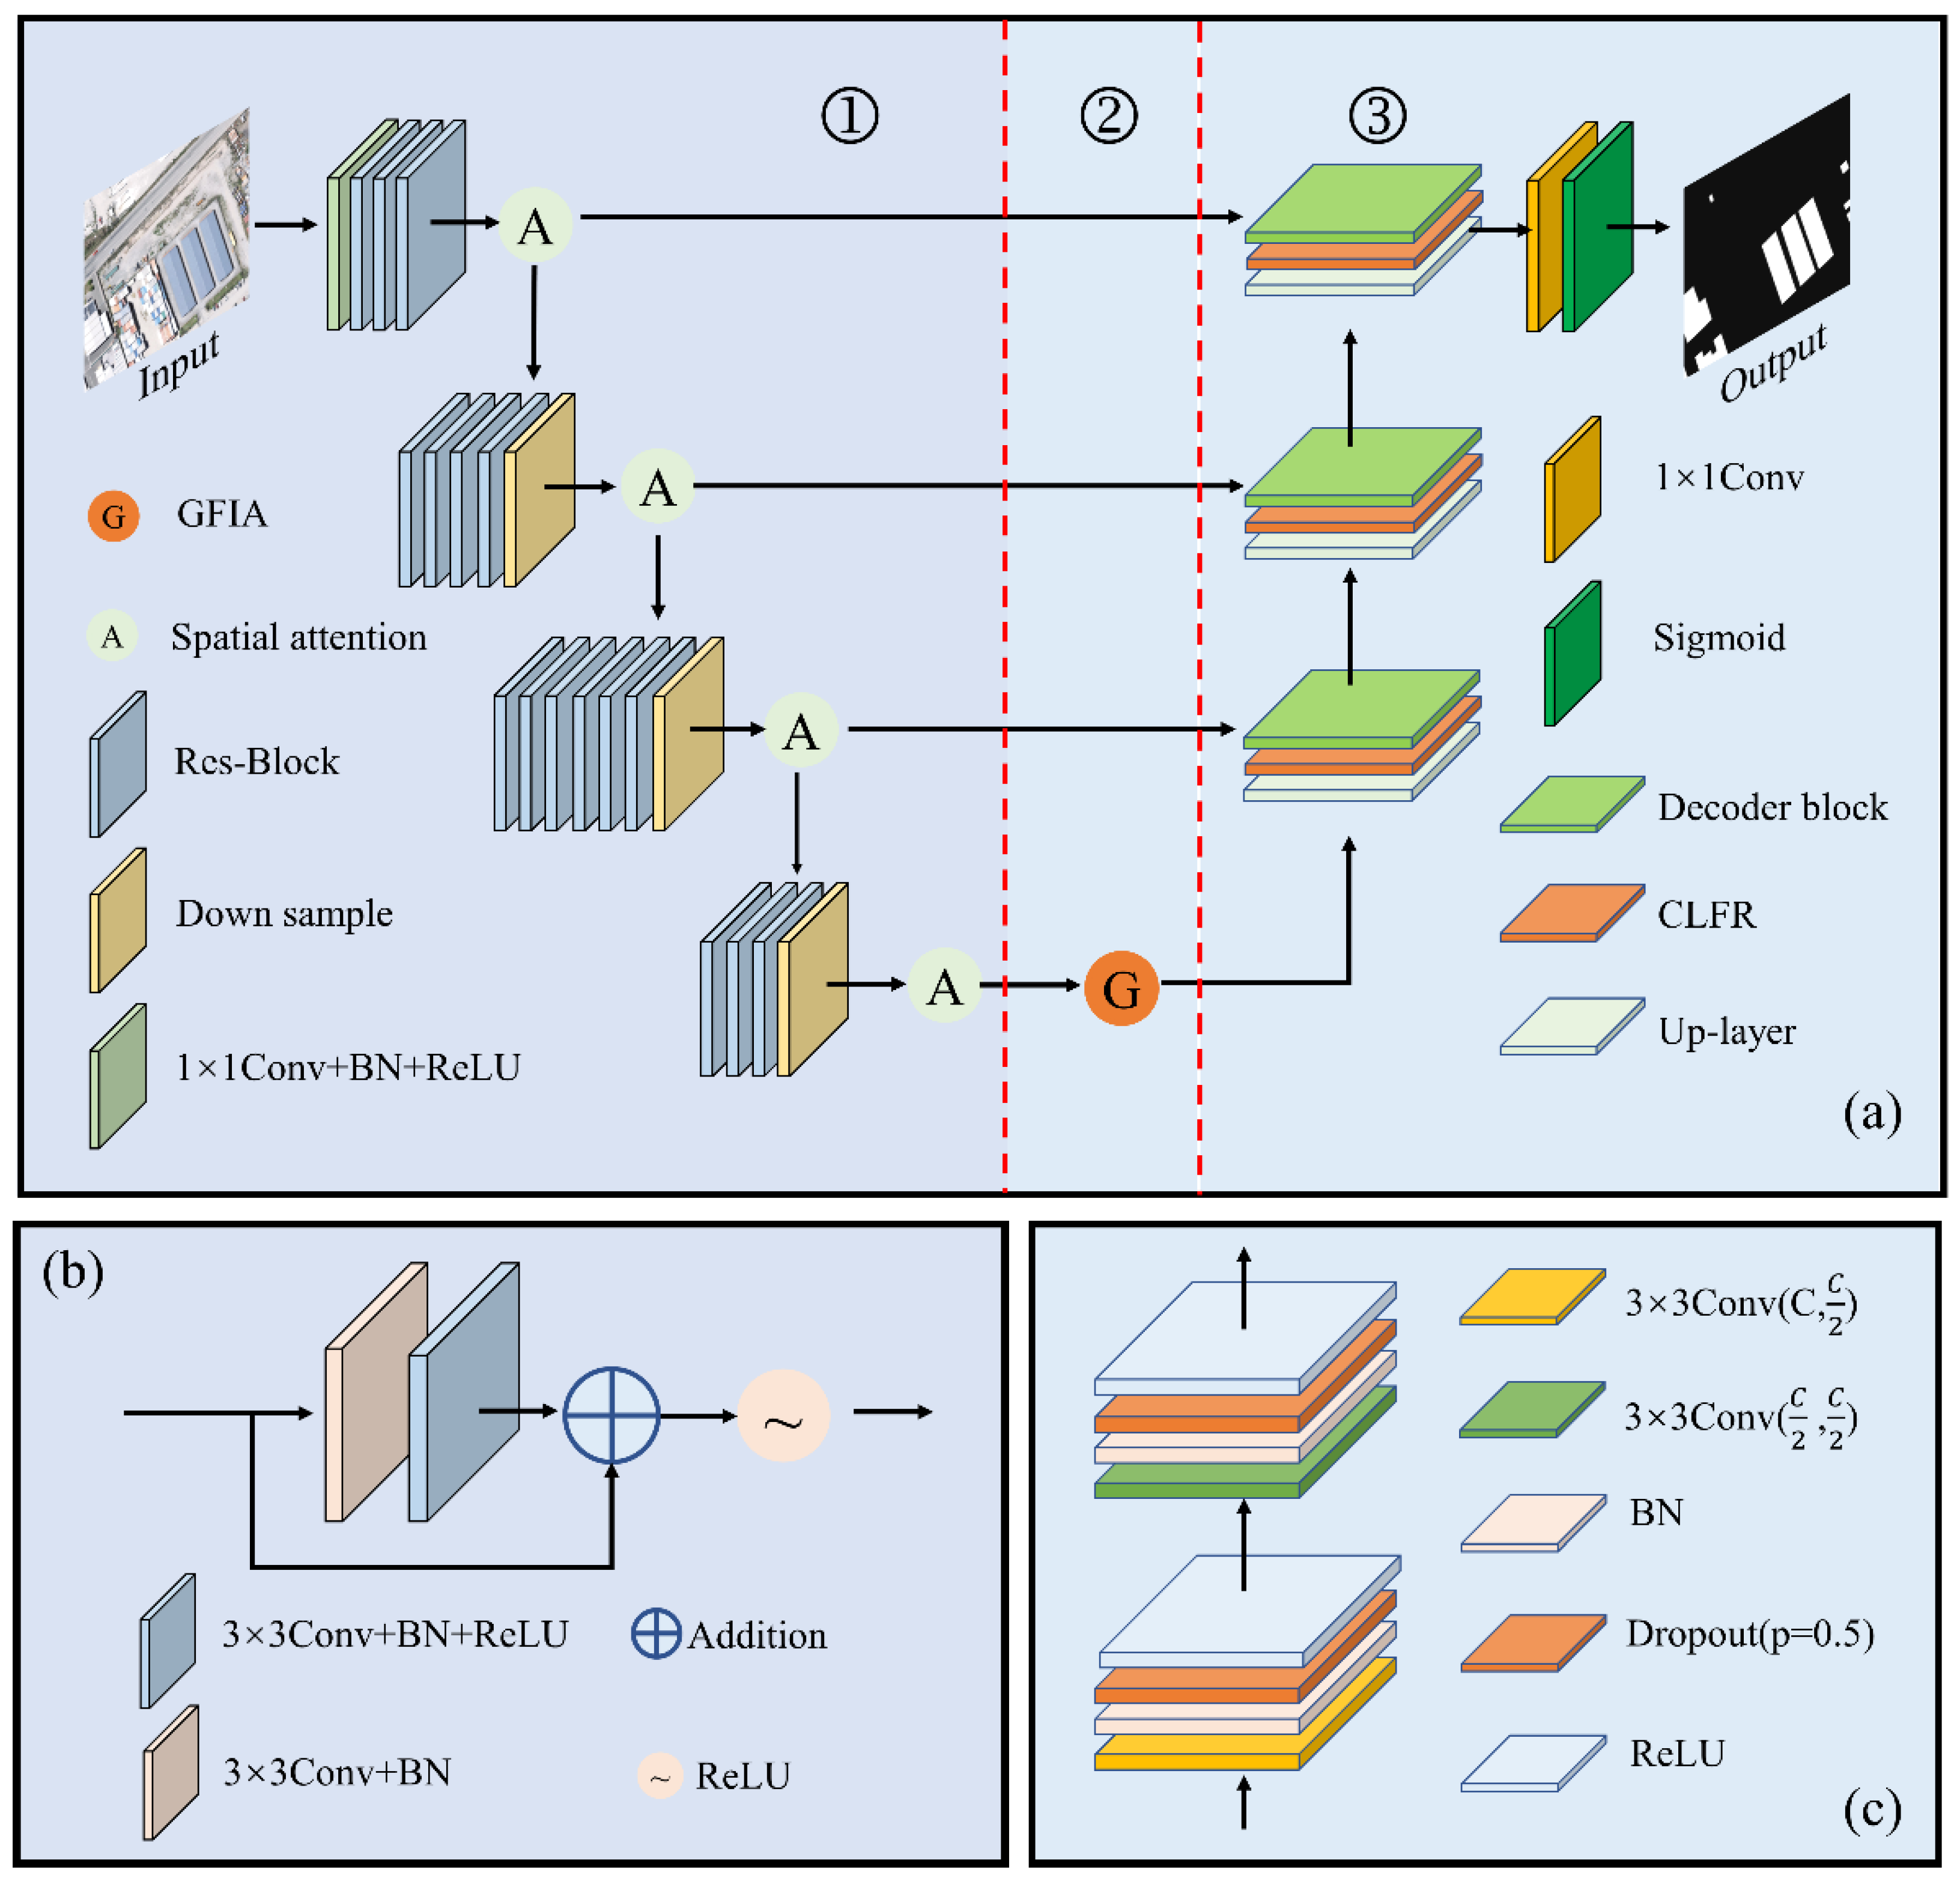
The B-FGC-Net, consisting of the encoder, GFIA module, and decoder, is a standard end to end DCNN model, as shown in Figure 1. First, the method takes remote sensing images of buildings as the input to the encoder, which uses the residual learning block (Res-Block) and SA unit to obtain the feature information of the buildings automatically. Continuously, GFIA modules aggregate the contextual information by the self attention unit and the dilated convolution. Finally, the decoder uses multiple effective decoder blocks and CLFR modules to restore feature maps to the final building segmentation maps.
The encoder takes ResNet-34 as the backbone network to extract low level features and removes the 7 × 7 convolution and max-pooling of the initial layer and the global average pooling and fully connected layer of the final layer. The input data is processed by four repeated groups of convolution layers, each of which contains multiple Res-Blocks (see Table 1) to generate different hierarchical low level features. At the end of each group of convolution layers, those low level features are delivered into the SA unit in four groups to further highlight potential information such as space, shape, and edge features of the building and to suppress backgrounds such as roads, trees, and farmland. A detailed description of the SA unit is provided in Section 3.2. Additionally, the stride of the convolution of downsampling is set to 2, achieving the goal of reducing the spatial resolution of feature maps by ¼ and doubling the number of channels. Although the receptive fields of feature maps are increased due to several downsampling operations, some rich spatial information is lost. It is rather difficult to recover the detailed and global semantic information by using only upsampling and standard convolution operations. In this work, we fuse the low level features generated in stages 1, 2 and 3 with high level features, expecting to recover the spatial information of feature maps. The GFIA module utilizes the low level features generated in stage 4 with the large receptive fields, which is helpful to obtain the semantic information of building features and improve the sensing ability of the global information. The encoder structure and the dimension variation of low level features are shown in Table 1.
The GFIA module perceives a larger range of feature maps to capture the effective contextual information of the buildings by dilated convolution. Meanwhile, the self attention mechanism focuses on the spatial relationship of each feature point. The combination of the above two methods enables the high level features to enter the decoder to complete the decoding operation. The decoder perceives the global information and restores the spatial detail information of the features. Section 3.3 presents the GFIA module.
Bilinear interpolation and 1 × 1 convolution were adopted to recover the resolution of feature maps in the decoder. To overcome the semantic gap between low and high level features, we use the CLFR module described in Section 3.4 to focus on the complementary relationship between them, to diminish the interference of noise information and to improve the utilization of useful low level feature information. Thereafter, the decoder block decodes the fused feature maps through two convolution operations to output the final building extraction result. To prevent overfitting, dropout [47] and batch normalization (BN) [48] are introduced after each convolution operation of the decoder block to simplify the decoding structure and improve the training speed, respectively.
3.2. Spatial Attention
For the natural properties of buildings and the complexity of the background, such as roofs of various colors and shape features, the standard convolution operation focuses on neighborhood pixels and may fail to accurately obtain the distribution of each pixel and explore the spatial relationships on the overall space. Based on this observation, our study proposed an SA unit inspired by the convolutional block attention module (CBAM) [49], as shown in Figure 2. The SA unit aims to explore the spatial distribution regularity of pixels, highlight the building feature expression, and suppress the interference of background.
The SA consists of three major components: pooling, convolution, and excitation. Through three key steps, the SA automatically learns the feature expressions in spatial dimensions and adaptively acquires the spatial weights of each feature.
(1) Pooling: the feature map is compressed in the channel dimension by the global average pooling and the global max pooling to optimize the spatial distribution information of each feature point. The pooling can be defined by Equation (1).
where represents the channel concatenate operation, and represent the global average pooling and global max pooling, respectively, and W and H are the width and height of the feature map, respectively.
(2) Convolution: 7 × 7 convolution and sigmoid activation function can autonomously learn the spatial distribution relationship of features and optimally assign weights to each feature point. The spatial attentional feature map is obtained by Equation (2).
where is a two-dimensional convolution operation, w denotes the convolution kernel parameters, and represents the sigmoid activation function.
(3) Excitation: the spatial attentional feature map highly expresses the spatial distribution of feature points. Then, it performs point multiplication with the input feature map x. In this manner, the model focuses on learning building features and highlighting the spatial information expression during the training. The calculation process is as follows:
where denotes the point multiplication. In summary, the SA successively completes the adaptive acquisition of spatial weights for each feature point by pooling, convolution and matrix dot product operations, which highlights the expression of building features in the spatial dimension and suppresses noise information interference.
3.3. Global Feature Information Awareness
To capture multiscale contextual information and aggregate global information, we proposed the GFIA module, as illustrated in Figure 3, consisting of a dilated convolution (DC) unit and a self attention (also called nonlocal) unit. As shown in (b), compared with the standard convolution operation, the DC perceives a larger range of feature information by expanding the interval of convolution kernels. The DC unit uses five convolutions with different dilation rates to efficiently integrate the neighborhood information of the building features, which is calculated as follows:
where denotes the output of the DC unit, is the index of the values of the dilation rate, is the ReLU activation function, is the parameters of the DC kernel and represents the output of the previous DC. Specifically, represents the input feature map of the GFIA module when . In this work, the dilation rate was set to , and the corresponding receptive fields of their convolutions were 3 × 3, 7 × 7, 11 × 11, 15 × 15, and 31 × 31, respectively. On the one hand, the DC with the continuous dilation rate avoids the omission extraction of feature information and effectively obtains multiscale contextual information. On the other hand, the convolution with a dilation rate of 8 can perceive a 31 × 31 feature area, which is basically able to cover the whole range of feature maps and complete the effective acquisition of global semantic information. In addition, depthwise separable convolution is introduced in the DC unit to reduce the complexity of the convolution operation. The nonlocal unit constructs three feature maps,, and , with global information to capture the long range dependence between each feature point. The calculation process of the nonlocal unit is shown as Equations (5) and (6).
where , and denote the parameters of the convolution kernel, and is the output of the nonlocal unit. As the model is continuously trained, the nonlocal unit automatically learns the correlation between arbitrary features and reweighs each feature to promote the concern of the model for the global information of the features.
3.4. Cross Level Feature Recalibration
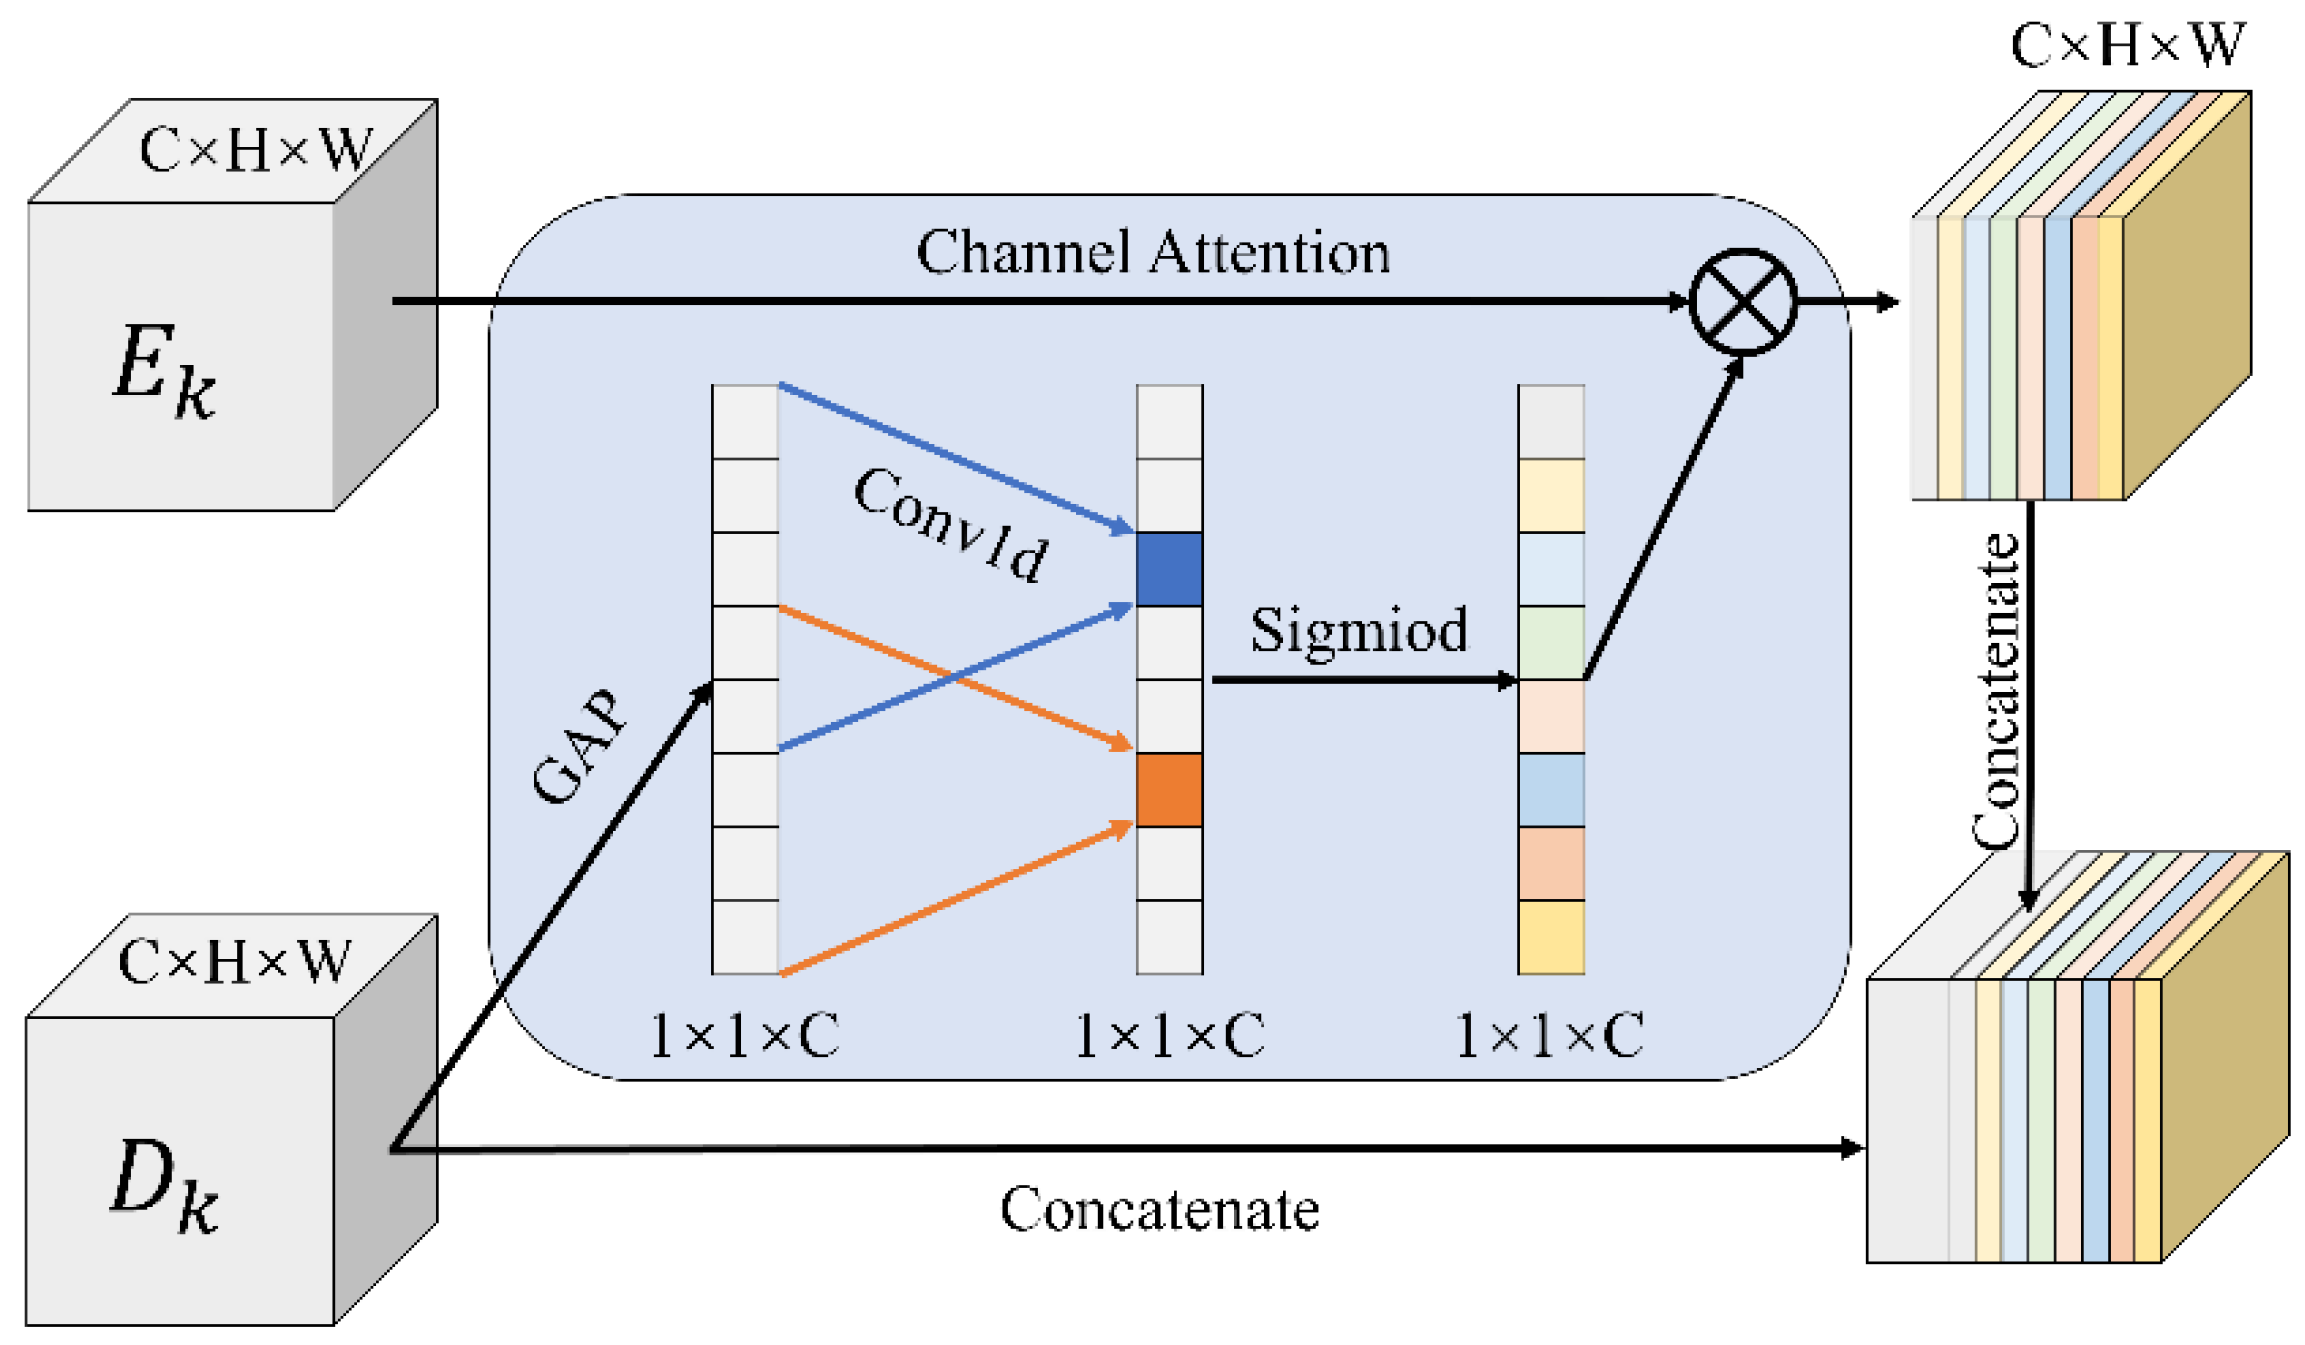
The direct feature fusion of low and high level features in the form of concatenated channels or pixel addition may cause the model to fail to learn effective complementary information among cross level features, and even inherent noise, as well as redundant information, which could affect the extraction performance of the model. Therefore, we were inspired by efficient channel attention (ECA) [50] and designed the CLFR module, as shown in Figure 4, to fuse low and high level features, which not only removes a large amount of redundant information but also eliminates the semantic gap between the pieces of redundant information.
The CLFR module first compresses the high level features in spatial dimensions by global average pooling to generate one-dimensional vectors and obtains the global semantic information of the channel dimension. Thereafter, a one-dimensional convolution is applied to obtain the weight parameters of feature points automatically. Then, the sigmoid activation function is used to highlight the correlation between the weights. In this manner, the building features in low level feature are highlighted, and the semantic gap between and is eliminated. Finally, the fused feature map is fed into the decoder block for the decoding operation. The CLFR module is defined by Equations (7) and (8).
in which denotes the low level feature after channel recalibration, is the parameter of the one-dimensional convolution, and [·] is the channel concatenate operation. The CLFR module adaptively acquires the channel weight parameters of the high level feature and eliminates the large amount of redundant information in the channel dimension of the low level feature by a dot product operation. Meanwhile, it also re-evaluates the degree of the contribution of each feature point, which makes the model learn the complementary information between and and overcome the semantic gap between them to maximize the effective information utilization of cross level features.
3.5. Loss Function
The binary cross entropy (BCE) loss, the boundary error (BE) loss [21], and the auxiliary loss were utilized to train the model, as shown in Figure 5.
BCE loss: given a couple of labels, , and prediction results, , the loss, among them is calculated by Equation (9).
BE loss: while the BCE loss enables the model to focus on the correct classification of each pixel in the prediction results, there are still challenges in building boundary refinement. Thus, we use the BE loss to force the model to pay more attention to the boundary information of buildings. The boundary loss is defined by Equation (10).
where and denote the label and the prediction result after processing by the Laplacian operator, respectively, and P and N denote the number of positive and negative pixels in the label, respectively.
Auxiliary loss: To facilitate model training, the output of ResNet34 in stage 3 is upsampled to the same size as the label, and then the auxiliary loss, , between the label and prediction result is calculated by the BCE loss.
Thus, the final total loss of our network is:
in which and .
4. Experiments and Results
4.1. Datasets
In this work, the WHU building dataset and the INRIA aerial image labeling dataset were used to train and evaluate our proposed method.
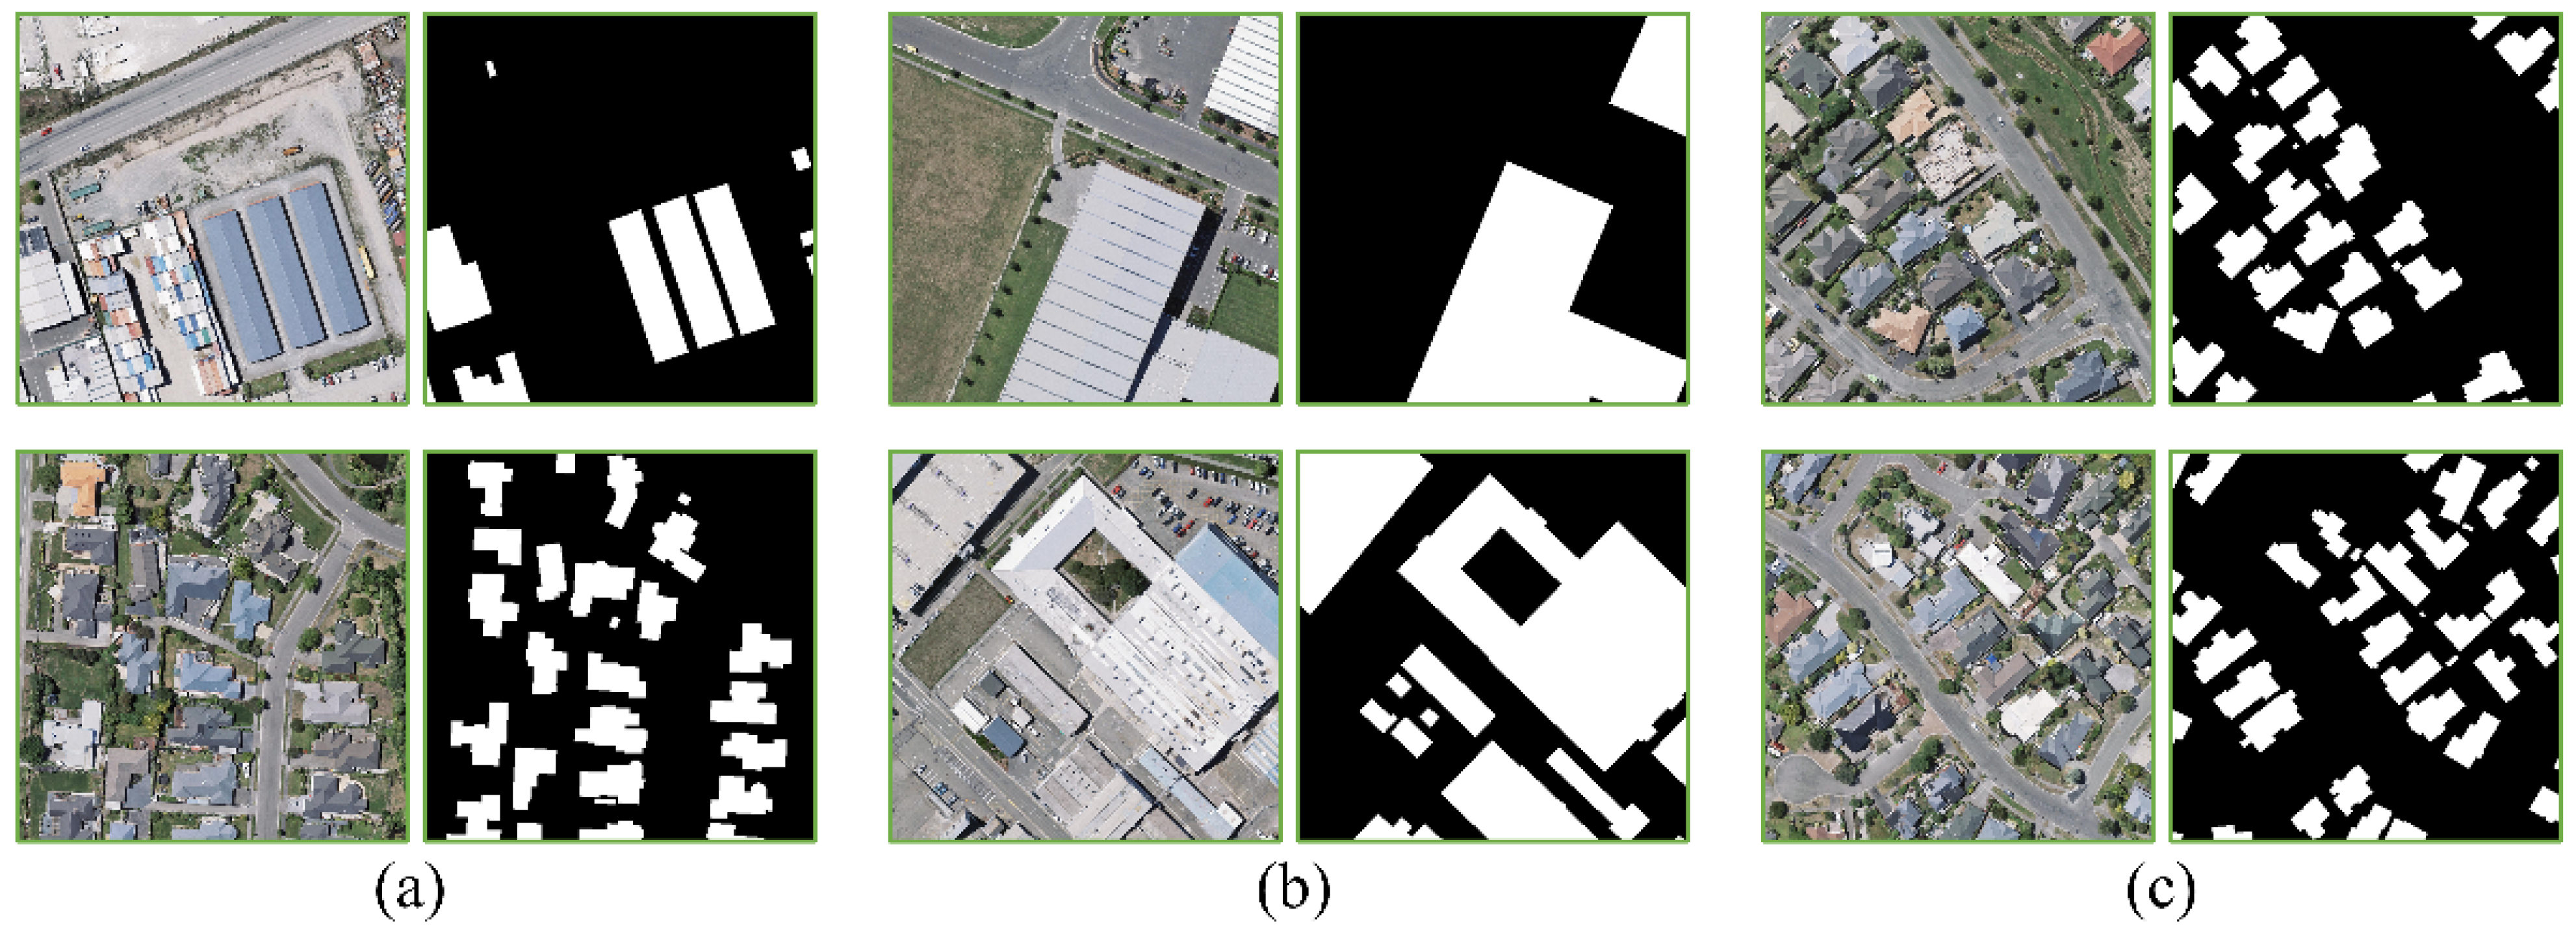
The WHU building dataset, open source shared by Ji et al. [51], has become a very popular dataset in the field of remote sensing building extraction due to its wide coverage, high spatial resolution, and volume of data. This dataset covers 450 km2 in Christchurch, New Zealand, with a spatial resolution of 7.5 cm and contains about 22,000 independent buildings with high image quality. The WHU building dataset consists of 4736, 1036 and 2416 images for training, validation and testing, respectively. Considering the limitation of computer graphics memory, we resized the original images and the ground truth from 512 × 512 pixels to 256 × 256 pixels. Figure 6 shows the processed training set, validation set, and test set data.
The INRIA aerial image labeling dataset [52] provides 360 remote sensing images with a size of 5000 × 5000 pixels and a spatial resolution of 0.3 m. The dataset contains various building types, such as dense residential areas in ten cities around the world. This dataset only provides ground truth in the training set but not in the testing set. Therefore, we selected the first five images of five cities in the training set for the testing set according to suggestions by the data organizers and [3]. Due to the large size of images and the limitation of the computer GPU memory, we cropped them into 500 × 500 pixels and resized them to 256 × 256 pixels to meet the input dimension requirements of the model. The original INRIA images and the preprocessed images are shown in Figure 7.
4.2. Experimental Settings
As shown in Table 2, the proposed B-FGC-Net was implemented based on Python-3.7 and PyTorch-1.7 in the CentOS 7 environment. We adopted an Adam optimizer [53] with an initial learning rate of 0.0001, which decayed at a rate of 0.85 after every five epochs. Additionally, we accelerated the training with two NVIDIA RTX 2080Ti GPUs. To avoid the risk of overfitting, data augmentation approaches were used during training, including random horizontal–vertical flipping and random rotation.
4.3. Evaluation Metrics
4.4. Result
4.4.1. Experiment Using the WHU Building Dataset
Figure 8 shows several extraction results of B-FGC-Net on the WHU building dataset. We randomly selected six typical images for testing, including both small scale buildings and large scale buildings, to verify the extraction performance of the proposed method. For the small scale buildings displayed in Columns 1 to 3 in Figure 7, the B-FGC-Net with SA introduced can accurately locate the spatial position of buildings and effectively identify the background as nonbuildings. Additionally, for the large scale buildings displayed in Columns 4 to 6 in Figure 7, B-FGC-Net with GFIA can extract the buildings quite completely and avoid building omission as much as possible. Comprehensively observing the labels and extraction results, although there are very few cases of building omission and error extraction, the B-FGC-Net proposed in this work can effectively and accurately extract most of the building information in both cases and shows superior building extraction performance.
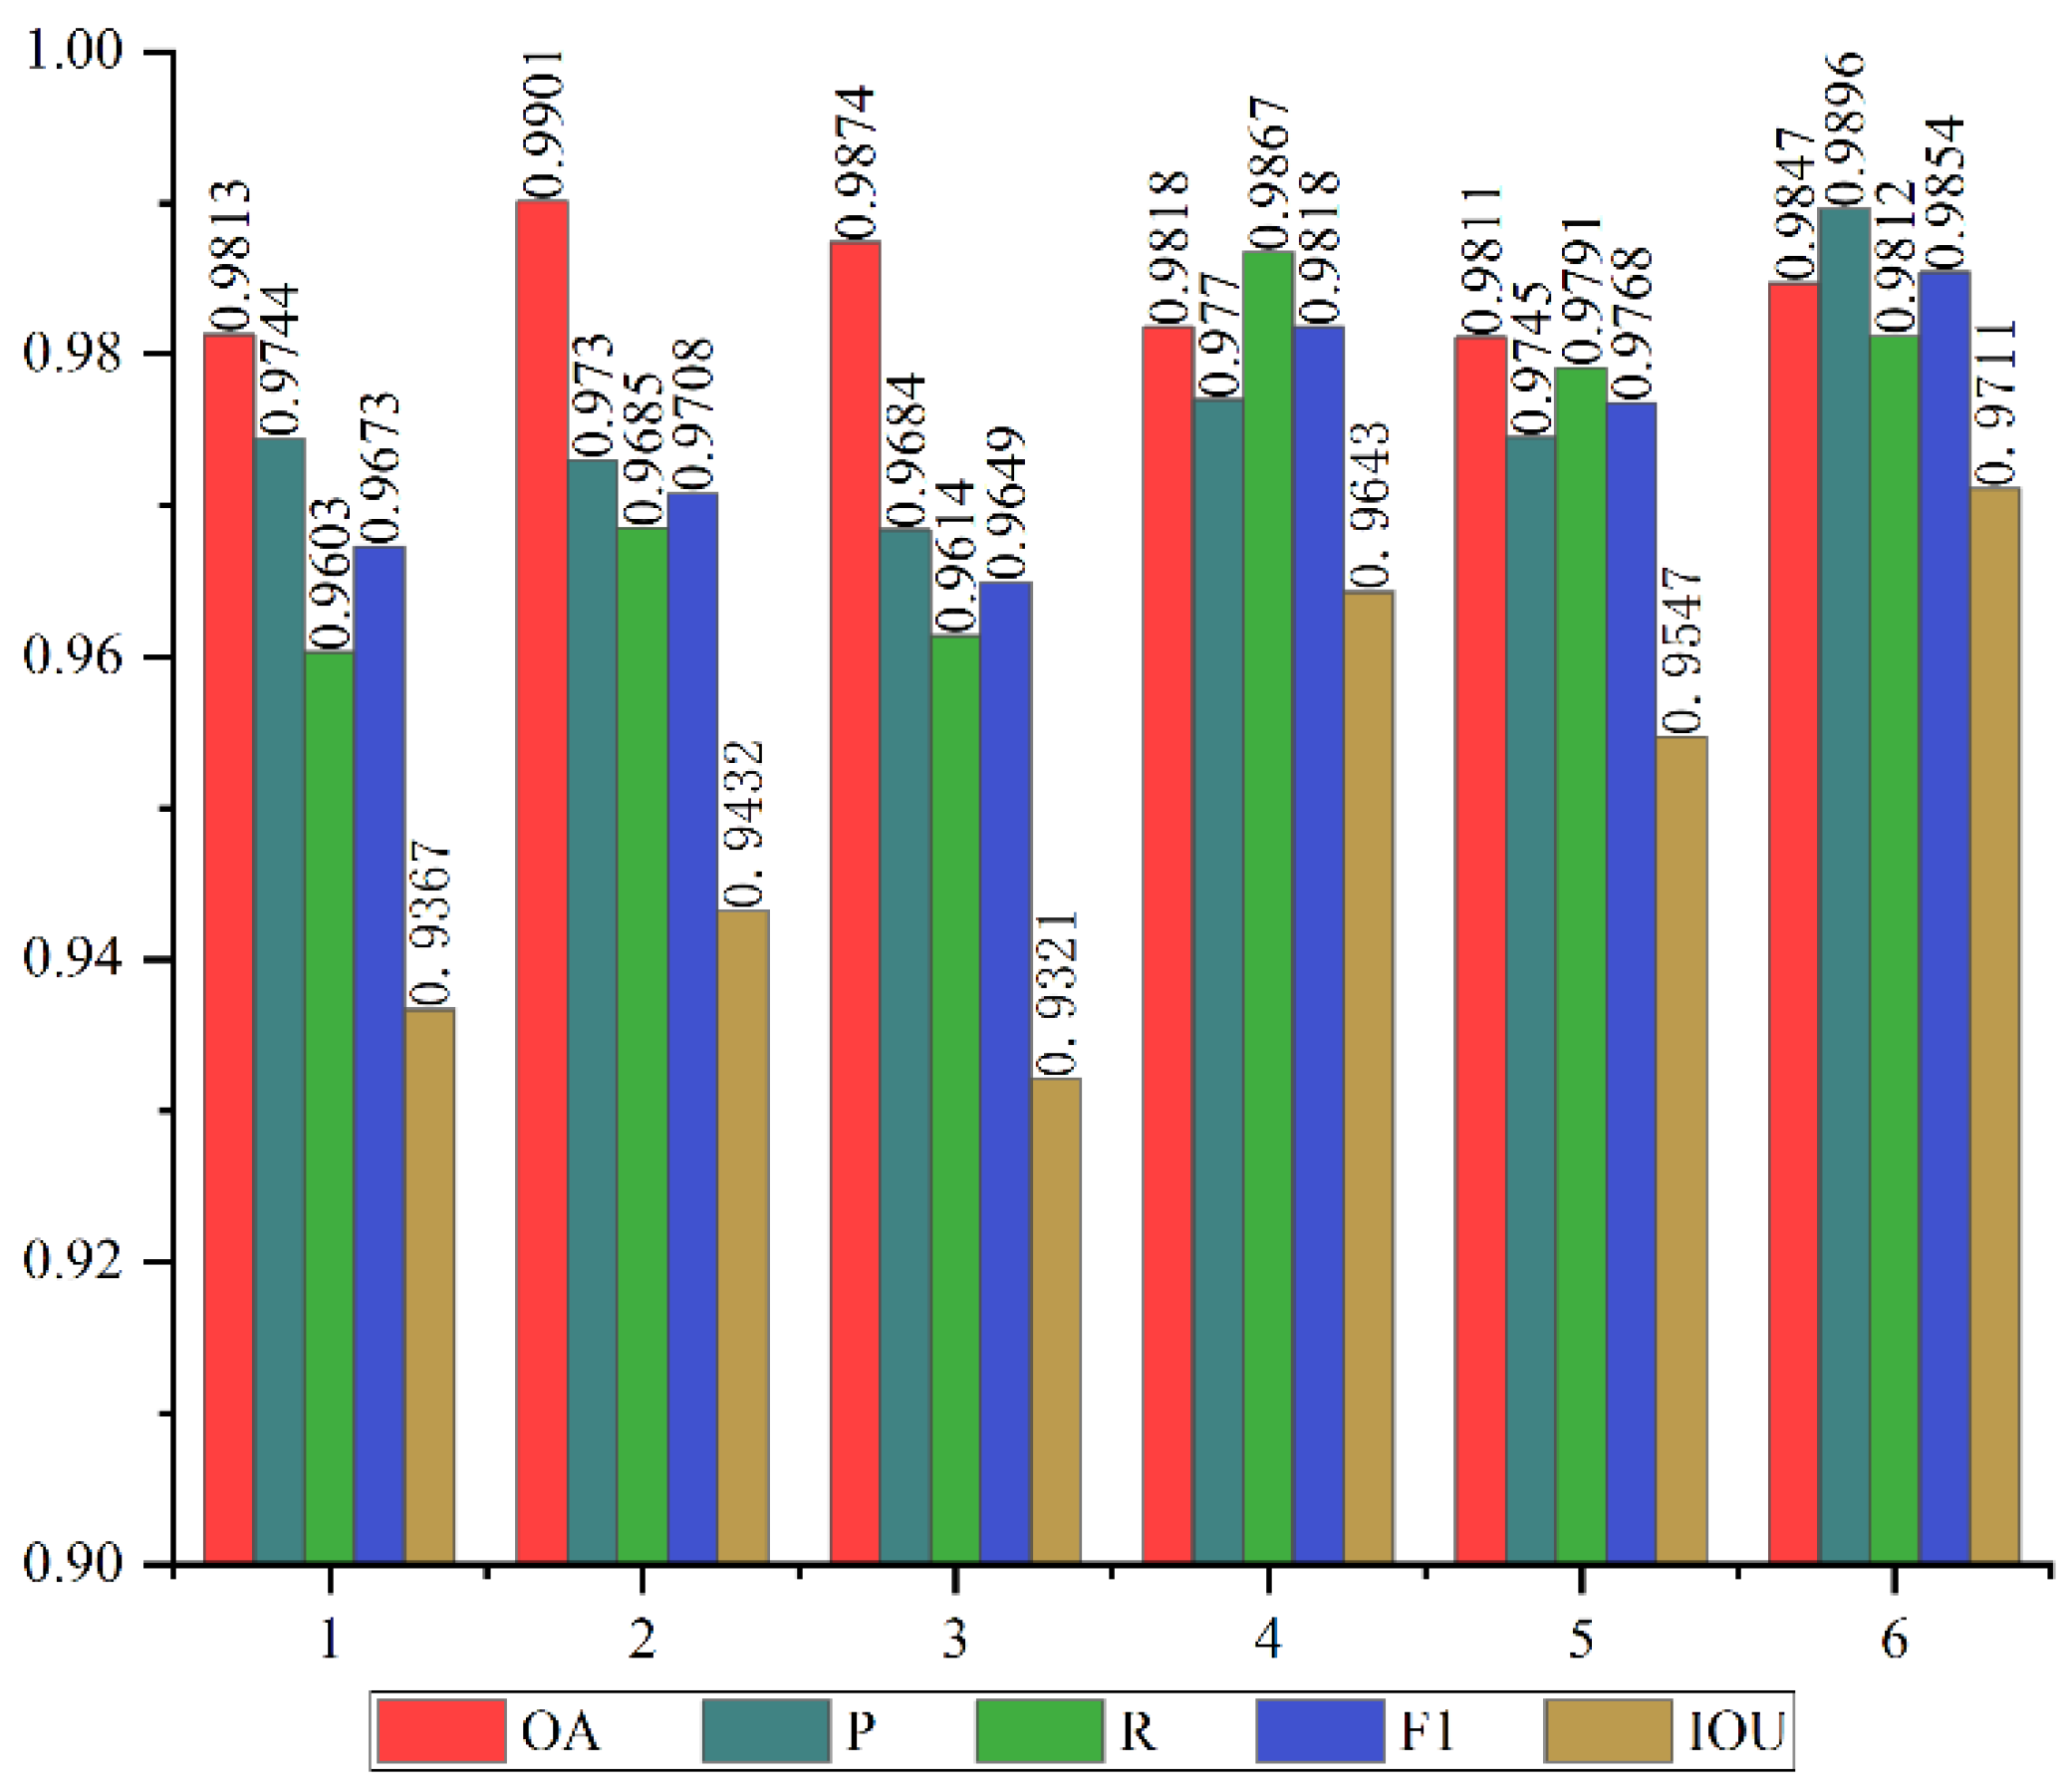
Figure 9 quantitatively evaluates the building extraction results of B-FGC-Net in Figure 8. According to Figure 9, the OA of B-FGC-Net is above 98.1% in both cases, indicating that B-FGC-Net can correctly distinguish between buildings and background. Extracting small scale buildings is still challenging because of their few building pixels. Nevertheless, the method proposed in this work achieves remarkable performance, with an F1 score above 96.7% and an IOU score above 93.6%. In addition, the F1 score and IOU of 97.6% and 95.4%, respectively, further demonstrate the high accuracy of the method for large scale building extraction. In short, B-FGC-Net possesses high accuracy for both small scale and large scale building extraction.
4.4.2. Experiment Using the INRIA Aerial Image Labeling Dataset
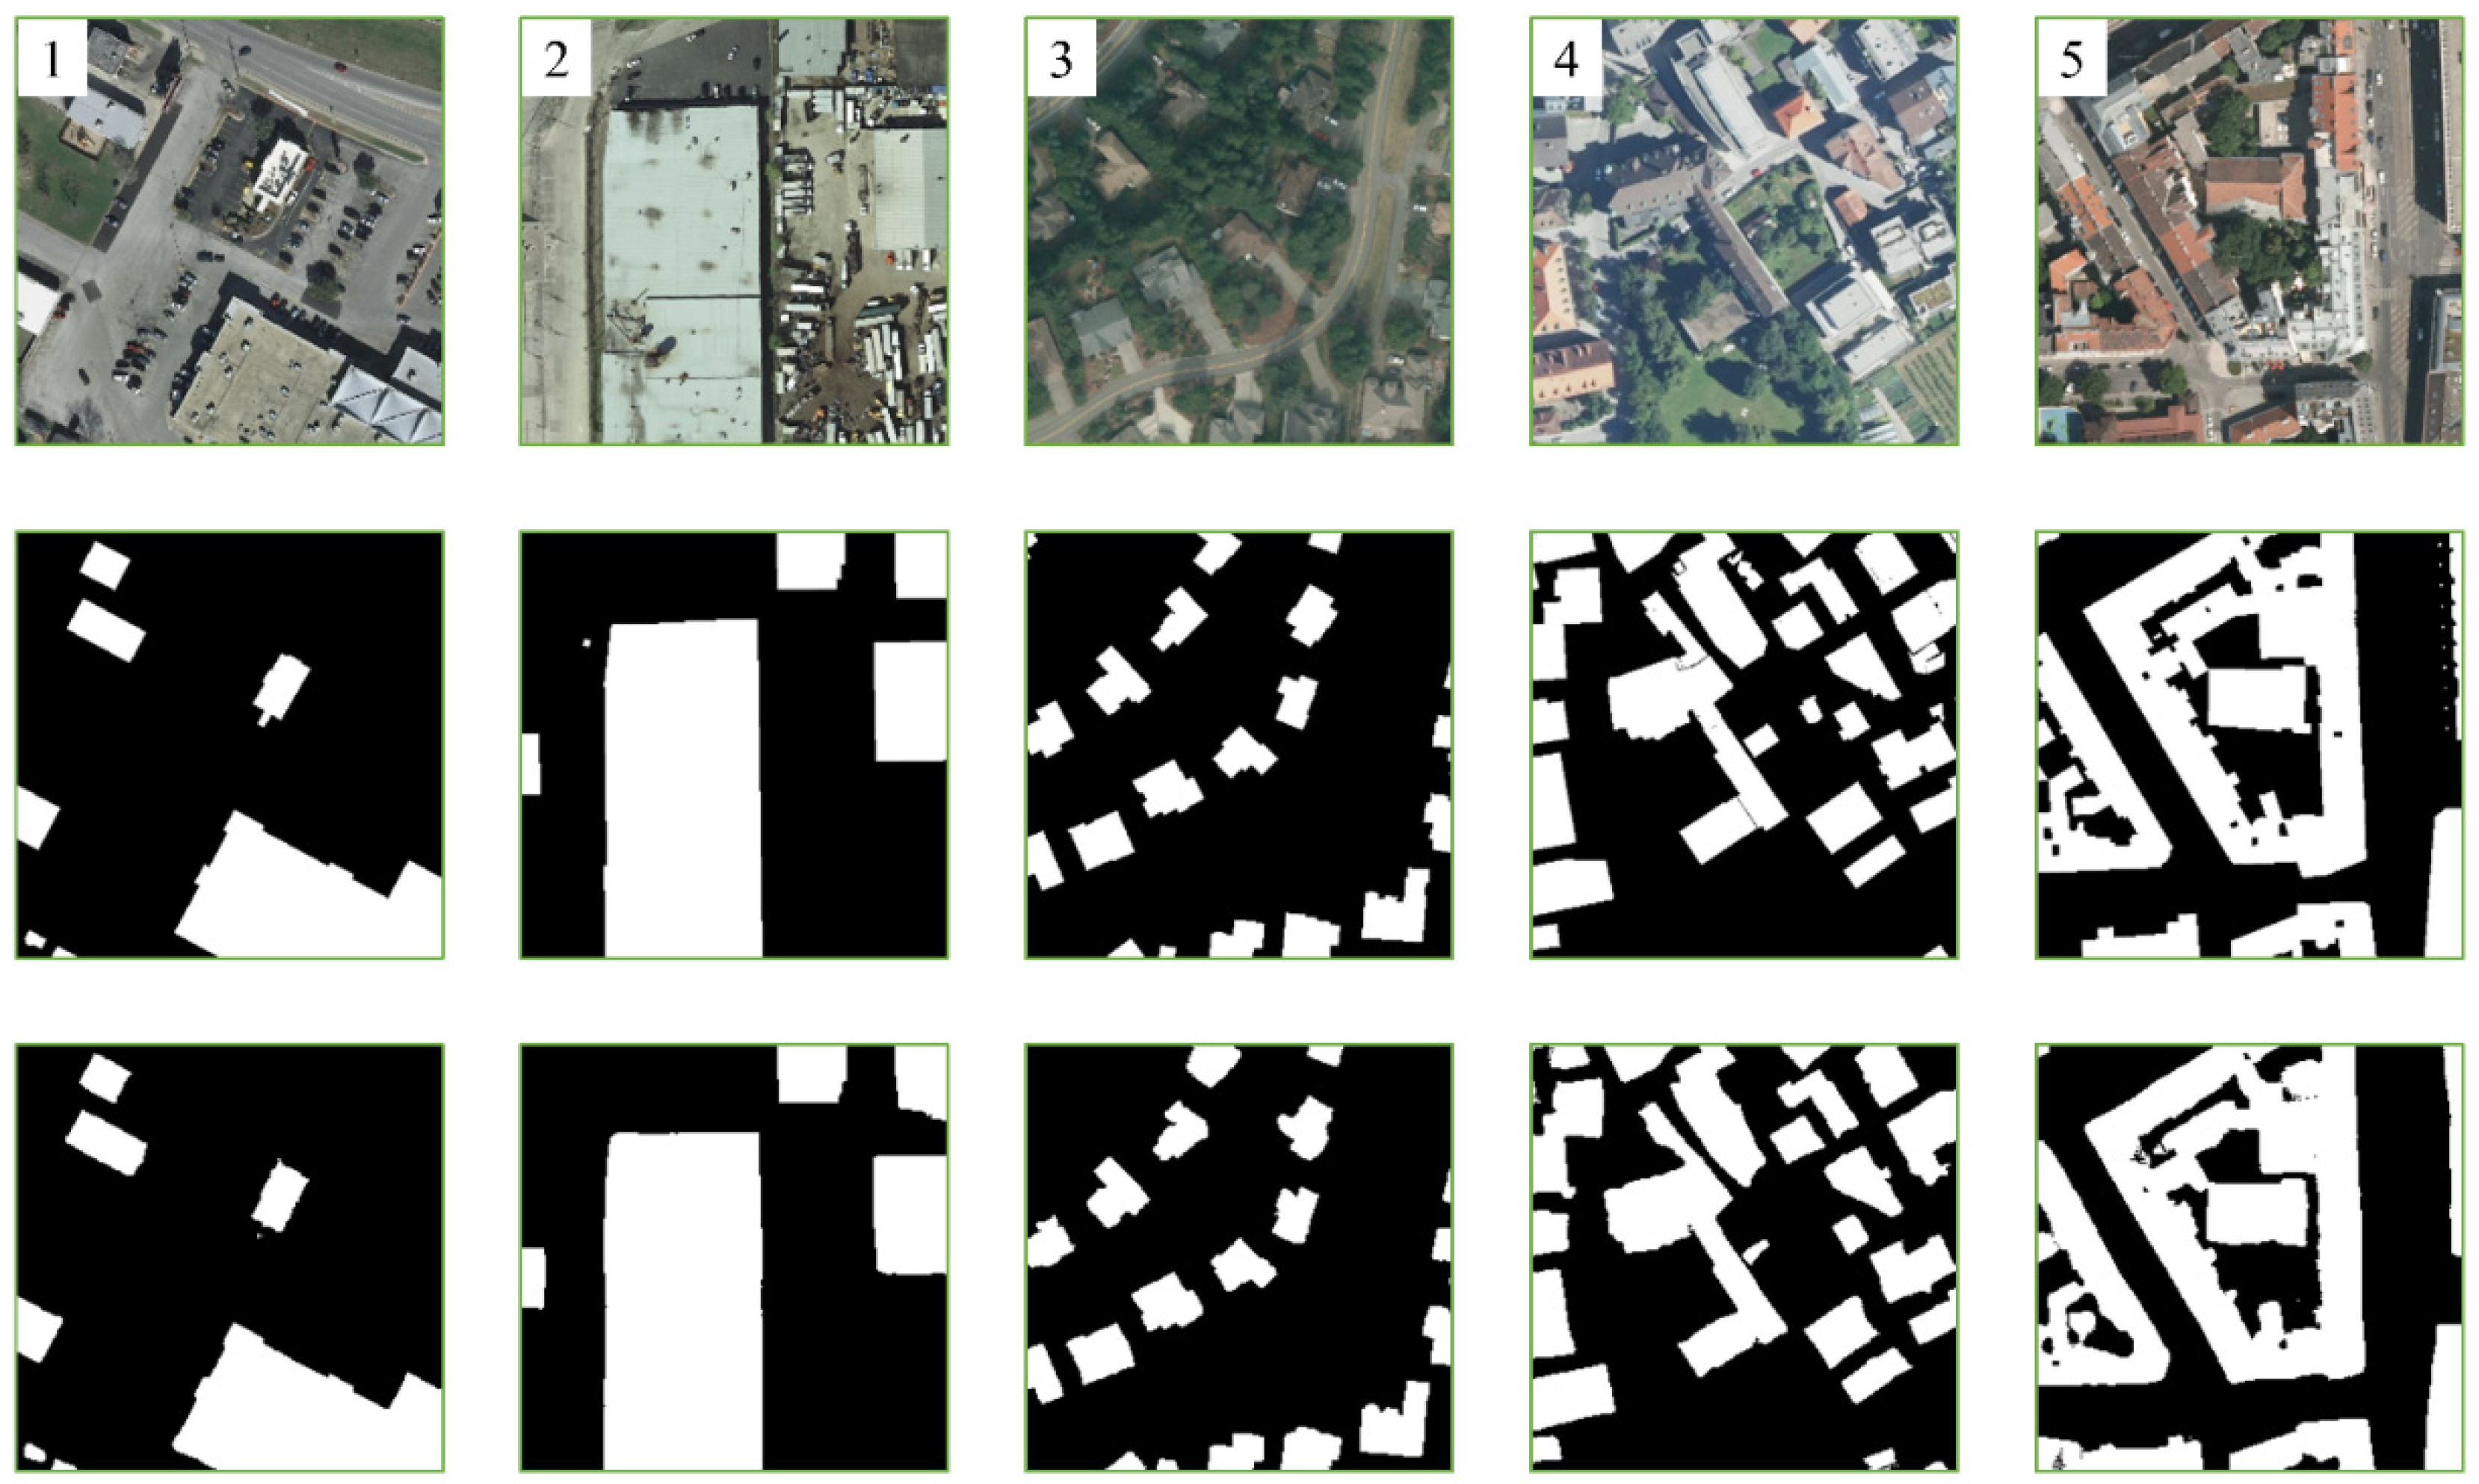
The building extraction results of randomly selected images from the INRIA aerial image labeling dataset are shown in Figure 10. From the results of Columns 1–3, B-FGC-Net is seen to show excellent recognition performance for small scale buildings and can accurately detect spatial location information. Similar results are observed in Figure 10 for large scale buildings, in which the proposed method can extract most of the buildings completely and avoid the phenomenon of missing extraction or incorrect extraction. In the extraction results of Column 4, B-FGC-Net exhibits excellent building extraction capability and avoids interference from noise information such as building shadows and trees. Particularly, in the case of complex urban building scenes (see Column 5), the B-FGC-Net model accurately extracts the vast majority of building information by fusing multiscale feature information.
Figure 11 presents the accuracy evaluation results of B-FGC-Net for five cities on the INRIA aerial image labeling. As shown in Figure 11, the OA score of B-FGC-Net exceeds 94% in all five cities, which indicates that the method proposed in this work can correctly distinguish between buildings and background. Since there are nonbuilding pixels of 97.89% and fewer building pixels of 2.11% in Kitsap County, this extreme imbalance among positive and negative sample numbers results in an OA of 99.19%, but is imprecise. In contrast, the F1 score of 80.44% and IOU of 67.28% in Kitsap County indicate that the method still achieves excellent extraction accuracy in this case. Observing the F1 score (90.5%) and IOU (82.65%) of Vienna thoroughly shows that the method performs well for buildings with high complexity. In sum, B-FGC-Net scored over 80.4% F1 on the five cities, with high extraction accuracy on small scale, large scale, and high complexity buildings.
5. Discussion
5.1. Comparison of Different Classical Methods
To further examine the performance and accuracy of the proposed method, we used several different classical methods for semantic segmentation to compare and analyze, such as U-Net, LinkNet, SegNet, and DeepLabV3. These methods were trained at the same learning rate and optimized on two public building datasets. We also comprehensively analyzed the extraction accuracy of each method, and the experimental results were as follows.
5.1.1. On the WHU Building Dataset
Figure 12 exhibits the building extraction results of different methods on the WHU building dataset, including U-Net, Res-UNet, LinkNet, LinkNet*, and B-FGC-Net, where the encoder of Res-UNet is ResNet18 and LinkNet* removes the initial convolutional layer and max pooling in LinkNet.
As displayed in Figure 12, B-FGC-Net obtains superior visual results for building extraction compared with classical building extraction methods. Although UNet, Res-UNet, LinkNet, and LinkNet* can reasonably extract some building information, there is still a considerable number of results about building incorrect extraction and background error recognition. U-Net ignores the interference of building shadows in the fifth row in Figure 11 (see the blue rectangular box) and identifies the majority of building pixels. However, U-Net has a poor performance in locating small scale buildings and integrating large scale buildings, as shown in the red rectangular box in Figure 11. The extraction result of Res-UNet in the fourth row seems to be slightly better than the extraction result of UNet, but the majority of the buildings are misclassified as background, reflecting the poor extraction performance of Res-UNet. LinkNet, as a lightweight image segmentation network, greatly reduces the training time by reducing the image spatial resolution in the initial layer. From the extraction results, LinkNet identifies several building pixels in the fourth row, but too many holes occur. Therefore, we removed the LinkNet initial layer 7 × 7 convolution and max-pooling, called LinkNet*, to verify whether the excessive downsampling causes poor extraction performance and to reflect the rationality of the initial layer design of the B-FGC-Net. As displayed in Figure 12g, LinkNet* shows better integration ability for large scale buildings than the previous three methods but poorer capability for identifying small scale buildings and overcoming building shadows.
B-FGC-Net, with the merit of the SA, GFIA, and CLFR modules, effectively overcomes the interference of building shadows and performs favorably in extracting small scale and large scale buildings. From the yellow box, we find that the proposed method, with the support of SA, distinguishes the background and buildings properly and recognizes small scale buildings easily. Furthermore, almost all large scale building pixels are correctly and completely detected by B-FGC-Net, mainly because the CLFR module enhances the ability of global perception. Especially in the extraction results of the fourth row, compared with [4], B-FGC-Net extracts most of the buildings more completely. In the blue box, the proposed method can handle the interference of building shadows better, which makes the extraction results precise.
Table 3 quantifies the building extraction accuracy of several methods in the WHU building dataset. In contrast to other methods, B-FGC-Net achieved excellent accuracy in all evaluation metrics. In terms of OA score, the proposed method obtains 98.90%, which performs favorably against other methods and acquires the optimum extraction accuracy in distinguishing building and background. Compared with U-Net, the F1 score and IOU of B-FGC-Net were improved by 1.7% and 3.02%, respectively, indicating that the SA, GFIA, and CLFR can effectively improve the model precision. In particular, the result of the second best method (i.e., LinkNet*) proves that excessive downsampling can decrease the precision of the DL model and reflects the reasonableness of the B-FGC-Net design. Compared with LinkNet*, B-FGC-Net exhibited the best extraction performance on the test set with an increase in F1 score and IOU of 0.82% and 1.47%, respectively. Compared with recent work such as PISANet [56] and Chen’s method [4], the evaluation results of this method are still optimal.
5.1.2. On the INRIA Aerial Image Labeling Dataset
Figure 13 exhibits the extraction results of B-FGC-Net and five other methods on the INRIA aerial image labeling dataset. From the results, we find that UNet, Res-UNet, LinkNet, SegNet, and DeepLabV3 identify most of the background, such as trees and roads, but suffer from error extraction and missing extraction compared with B-FGC-Net. Building extraction presents a great difficulty and challenge for classical methods due to the similar spectral features between buildings and backgrounds in the red rectangular box of Rows 1–3. Conversely, the proposed method extracts large scale buildings more completely and overcomes the interference of similar spectral features excellently. The extraction results of the classical methods can be seen in the red rectangular boxes in Row 4–5 of Figure 13, which are still unsatisfactory in terms of small and large scale buildings and serious building error extraction phenomena remain. However, B-FGC-Net almost perfectly eliminates the “sticking phenomenon” of small scale building extraction results by highlighting the building features in spatial and channel dimensions through the SA unit and the CLFR module. In other challenging building scenes, such as building shadows (the sixth row of Figure 13), tree shading (the seventh row of Figure 13) and complex urban architecture (the eighth row of Figure 13), the other five classical methods all present the disadvantages of incomplete extraction results and inaccurate location of the outer boundary of the building. Fortunately, B-FGC-Net achieved satisfactory visual performance through the SA unit, the GFLA module, and the CLFR module, to suppress the representation of noise information, to integrate multiscale contextual information, and to complete the effective fusion of cross level information.
The accurate results on the INRIA aerial image labeling dataset are shown in Table 4. We clearly found that the OA, F1 score, and IOU of all methods were above 95%, 83%, and 71%, respectively, further demonstrating the good performance of the end to end DCNN in the field of building extraction. Compared with other methods, the proposed method achieves the best performance in all metrics and obtains the highest OA, F1, and IOU, of 96.7%, 88.46%, and 79.31%, respectively. Furthermore, the IOU and F1 score of LinkNet* was increased by 5.65% and 3.67%, respectively, on this dataset compared to LinkNet, again showing that excessive downsampling in the initial layer may affect the extraction accuracy of the model and reflecting the rationality of removing downsampling in the initial layer in the proposed method. The F1 score and IOU of B-FGC-Net improved by 0.58% and 0.93%, respectively, over LinkNet*. In detail, when compared with U-Net, B-FGC-Net achieves a large increase in IOU and F1 scores, of 3.51% and 2.22%, indicating that the attention mechanism and dilated convolution are effective. As described in Section 4.4.2, the excessive sample imbalance makes the OA of AMUNet [32] slightly better than our method, but it is not accurate. In terms of IOU score, B-FGC-Net is 2.35% and 2.11% higher than AMUNet and He’s model [3], respectively. These improvements demonstrate that the B-FGC-Net is robust enough to handle sample imbalances and complex buildings.
According to the visual results and the accuracy analysis above, we can conclude that B-FGC-Net highlights building features in the spatial dimension, aggregates multiscale contextual information and global semantic information, and effectively removes redundant information through SA, GFIA, and CLFR. Thus, B-FGC-Net achieved better visual extraction results in two datasets, especially in small scale, large scale, and complicated buildings, and overcame the noise information interference from building shadows and tree occlusions.
5.2. Effectiveness Comparison of Different Levels of Spatial Attention
To represent the effectiveness of different levels of spatial attention, we explored the mechanism and effects of spatial attention through contribution experiments and feature visualization operations on the WHU building dataset.
The evaluation results of different levels of SA units on the WHU Building Dataset are listed in Table 5. Compared with the No. 1 model, the No. 5 model (i.e., B-FGC-Net) achieved the best performance, with IOU and F1 score improving by 0.64% and 0.34%, respectively, indicating that the SA can increase the classification accuracy of the model. Comparing models No. 1–5 with each other, their IOU variations are 0.32%, 0.03%, 0.07% and 0.32%, respectively, demonstrating that the SA unit in layers 4 and 1 brings the most significant improvement but the importance of spatial attention in layers 2–3 cannot be neglected because Experiments 1–5 were performed gradually as the SA was added at different levels. As the SA unit is added gradually to the encoder, the F1 score and IOU gradually increase, further indicating that SA can highlight the relevant features of buildings in the spatial dimension and ignore the interference of other information.
Figure 14 displays the feature visualization comparison of the B-FGC-Net model, where different brightnesses indicate different levels of attention to building features by the model. According to Figure 14, after adding the SA unit, the feature maps all appear to have different degrees of variation in brightness. The brightness of the building area is significantly increased after adding the SA unit, as shown in Figure 14b,c, suggesting that the SA unit in the first layer effectively ameliorates the overseeking of building boundary information, forcing the model to focus on building features and ignore other backgrounds. Especially in the fourth row of visualization results, the SA highlights the representation of building features in the spatial dimension, more importantly, attenuates the brightness of building shadows, and effectively suppresses the interference of background. With the addition of the SA unit, the spatial semantic information of building features is gradually abstracted. However, the SA unit can easily be seen to increase the brightness contrast between buildings and nonbuildings, and make B-FGC-Net concentrate on learning building features. From the feature maps in Columns (h)–(j), we find that the features in the fourth layer are the most abstract, and the SA identifies buildings as red color, which enhances the ability of the B-FGC-Net to perceive the spatial information of the building features.
5.3. Comparison of Different Global Feature Information Awareness Schemes
To verify the performance of the proposed GFIA module, we compared it with several well verified global feature information awareness schemes, i.e., the PPM in PSPNet, the ASPP in DeepLabV3+, and the DCU in D-LinkNet. The giga floating-point operations per second (GFLOPs), parameters, and the speed (i.e., the image throughput per second) [57] are also reported, to analyze their computational complexity. According to Table 6, the GFIA module, although slightly slower than PPM, outperforms other global feature information awareness schemes in terms of GFLOPs, parameters, F1 scores and IOU. While PPM and ASPP can effectively improve the accuracy of the model in maintaining lower GFLOPs and parameters, the accuracy increments seem far from adequate compared to GFIA. Despite DCU aggregating the global information by dilated convolution, its GFLOPs and parameters are much larger and speed is much slower, which brings a greater computational complexity and reduces inference speed. On the basis of DCU, GFIA adds the depthwise separable convolution, greatly reducing GFLOPs and parameters and alleviating the model training complexity, despite the reduced inference speed. In addition, GFIA uses the nonlocal unit to enhance the spatial relationships between global semantic information and effectively aggregates building features. In comparison, GFIA obtained the best accuracy while maintaining a lower complexity, demonstrating that the GFIA module captures the multiscale contextual information of building features by dilated convolution and nonlocal units and accomplishes the effective aggregation of global semantic information.
5.4. Comparison of Different Cross Level Feature Fusion Schemes
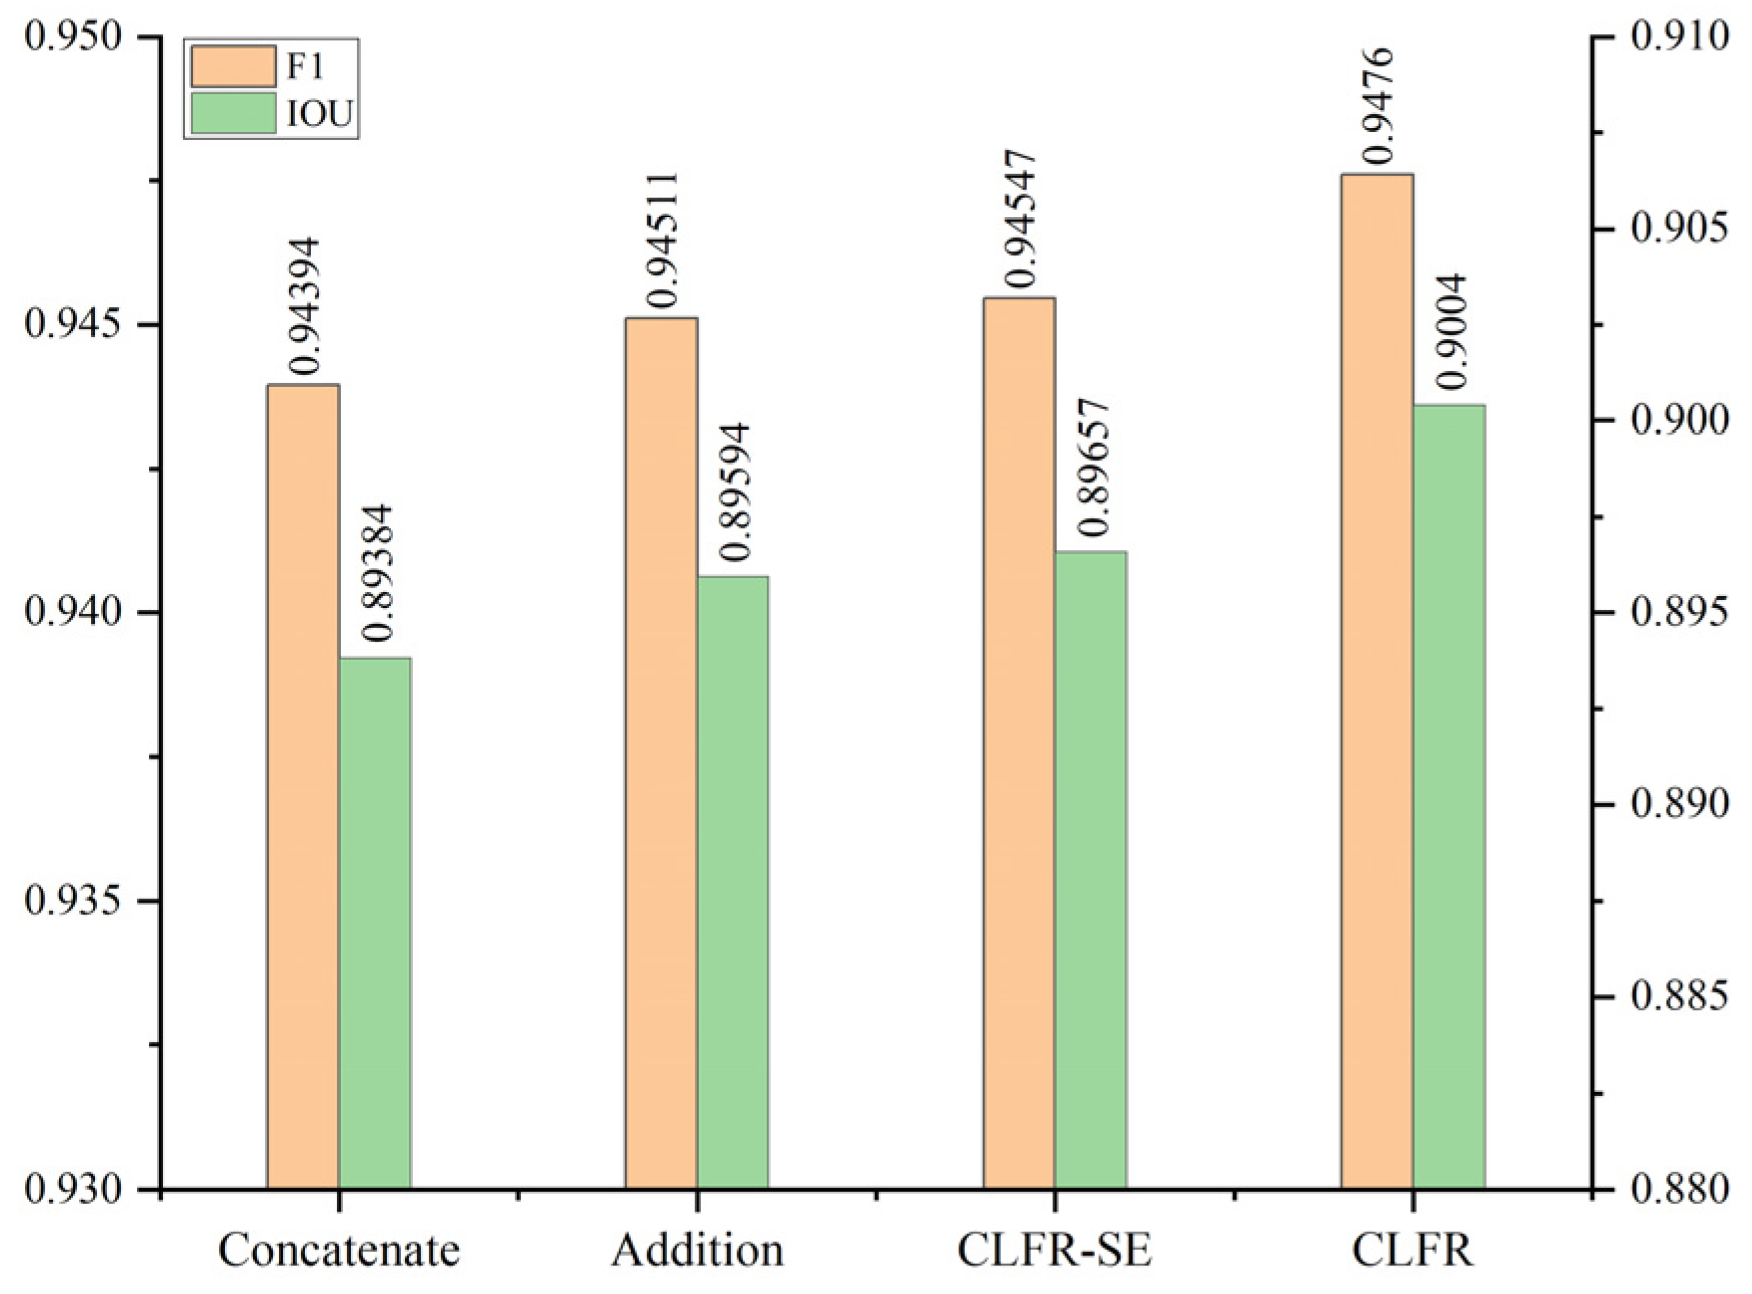
Figure 15 displays the comparison of different cross level feature fusion schemes based on B-FGC-Net, including the concatenate channel, pixel addition, CLFR-SE module, and proposed CLFR module. The CLFR-SE module replaces channel attention in the CLFR proposed in this paper with the squeeze and excitation (SE) module [58]. According to the results, the F1 and IOU of the concatenated channel and pixel addition are significantly lower than the F1 and IOU of the CLFR-SE and CLFR modules, mainly because of the large semantic gap between low and high level features and the extensive redundant noise information contained in the low level features. Considering the semantic gaps of low level features and the redundancy characteristics, our study designed a cross level feature recalibration scheme. The CLFR module can automatically pick up the complementary information from channel dimensions, completing the effective utilization of low level features and significantly enhancing the model performance. To choose superior channel attention in the CLFR module, we compared the learning ability of SE and ECA. The experimental results show that the latter achieves significant performance gains with only a few additional parameters. The comprehensive comparison of the four different cross level feature fusion schemes demonstrates that the ECA based CLFR completes the recalibration of the channel information of low level features and aggregates the cross level feature information by learning the channel semantic information of high level features.
5.5. Ablation Study
Ablation experiments were performed to verify the rationality and validity of each component of the B-FGC-Net on the WHU Building Dataset. U-Net with ResNet-34 was chosen as the baseline model, and the F1 score and IOU were adopted to quantitatively assess the effectiveness. The detailed results are shown in Table 7. The F1 and IOU are improved by 0.96% and 1.69% after ResNet34 was introduced in U-Net, demonstrating the robust feature extraction capability of ResNet34 as the encoder. The addition of the SA unit improves the baseline from 94.02% and 88.71% to 94.44% and 89.46% in terms of F1 and IOU, respectively, implying that the SA unit concentrates on building features in the spatial dimension and ignores other irrelevant backgrounds, such as building shadows. After inserting the GFIA module with the DC and nonlocal units, the F1 score and IOU are improved by 0.54% and 0.97% compared with the baseline, indicating that larger scale building features are effectively captured and that global features are usefully integrated. By adding the CLFR module, the F1 score and IOU are improved by 0.74% and 1.33% compared with the basic model, meaning that the CLFR module eliminates the semantic gap between low and high level features and makes full use of the detailed spatial information of low level features. In summary, the SA, the GFIA, and the CLFR are proven to be able to effectively improve the performance through the ablation experiments of each module. Most importantly, to obtain the best building extraction results, each component of the proposed method is required.
5.6. Limitations and Future Research Work
Although the proposed method has achieved excellent extraction performance with superior extraction capability for small and large scale buildings on WHU and INRIA building datasets, there are still some difficulties in data dependence and the characteristics of the same spectrum foreign matter that should not be ignored.
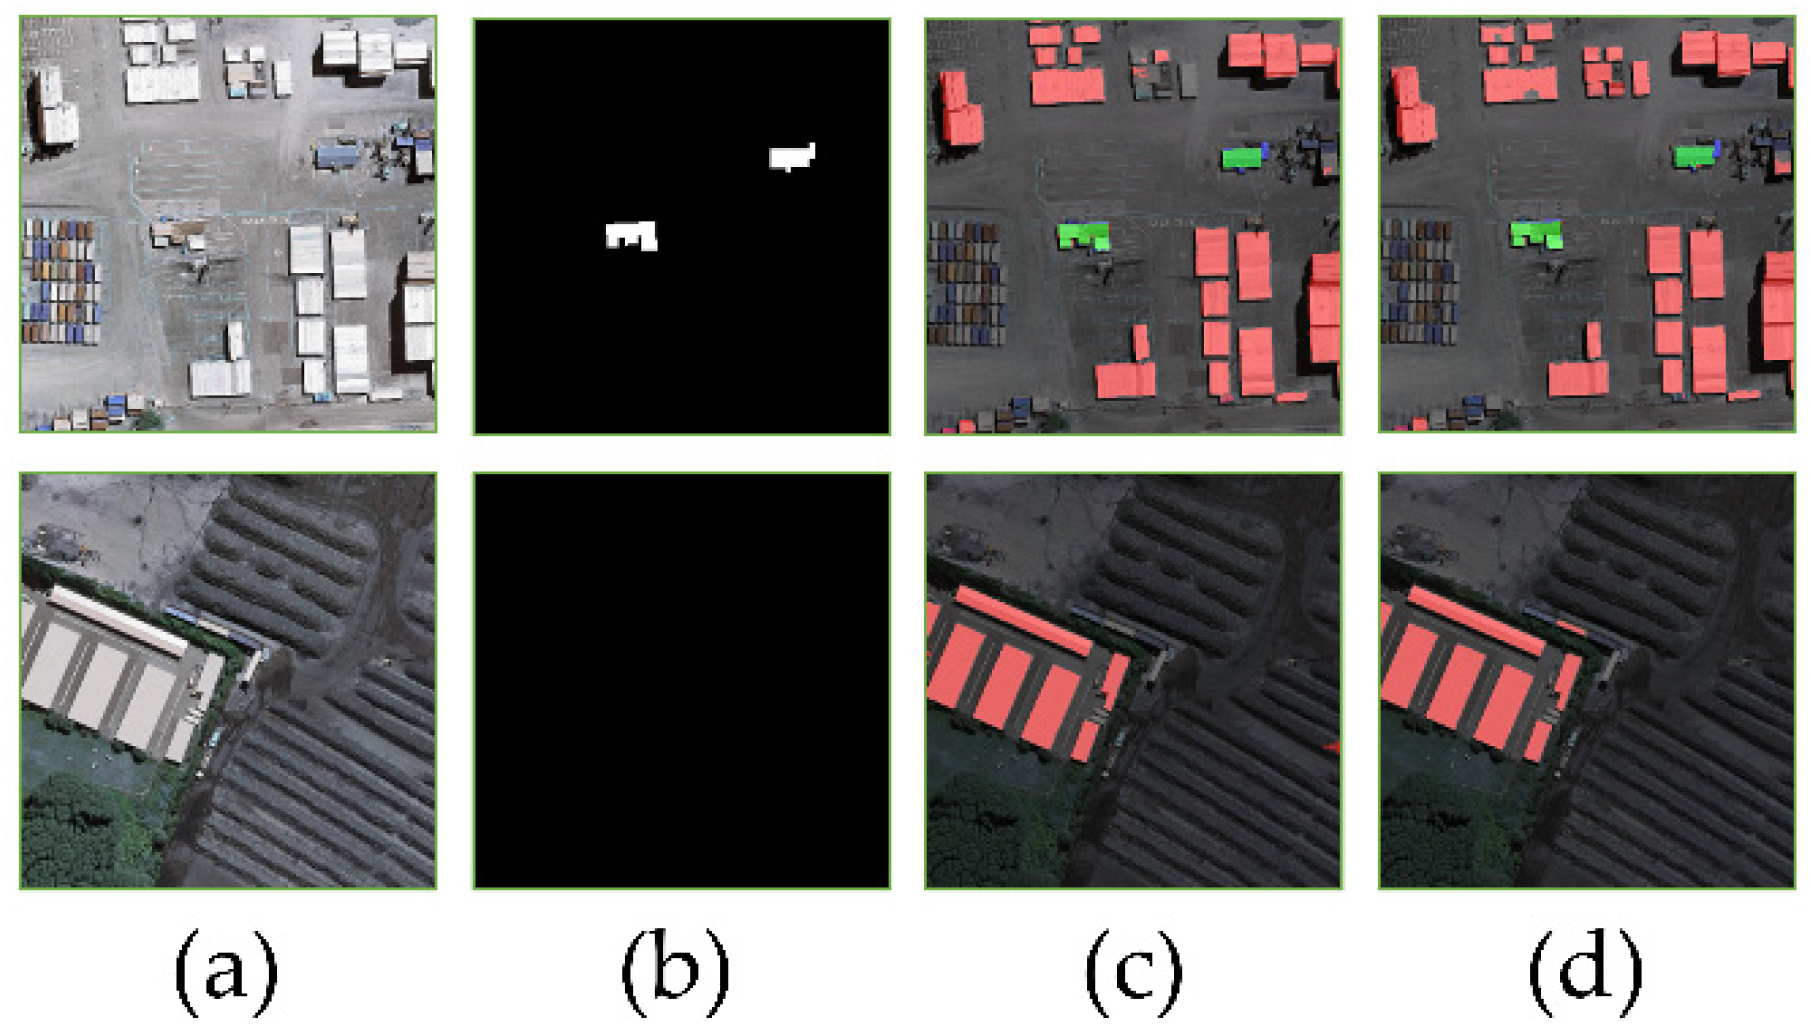
Figure 16 displays examples of error extraction for U-Net and B-FGC-Net. According to the results, both methods suffer from partial building misidentification, which may be attributed to two main reasons: (1) Some nonbuildings (e.g., light gray concrete plots, containers, etc.) are similar to buildings in terms of spectral features and geometric features. End to end DCNN methods have extreme difficulty learning the potential difference in features between them from limited RGB image data, which is prone to misclassification. Thus, future work should use auxiliary information such as digital surface models (DSMs) [59] or multispectral images for building extraction to improve the extraction precision. (2) Some of the labels are mistaken, making it rather difficult for the model to learn all the information about buildings, resulting in the possible underfitting of the model. For this reason, semisupervised or unsupervised learning methods are suggested for future research to reduce the reliance on labeled data.
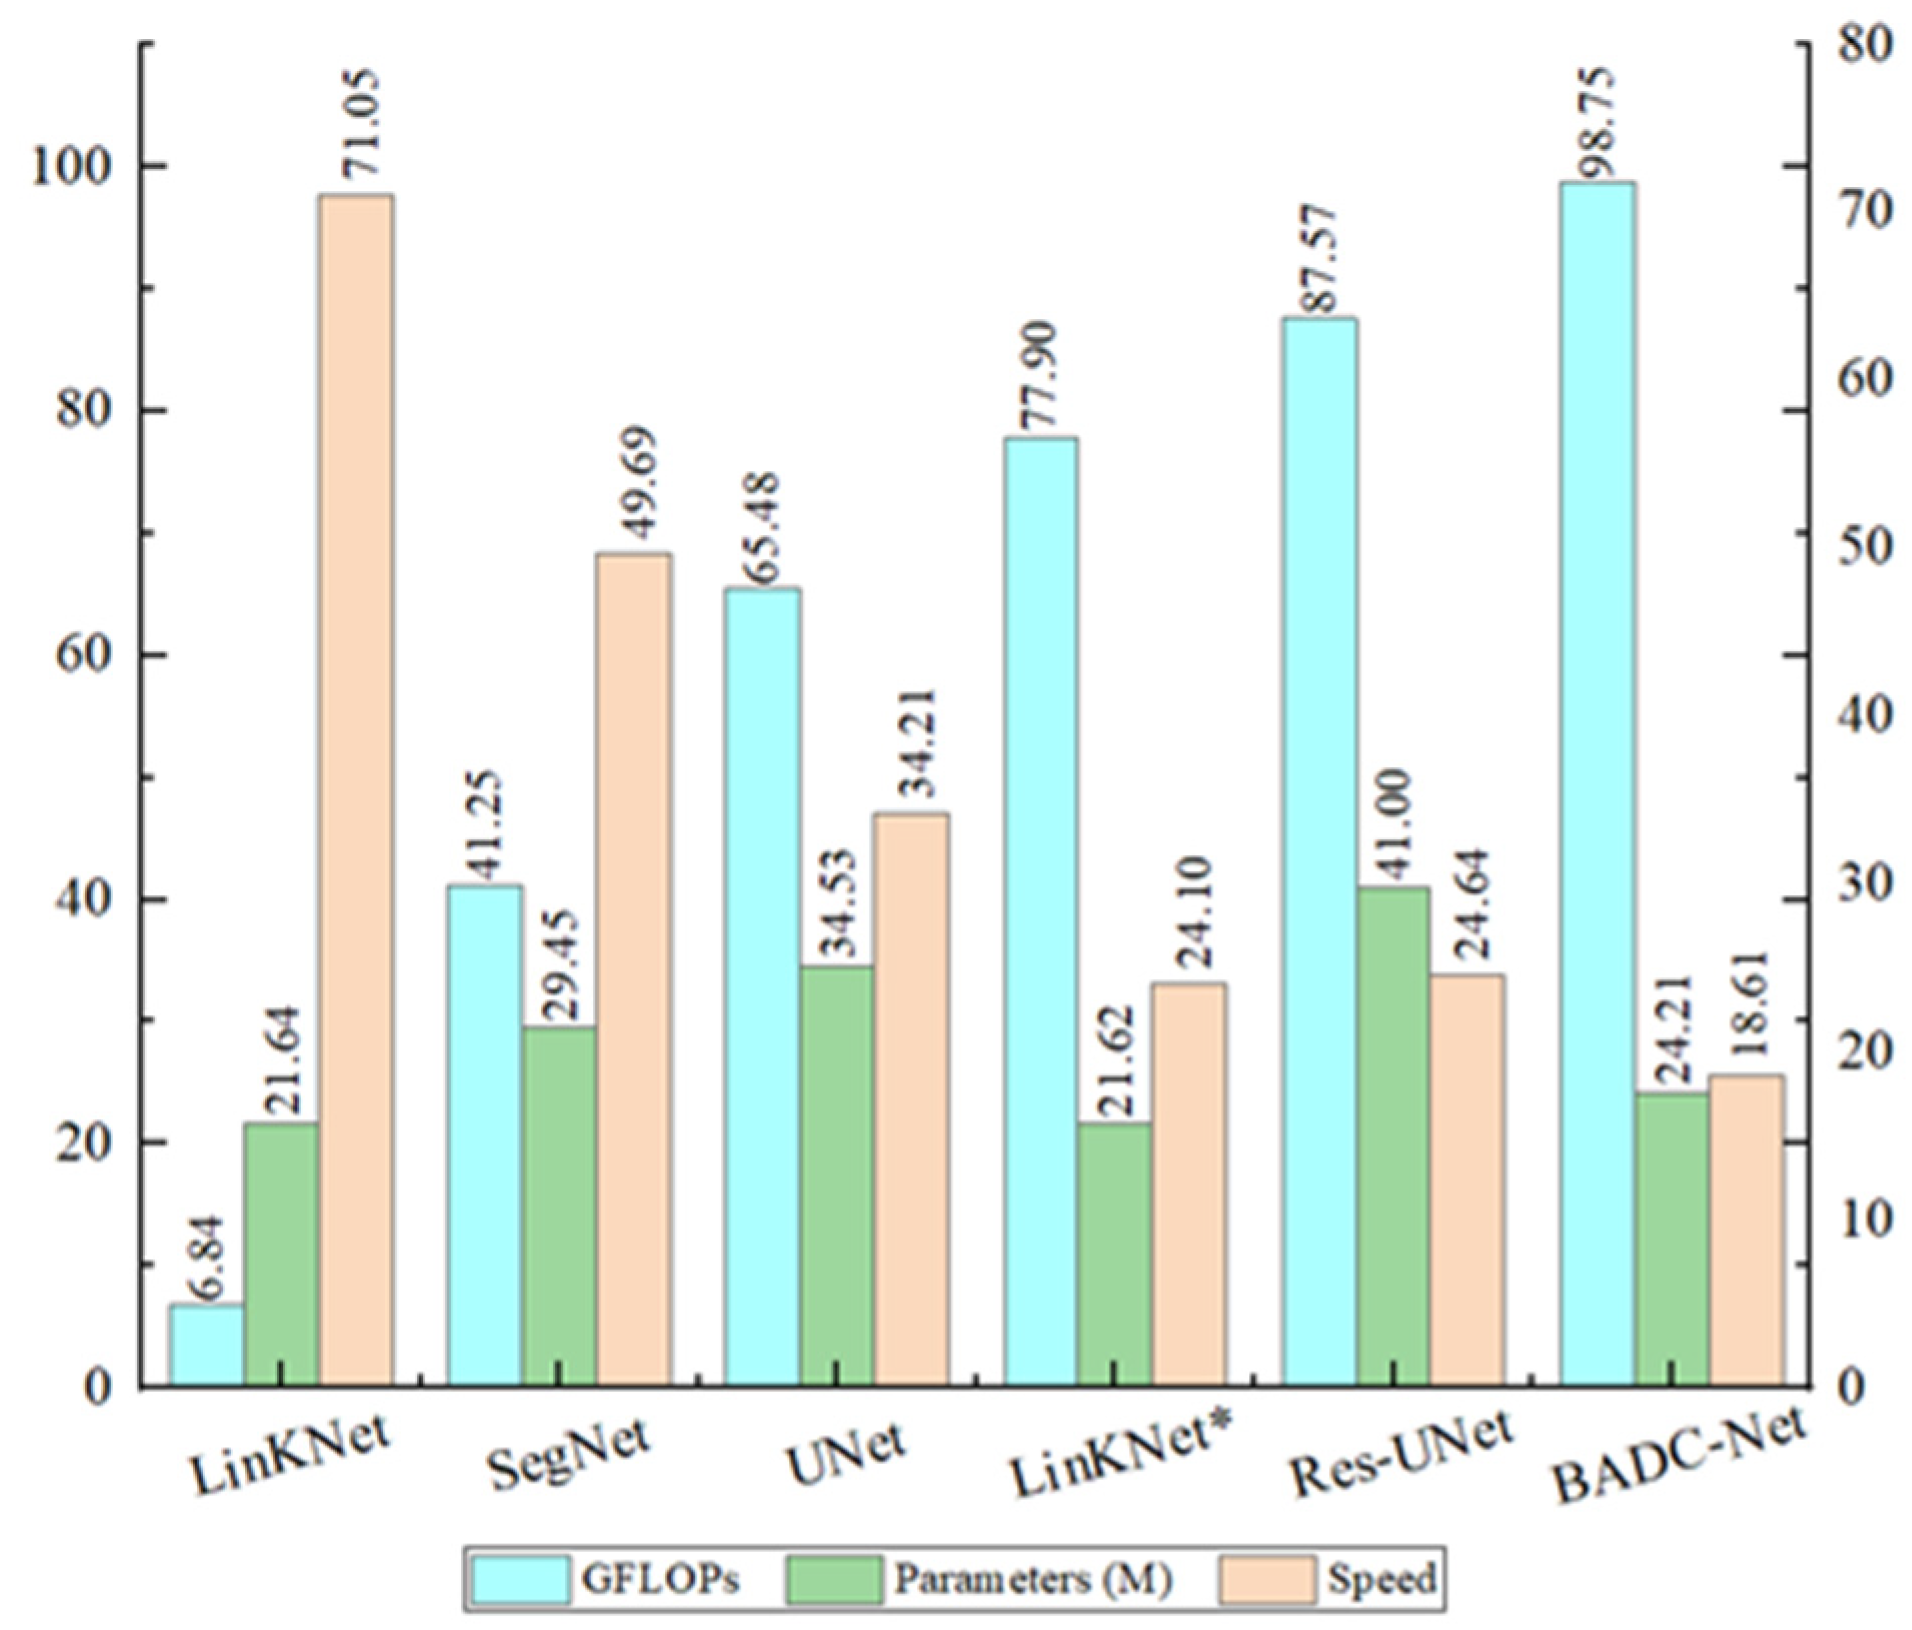
The comparison of the GFLOPs, parameters of several methods, and inference speed is illustrated in Figure 17. The B-FGC-Net model has larger GFLOPs (98.75) and model parameters (24M) and lower inference speed (18.61). Therefore, DL based DCNN models need to make a good trade off between computational complexity and precision in future work. For instance, smaller models can be used to extract buildings quickly in the deployment stage of various intelligent terminals (e.g., UAV identification terminals, handheld information collection terminals); larger models can be used to extract buildings accurately in the field of precision mapping. Furthermore, further work can pay more attention to the knowledge distillation scheme [60] that reduces the parameters of the model with good accuracy and high computational complexity and facilitates the deployment of the model.
6. Conclusions
This study proposed a building extraction network (B-FGC-Net) for high resolution remote sensing imagery. The encoder combined the SA unit to highlight the spatial level of building feature representation, the GFIA module was applied to capture the multiscale contextual information and global semantic information, and the decoder used the CLFR module to achieve the effective fusion of cross level information. The proposed method was implemented and evaluated on two public datasets. The experimental results indicate that: (1) B-FGC-Net is a building extraction model with an outstanding extraction effect and high accuracy, especially in small and large scale buildings, and overcomes the influence of building shadows and tree shading. (2) Comparison from different perspectives reveals that the SA, GFIA, and CLFR can highlight building features, perceive global semantic information and recalibrate cross layer channel information, respectively. SA is able to autonomously learn the spatial distribution relationship of feature points, significantly improving the attention on building features in the form of weight assignment and weakening the representation of background noise such as building shadows; GFIA perceives a wider range of feature information with superior contextual information aggregation capability and brings greater accuracy gain through dilated convolution and self attention mechanisms; CLFR eliminates the semantic gap in low level features through adaptively acquiring channel information contributions from high level features and achieves significant performance gains by the effective fusion of different hierarchical features. (3) Future research should pay more attention to auxiliary information and semi supervised learning methods to improve extraction accuracy and reduce the dependence on labeled data.
Author Contributions
Conceptualization, Y.W. and X.Z.; methodology, Y.W. and X.Z.; software, X.Z.; validation, Y.W. and X.Z.; formal analysis, Y.W., X.L. and D.Z.; writing—original draft preparation, Y.W. and X.Z.; writing—review and editing, Y.W., X.Z., X.L. and D.Z.; visualization, X.Z.; project administration, Y.W.; funding acquisition, Y.W. All authors have read and agreed to the published version of the manuscript.
Funding
This research was partly supported by the Strategic Priority Research Program of Chinese Academy of Sciences (Grant No. XDA28050200), the Third Xinjiang Scientific Expedition Program (Grant No. 2021xjkk1402), the Major Special Project—the China High resolution Earth Observation System (Grant No. 30-Y30F06-9003-20/22) and Fujian Province Highway Science and Technology Project: Key technology of Intelligent Inspection of Highway UAV Network by Remote Sensing (Grant No. GS 202101).
Institutional Review Board Statement
Not applicable.
Informed Consent Statement
Not applicable.
Data Availability Statement
WHU building data set can be downloaded in http://gpcv.whu.edu.cn/data/building_dataset.html (accessed on 5 December 2021) and INRIA building data set can be downloaded in https://project.inria.fr/aerialimagelabeling/download/ (accessed on 5 December 2021).
Acknowledgments
The authors appreciate Wuhan University and INRIA for sharing the building datasets for free.
Conflicts of Interest
The authors declare no conflict of interest.
References
- Rashidian, V.; Baise, L.G.; Koch, M. Detecting Collapsed Buildings after a Natural Hazard on Vhr Optical Satellite Imagery Using U-Net Convolutional Neural Networks. Int. Geosci. Remote Sens. Symp. 2019, 9394–9397. [Google Scholar] [CrossRef]
- Zhang, Z.; Guo, W.; Li, M.; Yu, W. GIS-Supervised Building Extraction With Label Noise-Adaptive Fully Convolutional Neural Network. IEEE Geosci. Remote Sens. Lett. 2020, 17, 2135–2139. [Google Scholar] [CrossRef]
- He, S.; Jiang, W. Boundary-Assisted Learning for Building Extraction from Optical Remote Sensing Imagery. Remote Sens. 2021, 13, 760. [Google Scholar] [CrossRef]
- Chen, Z.; Li, D.; Fan, W.; Guan, H.; Wang, C.; Li, J. Self-attention in reconstruction bias U-net for semantic segmentation of building rooftops in optical remote sensing images. Remote Sens. 2021, 13, 2524. [Google Scholar] [CrossRef]
- Liu, P.; Liu, X.; Liu, M.; Shi, Q.; Yang, J.; Xu, X.; Zhang, Y. Building footprint extraction from high-resolution images via spatial residual inception convolutional neural network. Remote Sens. 2019, 11, 830. [Google Scholar] [CrossRef] [Green Version]
- He, N.; Fang, L.; Plaza, A. Hybrid first and second order attention Unet for building segmentation in remote sensing images. Sci. China Inf. Sci. 2020, 63, 140305. [Google Scholar] [CrossRef] [Green Version]
- Zerrouki, N.; Bouchaffra, D. Pixel-based or Object-based: Which approach is more appropriate for remote sensing image classification? In Proceedings of the 2014 IEEE International Conference on Systems, Man, and Cybernetics (SMC), San Diego, CA, USA, 5–8 October 2014; pp. 864–869. [Google Scholar]
- Maggiori, E.; Tarabalka, Y.; Charpiat, G.; Alliez, P. Convolutional Neural Networks for Large-Scale Remote-Sensing Image Classification. IEEE Trans. Geosci. Remote Sens. 2017, 55, 645–657. [Google Scholar] [CrossRef] [Green Version]
- Myint, S.W.; Gober, P.; Brazel, A.; Grossman-Clarke, S.; Weng, Q. Per-pixel vs. object-based classification of urban land cover extraction using high spatial resolution imagery. Remote Sens. Environ. 2011, 115, 1145–1161. [Google Scholar] [CrossRef]
- Dean, A.M.; Smith, G.M. An evaluation of per-parcel land cover mapping using maximum likelihood class probabilities. Int. J. Remote Sens. 2003, 24, 2905–2920. [Google Scholar] [CrossRef]
- Duro, D.C.; Franklin, S.E.; Dubé, M.G. A comparison of pixel-based and object-based image analysis with selected machine learning algorithms for the classification of agricultural landscapes using SPOT-5 HRG imagery. Remote Sens. Environ. 2012, 118, 259–272. [Google Scholar] [CrossRef]
- Blaschke, T.; Lang, S.; Lorup, E.; Strobl, J.; Zeil, P. Object-oriented image processing in an integrated GIS/remote sensing environment and perspectives for environmental applications. Environ. Inf. Plan. Polit. Public 2000, 2, 555–570. [Google Scholar]
- Ding, Z.; Wang, X.Q.; Li, Y.L.; Zhang, S.S. Study on building extraction from high-resolution images using MBI. Int. Arch. Photogramm. Remote Sens. Spat. Inf. Sci. 2018, XLII-3, 283–287. [Google Scholar] [CrossRef] [Green Version]
- Sirmacek, B.; Unsalan, C. Building detection from aerial images using invariant color features and shadow information. In Proceedings of the 2008 23rd International Symposium on Computer and Information Sciences, Istanbul, Turkey, 27–29 October 2008; pp. 1–5. [Google Scholar]
- Lin, Y.; Xu, D.; Wang, N.; Shi, Z.; Chen, Q. Road Extraction from Very-High-Resolution Remote Sensing Images via a Nested SE-Deeplab Model. Remote Sens. 2020, 12, 2985. [Google Scholar] [CrossRef]
- Fu, H.; Fu, B.; Shi, P. An improved segmentation method for automatic mapping of cone karst from remote sensing data based on deeplab V3+ model. Remote Sens. 2021, 13, 441. [Google Scholar] [CrossRef]
- Yang, X.; Liu, R.; Yang, M.; Chen, J.; Liu, T.; Yang, Y.; Chen, W.; Wang, Y. Incorporating landslide spatial information and correlated features among conditioning factors for landslide susceptibility mapping. Remote Sens. 2021, 13, 2166. [Google Scholar] [CrossRef]
- Alshehhi, R.; Marpu, P.R.; Woon, W.L.; Mura, M.D. Simultaneous extraction of roads and buildings in remote sensing imagery with convolutional neural networks. ISPRS J. Photogramm. Remote Sens. 2017, 130, 139–149. [Google Scholar] [CrossRef]
- Lecun, Y.; Bengio, Y.; Hinton, G. Deep learning. Nature 2015, 521, 436–444. [Google Scholar] [CrossRef]
- Krizhevsky, A.; Sutskever, I.; Hinton, G.E. ImageNet classification with deep convolutional neural networks. Commun. ACM 2017, 60, 84–90. [Google Scholar] [CrossRef]
- Jin, Y.; Xu, W.; Zhang, C.; Luo, X.; Jia, H. Boundary-aware refined network for automatic building extraction in very high-resolution urban aerial images. Remote Sens. 2021, 13, 692. [Google Scholar] [CrossRef]
- Lan, Z.; Huang, Q.; Chen, F.; Meng, Y. Aerial Image Semantic Segmentation Using Spatial and Channel Attention. In Proceedings of the 2019 IEEE 4th International Conference on Image, Vision and Computing (ICIVC), Xiamen, China, 5–7 July 2019; pp. 316–320. [Google Scholar]
- Seong, S.; Choi, J. Semantic segmentation of urban buildings using a high-resolution network (Hrnet) with channel and spatial attention gates. Remote Sens. 2021, 13, 3087. [Google Scholar] [CrossRef]
- Chen, L.; Zhang, H.; Xiao, J.; Nie, L.; Shao, J.; Liu, W.; Chua, T.S. SCA-CNN: Spatial and channel-wise attention in convolutional networks for image captioning. In Proceedings of the 2017 IEEE Conference on Computer Vision and Pattern Recognition (CVPR), Honolulu, HI, USA, 21–26 July 2017; pp. 6298–6306. [Google Scholar]
- Qi, X.; Li, K.; Liu, P.; Zhou, X.; Sun, M. Deep Attention and Multi-Scale Networks for Accurate Remote Sensing Image Segmentation. IEEE Access 2020, 8, 146627–146639. [Google Scholar] [CrossRef]
- Ronneberger, O.; Fischer, P.; Brox, T. U-Net: Convolutional Networks for Biomedical Image Segmentation. In Medical Image Computing and Computer-Assisted Intervention—MICCAI; Navab, N., Hornegger, J., Wells, W.M., Frangi, A., Eds.; Springer International Publishing: Cham, Switzerland, 2015; Volume 9351, pp. 234–241. [Google Scholar]
- He, K.; Zhang, X.; Ren, S.; Sun, J. Deep Residual Learning for Image Recognition. In Proceedings of the 2016 IEEE Conference on Computer Vision and Pattern Recognition (CVPR), Las Vegas, NV, USA, 27–30 June 2016; pp. 770–778. [Google Scholar]
- Yi, Y.; Zhang, Z.; Zhang, W.; Zhang, C.; Li, W.; Zhao, T. Semantic segmentation of urban buildings from VHR remote sensing imagery using a deep convolutional neural network. Remote Sens. 2019, 11, 1774. [Google Scholar] [CrossRef] [Green Version]
- Luo, H.; Chen, C.; Fang, L.; Zhu, X.; Lu, L. High-Resolution Aerial Images Semantic Segmentation Using Deep Fully Convolutional Network with Channel Attention Mechanism. IEEE J. Sel. Top. Appl. Earth Obs. Remote Sens. 2019, 12, 3492–3507. [Google Scholar] [CrossRef]
- Zhu, Q.; Zhang, Y.; Wang, L.; Zhong, Y.; Guan, Q.; Lu, X.; Zhang, L.; Li, D. A Global Context-aware and Batch-independent Network for road extraction from VHR satellite imagery. ISPRS J. Photogramm. Remote Sens. 2021, 175, 353–365. [Google Scholar] [CrossRef]
- Zhou, L.; Zhang, C.; Wu, M. D-linknet: Linknet with pretrained encoder and dilated convolution for high resolution satellite imagery road extraction. In Proceedings of the 2018 IEEE/CVF Conference on Computer Vision and Pattern Recognition Workshops (CVPRW), Salt Lake City, UT, USA, 18–22 June 2018; pp. 192–1924. [Google Scholar]
- Guo, M.; Liu, H.; Xu, Y.; Huang, Y. Building Extraction Based on U-Net with an Attention Block and Multiple Losses. Remote Sens. 2020, 12, 1400. [Google Scholar] [CrossRef]
- Long, J.; Shelhamer, E.; Darrell, T. Fully convolutional networks for semantic segmentation. In Proceedings of the 2015 IEEE Conference on Computer Vision and Pattern Recognition (CVPR), Boston, MA, USA, 7–12 June 2015; pp. 3431–3440. [Google Scholar]
- Badrinarayanan, V.; Kendall, A.; Cipolla, R. SegNet: A Deep Convolutional Encoder-Decoder Architecture for Image Segmentation. IEEE Trans. Pattern Anal. Mach. Intell. 2017, 39, 2481–2495. [Google Scholar] [CrossRef] [PubMed]
- Zhou, Z.; Rahman Siddiquee, M.M.; Tajbakhsh, N.; Liang, J. Unet++: A nested u-net architecture for medical image segmentation. In Deep Learning in Medical Image Analysis and Multimodal Learning for Clinical Decision Support; Springer International Publishing: Cham, Switzerland, 2018; pp. 3–11. [Google Scholar]
- Kestur, R.; Farooq, S.; Abdal, R.; Mehraj, E.; Narasipura, O.; Mudigere, M. UFCN: A fully convolutional neural network for road extraction in RGB imagery acquired by remote sensing from an unmanned aerial vehicle. J. Appl. Remote Sens. 2018, 12, 1. [Google Scholar] [CrossRef]
- Chaurasia, A.; Culurciello, E. LinkNet: Exploiting encoder representations for efficient semantic segmentation. In Proceedings of the 2017 IEEE Visual Communications and Image Processing (VCIP), St. Petersburg, FL, USA, 10–13 December 2017; pp. 1–4. [Google Scholar]
- Chen, L.-C.; Papandreou, G.; Schroff, F.; Adam, H. Rethinking Atrous Convolution for Semantic Image Segmentation. arXiv 2017, arXiv:1706.05587. [Google Scholar]
- Zhang, Z.; Liu, Q.; Wang, Y. Road Extraction by Deep Residual U-Net. IEEE Geosci. Remote Sens. Lett. 2018, 15, 749–753. [Google Scholar] [CrossRef] [Green Version]
- Das, P.; Chand, S. AttentionBuildNet for building extraction from aerial imagery. In Proceedings of the 2021 International Conference on Computing, Communication, and Intelligent Systems (ICCCIS), Greater Noida, India, 19–20 February 2021; pp. 576–580. [Google Scholar]
- Wang, X.; Girshick, R.; Gupta, A.; He, K. Non-local Neural Networks. In Proceedings of the 2018 IEEE/CVF Conference on Computer Vision and Pattern Recognition, Salt Lake City, UT, USA, 18–23 June 2018; pp. 7794–7803. [Google Scholar]
- Wang, Y.; Seo, J.; Jeon, T. NL-LinkNet: Toward Lighter But More Accurate Road Extraction With Nonlocal Operations. IEEE Geosci. Remote Sens. Lett. 2021, 19, 1–5. [Google Scholar] [CrossRef]
- Ding, L.; Tang, H.; Bruzzone, L. LANet: Local Attention Embedding to Improve the Semantic Segmentation of Remote Sensing Images. IEEE Trans. Geosci. Remote Sens. 2021, 59, 426–435. [Google Scholar] [CrossRef]
- Zhao, H.; Shi, J.; Qi, X.; Wang, X.; Jia, J. Pyramid scene parsing network. In Proceedings of the 2017 IEEE Conference on Computer Vision and Pattern Recognition (CVPR), Honolulu, HI, USA, 21–26 July 2017; pp. 6230–6239. [Google Scholar]
- Chen, L.-C.; Zhu, Y.; Papandreou, G.; Schroff, F.; Adam, H. Encoder-Decoder with Atrous Separable Convolution for Semantic Image Segmentation. In Proceedings of the European Conference on Computer Vision (ECCV), Munich, Germany, 8–14 September 2018; pp. 801–818. [Google Scholar]
- Xie, Y.; Miao, F.; Zhou, K.; Peng, J. HSGNet: A road extraction network based on global perception of high-order spatial information. ISPRS Int. J. Geo-Inf. 2019, 8, 571. [Google Scholar] [CrossRef] [Green Version]
- Nitish, S.; Hinton, G.; Krizhevsky, A.; Sutskever, I.; Salakhutdinov, R. Dropout: A Simple Way to Prevent Neural Networks from Overfitting. J. Mach. Learn. Res. 2014, 15, 1929–1958. [Google Scholar]
- Ioffe, S.; Szegedy, C. Batch Normalization: Accelerating Deep Network Training by Reducing Internal Covariate Shift. In Proceedings of the 32nd International Conference on Machine Learning, Lille, France, 7–9 July 2015; pp. 448–456. [Google Scholar]
- Woo, S.; Park, J.; Lee, J.Y.; Kweon, I.S. CBAM: Convolutional block attention module. In Proceedings of the European Conference on Computer Vision (ECCV), Munich, Germany, 8–14 September 2018; Springer International Publishing: Cham, Switzerland, 2018; pp. 3–19. [Google Scholar]
- Wang, Q.; Wu, B.; Zhu, P.; Li, P.; Zuo, W.; Hu, Q. ECA-Net: Efficient channel attention for deep convolutional neural networks. In Proceedings of the 2020 IEEE/CVF Conference on Computer Vision and Pattern Recognition (CVPR), Seattle, WA, USA, 13–19 June 2020; pp. 11531–11539. [Google Scholar]
- Ji, S.; Wei, S.; Lu, M. Fully Convolutional Networks for Multisource Building Extraction from an Open Aerial and Satellite Imagery Data Set. IEEE Trans. Geosci. Remote Sens. 2019, 57, 574–586. [Google Scholar] [CrossRef]
- Maggiori, E.; Tarabalka, Y.; Charpiat, G.; Alliez, P. Can semantic labeling methods generalize to any city? the inria aerial image labeling benchmark. Int. Geosci. Remote Sens. Symp. 2017, 2017, 3226–3229. [Google Scholar] [CrossRef] [Green Version]
- Kingma, D.P.; Ba, J.L. Adam: A method for stochastic optimization. arXiv 2014, arXiv:1412.6980. [Google Scholar]
- Pan, X.; Yang, F.; Gao, L.; Chen, Z.; Zhang, B.; Fan, H.; Ren, J. Building extraction from high-resolution aerial imagery using a generative adversarial network with spatial and channel attention mechanisms. Remote Sens. 2019, 11, 917. [Google Scholar] [CrossRef] [Green Version]
- Cao, Z.; Diao, W.; Sun, X.; Lyu, X.; Yan, M.; Fu, K. C3Net: Cross-Modal Feature Recalibrated, Cross-Scale Semantic Aggregated and Compact Network for Semantic Segmentation of Multi-Modal High-Resolution Aerial Images. Remote Sens. 2021, 13, 528. [Google Scholar] [CrossRef]
- Zhou, D.; Wang, G.; He, G.; Long, T.; Yin, R.; Zhang, Z.; Chen, S.; Luo, B. Robust building extraction for high spatial resolution remote sensing images with self-attention network. Sensors 2020, 20, 7241. [Google Scholar] [CrossRef] [PubMed]
- Ding, X.; Zhang, X.; Ma, N.; Han, J.; Ding, G.; Sun, J. RepVGG: Making VGG-style ConvNets Great Again. In Proceedings of the 2021 IEEE/CVF Conference on Computer Vision and Pattern Recognition (CVPR), Nashville, TN, USA, 20–25 June 2021; pp. 13728–13737. [Google Scholar]
- Hu, J.; Shen, L.; Albanie, S.; Sun, G.; Wu, E. Squeeze-and-Excitation Networks. IEEE Trans. Pattern Anal. Mach. Intell. 2020, 42, 2011–2023. [Google Scholar] [CrossRef] [Green Version]
- Cao, Z.; Fu, K.; Lu, X.; Diao, W.; Sun, H.; Yan, M.; Yu, H.; Sun, X. End-to-End DSM Fusion Networks for Semantic Segmentation in High-Resolution Aerial Images. IEEE Geosci. Remote Sens. Lett. 2019, 16, 1766–1770. [Google Scholar] [CrossRef]
- Li, X.; Yu, L.; Chen, H.; Fu, C.W.; Xing, L.; Heng, P.A. Transformation-Consistent Self-Ensembling Model for Semisupervised Medical Image Segmentation. IEEE Trans. Neural Networks Learn. Syst. 2021, 32, 523–534. [Google Scholar] [CrossRef] [PubMed]
Figure 1.
Overall of the proposed framework. (a) Structure of the B-FGC-Net, in which ①, ②, and ③ denote the encoder, the GFIA module, and the decoder, respectively, Down sample denotes downsampling, Up-layer denotes upsampling; (b) Res-Block; (c) Decoder-Block, where C denotes the number of channels of the feature map, and p is the probability of an element being zeroed. The addition and ReLU represent the pixel addition and the Rectified Linear Unit, respectively. The 1 × 1 and 3 × 3 denote the convolution kernel size.

Figure 2.
The structure of the spatial attention unit.

Figure 3.
Overview of the GFIA module. (a) The structure of the GFIA module, (b) the comparison of standard convolution and dilated convolution, (c) the structure of the nonlocal units.
Figure 3.
Overview of the GFIA module. (a) The structure of the GFIA module, (b) the comparison of standard convolution and dilated convolution, (c) the structure of the nonlocal units.

Figure 4.
The structure of the CLFR module.

Figure 5.
Flow chart of the loss function. The 3 × 3 matrix represents the Laplacian operator.

Figure 6.
Examples of the original images and the ground truth of the WHU building dataset. (a–c) are training, validation, and testing samples, respectively.
Figure 6.
Examples of the original images and the ground truth of the WHU building dataset. (a–c) are training, validation, and testing samples, respectively.

Figure 7.
Examples of the images and the ground truth of the INRIA aerial image labeling dataset. (a,b) are the original dataset and the preprocessed image examples, respectively.
Figure 7.
Examples of the images and the ground truth of the INRIA aerial image labeling dataset. (a,b) are the original dataset and the preprocessed image examples, respectively.

Figure 8.
Building extraction results of the B-FGC-Net on the WHU building dataset. The first to third rows are the original images, labels, and results, respectively. The numbers 1–6 represent the index in which the image is located.
Figure 8.
Building extraction results of the B-FGC-Net on the WHU building dataset. The first to third rows are the original images, labels, and results, respectively. The numbers 1–6 represent the index in which the image is located.

Figure 9.
Evaluation results on the WHU building dataset.

Figure 10.
The extraction results of B-FGC-Net on the INRIA aerial image labeling dataset. The first to third rows are the test images, labels, and results, respectively. Numbers 1–5 represent Austin, Chicago, Kitsap County, West Tyrol, and Vienna, respectively.
Figure 10.
The extraction results of B-FGC-Net on the INRIA aerial image labeling dataset. The first to third rows are the test images, labels, and results, respectively. Numbers 1–5 represent Austin, Chicago, Kitsap County, West Tyrol, and Vienna, respectively.

Figure 11.
Evaluation results on the Inria Aerial Image Labeling dataset.

Figure 12.
Extraction results of different models on the WHU Building Dataset. (a) Original image, (b) label, (c) U-Net, (d) Res-UNet, (e) LinkNet, (f) LinkNet*, (g) B-FGC-Net.
Figure 12.
Extraction results of different models on the WHU Building Dataset. (a) Original image, (b) label, (c) U-Net, (d) Res-UNet, (e) LinkNet, (f) LinkNet*, (g) B-FGC-Net.

Figure 13.
The extraction results of different methods on the INRIA aerial image labeling dataset. (a) Original images, (b) labels, (c) U-Net, (d) Res-UNet, (e) LinkNet, (f) SegNet, (g) DeepLabV3, (h) B-FGC-Net.
Figure 13.
The extraction results of different methods on the INRIA aerial image labeling dataset. (a) Original images, (b) labels, (c) U-Net, (d) Res-UNet, (e) LinkNet, (f) SegNet, (g) DeepLabV3, (h) B-FGC-Net.

Figure 14.
Visualization results of different levels of SA: (a) original images, (b,c) before and after SA_1, (d,e) before and after SA_2, (f,g) before and after SA_3, (h,i) before and after SA_4.
Figure 14.
Visualization results of different levels of SA: (a) original images, (b,c) before and after SA_1, (d,e) before and after SA_2, (f,g) before and after SA_3, (h,i) before and after SA_4.

Figure 15.
F1 scores and IOU of different cross level feature fusion schemes on the WHU building dataset.
Figure 15.
F1 scores and IOU of different cross level feature fusion schemes on the WHU building dataset.

Figure 16.
Examples of error extraction. (a) Original images, (b) labels, (c) U-Net, (d) B-FGC-Net. The green and red indicate the correct and incorrect, respectively.
Figure 16.
Examples of error extraction. (a) Original images, (b) labels, (c) U-Net, (d) B-FGC-Net. The green and red indicate the correct and incorrect, respectively.

Figure 17.
Comparison of GFLOPs and parameters for different methods. GFLOPs and parameters are computed from a tensor of dimension 1 × 3 × 256 × 256. The speed is tested with a batch size of 2, full precision (fp32), input resolution of 3 × 256 × 256, and measured in examples/second.
Figure 17.
Comparison of GFLOPs and parameters for different methods. GFLOPs and parameters are computed from a tensor of dimension 1 × 3 × 256 × 256. The speed is tested with a batch size of 2, full precision (fp32), input resolution of 3 × 256 × 256, and measured in examples/second.


Table 1.
The encoder structure and the dimension variation of low level features. SA_1, SA_2, SA_3, and SA_4 denote the SA units of stages 1, 2, 3, and 4, respectively. Here, 3 × 256 × 256 represents the number of channels, height, and width, respectively. In addition, 3× Res-Block denotes three Res-Blocks.
| Stage | Template | Size |
|---|---|---|
| Input | - | 3 × 256 × 256 |
| 1 | 1 × 1 Conv + BN + ReLU | 64 × 256 × 256 |
| 3 × Res-Block | ||
| SA_1 | ||
| 2 | 4 × Res-Block | 128 × 128 × 128 |
| SA_2 | ||
| 3 | 6 × Res-Block | 256 × 64 × 64 |
| SA_3 | ||
| 4 | 3 × Res-Block | 512 × 32 × 32 |
| SA_4 |
Table 2.
Experimental environment and parameter settings.
| Hardware Configuration | Parameter Settings | ||
|---|---|---|---|
| Operating system | CentOS 7 | Epoch | 100 |
| DL framework | Pytorch 1.7 | Batch size | 16 |
| Language | Python 3.7 | Optimizer | Adam |
| GPU | 24G | Initial learning rate | 1 × 10⁻⁴ |
Table 3.
Accuracy evaluation results of different methods on the WHU building dataset. PISANet and Chen’s model are implemented by [56] and [4] respectively. ‘-’ denotes that the paper did not provide relevant data.
| Methods | OA (%) | P (%) | R (%) | F1 (%) | IOU (%) |
|---|---|---|---|---|---|
| U-Net | 98.54 | 93.42 | 92.71 | 93.06 | 87.02 |
| Res-UNet | 98.49 | 91.44 | 94.00 | 92.70 | 86.40 |
| LinkNet | 97.99 | 92.16 | 89.09 | 90.60 | 82.82 |
| LinkNet* | 98.72 | 94.88 | 93.02 | 93.94 | 88.57 |
| SegNet | 97.15 | 85.90 | 86.78 | 86.33 | 75.95 |
| DeeplabV3 | 97.82 | 88.93 | 90.16 | 89.54 | 81.06 |
| PISANet | 96.15 | 94.20 | 92.94 | 93.55 | 87.97 |
| Chen’s | - | 93.25 | 95.56 | 94.40 | 89.39 |
| B-FGC-Net | 98.90 | 95.03 | 94.49 | 94.76 | 90.04 |
Table 4.
Accuracy evaluation results of different methods on the INRIA aerial image labeling dataset. AMUNet and He’s model are implemented by [32] and [3] respectively. Here, ‘-’ denotes the unknown results that were not given by the authors.
| Model | OA (%) | P (%) | R (%) | F1 (%) | IOU (%) |
|---|---|---|---|---|---|
| U-Net | 96.10 | 84.76 | 87.76 | 86.24 | 75.80 |
| Res-UNet | 95.95 | 83.94 | 87.49 | 85.68 | 74.95 |
| LinkNet | 95.48 | 83.61 | 84.82 | 84.21 | 72.73 |
| LinkNet* | 96.55 | 86.85 | 88.93 | 87.88 | 78.38 |
| SegNet | 95.46 | 80.72 | 86.89 | 83.69 | 71.96 |
| DeepLabV3 | 95.80 | 84.58 | 86.04 | 85.30 | 74.37 |
| AMUNet | 96.73 | - | - | - | 76.96 |
| He’s | - | 83.50 | 91.10 | 87.10 | 77.20 |
| B-FGC-Net | 96.70 | 87.82 | 89.12 | 88.46 | 79.31 |
Table 5.
Evaluation results of different levels of SA units on the WHU building dataset. Note: the No. 1 model has no SA unit, and the No. 5 model is the B-FGC-Net.
Table 5.
Evaluation results of different levels of SA units on the WHU building dataset. Note: the No. 1 model has no SA unit, and the No. 5 model is the B-FGC-Net.
| No. | SA_4 | SA_3 | SA_2 | SA_1 | F1 (%) | IOU (%) |
|---|---|---|---|---|---|---|
| 1 | 94.38 | 89.30 | ||||
| 2 | ✓ | 94.52 | 89.62 | |||
| 3 | ✓ | ✓ | 94.54 | 89.65 | ||
| 4 | ✓ | ✓ | ✓ | 94.58 | 89.72 | |
| 5 | ✓ | ✓ | ✓ | ✓ | 94.76 | 90.04 |
Table 6.
Evaluation results of different global feature information awareness schemes on the WHU Building Dataset. Note: GFLOPs and parameters are computed from a tensor with a size of 1 × 512 × 32 × 32. The speed is tested with a batch size of 2, full precision (fp32), input resolution of 3 × 256 × 256, and measured in examples/second.
| No. | Methods | GFLOPs | Parameters (M) | Speed | F1 (%) | IOU (%) |
|---|---|---|---|---|---|---|
| 1 | PPM | 0.5417 | 0.7895 | 18.90 | 94.32 | 89.24 |
| 2 | ASPP | 4.0969 | 4.1318 | 17.19 | 94.39 | 89.37 |
| 3 | DCU | 12.082 | 11.799 | 16.93 | 94.60 | 89.75 |
| 4 | GFIA | 0.3036 | 0.2939 | 18.61 | 94.76 | 90.04 |
Table 7.
Ablation study with different component combinations on the WHU Building Dataset.
| No. | Baseline | SA | GFIA | CLFR | F1 (%) | IOU (%) |
|---|---|---|---|---|---|---|
| 1 | ✓ | 94.02 | 88.71 | |||
| 2 | ✓ | ✓ | 94.44 | 89.46 | ||
| 3 | ✓ | ✓ | ✓ | 94.56 | 89.68 | |
| 4 | ✓ | ✓ | ✓ | ✓ | 94.76 | 90.04 |
Publisher’s Note: MDPI stays neutral with regard to jurisdictional claims in published maps and institutional affiliations. |
© 2022 by the authors. Licensee MDPI, Basel, Switzerland. This article is an open access article distributed under the terms and conditions of the Creative Commons Attribution (CC BY) license (https://creativecommons.org/licenses/by/4.0/).
Share and Cite
MDPI and ACS Style
Wang, Y.; Zeng, X.; Liao, X.; Zhuang, D. B-FGC-Net: A Building Extraction Network from High Resolution Remote Sensing Imagery. Remote Sens. 2022, 14, 269. https://doi.org/10.3390/rs14020269
AMA Style
Wang Y, Zeng X, Liao X, Zhuang D. B-FGC-Net: A Building Extraction Network from High Resolution Remote Sensing Imagery. Remote Sensing. 2022; 14(2):269. https://doi.org/10.3390/rs14020269
Chicago/Turabian StyleWang, Yong, Xiangqiang Zeng, Xiaohan Liao, and Dafang Zhuang. 2022. "B-FGC-Net: A Building Extraction Network from High Resolution Remote Sensing Imagery" Remote Sensing 14, no. 2: 269. https://doi.org/10.3390/rs14020269
Note that from the first issue of 2016, this journal uses article numbers instead of page numbers. See further details here.