Article

Semantic Segmentation Using Deep Learning with Vegetation Indices for Rice Lodging Identification in Multi-date UAV Visible Images

1
Department of Civil Engineering, and Innovation and Development Center of Sustainable Agriculture, National Chung Hsing University, Taichung 402, Taiwan
2
Pervasive AI Research (PAIR) Labs, Hsinchu 300, Taiwan
*
Author to whom correspondence should be addressed.
Remote Sens. 2020, 12(4), 633; https://doi.org/10.3390/rs12040633
Submission received: 31 December 2019 / Revised: 10 February 2020 / Accepted: 12 February 2020 / Published: 14 February 2020

Abstract

:
A rapid and precise large-scale agricultural disaster survey is a basis for agricultural disaster relief and insurance but is labor-intensive and time-consuming. This study applies Unmanned Aerial Vehicles (UAVs) images through deep-learning image processing to estimate the rice lodging in paddies over a large area. This study establishes an image semantic segmentation model employing two neural network architectures, FCN-AlexNet, and SegNet, whose effects are explored in the interpretation of various object sizes and computation efficiency. Commercial UAVs imaging rice paddies in high-resolution visible images are used to calculate three vegetation indicators to improve the applicability of visible images. The proposed model was trained and tested on a set of UAV images in 2017 and was validated on a set of UAV images in 2019. For the identification of rice lodging on the 2017 UAV images, the F1-score reaches 0.80 and 0.79 for FCN-AlexNet and SegNet, respectively. The F1-score of FCN-AlexNet using RGB + ExGR combination also reaches 0.78 in the 2019 images for validation. The proposed model adopting semantic segmentation networks is proven to have better efficiency, approximately 10 to 15 times faster, and a lower misinterpretation rate than that of the maximum likelihood method.

Graphical Abstract

1. Introduction

Typhoon-associated strong winds and heavy rains frequently cause a considerable amount of crop damages that negatively impacted farmers’ incomes and crop price balance on the agricultural market. Taiwan is located in an area that is one of the most susceptible to typhoons in the world. Based on the Taiwan council of agriculture (COA) agriculture statistics [1,2,3,4,5], the average annual crop damage cost US$352,482 in the past five years (2014–2018). Additionally, the average crop loss accounts for approximately 28% of the total crop production in Taiwan, which affects 31,009 hectares in average. Accordingly, the Taiwan government established the Implementation Rules of Agricultural Natural Disaster Relief for more than 30 years and has been trying to implement agricultural insurances recently. In an ideal situation, farmers’ incomes can be partially compensated by the emergency allowances based on the relief rules. However, limitations such as shortage of disaster relief funds, high administrative costs, and crop damage assessment disputes with the ongoing disaster relief rule urgently demand improvements.
Among the limitations, crop damage assessment disputes with associated high administrative costs are critical to the relief implementation. The current crop damage assessment relies heavily on in-situ manual visual field observations to quantify lodging percentage and lodging severity. However, the manual visual field observations are time-consuming and objective, which frequently lead to conflicts between observers and farmers. Additionally, observers from townships and county governments need to fulfill a required process, including a preliminary disaster assessment, a comprehensive disaster investigation, and a review sampling assessment. Generally, the required process takes approximately 1 to 2 months, depending on the size of damaged areas, which is time-consuming, subjective, and labor-intensive. Consequently, farmers’ livelihood is heavily impacted because they cannot resume cultivation but need to keep their damaged crops in the field until the whole process complete. Therefore, it is urgent to develop an efficient, objective, and scientific-based quantitative method to reduce crop damage assessment disputes and to accelerate the disaster compensation process.
Recently, thanks to the development of advanced remote sensing (RS) techniques, airborne-based unmanned aerial vehicles (UAVs) have been applied to many real-world problems such as disaster impacts related land cover change [6,7,8] and crop lodging assessment. Compared to traditional RS techniques [9,10,11,12,13], UAVs exhibit many advantages such as reasonable cost, fine spatial resolution, and real-time monitoring ability. Hence, UAVs have demonstrated many successful applications on combining multispectral data, textural features, plant traits information (such as plant height), and thermal data to assess crop lodging. Yang et al. [14] combined spectral, plant heights, and textural features obtained from UAV and proposed a mixed classification method to determine the lodging rate of rice, which has an accuracy of 96.17%. Liu et al. [15] presented their work using RGB images obtained by UAV and combined with thermal infrared images for rice lodging, which reveals the false positive/negative rate of less than 10%. Wilke et al. [16] applied a UAV-based canopy height model combined with an objective threshold approach to quantify lodging percentage and severity.
On the other hand, with the cutting-edge computing power, machine learning and deep learning (DL) network technology have been revitalized and performed many successful agricultural applications recently. Zhao et al. [17] proposed deep learning UNet (U-shaped Network) architecture to assess rice lodging using UAV imagery. The author reported that using RGB images reached 0.96 dice coefficients. Mardanisamani et al. [18] used a deep convolutional neural network (CNN) augmented with handcrafted texture features to predict crop lodging, which achieves comparable results while having a substantially lower number of parameters. Kwak and Park [19] reported their work of using two machine learning classifiers, including random forest and support vector machine, to improve crop classification. Linking gray-level co-occurrence matrix (GLCM)-based texture information and time-series UAV images, the authors have been able to achieve the overall accuracy of 98.72%. Yang et al. [20] used deep CNN for rice grain yield estimation based on UAV images at the ripening stage. The authors stated that the deep CNN model has been able to provide a steadier yield forecast than the traditional vegetation index-based method.
Besides, DL technology plays a vital role in the development of precision agriculture (PA) which emerged in the mid-1980s. Due to the information-based approach of PA, DL technology, especially deep CNN or so-called DNNs (deep neural networks), enhances the substantial number of input image-based analysis such as weed detection, disease detection, and species recognition. Huang et al. [21] proposed a fully convolutional network (FCN) to generate accurate weed cover maps, which achieved 93.5% overall accuracy and 88.3% weed recognition accuracy. Sa et al. [22] overcame the limitation of the input image size of DNNs by introducing a sliding window technique for a large-scaled semantic weed mapping framework. Ma et al. [23] compared the performance of SegNet, FCN, and UNet on the classification results of rice seedlings, background, and weeds. The authors reported that SegNet achieved 92.7% accuracy, which outperformed the other two models, was well-suited for processing the pixel classification of images of tiny and abnormally shaped rice seedlings and weeds in paddy fields. Ferentinos [24] tested AlexNet, AlexNetOWTBn, GoogLeNet, Overfeat, and VGG models for 25 different plant disease detection and diagnosis and reached the best performance with a 99.53% success rate. Kerkech et al. [25] used a CNN based model combined with three vegetation indices and color information from UAV images to detect diseases in vineyards, which revealed 95.8% accuracy. Fuentes-Pacheco et al. [26] used a SegNet-based CNN architecture to perform pixel-wise fig plant semantic segmentation and achieved a mean accuracy of 93.85%. Grinblat et al. [27] presented a successful work on utilizing deep CNNs to identify and classify species based on morphology patterns. However, to the best of our knowledge, the potential of using a semantic segmentation neural network for rice lodging identification of UAV imagery is not yet been accessed.
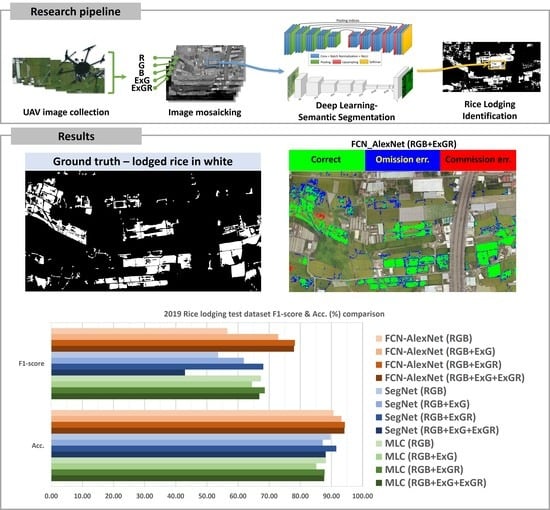
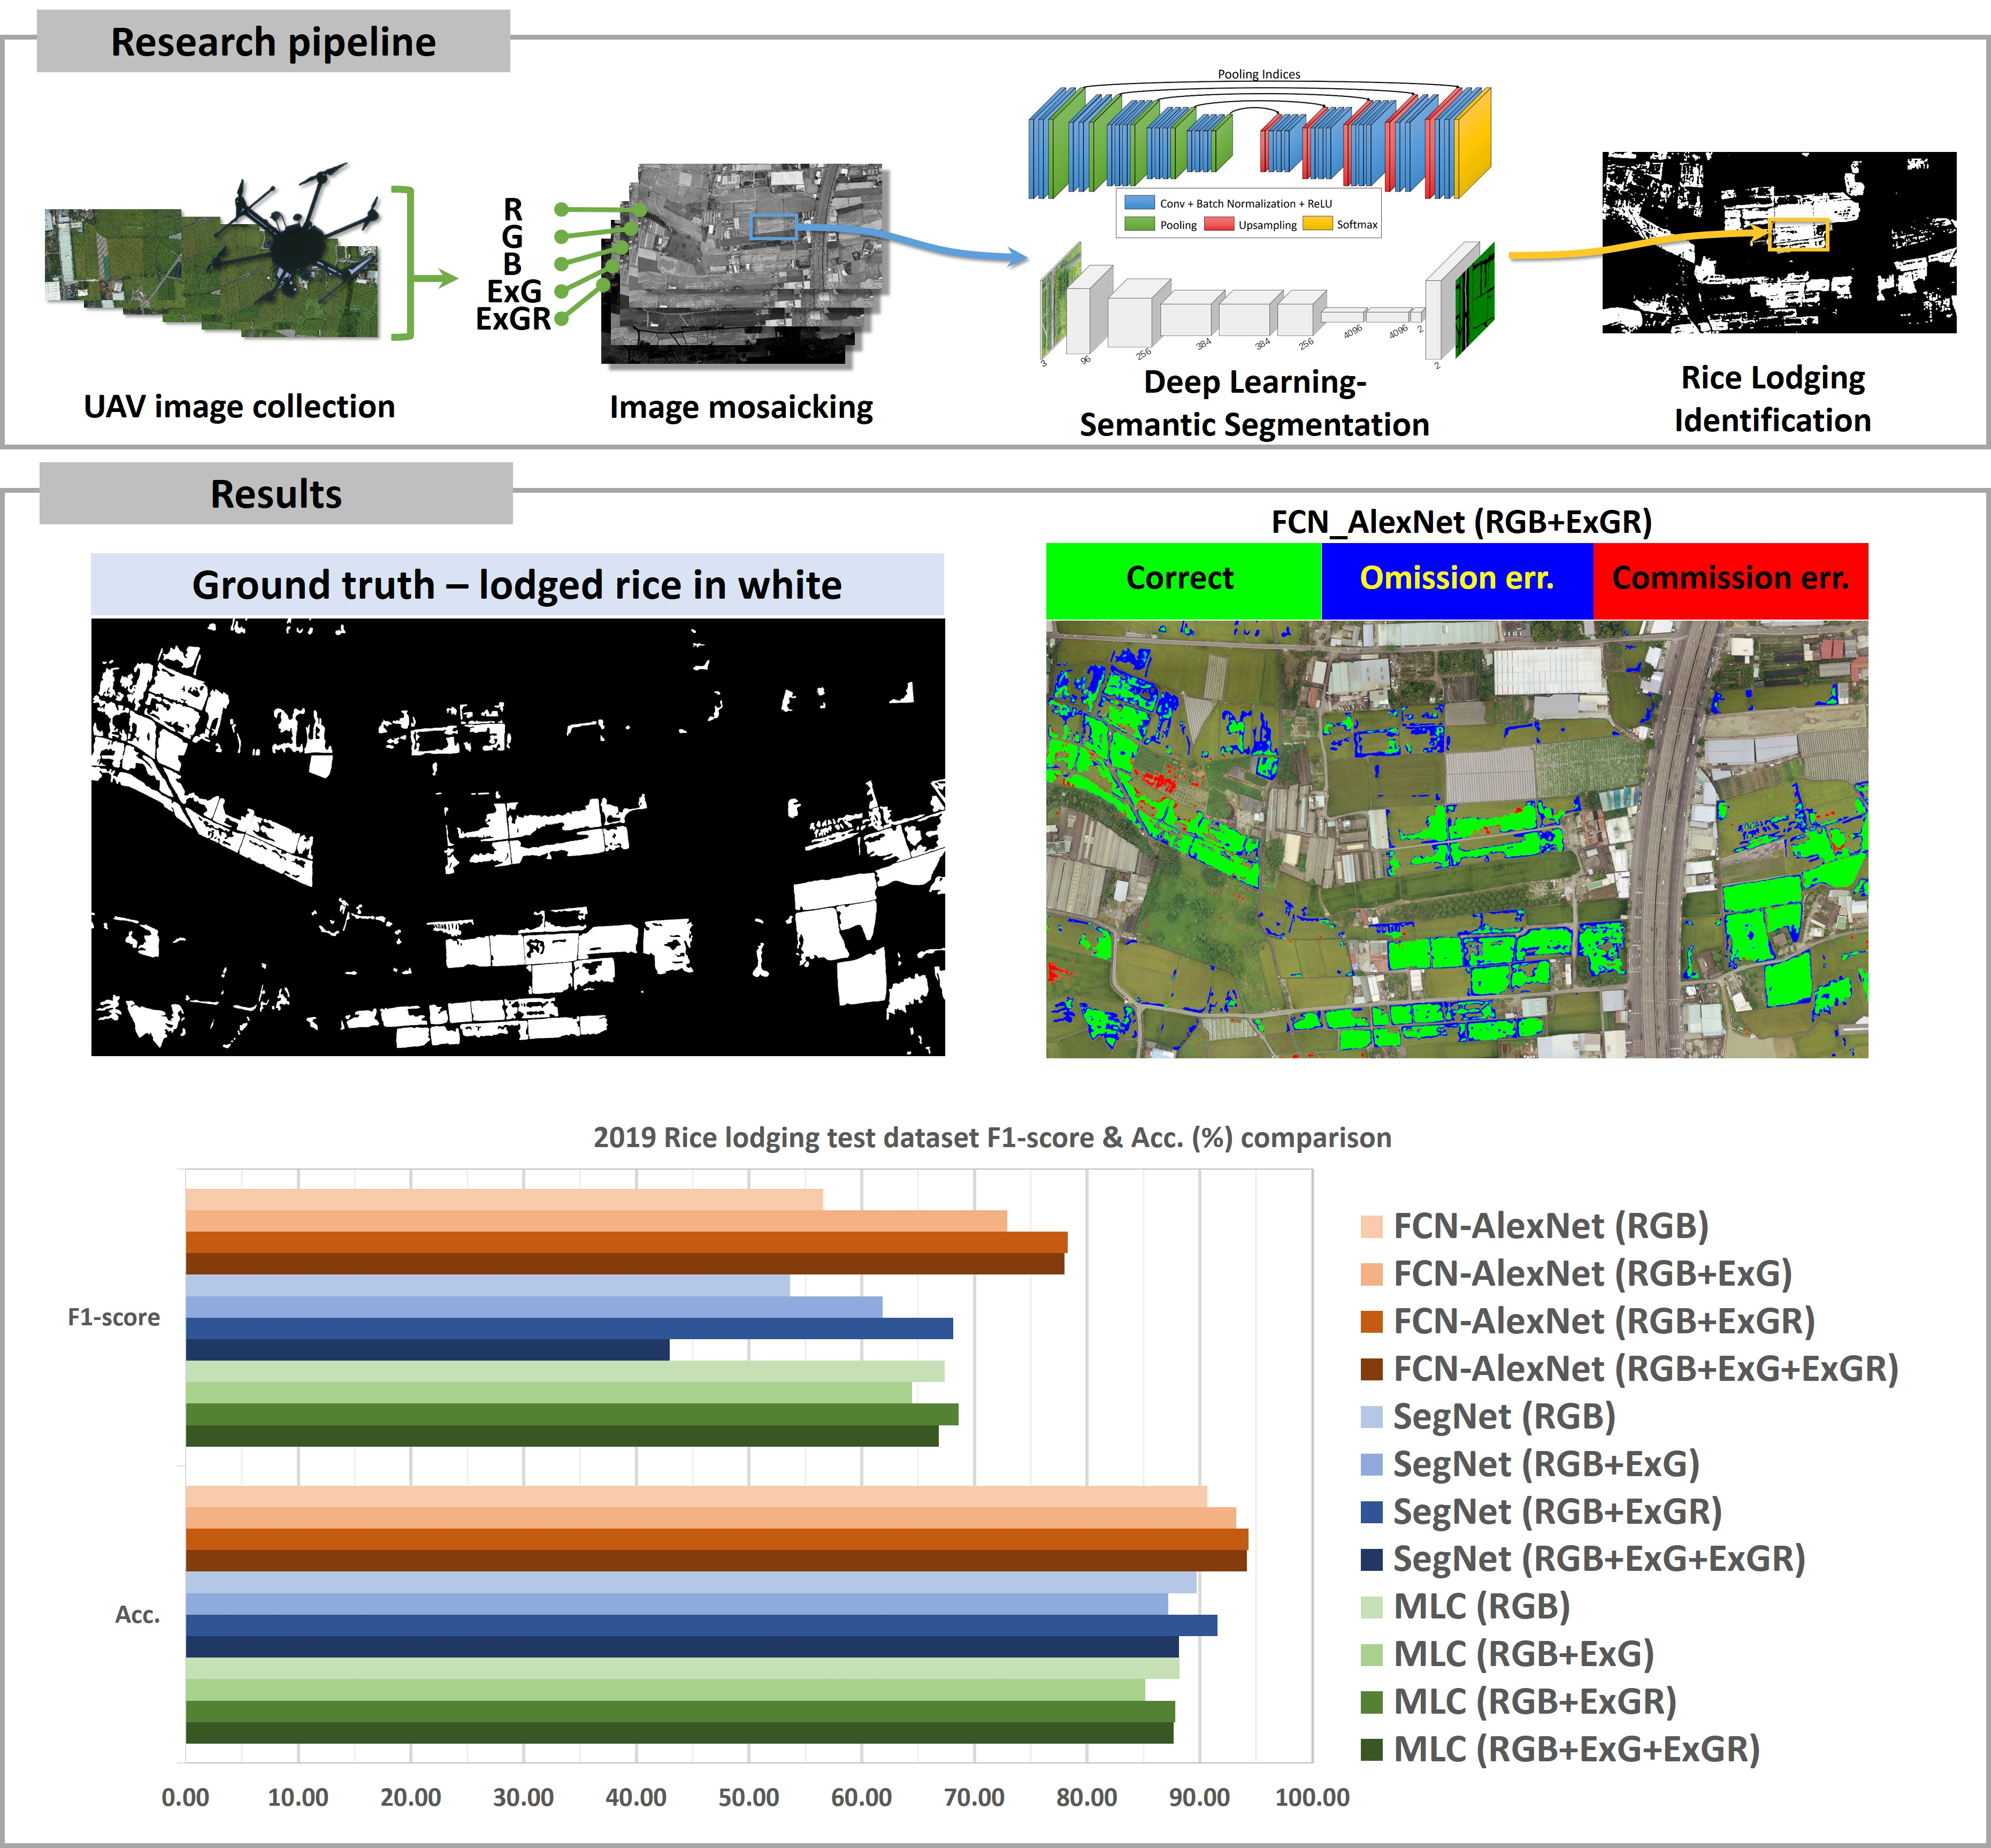
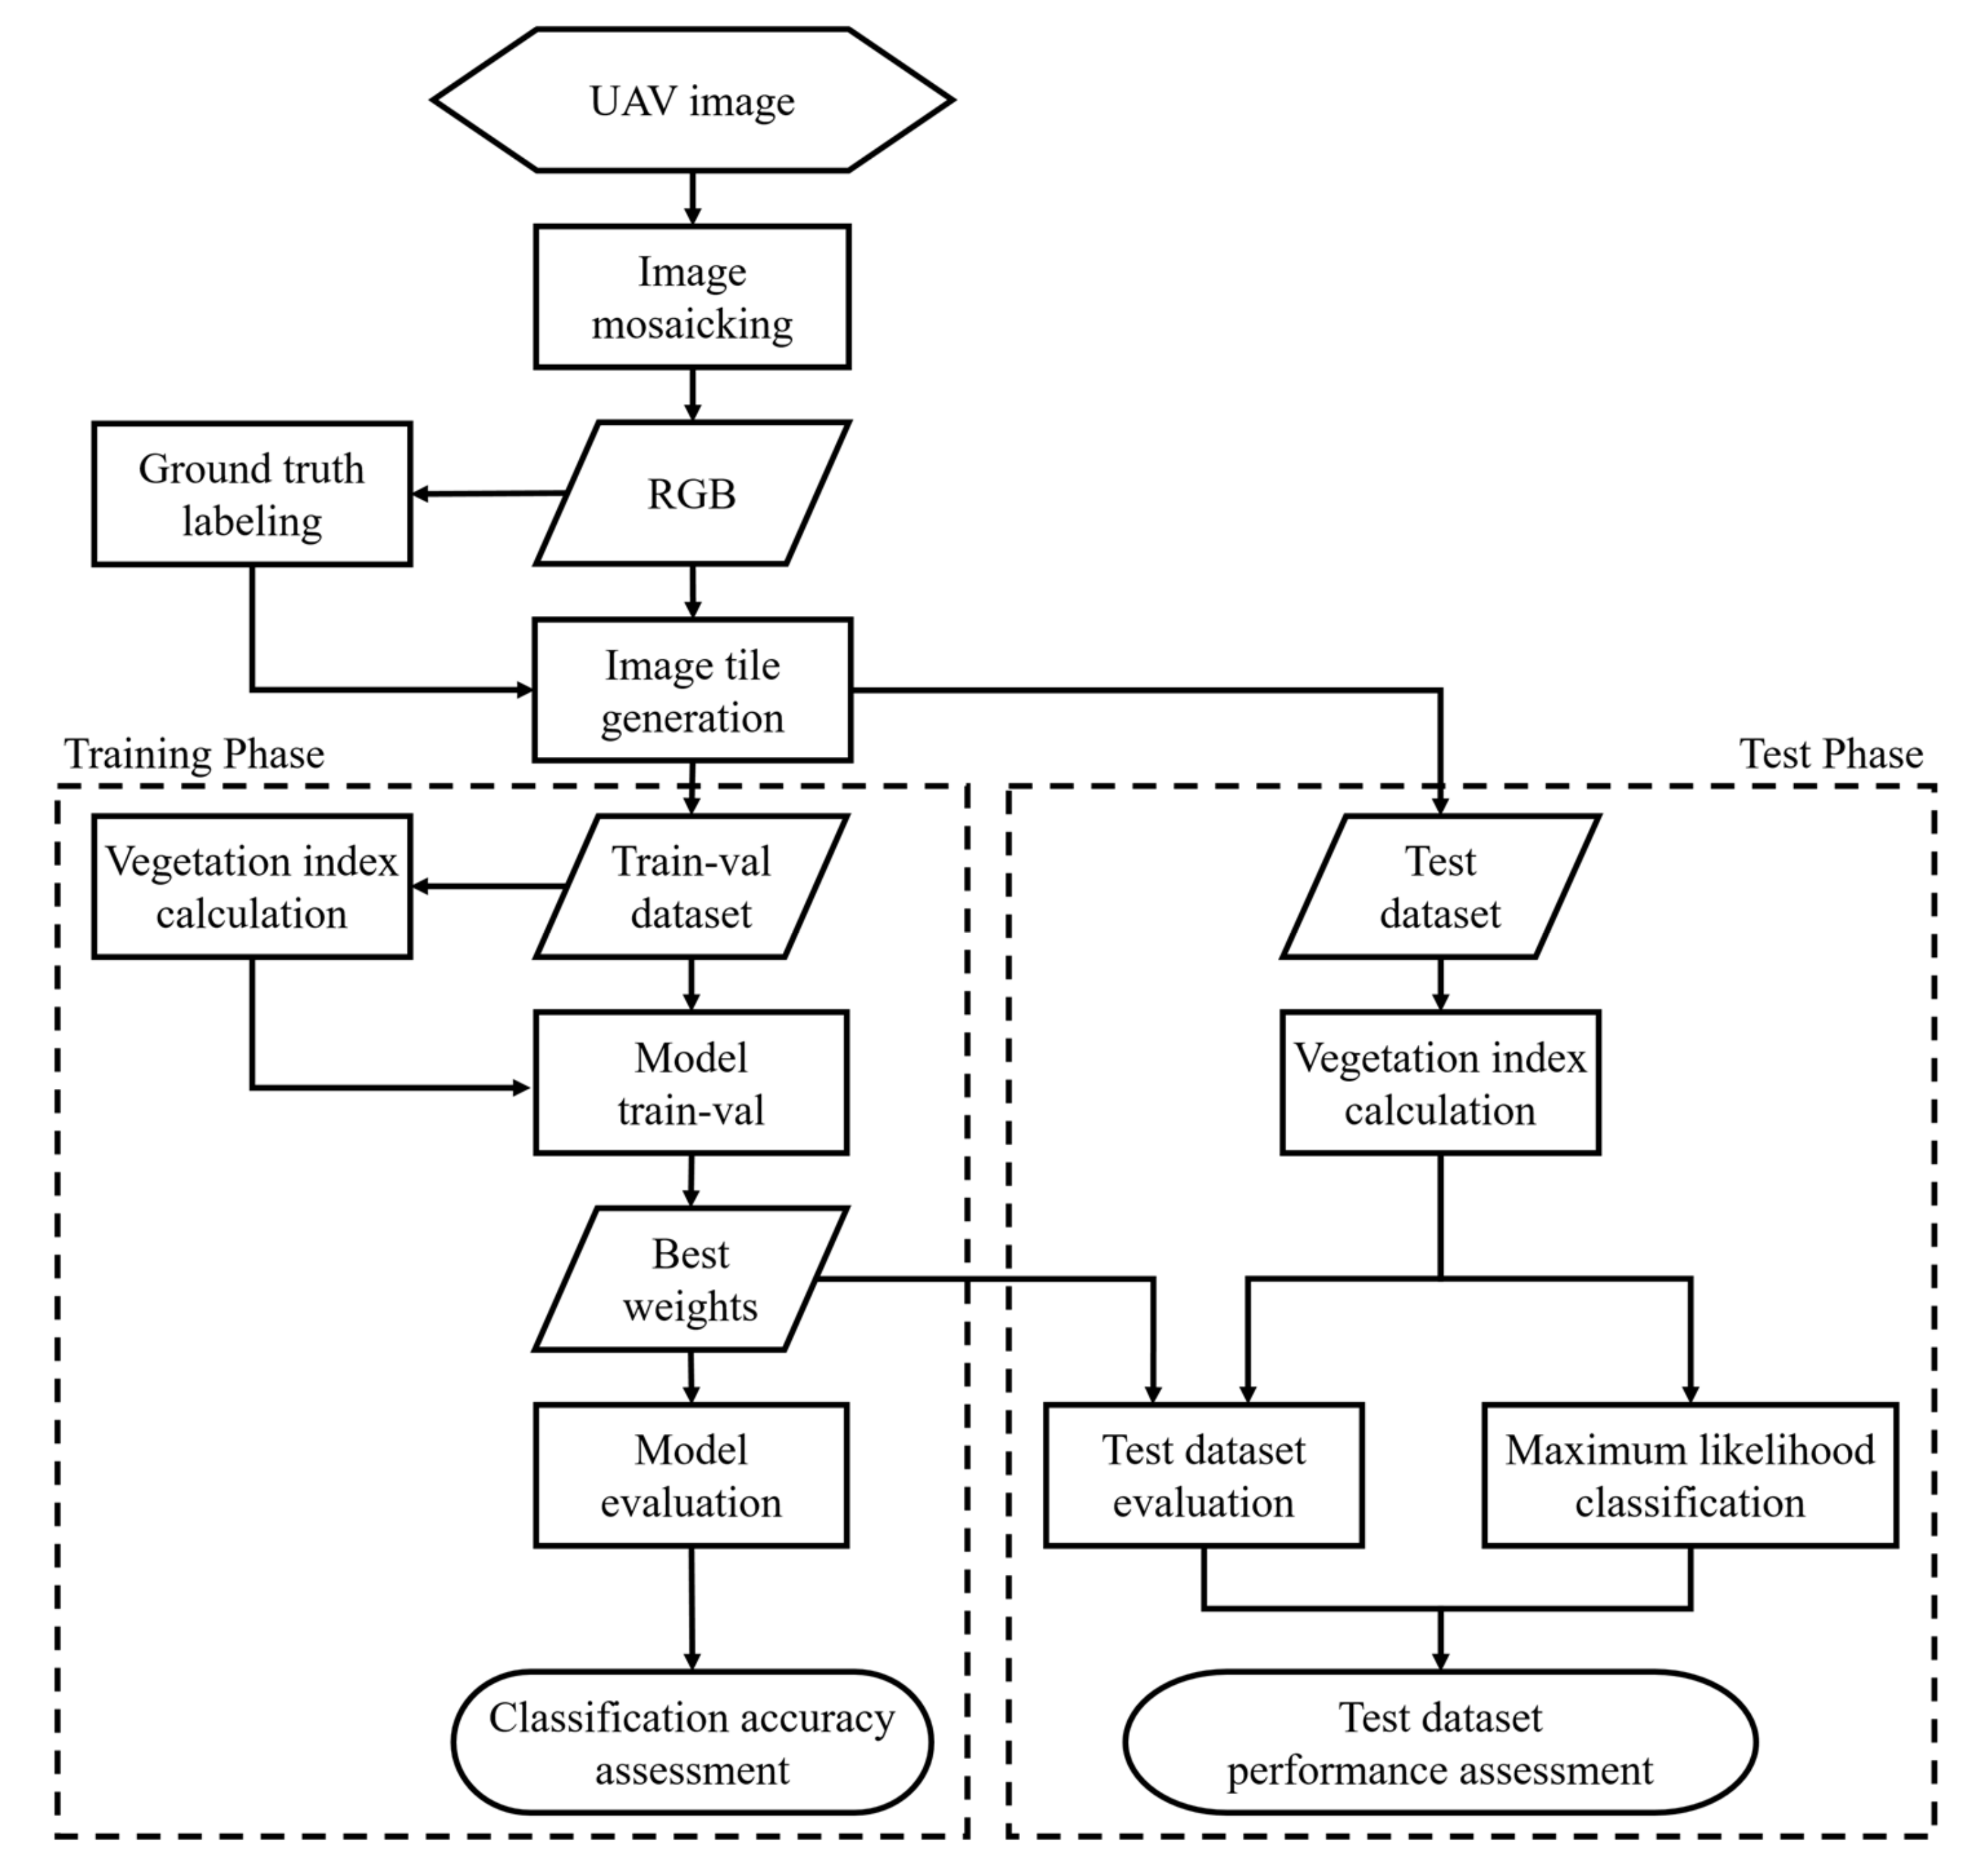
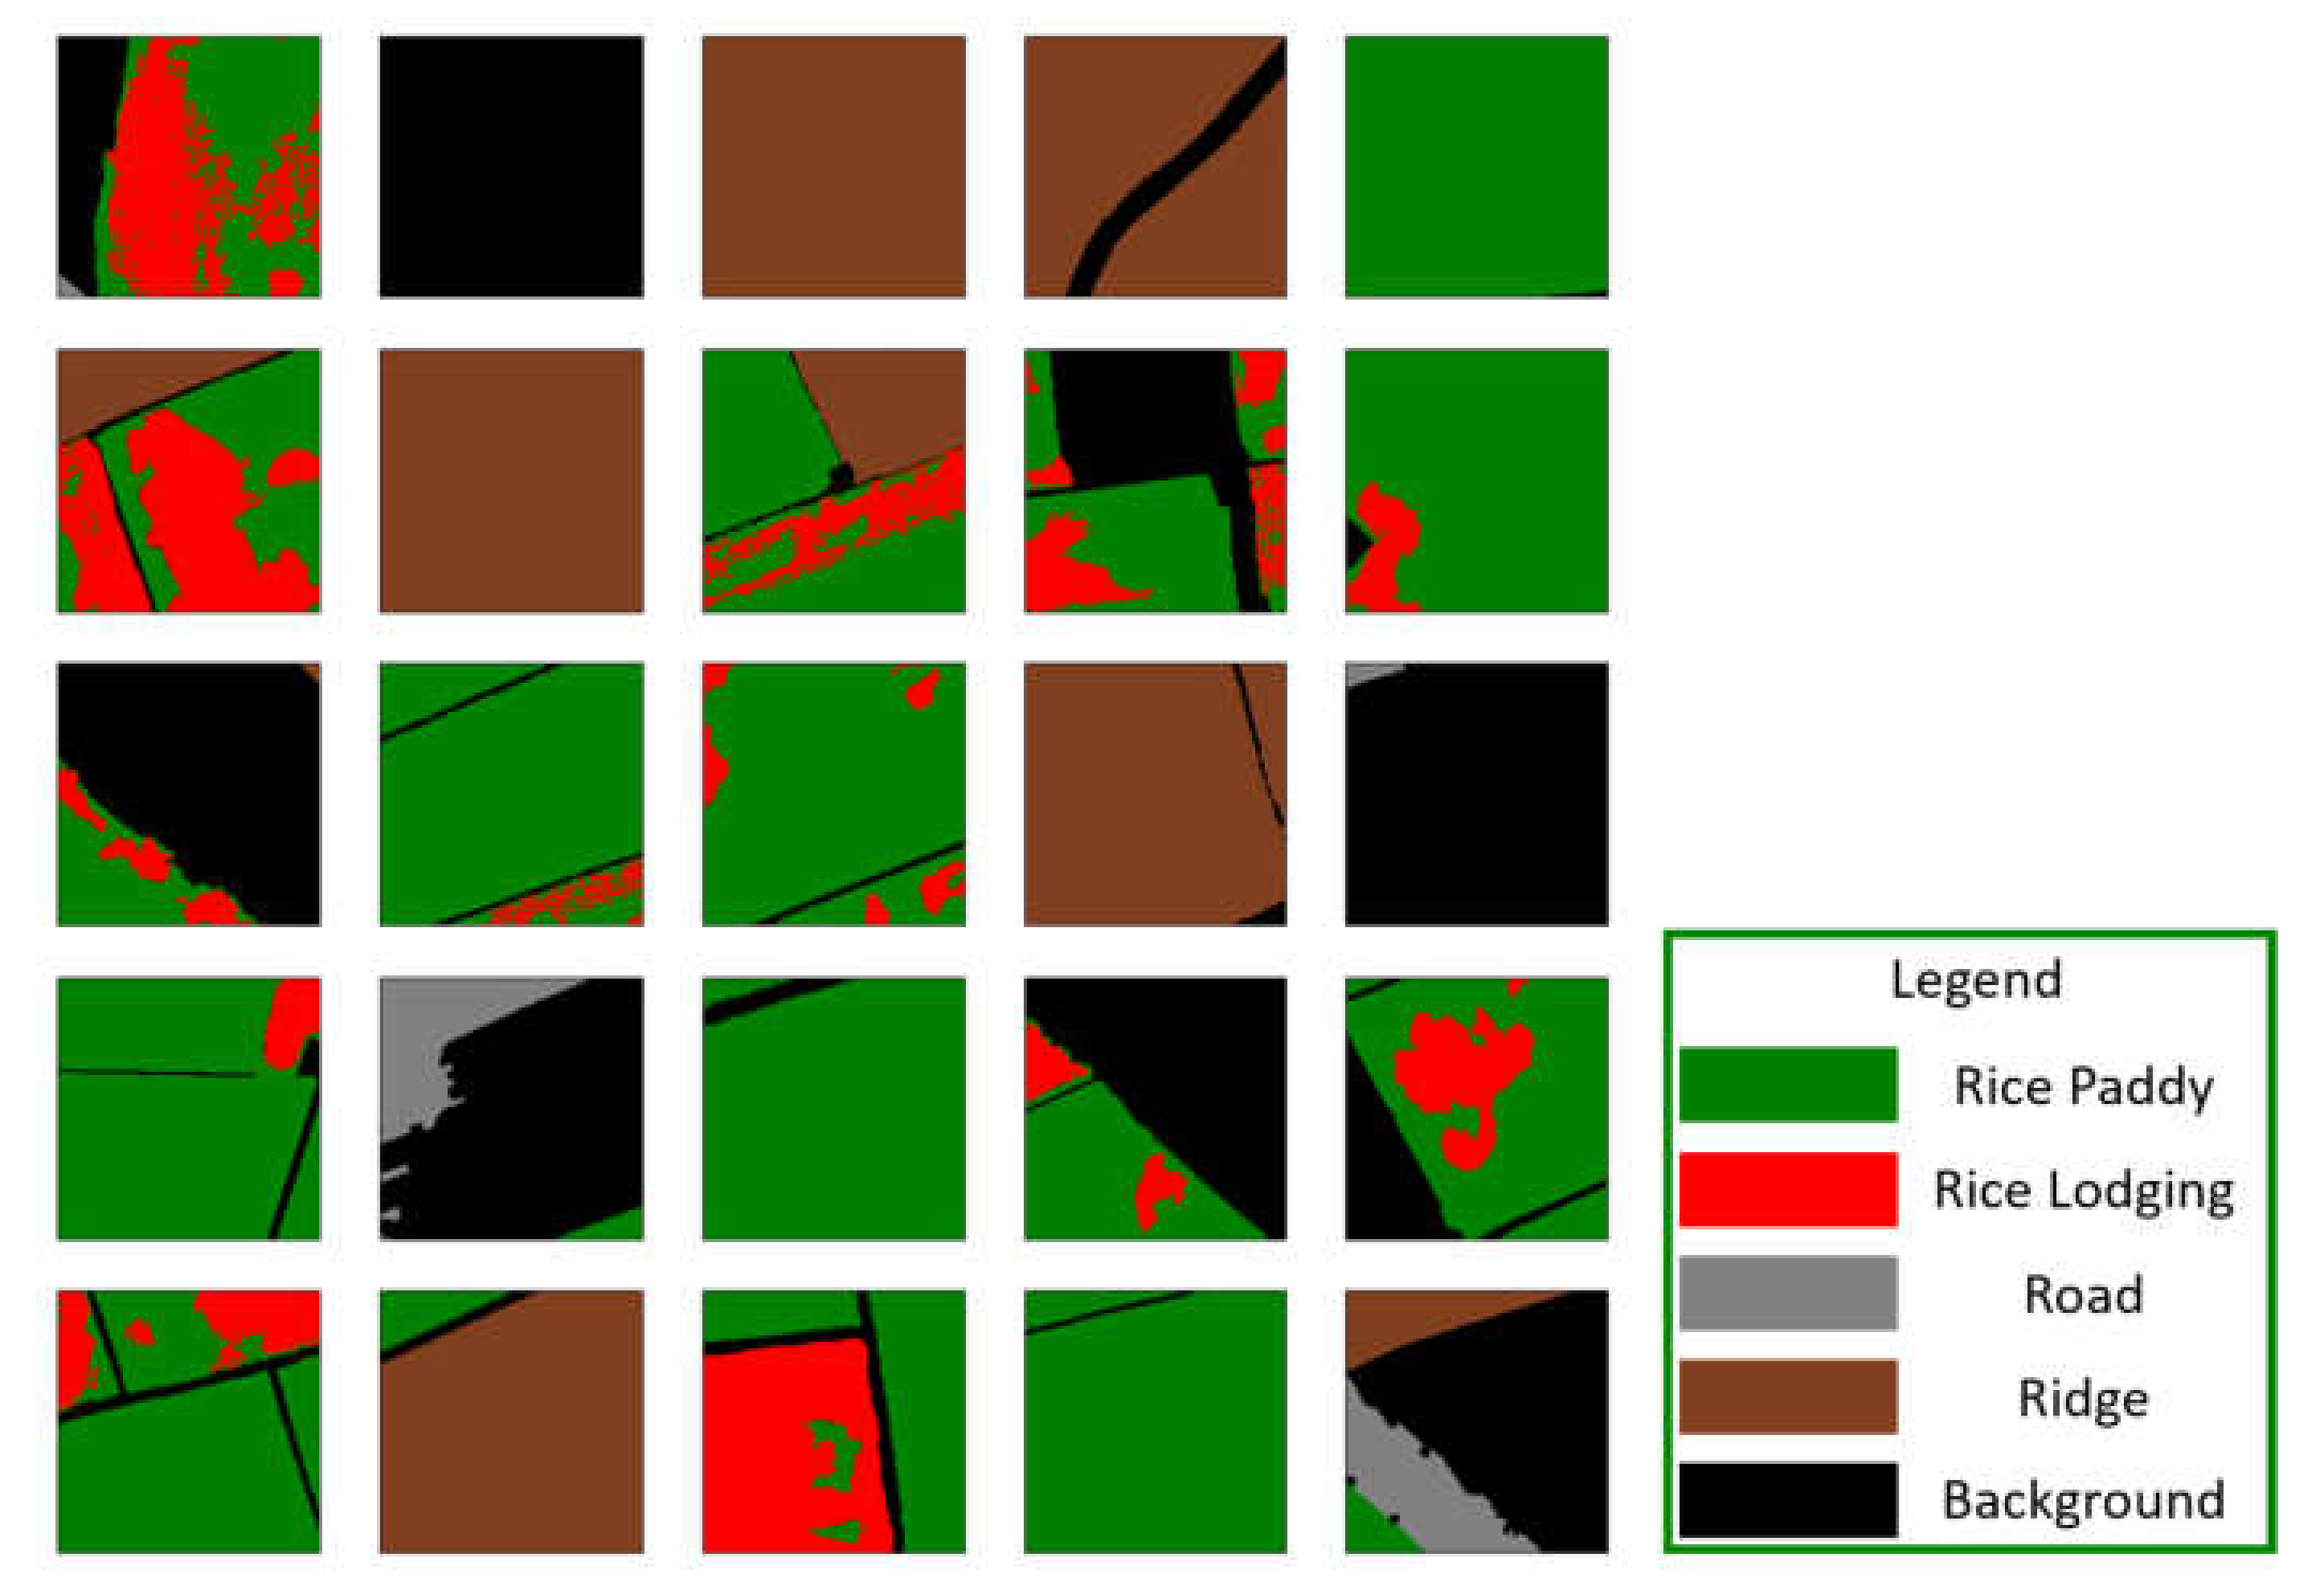
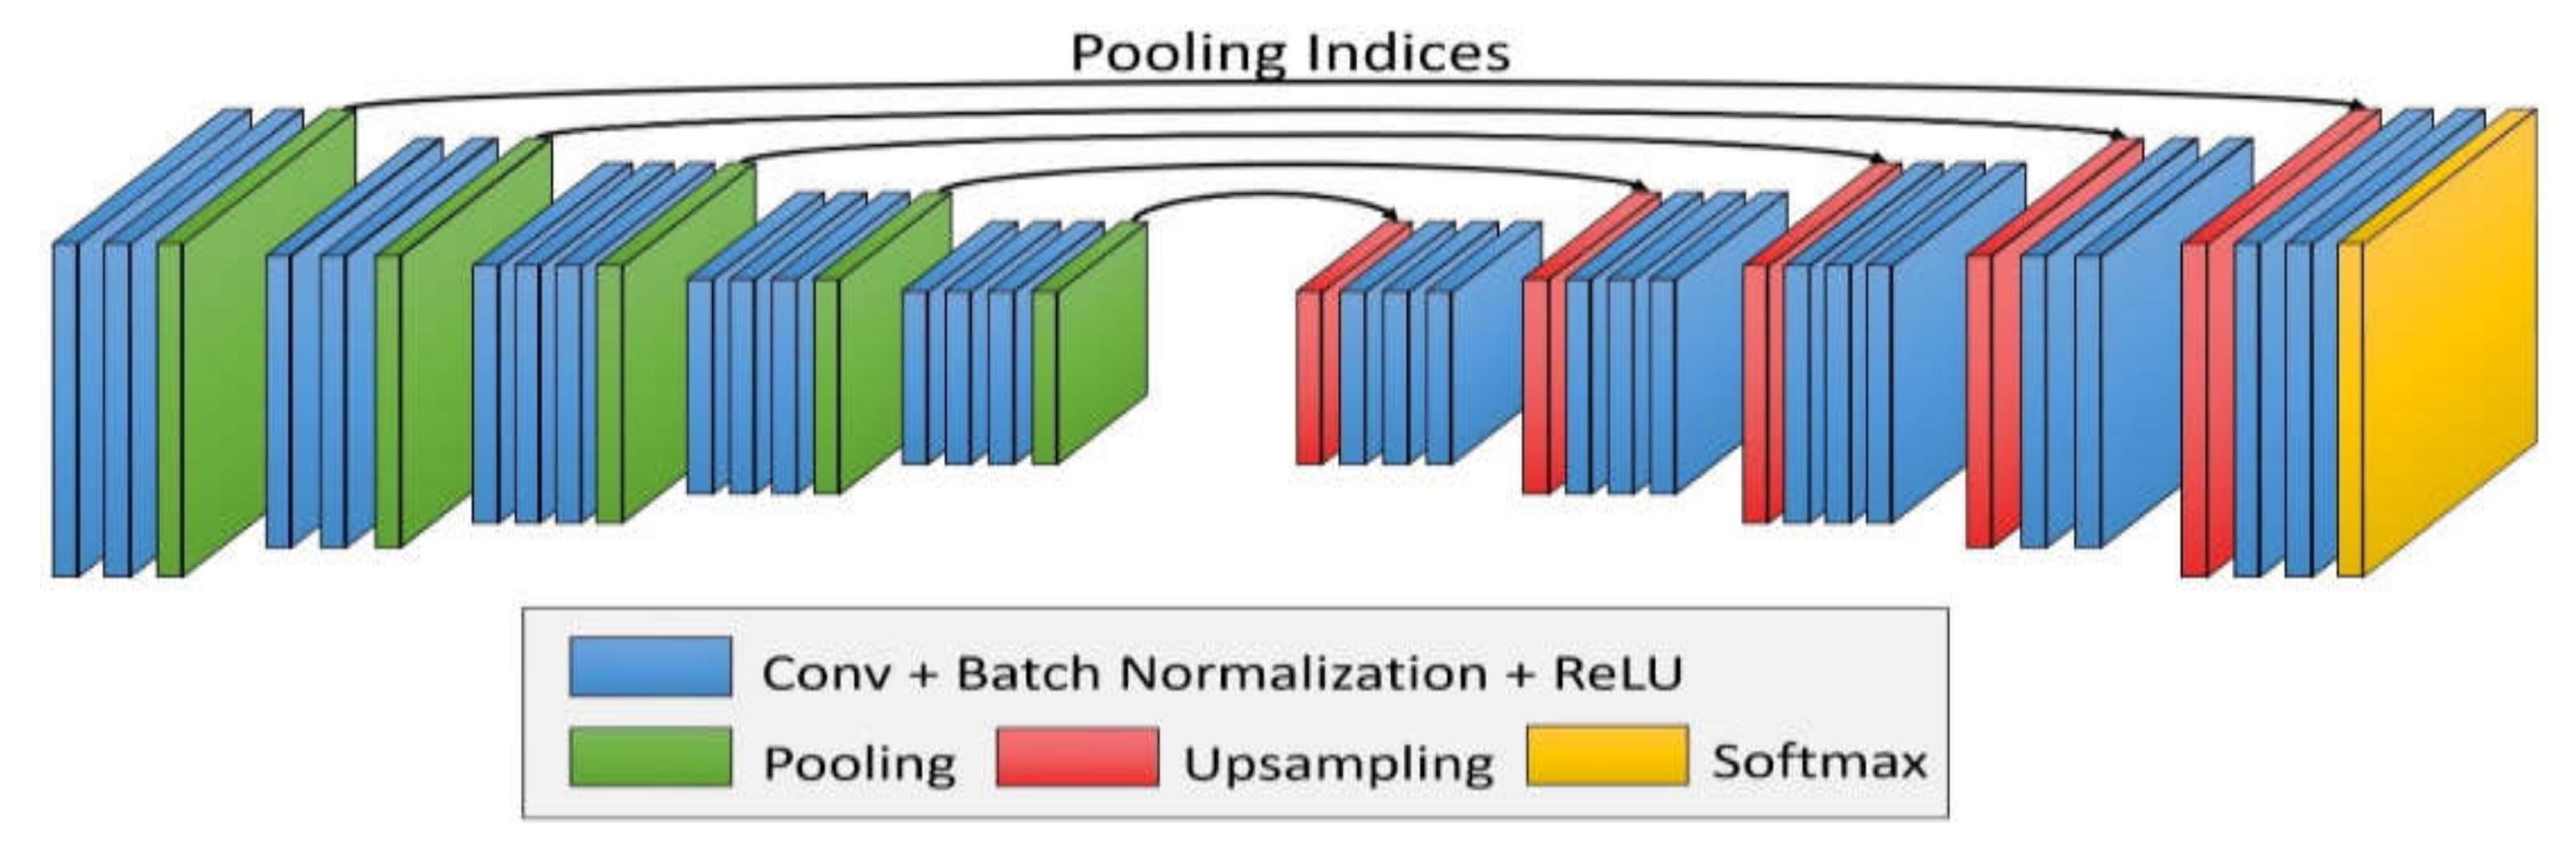
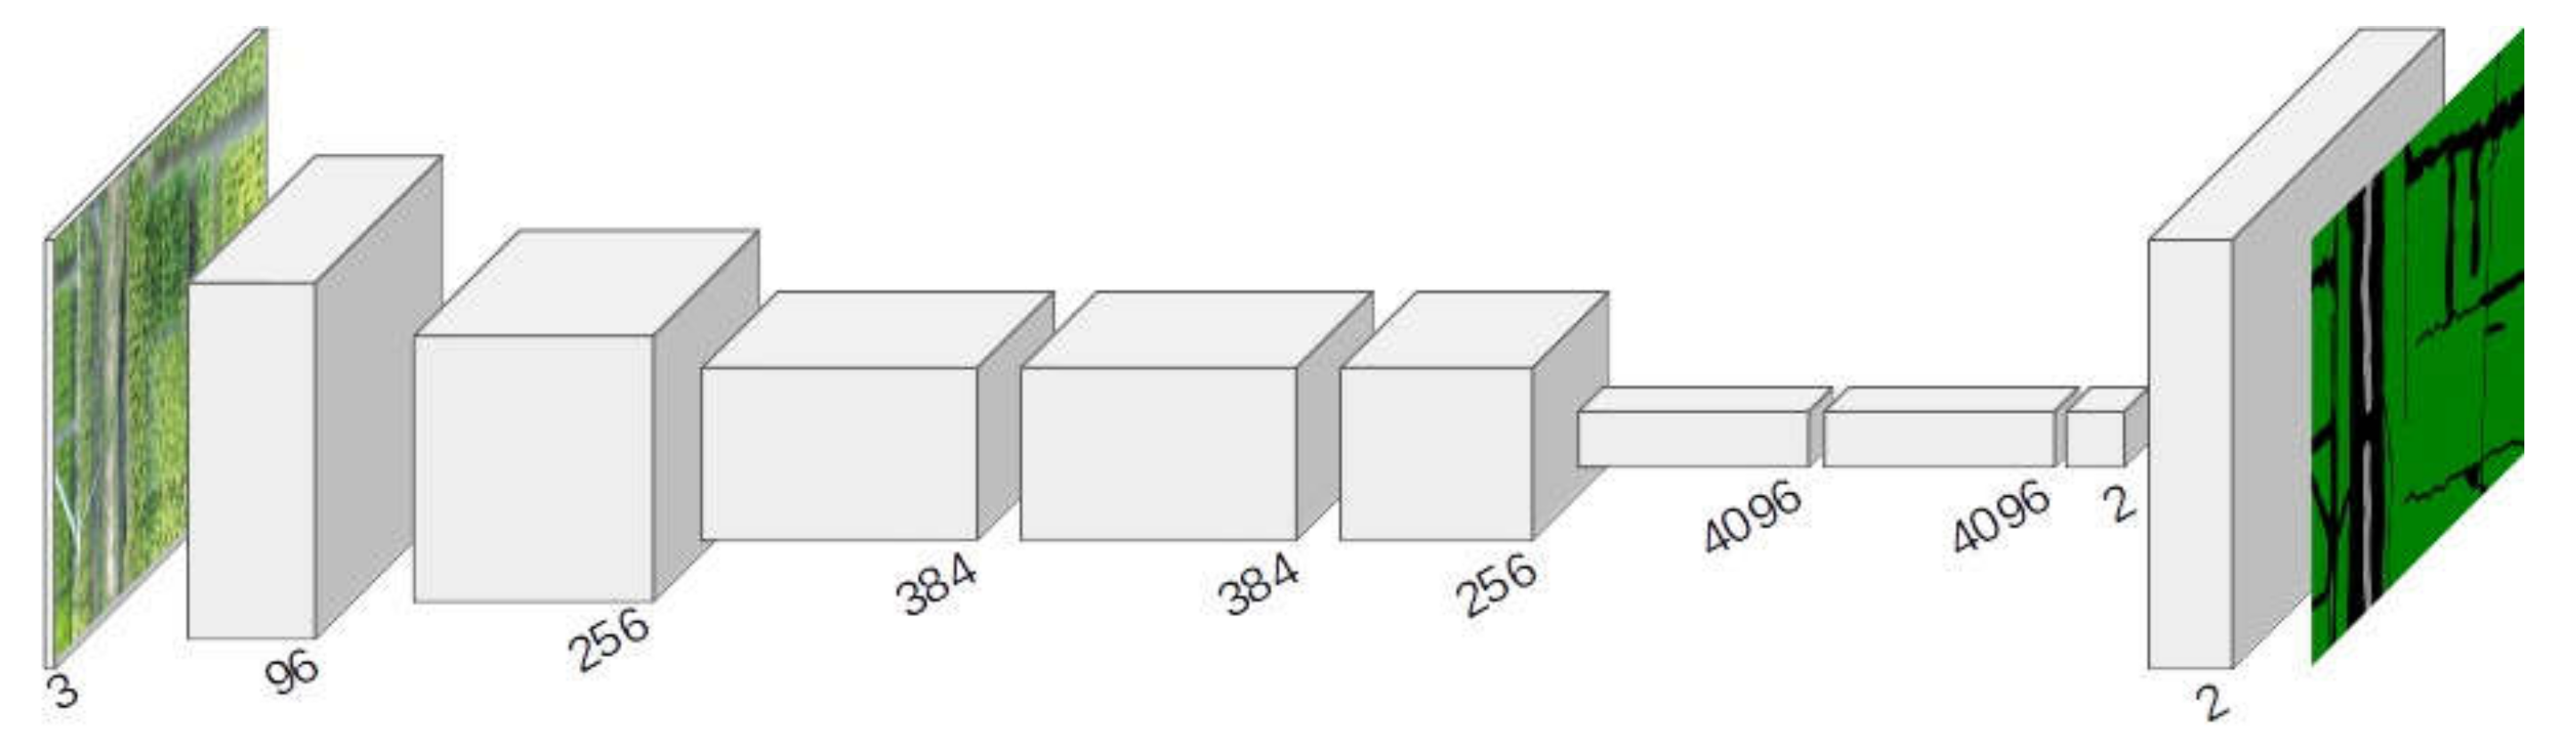
Therefore, to benefit from UAV data and deep learning network technologies, in this paper, a rice lodging assessment method is proposed by combining UAV images with deep learning techniques. Specifically, lodged rice visible spectrum information and vegetation indexes obtained from UAV images are combined to train a total of eight classification models in two semantic segmentation neural networks, SegNet and FCN-AlexNet. The performance of these eight models is evaluated by their image classification accuracy as well as the associated computation time. The overall objective of this paper is to achieve the following purposes:
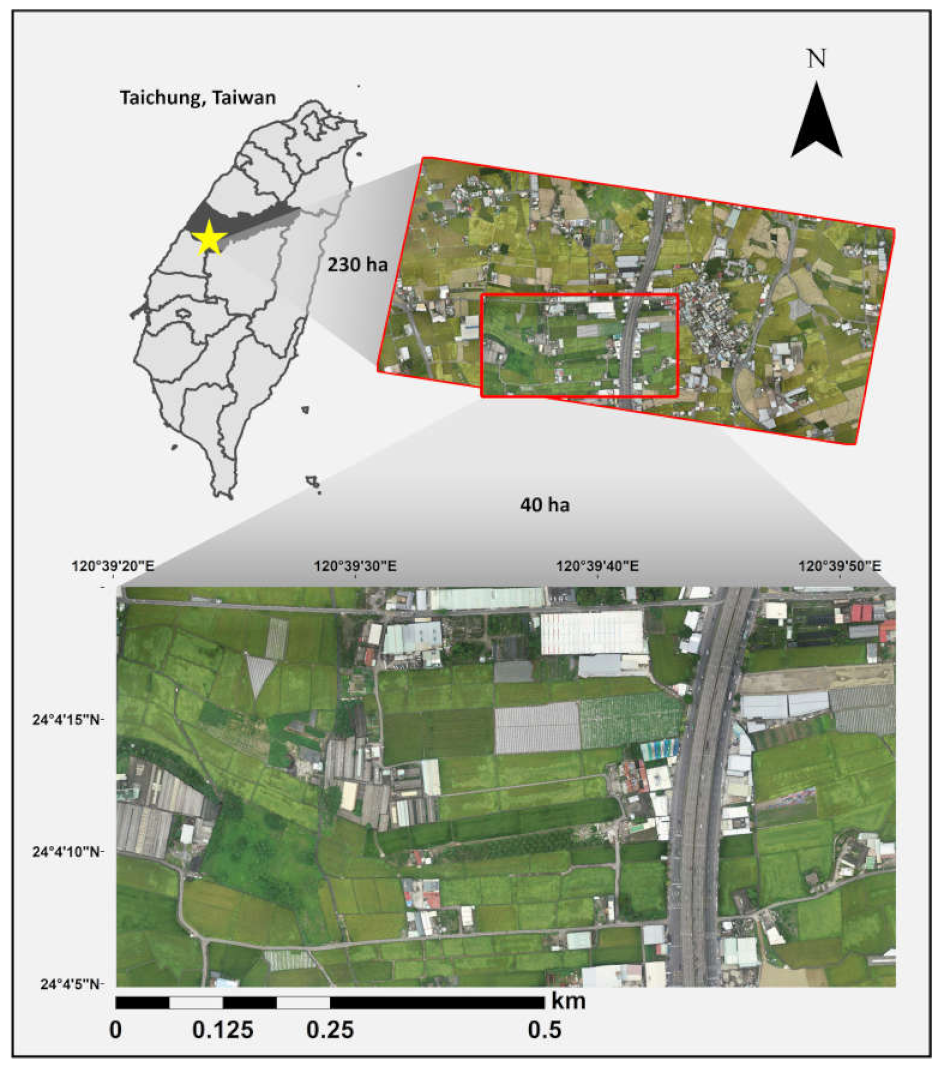
  • Rice lodging spectrum information is obtained from UAV images collected from a study area (about 40 hectares) in Taiwan to reduce the workload of in-situ manual visual field observations.
  • UAV images are used to perform rice lodging classification by sematic segmentation neural network models, which aim to improve the accuracy of lodging assessment and serves as evidence of subsequent disaster subsidies.
  • Multiple information, including visible light spectrum and vegetation index information, are involved in the proposed rice lodging assessment method to improve image classification accuracy.
  • Two standard image semantic segmentation network models are tested. Their applicability is evaluated based on their computational speed and classification accuracy.
  • Establish a rice lodging image dataset that can serve as a valuable resource for expert systems, disaster relief assistance, and agricultural insurance application data.

2. Materials and Methods

2.1. Data Description

Rice lodging UAV images of the Mozi Shield Park in Wufeng District, Taichung City, Taiwan, were collected by Sony QX100 (472 × 3648 pixels) and DJI Phantom 4 Pro (5472x3648 pixels) cameras in June 2017 and May 2019, respectively (Figure 1 and Table 1). Both cameras capture images with three spectral channels: red, blue, and green. The total area covered 230 ha, in which a portion of approximately 40 ha was extracted for image inference model testing. Images were taken at a flight height of 230 meters and 200 meters in 2017 and 2019 with an associated ground resolution approximately 5.3 cm/pixel and 5.5 cm/pixel, respectively (Table 2). Agisoft Photscan (Agisoft LLC, St. Petersburg, Russia) was used to stitch images and obtain high-resolution orthomosaic images. A histogram matching process is implemented using 2017 images as the base to reduce the lighting discrepancy between two date images [28] (Figure 2). Images taken in 2017 were used for model training and validation, while the images of the same area (40 ha) from these two dates (2017 and 2019) were used for model testing.
Figure 3 depicts the research flow of this study, starting with UAV image capture. The captured UAV images, which consist of red, green, and blue spectrum information (RGB), are stitched to produce RGB orthomosaic images. The image tiles are created after ground-truth labeling, and training-validation and test data sets are created from RGB and labeled images. Other than the RGB spectrum information, the model training phase uses three vegetation indexes obtained from the images as an input feature. A total of eight classification models with two neural network architectures and four image information combinations are trained. Each classification model with the best weights is used for model evaluations. In the test phase, both 2017 and 2019 image data are used. The eight classification models are compared with the commonly used Maximum Likelihood Classification (MLC) [29] and evaluate associate performance.

2.2. Training-validation, and Testing Datasets

With a focus on rice lodging for the model training of semantic segmentation, the ground truth of UAV images was obtained by manual labeling using GIMP (GNU Image Manipulation Program) open-source program in a pixel-basis with five separate categories: rice paddy, rice lodging, road, ridge, and background (Figure 4). Figure 5 highlights the rice lodging portion of images in white in a binary map. Additionally, the original UAV image size is 5472 x 3648, which could lead to the exhaustion of the GPU memory. In order to cope with GPU memory limitations and maintain the feature information and spatial resolution, each UAV image was split into 3485 tiles with size 480 x 480 pixels. Eighty percent of the samples were randomly selected as the training-validation dataset, in which 75% and 25% of the samples were randomly selected for training and validation, respectively, and the rest of 20% samples were used as the test dataset. As a result, a total of 2082 images were used for training, 694 images were used for validation, while 709 images were used for testing.

2.3. Vegetation Indices

Three vegetation indices (VIs), Excess Green index (ExG), Excess Red index (ExR), and Excess Green minus Excess Red index (ExGR), are calculated from UAV visible spectrum information to add into the process of model training and validation. Together with RGB information, three VIs were used to examine their correlations with rice lodging. The formulas of three VIs can be found in Table 3.

2.4. Semantic Segmentation Model Training

Two semantic segmentation models, SegNet and FCN-AlexNet, were utilized in the present study, and their network architectures are demonstrated in Figure 6 and Figure 7, respectively. SegNet has asymmetric network architecture structure, including an encoder consisting of convolution layers and pooling layers, a decoder consisting of upsampling layers and convolution layers, and then a softmax layer. The encoder structure is identical to the 13 convolutional layers in the VGG16 network without the fully connected layers. Following the encoder, the decoder has a structure symmetric to that of the encoder but employs upsampling layers instead of transpose convolution.
The softmax layer is the layer that normalizes the input vector to the normalized probability distribution. The critical component of SegNet is a specific code and index structure of max pooling, which makes SegNet very useful for precise re-localization of features and fewer parameters needed for end-to-end training [32]. FCN-AlexNet, a customized model based on AlexNet architecture, has advantages of a deeper network and replaces the fully connected layers of AlexNet with a 1 × 1 convolution layer and a 63 × 63 upsampling layer for a pixel-wise end-to-end semantic segmentation. Additionally, FCN can accept input images with any size and retain the pixel spatial information in the original input image, which can classify each pixel on the feature map [33].
In all experiments, following the hyperparameter setting suggested by Kingma and Ba [34], an Adam optimizer with a learning rate of 0.001, β1 = 0.9, and β2 = 0.999 was used. Considering the network structures and GPU memories, the decay of 0.05, the batch size of 24, and the number of epochs equal to 50 were applied. A detailed model training, validation, and testing computing environment can be found in Table 4.

2.5. Evaluation Matrices

The performance of the eight proposed models and MLC was evaluated by adopting precision and recall concepts for each category, namely rice paddy, rice lodging, road, ridge, and background. As shown in Table 5, T P stands for true positive, F P represents false positive, T N denotes true negative, and F N means false negative. F β signifies the measurement on the balance of precision and recall with precision weighting coefficient β. While the precision weighting coefficient β equals to one, it is so-called F 1 -score.
For a particular category c, precision was defined as the ratio of true positive ( T P c ) instances to all positive results including the true and false positive ( F P c ) . The recall represents a sense of sensitivity, which is denoted by the fraction of TP to the sum of TP and false negative ( F N c ). The accuracy defines the proportion of correct classification (TP plus TN) to all results for a particular category while the overall accuracy evaluates the percentage of true positive to all samples for all categories. Accordingly, the F β score quantifies the balance of precision and recall whereas F 1 score adopts a concept of taking precision and recall equally important. The closer the F 1 score to 1, the better the classification performance.

3. Results and Discussion

3.1. Training-validation Model Evaluation

Table 6 details the results of model validation accuracy using OA and F1-score. In general, both FCN-AlexNet and SegNet models have higher F1-scores over all categories while using a combination of RGB and vegetation indexes than using RGB information alone. For the rice lodging category, the highest validation accuracy reaches to 80.08% and 75.37% in FCN-AlexNet using RGB+ExGR and SegNet using RGB+ExG, respectively. As for rice paddy, bareland, and background categories, all eight models achieve above 90% accuracy except the SegNet model using RGB+ExG+ExGR achieves 88.06% (Figure 8). However, RGB+ExG+ExGR combination in both FCN-AlexNet and SegNet models performs worse than the combination of RGB with either ExG or ExGR. For the road category, all models have F1-scores lower than 70%, which can be explained by the limited training samples, and the spectrum and shape similarity between the road and the water channel in the fields (Figure 8).
Figure 9 shows the visual close-ups of FCN-AlexNet and SegNet results for five different cases from top to bottom. The original image, the ground truth, the results of FCN-AlexNet using four combinations of RGB and vegetation indexes, and the results of SegNet using four combinations of RGB and vegetation indexes are presented from left to right. As illustrated in Figure 9, FCN-AlexNet performs better on larger patches, while SegNet picks up more details of segmentation. However, FCN-AlexNet displays a tendency of overestimating on the edge of patches while SegNet contains more noise. The overestimating situation of FCN-AlexNet can be explained by using the 32x upsampling in the last stage of its network structure. For instance, in the second and the fourth cases of Figure 8, the results of SegNet shows a lot of noises around the lodged rice paddy, while FCN-AlexNet performs well. In the first case of Figure 8, the appearance of lodged rice is not visually distinguishable, so both FCN-AlexNet and AlexNet models perform poorly. However, both FCN-AlexNet and AlexNet models do well in the second case. The middle part of case 3 is a water channel, which has similar shape and spectrum characteristics with the road. The similarity hinders the performance of both models and displays a low F1-score.
Based on the results of the validation dataset, the highest accuracy of FCN-AlexNet reaches 91.24%, which is achieved by using RGB+ExGR information. The best performance of SegNet reaches 89.70%, while RGB+ExG information is adopted. The accuracy improvement is again emphasizing the leverage effects of vegetation information on improving classification accuracy. In short, FCN-AlexNet performs slightly better in overall accuracy (about 1.54%) and obtains more stable results compared to SegNet, which is probably due to the simpler transpose convolution structure of FCN-AlexNet.

3.2. Testing Data Inference Evaluation

Both 2017 and 2019 datasets are used for testing the performance of FCN-AlexNet, SegNet, and MLC models. As a focus of this paper, the results for the rice lodging category are highlighted for results showing and discussion. Table 7 and Figure 10 demonstrates the results of the 2017 dataset while Table 8 and Figure 11 show the results of the 2019 dataset. A histogram matching process has been implemented for the 2019 dataset to minimize the light difference during imaging.
In general, as shown in Figure 10 and Figure 11, FCN-AlexNet has strong confidence in its rice lodging identification in terms of accuracy and F1-score. The 2017 testing dataset shows better F1 scores than the 2019 testing dataset (Table 7 and Table 8, Figure 10 and Figure 11). FCN-AlexNet and SegNet reach higher precision and accuracy than MLC. Especially, FCN-AlexNet has F1-score >82% and accuracy >93% in the 2017 dataset (Table 7), which significantly overtakes SegNet and MLC. The highest F1-score 83.56% and accuracy 94.43% is achieved by FCN-AlexNet using RGB information. The worst F1-score 42.99% and accuracy 85.15% is observed in SegNet using RGB+ExG+ExGR information and MLC using +ExG information, respectively.
Besides, it is clear to see a significant accuracy improvement of adding vegetation information based on the recall results. In the 2017 dataset (Table 7), the recall value of SegNet using RGB information is 69.06%, while the recall value of SegNet using RGB and ExG combined information jumps to 89.64% with is a significant improvement of 20.58%. Moreover, the effects of vegetation information can also be observed from the improvement of the F1-score in Table 7. In the 2019 dataset, the F1-scores of FCN-AlexNet RGB+ExGR and SegNet RGB+ExGR are 78.27% and 68.12%, respectively, which is much higher than that of using only RGB information, 56.58% and 53.63%, respectively. Moreover, the traditional MLC classifier requires manual selection of area of interest (AOI) for the training sample, which becomes a barrier for identification automation. Thus, the computation time is different for every individual image. Nonetheless, the computation time of FCN-AlexNet and SegNet consists of memory operation and image inference, which is a fixed period due to their pixel-wise approach. In short, FCN-AlexNet and SegNet reduce the computation time by 10-15 times compared to the MLC classifier.
Figure 12, Figure 13 and Figure 14 demonstrate the identification results of rice lodging on the 2017 dataset using four combinations of spectrum information on three classifiers, FCN-AlexNet, SegNet, and MLC, respectively. The associated F1-score is listed on the upper-right corner of each sub-figures. Green represents pixels being correctly classified, blue represents pixels with errors of omission, and red represents pixels with commission errors.
As illustrated in Figure 12, it is clear to see that FCN-AlexNet has the most stable correct identification of lodged rice in the middle of the image with partial commission errors occurring on the left-hand side of the image. In Figure 13, a noticeable area of pixels along the highway shows omission errors. For the MLC, a large area with commission errors is detected on the left-hand side of the image in Figure 14. Additionally, the area of commission errors identified by MLC is much larger than those identified by the two deep learning networks.
The additional vegetation information does not improve the F1-score for FCN-AlexNet but shows their help for SegNet and MLC in terms of increasing F1-score. However, adding two vegetation indexes brings negative influence for rice lodging identification, which may indicate a confusion by too much information emphasizing similar features.
As shown in Figure 15 and referred to Table 8, the highest accuracy values of 94.33% and 91.57% are observed for both FCN-AlexNet and SegNet using RGB+ExGR information on the 2019 testing dataset. The corresponding F1-scores (78.27% and 68.12% for FCN-AlexNet and SegNet, respectively) indicate that FCN-AlexNet has a better balance between precision and recall. In Figure 15d, FCN-AlexNet produces more omission errors observed over patches’ boundaries, which shows the washed-out effects by downsampling operations confronted by FCN [32]. For SegNet results in Figure 15e, a large percentage of commission (13.43%) and omission errors (41.41%) to the ground truth are detected, which reveals the sensitivity of SegNet may introduce more noise and confusion when the target classification objects are more homogeneous.
Figure 16 demonstrates the identification results for the 230-ha area covering most of the lodging paddies in the township. At a glance, both FCN-AlexNet and SegNet produce reasonable classification results in the 2017 dataset. However, the 2019 dataset shows different chromaticity due to the weather condition at that time of image acquisition [35], which may contribute to the lower identification performance. For instance, the highway in the middle part of the image is not fully captured in the 2019 dataset identification results (Figure 16f,g). Comparing the results of FCN-AlexNet and SegNet on two datasets, the discrepancy between the two networks is found smaller in the 2017 dataset. A large inconsistency of the rice lodging area is observed between two networks in the 2019 dataset. Nevertheless, the results obtained in the case of larger areas are very promising by taking into account the broader spatial coverage and the high computation efficiency.

4. Conclusions

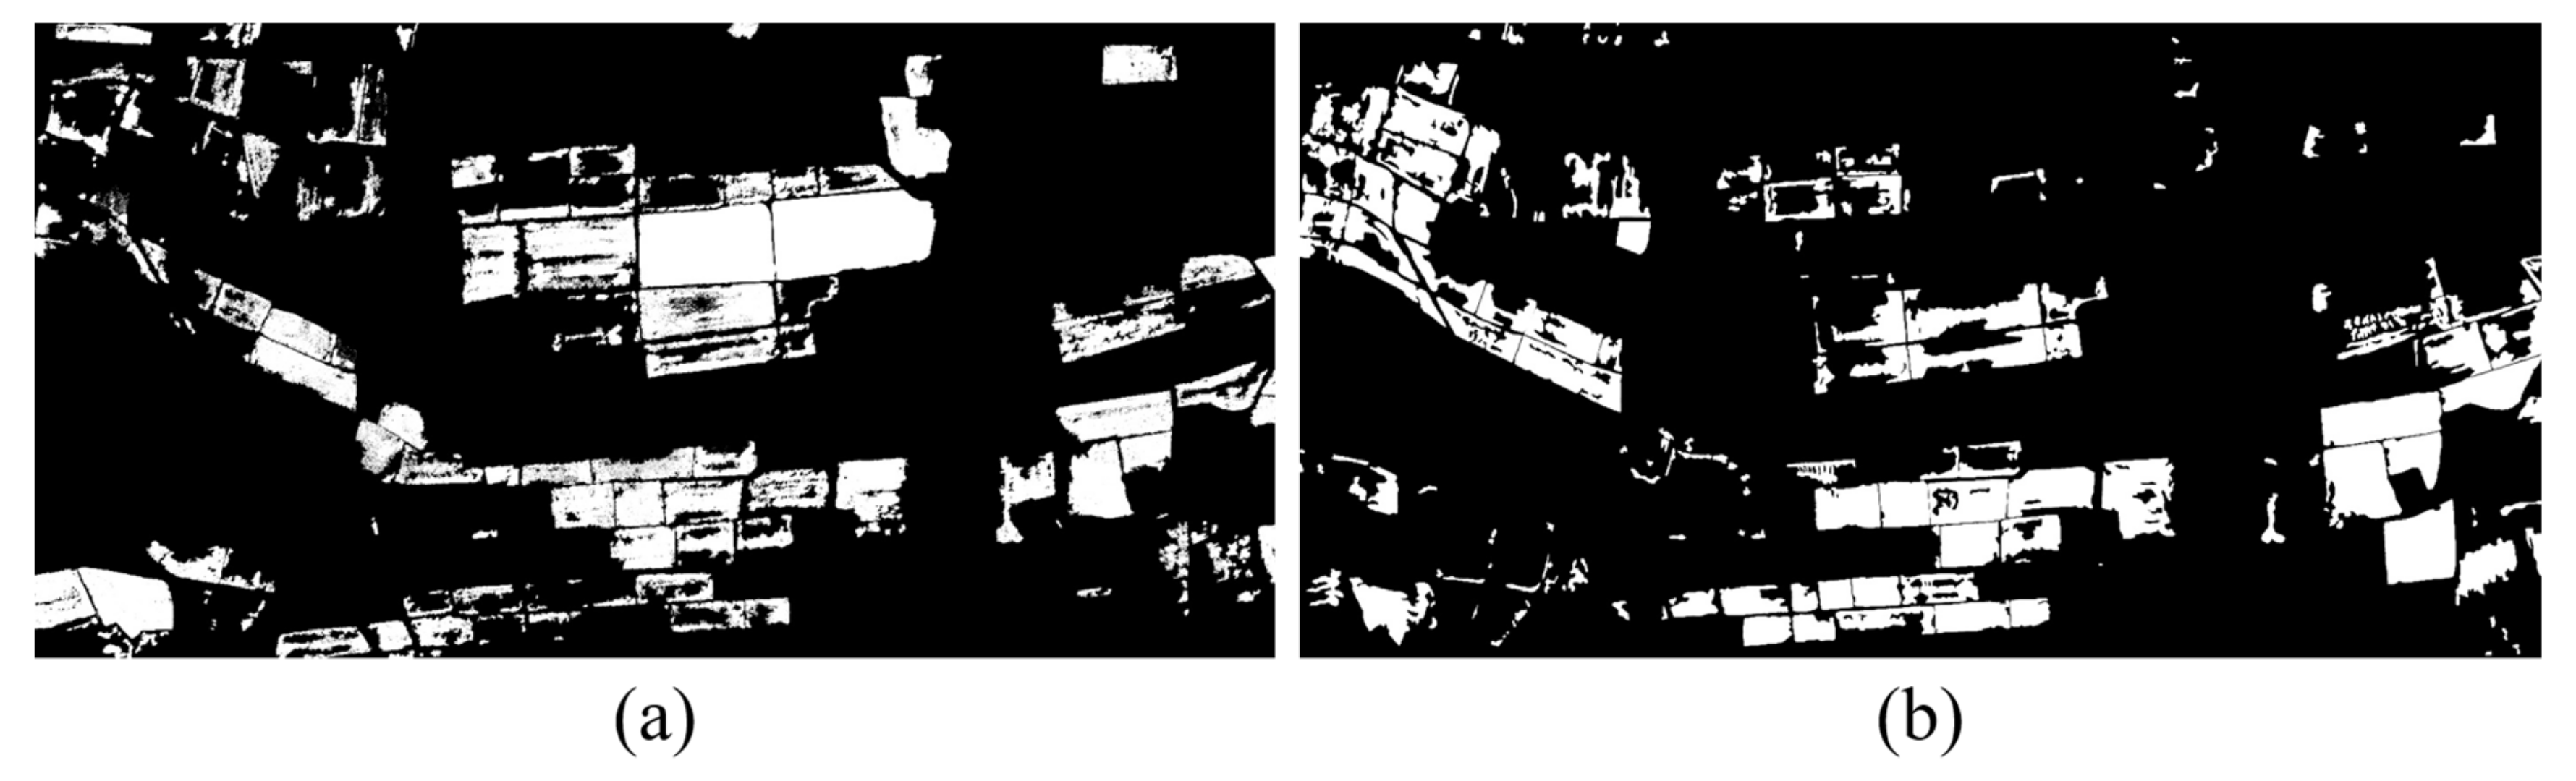
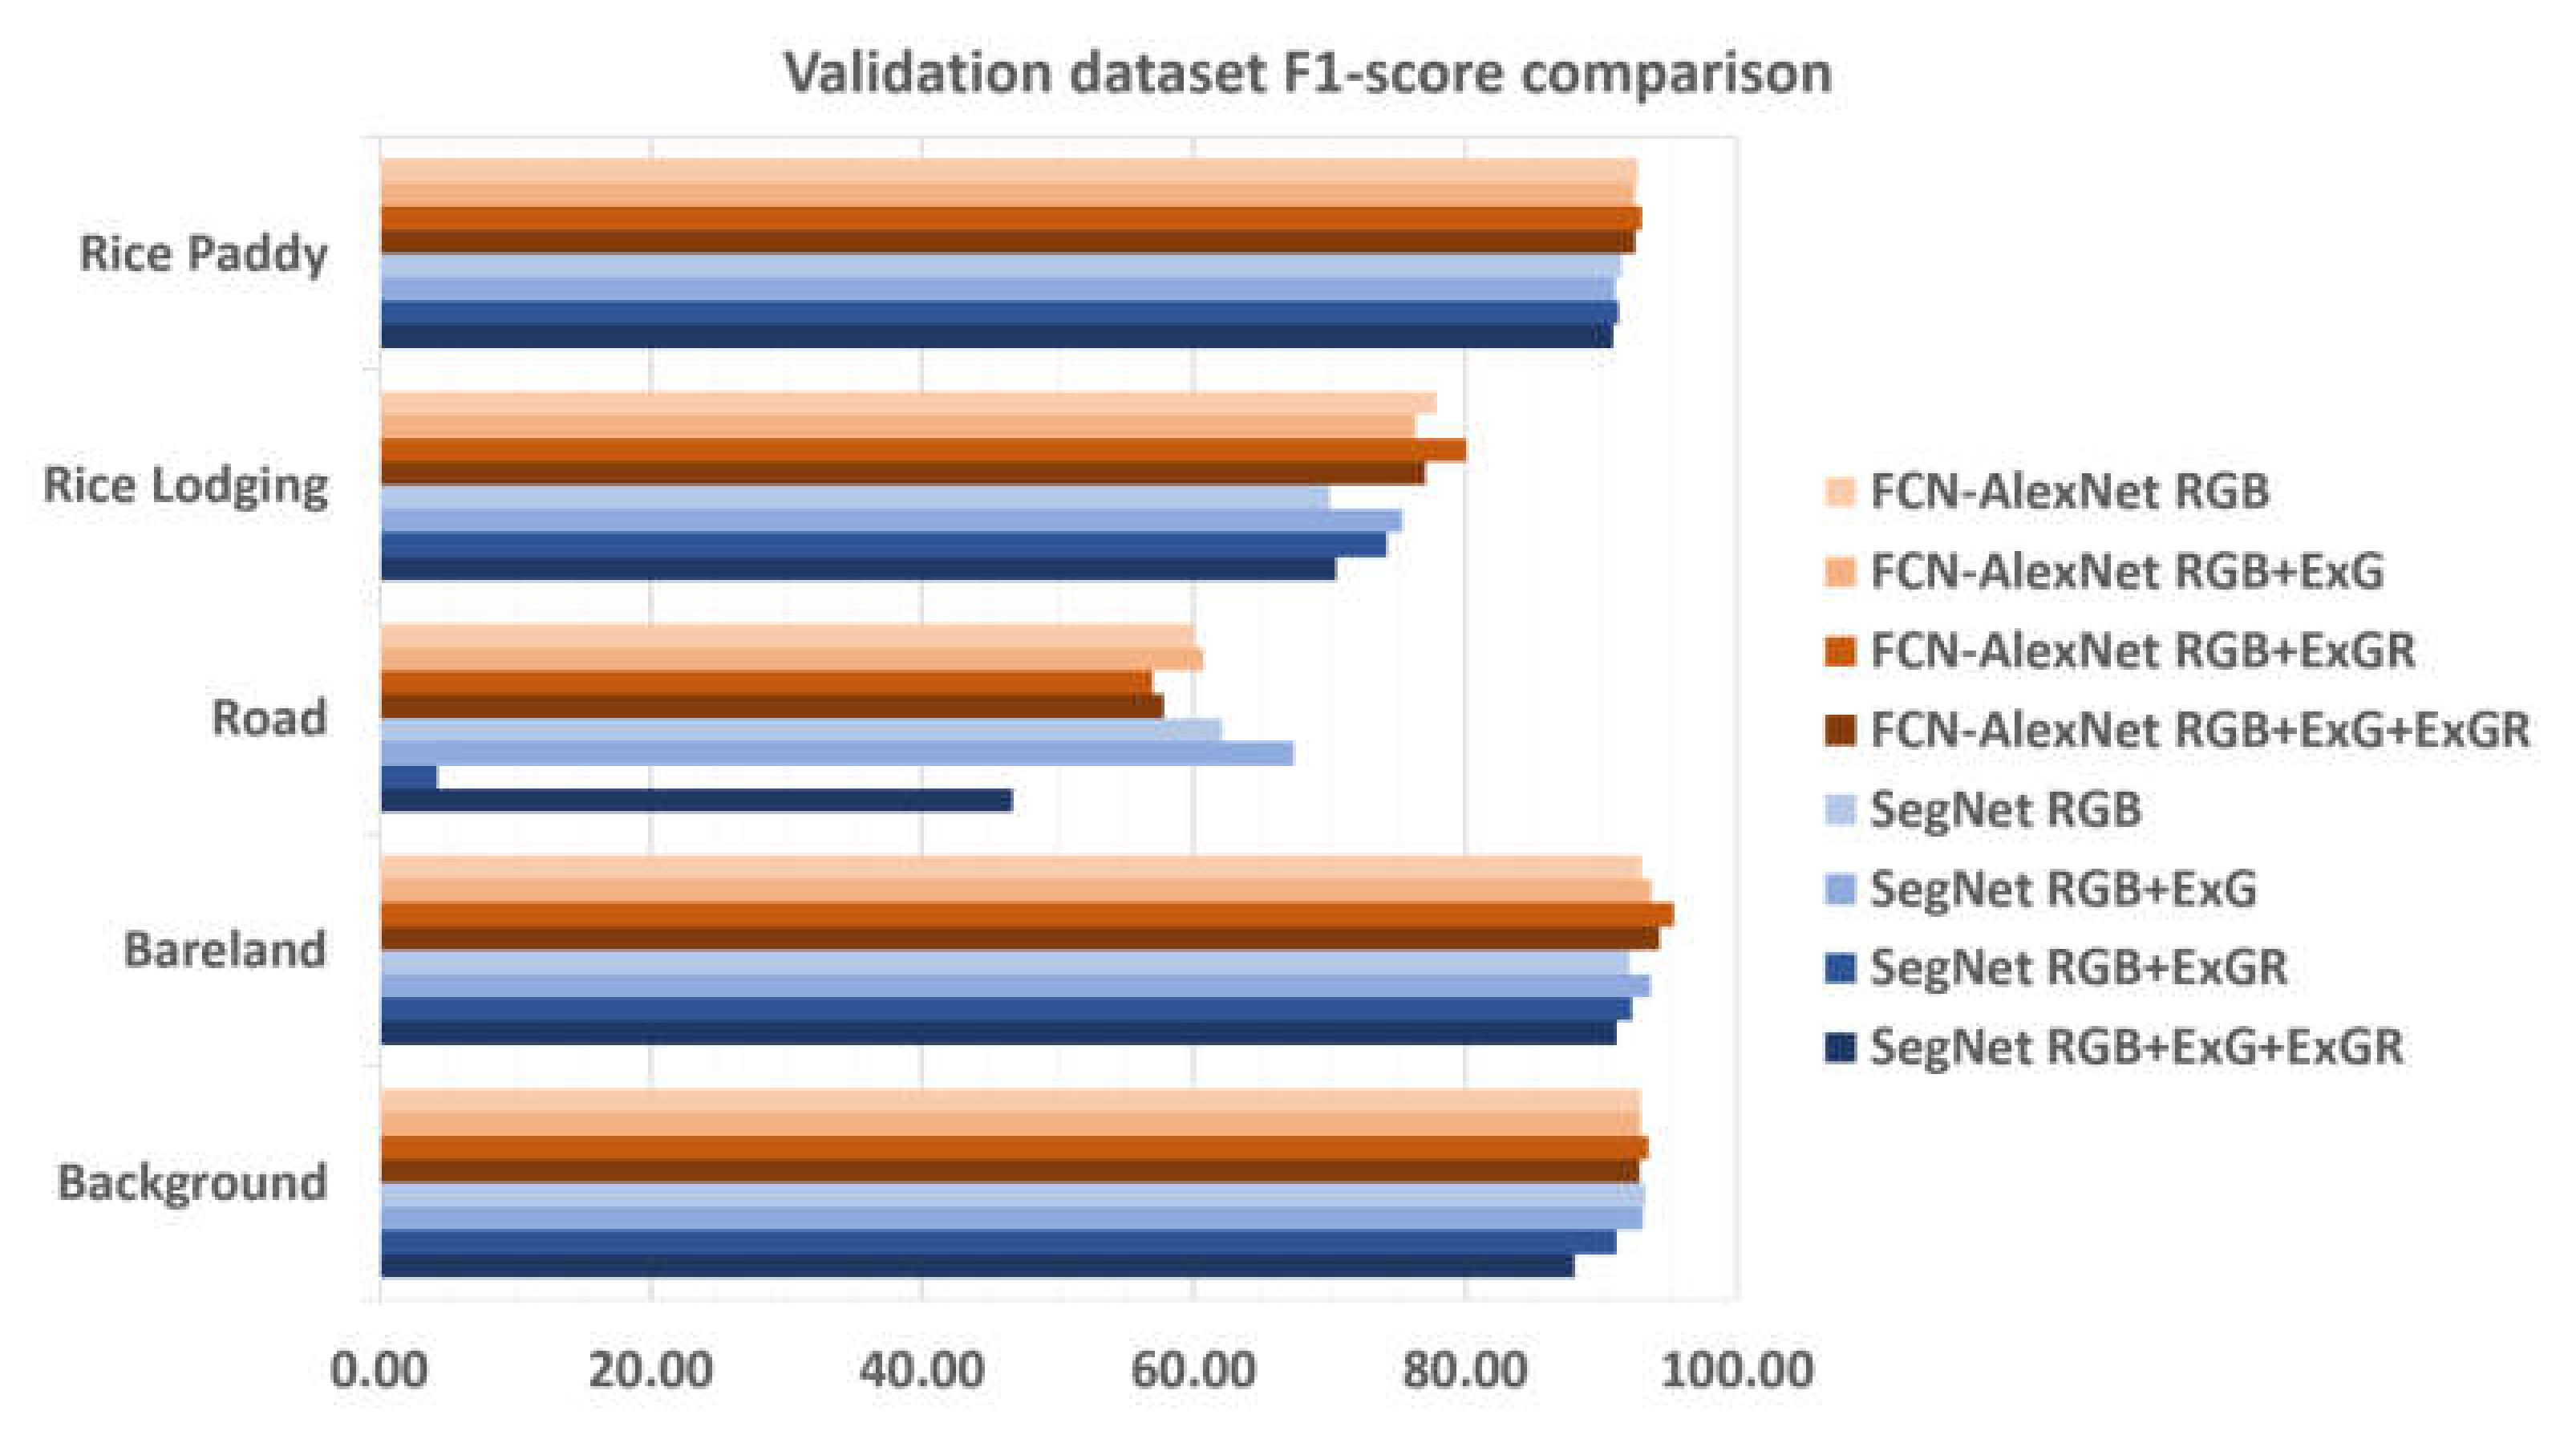
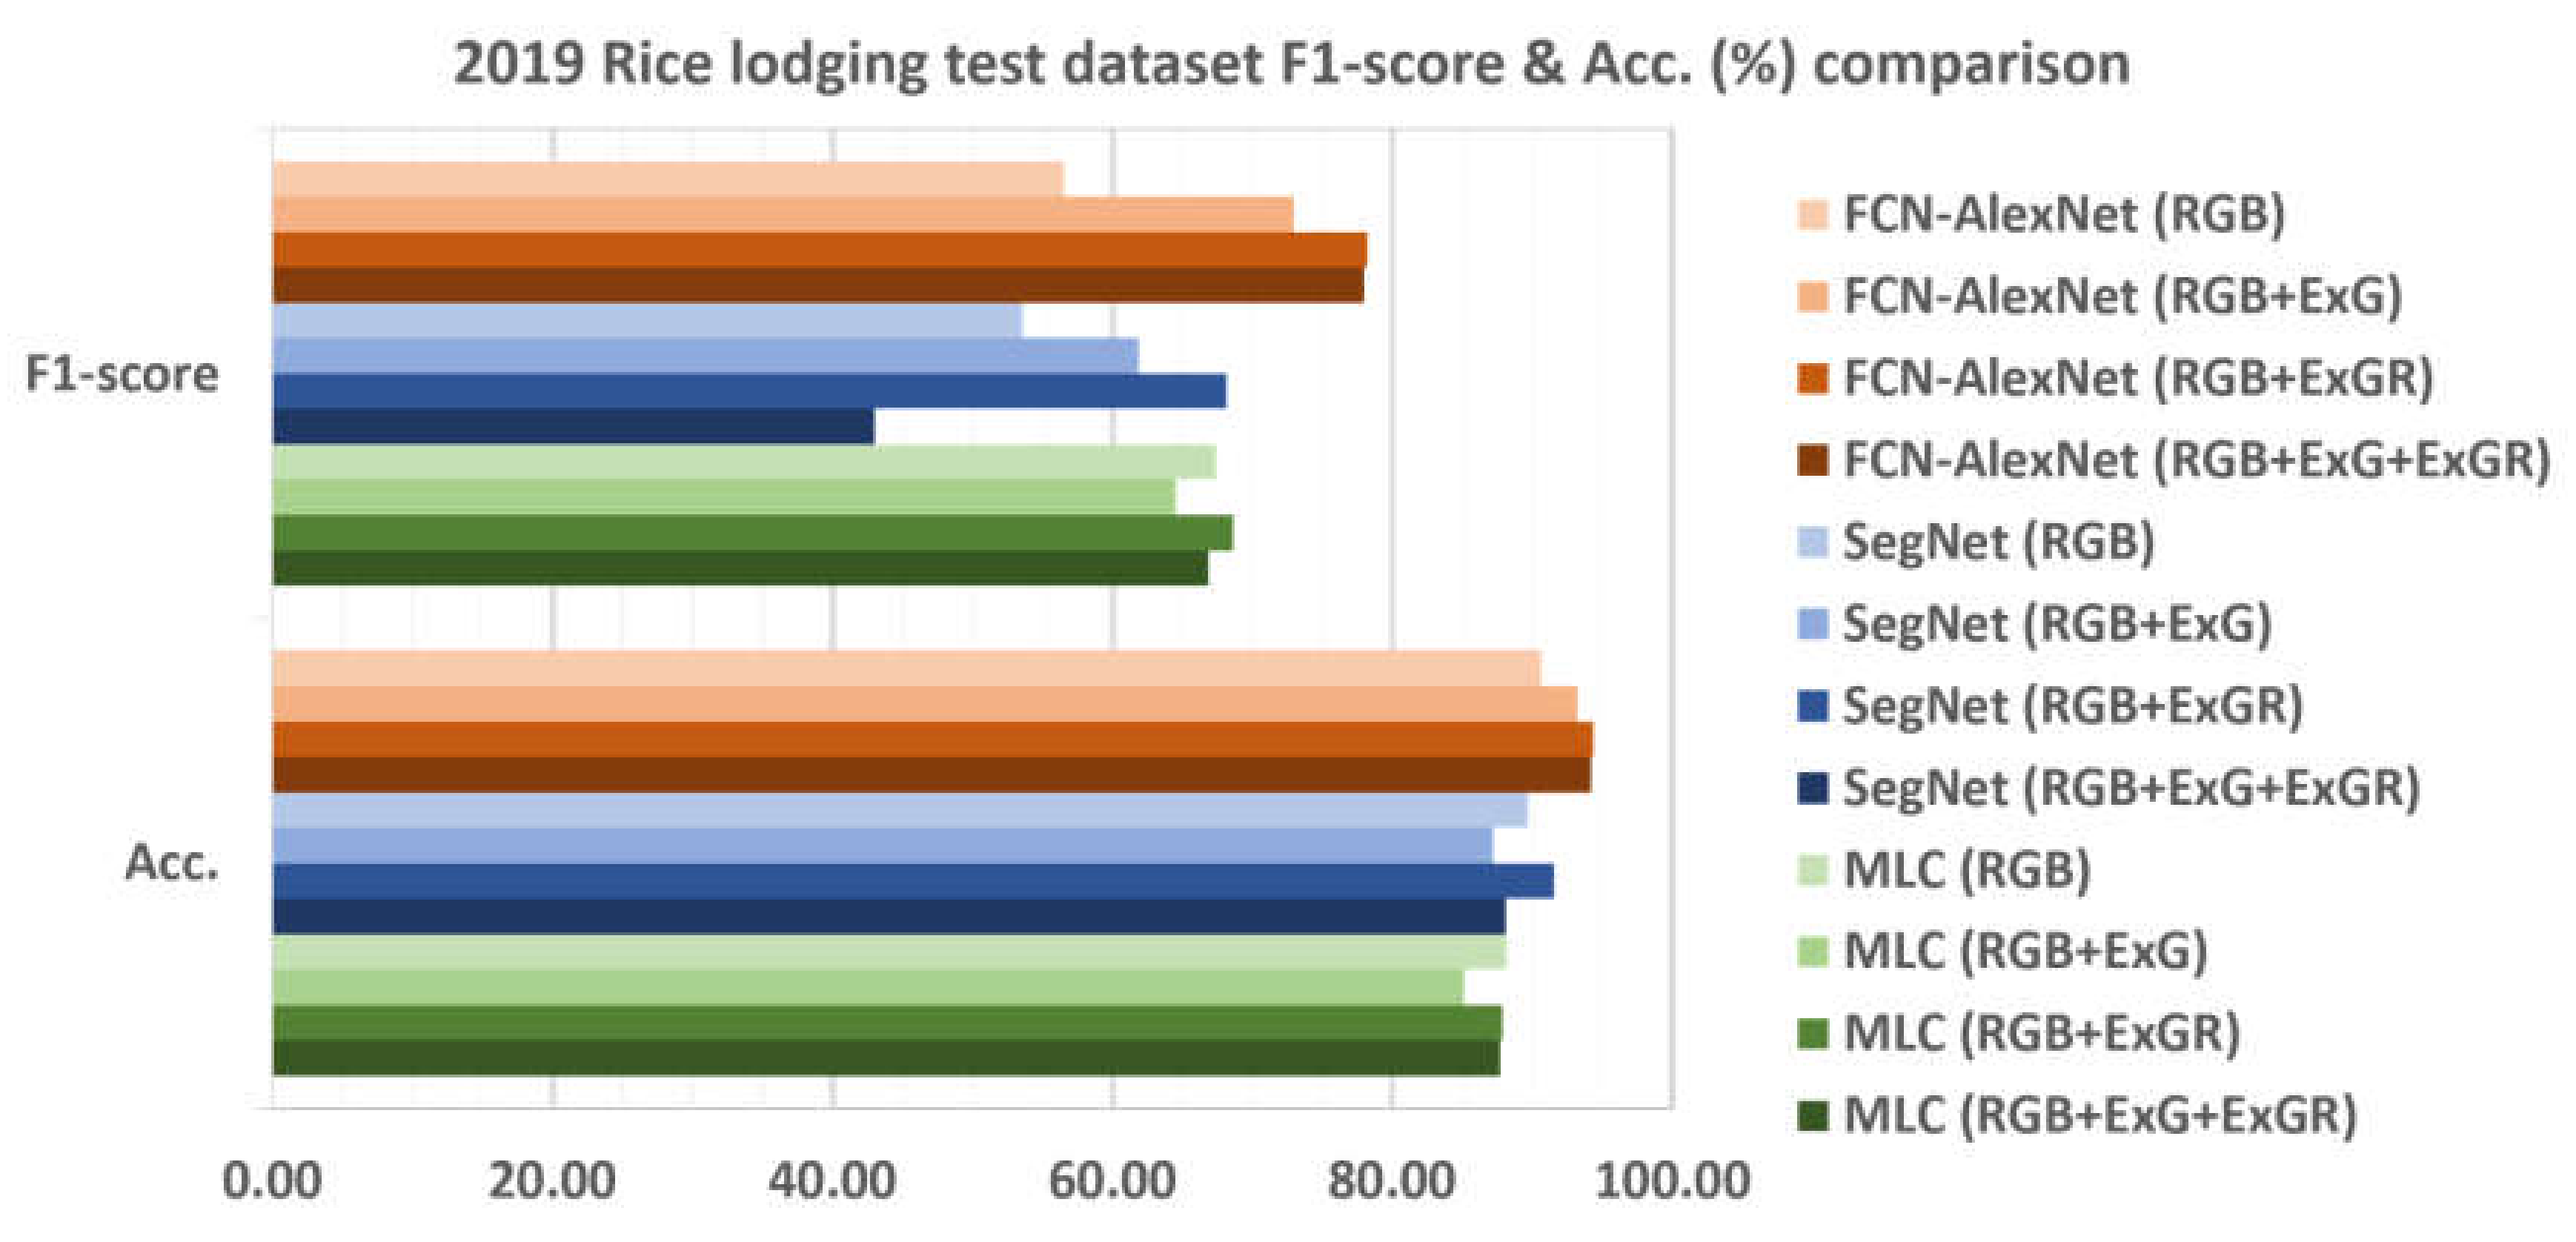
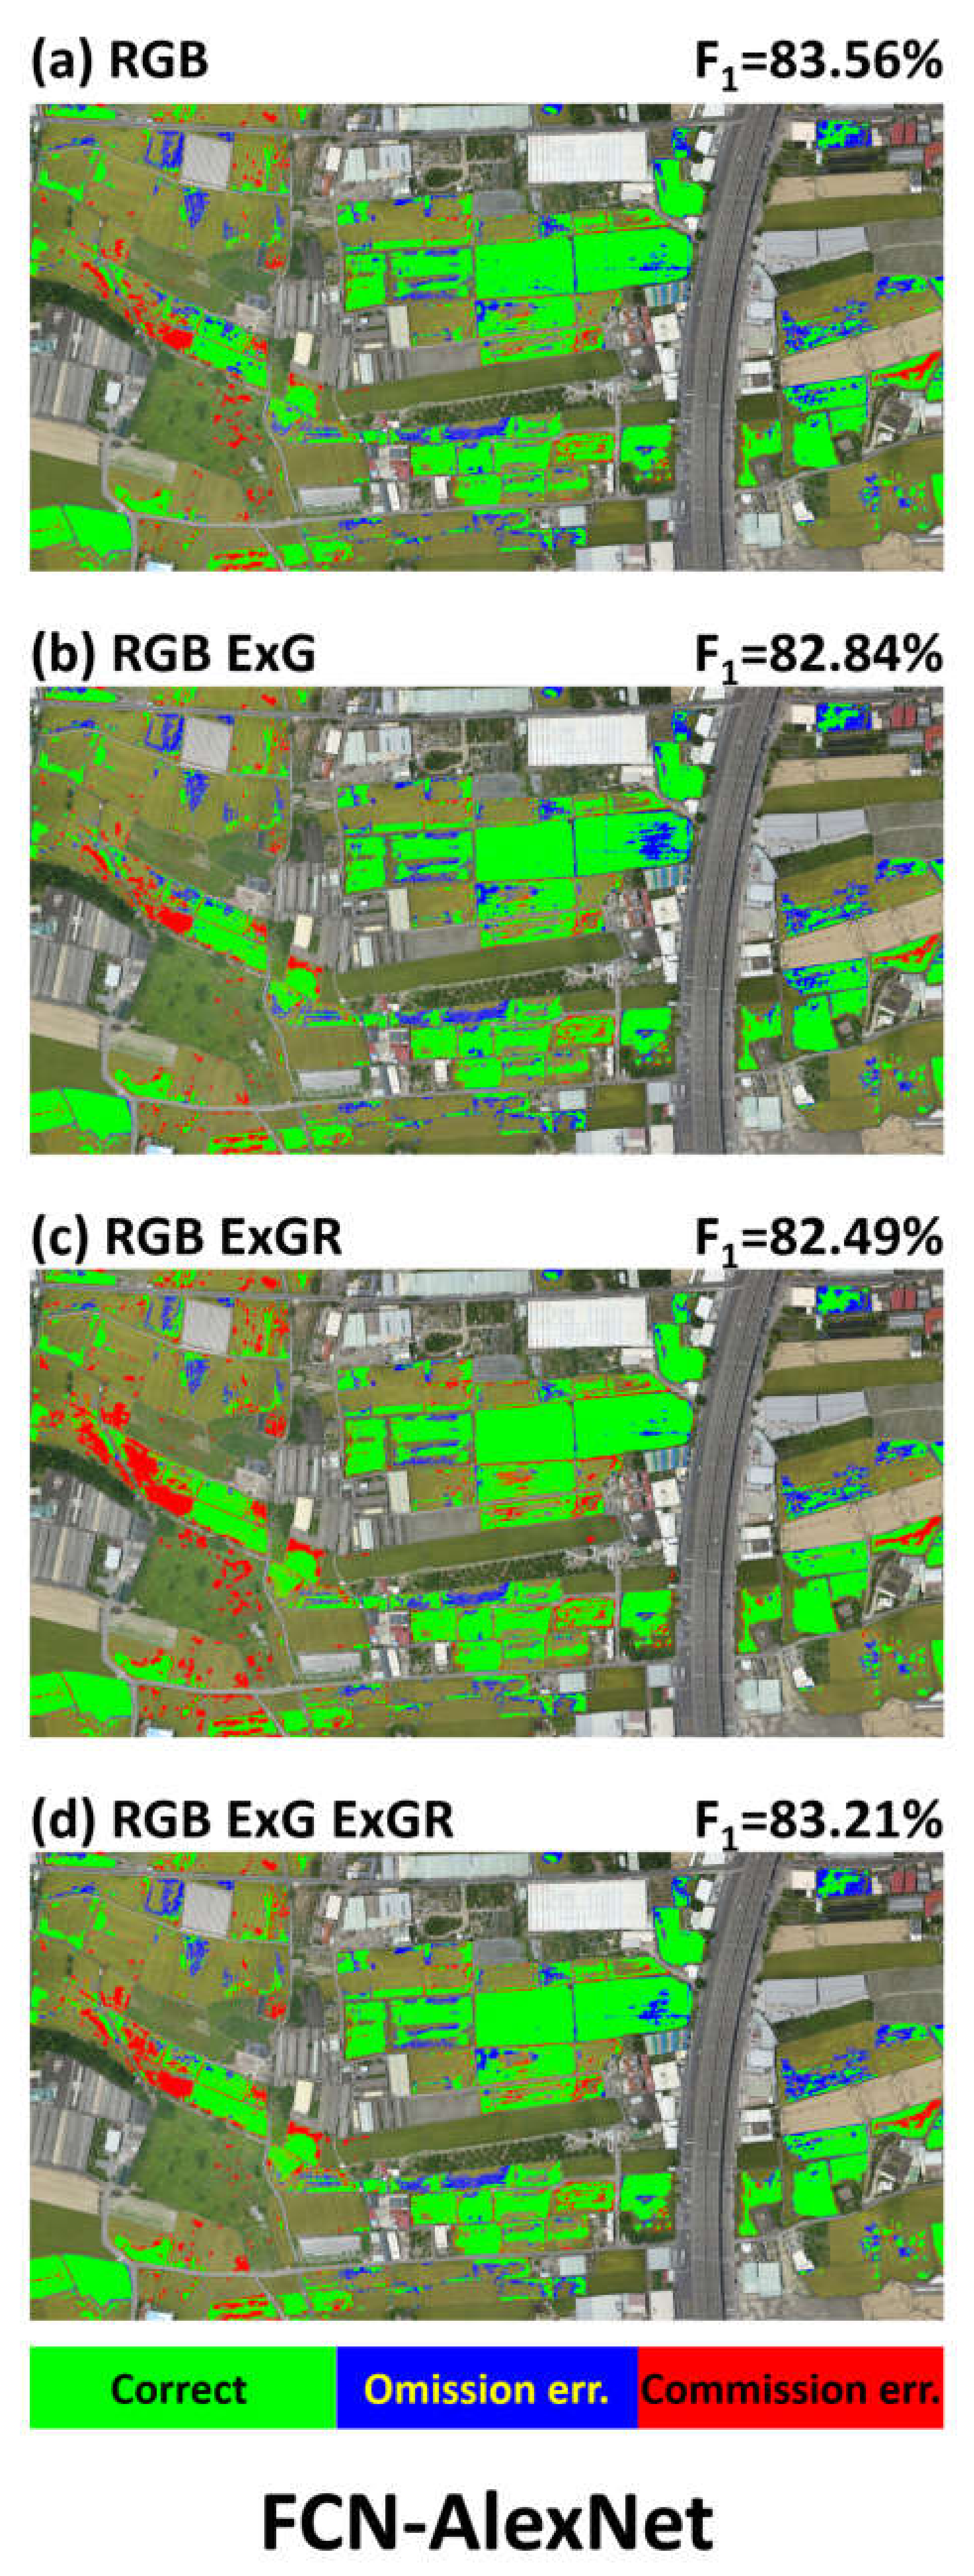
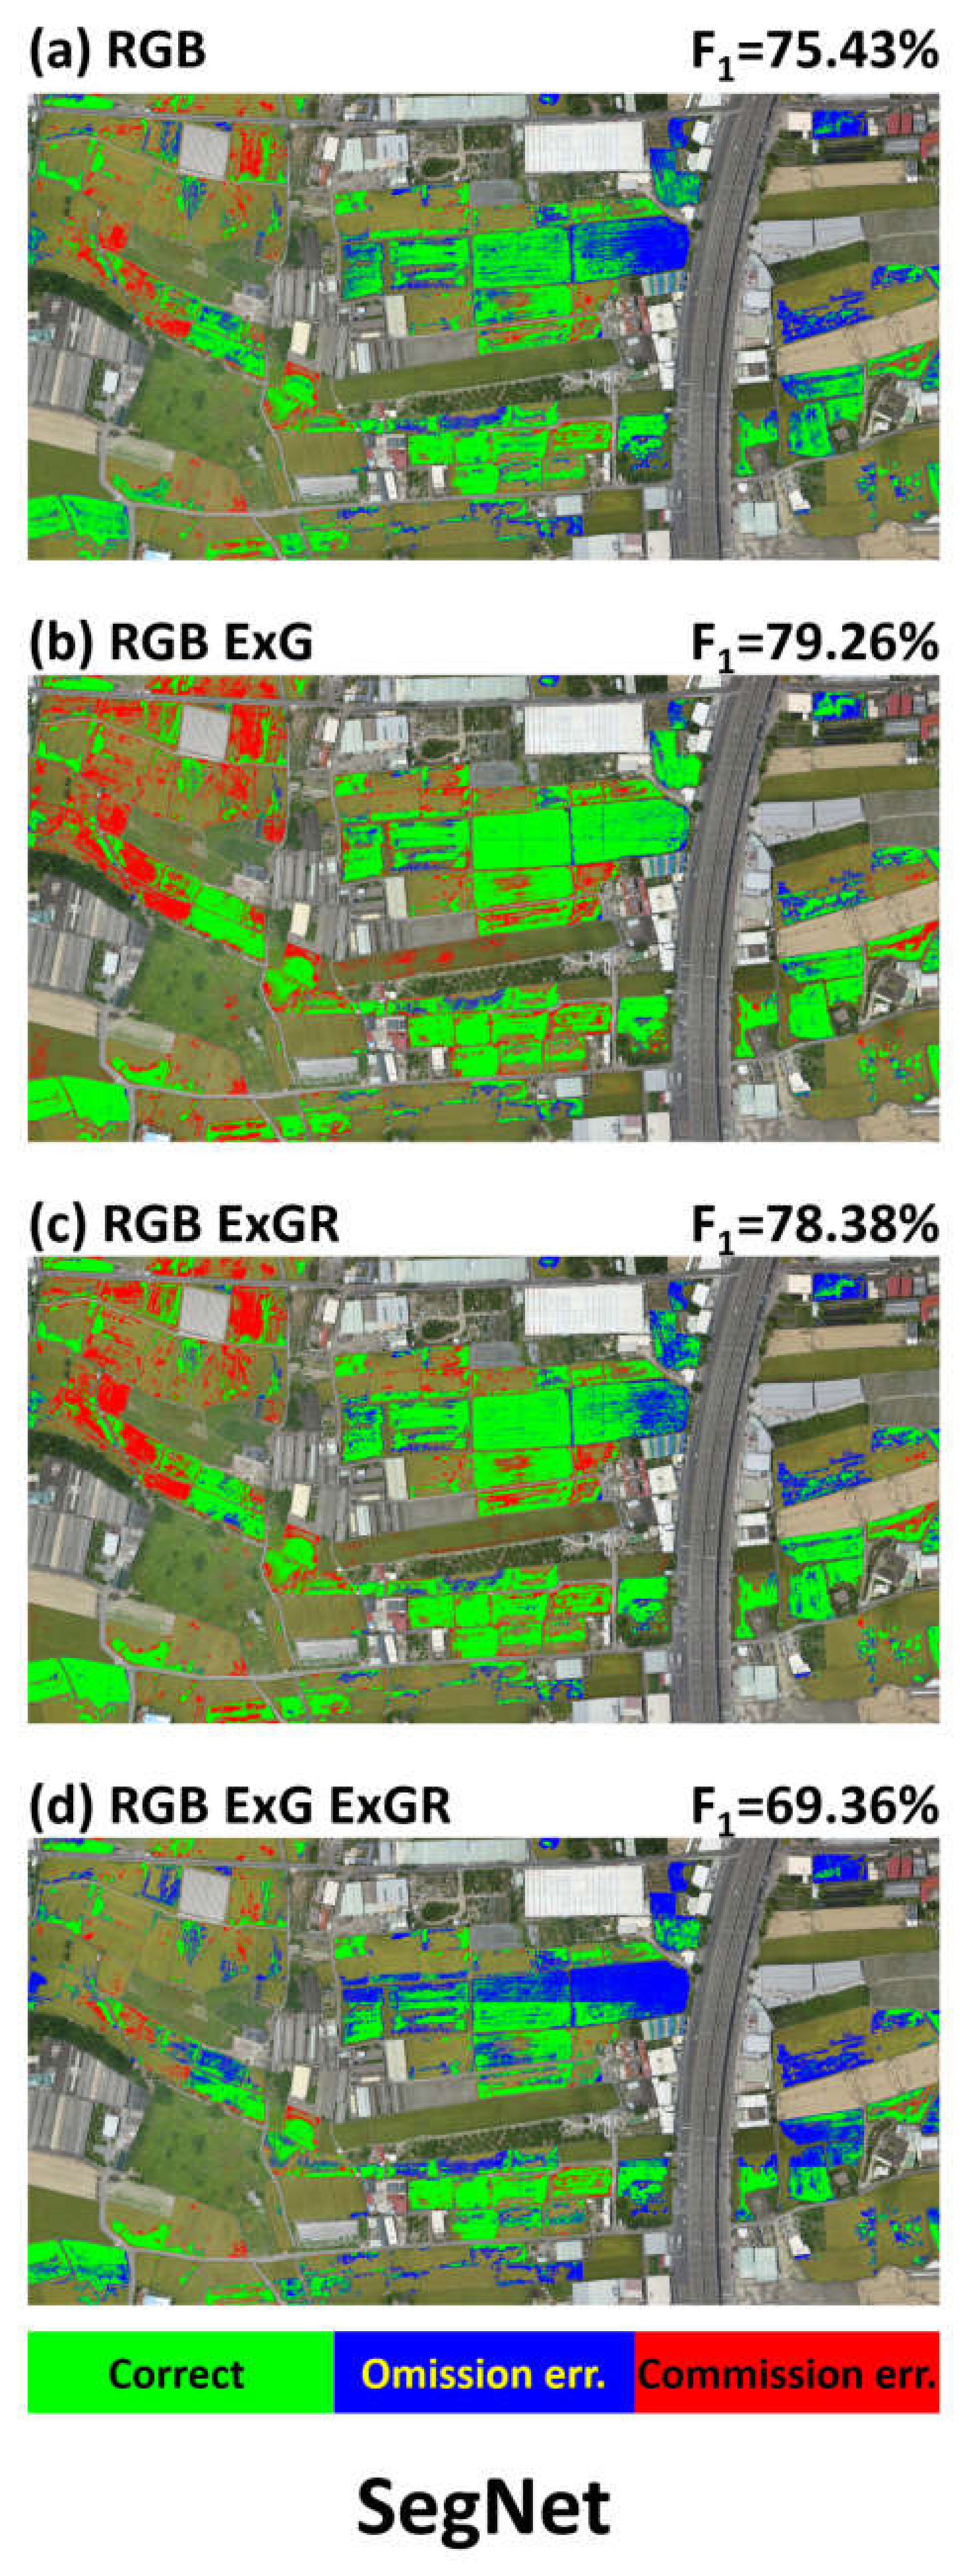
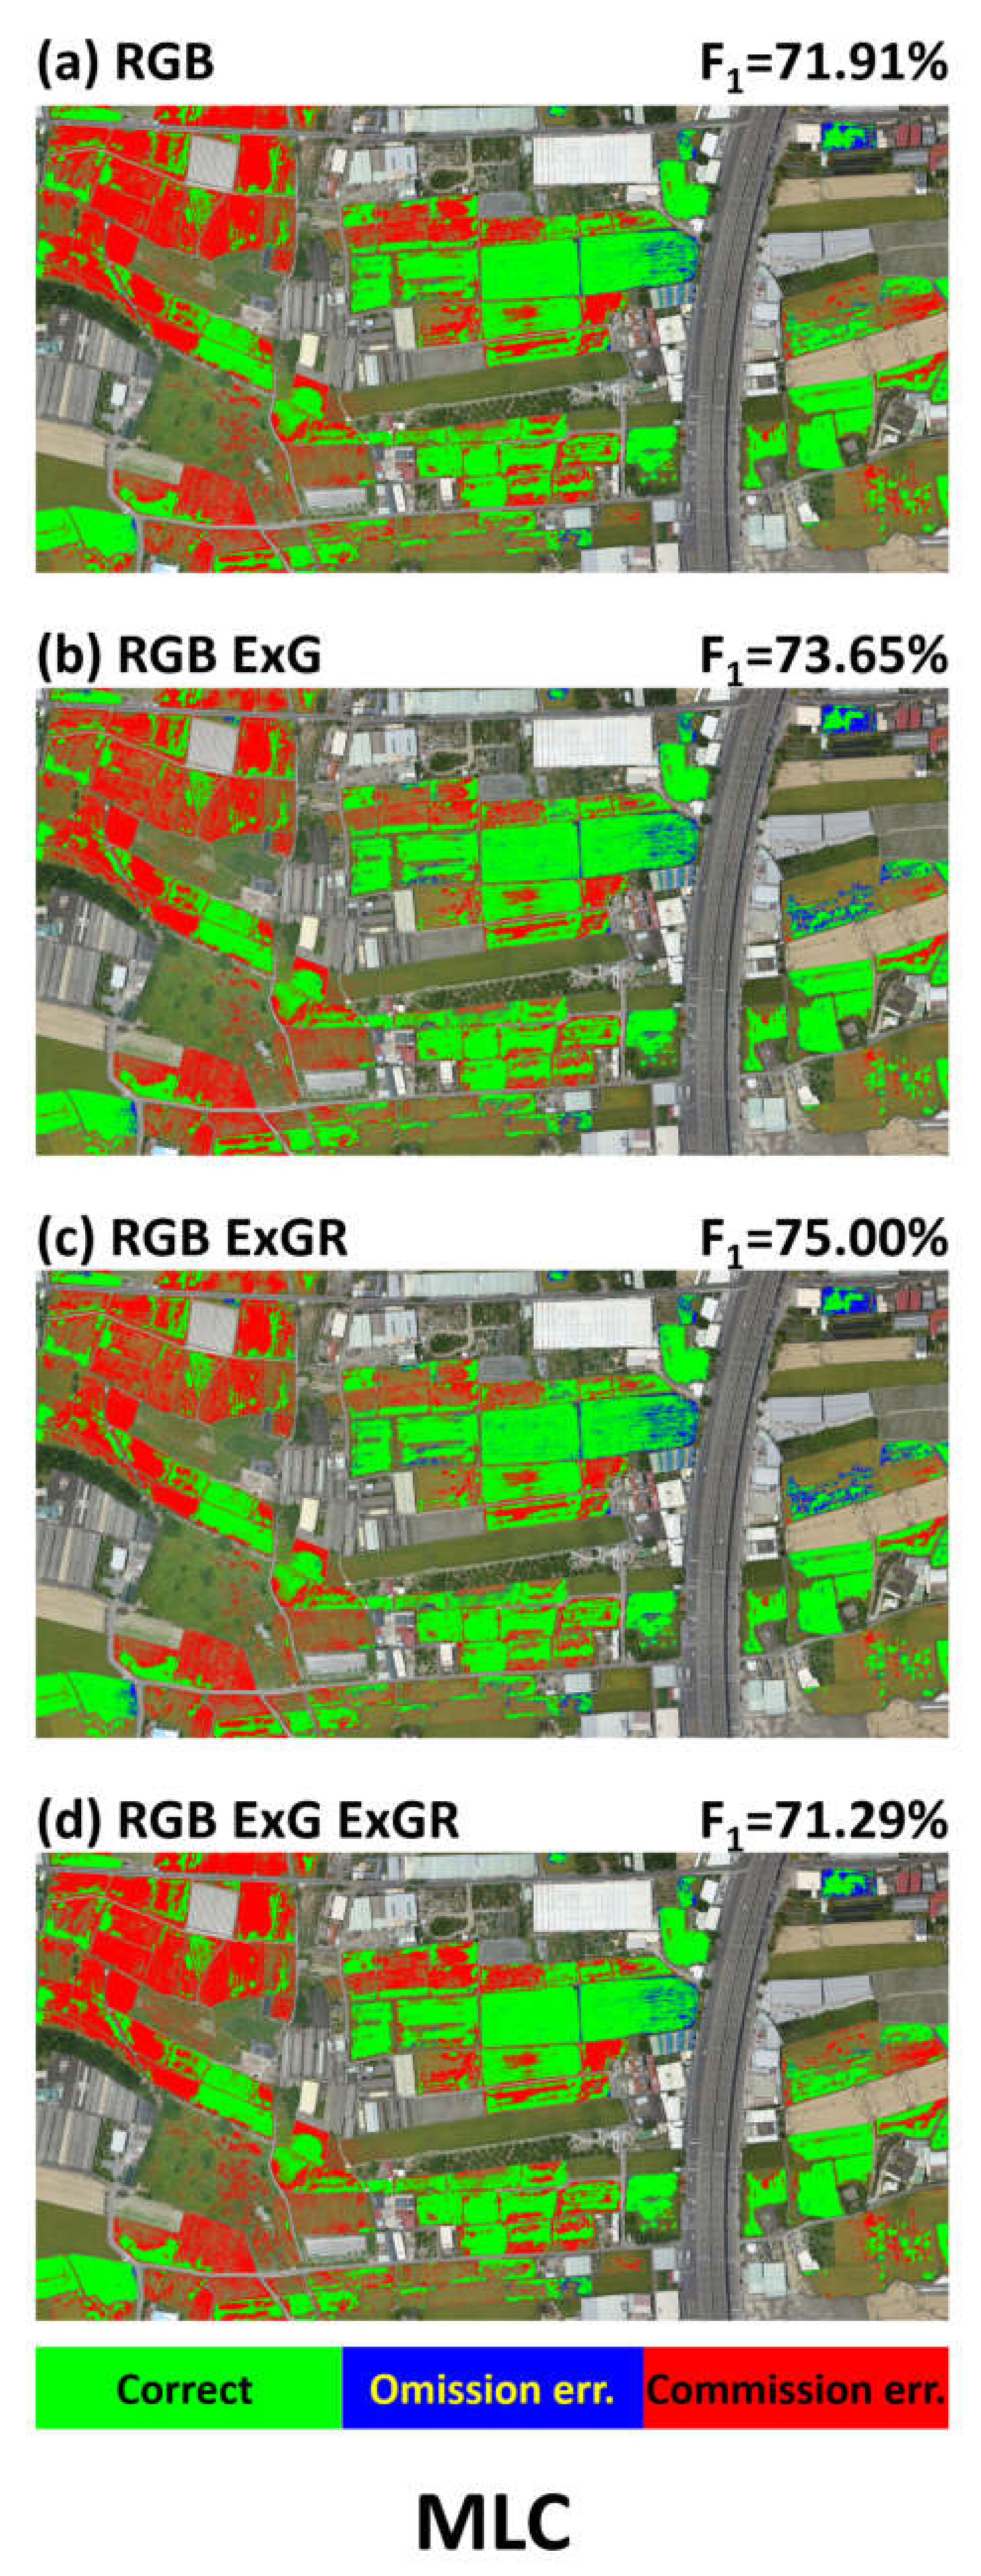
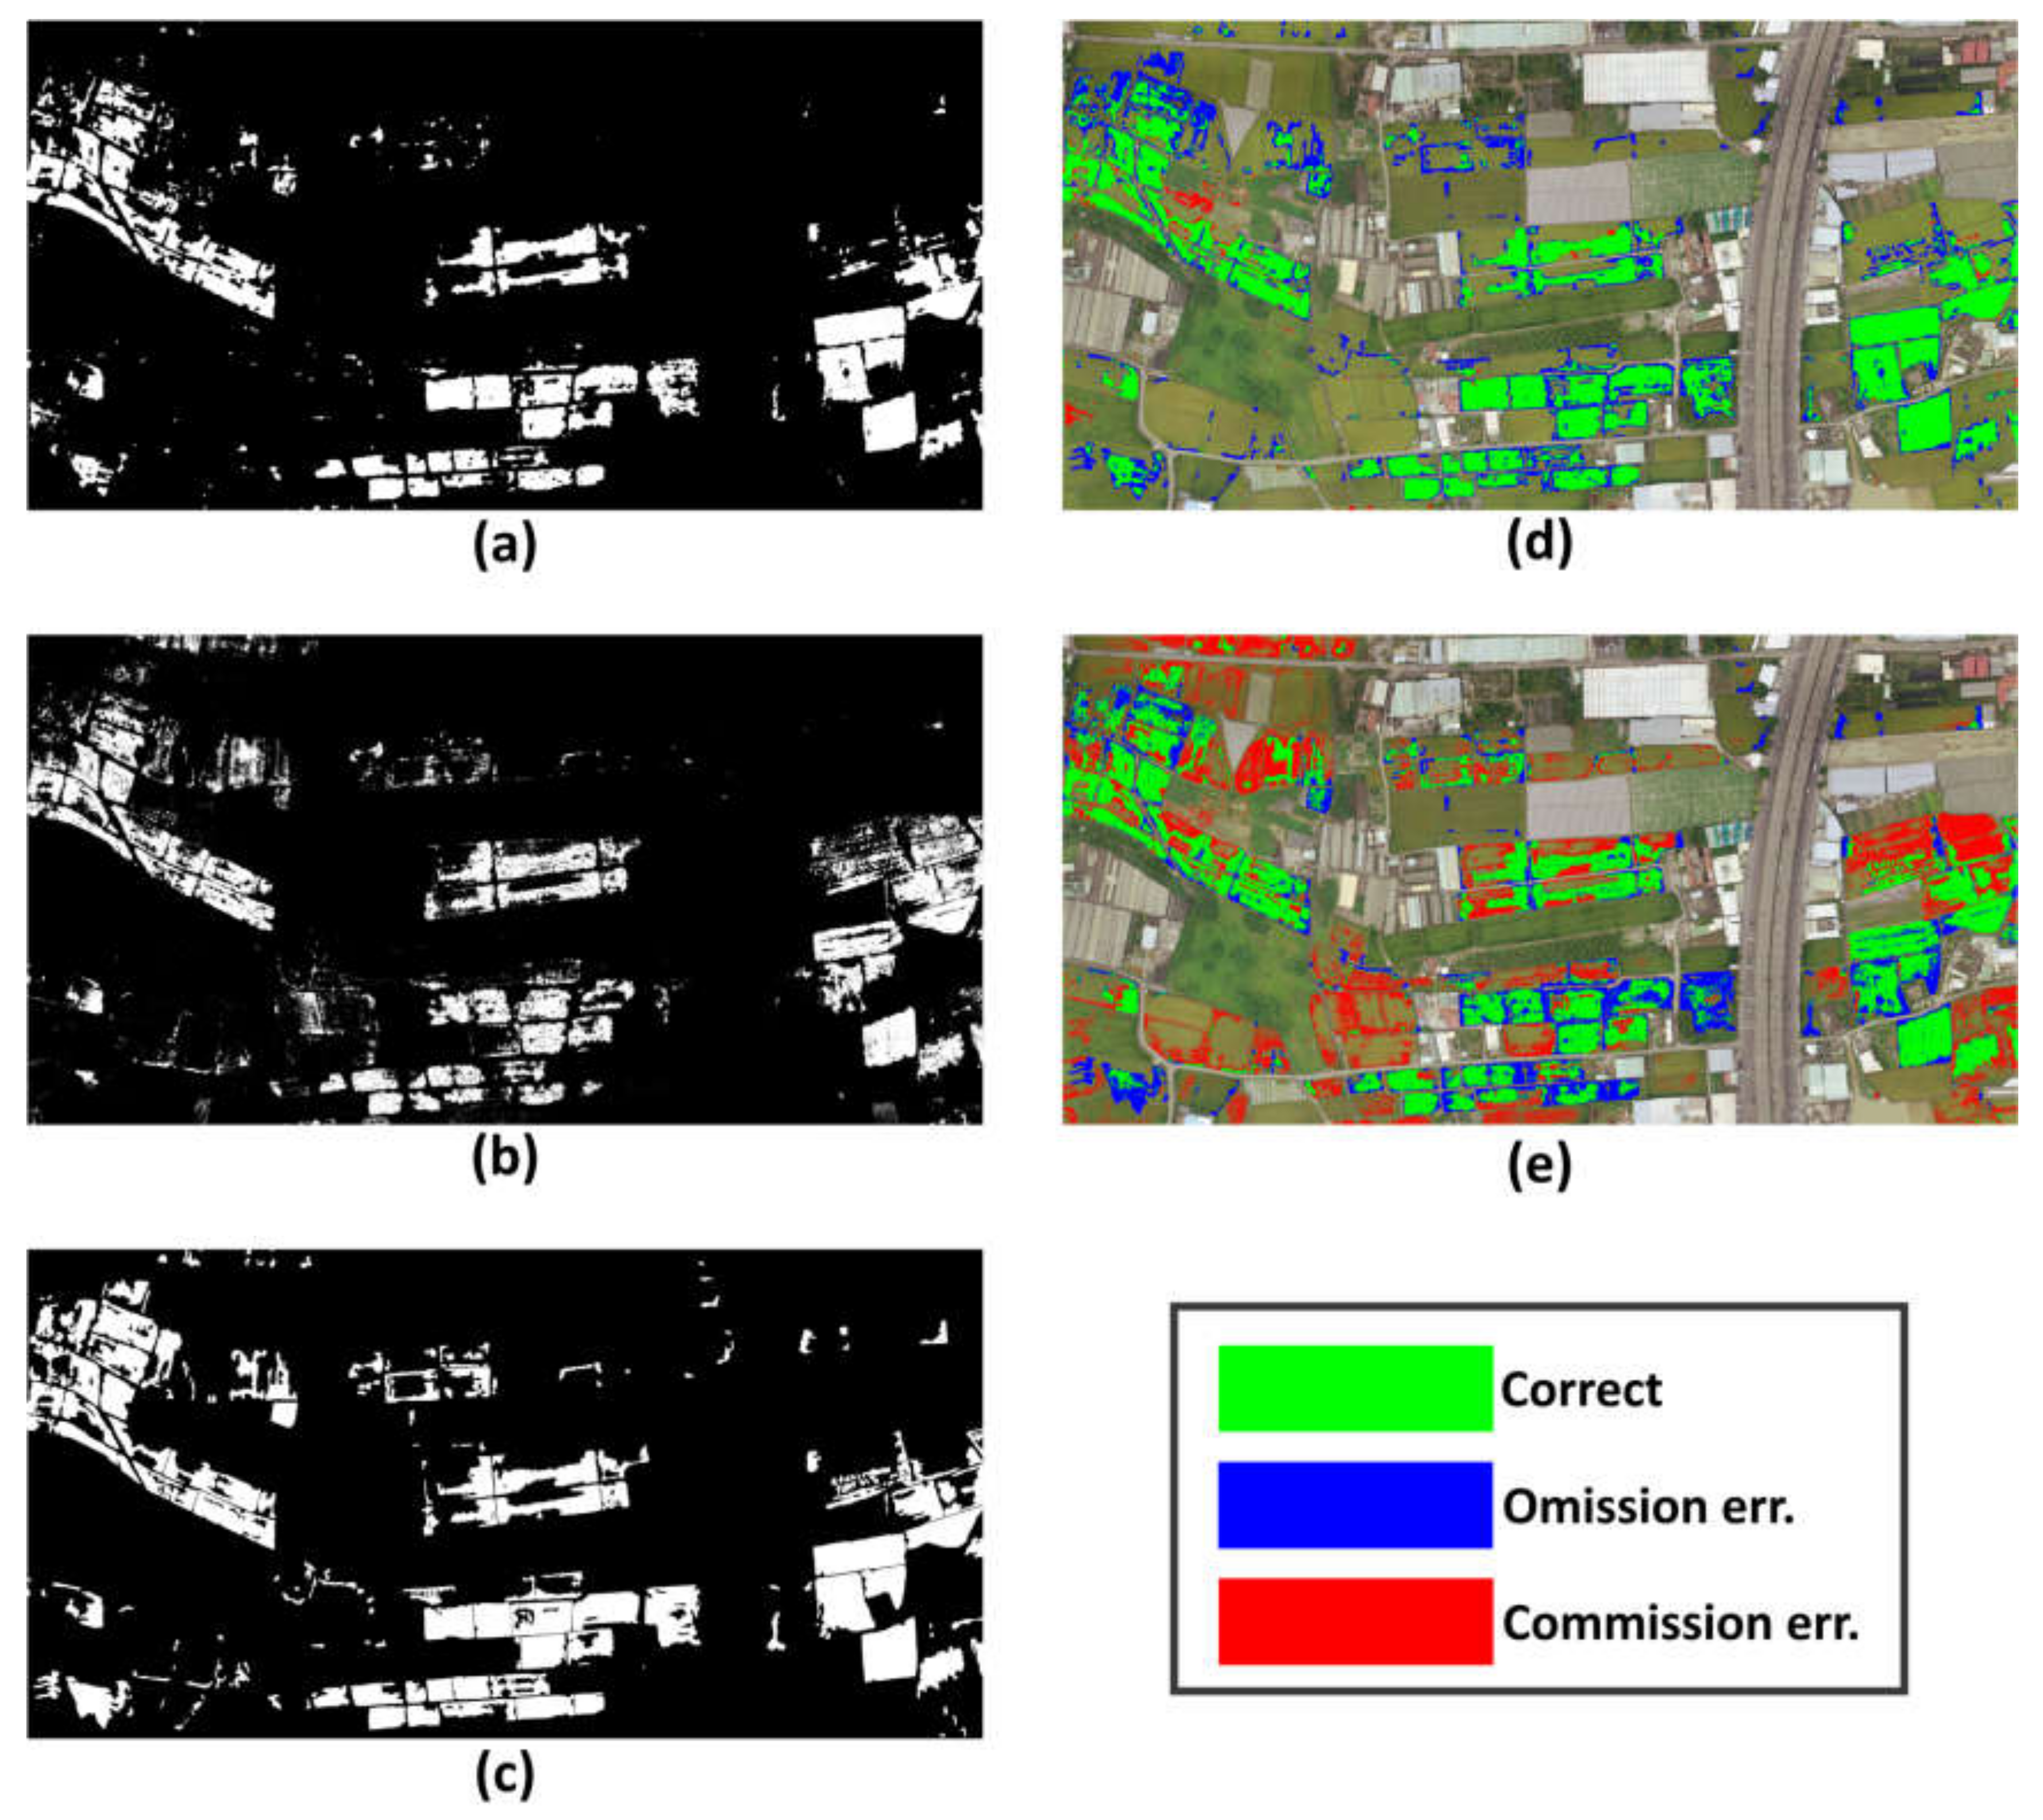
To data, the rice lodging assessment still heavily relies on manual objective evaluation, which is time-consuming, labor-intensive, and problematic in terms of its poor efficiency and objectivity. The proposed rice lodging identification method aims to provide an effective and efficient scientific reference to assess rice lodging. In particular, two deep learning based semantic segmentation networks, FCN-AlexNet and SegNet, are implemented with vegetation indices for rice lodging identification in multi-date UAV visible images. As the testing dataset results show, FCN-AlexNet outperforms SegNet and MLC and reaches the highest F1-score of 83.56% and accuracy of 94.43%. The higher F1-score indicates that FCN-AlexNet has a better balance between precision and recall. The additional vegetation index information leverages the accuracy performance for both networks in terms of improved F1-scores and accuracy. Moreover, implementing FCN-AlexNet and SegNet can reduce the computation time by 10–15 times compared to using the traditional MLC. Furthermore, these two networks work well on the 230-ha image, which provides a great potential to broader area applications with promising rice lodging identification ability.
The proposed method also has a potential improvement space by providing more training data produced by implementing data argumentation process or employing other alternative network structures, such as E-Net or FC-DenseNet [36,37]. Meanwhile, to deal with a board area (up to hundred thousand ha) of an agricultural disaster survey in a temporal and spatial efficiency with economic benefit, parallel computation should be employed for deep-learning model execution in the future. On the other hand, edge computing techniques with a hierarchical image processing in UAV-equipped microcomputers can be applied to the deep-learning model to provide real-time agricultural disaster survey.

Author Contributions

Conceptualization, M.D.Y. and H.H.T.; methodology, M.D.Y. and H.H.T.; software, H.H.T., and Y.C.H.; validation, H.H.T., Y.C.H., and H.P.T.; formal analysis, M.D.Y., H.H.T., and H.P.T.; writing—original draft preparation, M.D.Y., H.H.T., Y.C.H., and H.P.T.; writing—review and editing, M.D.T. and H.P.T.; visualization, Y.C.H. and H.H.T.; supervision, Y.C.H., H.H.T., and H.P.T.; project administration, M.D.Y.; funding acquisition, M.D.Y.

Funding

This research was partially funded by the Ministry of Science and Technology, Taiwan, under Grant Number 108-2634-F-005-003.

Acknowledgments

This research is supported through Pervasive AI Research (PAIR) Labs, Taiwan, and “Innovation and Development Center of Sustainable Agriculture” from The Featured Areas Research Center Program within the framework of the Higher Education Sprout Project by the Ministry of Education (MOE) in Taiwan.

Conflicts of Interest

The authors declare no conflict of interest.

References

  1. Taiwan Agriculture and Food Agency, Council of Agriculture, Executive Yuan. Agriculture Statistic Year Book 2014. Available online: https://eng.coa.gov.tw/upload/files/eng_web_structure/2503255/8-4.pdf (accessed on 24 January 2020).
  2. Taiwan Agriculture and Food Agency, Council of Agriculture, Executive Yuan. Agriculture Statistic Year Book 2015. Available online: https://eng.coa.gov.tw/upload/files/eng_web_structure/2505278/A08-4_104.pdf (accessed on 24 January 2020).
  3. Taiwan Agriculture and Food Agency, Council of Agriculture, Executive Yuan. Agriculture Statistic Year Book 2016. Available online: https://eng.coa.gov.tw/upload/files/eng_web_structure/2505400/AA-2_A08-4_105.pdf (accessed on 24 January 2020).
  4. Taiwan Agriculture and Food Agency, Council of Agriculture, Executive Yuan. Agriculture Statistic Year Book 2017. Available online: https://eng.coa.gov.tw/upload/files/eng_web_structure/2505508/ZA_ZA10-4_106.pdf (accessed on 24 January 2020).
  5. Taiwan Agriculture and Food Agency, Council of Agriculture, Executive Yuan. Agriculture Statistic Year Book 2018. Available online: https://eng.coa.gov.tw/upload/files/eng_web_structure/2505565/ZA_ZA10-4_280_107.pdf (accessed on 24 January 2020).
  6. Yang, M.D.; Yang, Y.F.; Hsu, S.C. Application of remotely sensed data to the assessment of terrain factors affecting Tsao-Ling landside. Can. J. Remote Sens. 2004, 30, 593–603. [Google Scholar] [CrossRef]
  7. Yang, M.D. A genetic algorithm (GA) based automated classifier for remote sensing imagery. Can. J. Remote Sens. 2007, 33, 593–603. [Google Scholar] [CrossRef]
  8. Yang, M.D.; Su, T.C.; Hsu, C.H.; Chang, K.C.; Wu, A.M. Mapping of the 26 December 2004 tsunami disaster by using FORMOSAT-2 images. Int. J. Remote Sens. 2007, 28, 3071–3091. [Google Scholar] [CrossRef]
  9. Chauhan, S.; Darvishzadeh, R.; Boschetti, M.; Pepe, M.; Nelson, A. Remote Sensing-Based Crop Lodging Assessment: Current Status and Perspectives. ISPRS J. Photogramm. Remote Sens. 2019, 151, 124–140. [Google Scholar] [CrossRef] [Green Version]
  10. Zhao, L.; Yang, J.; Li, P.; Shi, L.; Zhang, L. Characterizing Lodging Damage in Wheat and Canola using Radarsat-2 Polarimetric SAR Data. Remote Sens. Lett. 2017, 8, 667–675. [Google Scholar] [CrossRef]
  11. Shu, M.; Zhou, L.; Gu, X.; Ma, Y.; Sun, Q.; Yang, G.; Zhou, C. Monitoring of maize lodging using multi-temporal Sentinel-1 SAR data. Adv. Space Res. 2020, 65, 470–480. [Google Scholar] [CrossRef]
  12. Han, D.; Yang, H.; Yang, G.; Qiu, C. Monitoring Model of Corn Lodging Based on Sentinel-1 Radar Image. In Proceedings of the 2017 SAR in Big Data Era: Models, Methods and Applications (BIGSARDATA), Beijing, China, 13–14 November 2017; pp. 1–5. [Google Scholar] [CrossRef]
  13. Coquil, B. FARMSTAR a Fully Operational System for Crop Management from Satellite Imagery. In Proceedings of the 7th International Conference on Precision Agriculture Conference, Minneapolis, MN, USA, 25–28 July 2004. [Google Scholar]
  14. Yang, M.; Huang, K.; Kuo, Y.; Tsai, H.; Lin, L. Spatial and Spectral Hybrid Image Classification for Rice Lodging Assessment through UAV Imagery. Remote Sens. 2017, 9, 583. [Google Scholar] [CrossRef] [Green Version]
  15. Liu, Z.; Li, C.; Wang, Y.; Huang, W.; Ding, X.; Zhou, B.; Wu, H.; Wang, D.; Shi, J. Comparison of Spectral Indices and Principal Component Analysis for Differentiating Lodged Rice Crop from Normal Ones. In Proceedings of the International Conference on Computer and Computing Technologies in Agriculture (CCTA), Beijing, China, 29–31 October 2011; pp. 84–92. [Google Scholar] [CrossRef] [Green Version]
  16. Wilke, N.; Siegmann, B.; Klingbeil, L.; Burkart, A.; Kraska, T.; Muller, O.; van Doorn, A.; Heinemann, S.; Rascher, U. Quantifying Lodging Percentage and Lodging Severity using a UAV-Based Canopy Height Model Combined with an Objective Threshold Approach. Remote Sens. 2019, 11, 515. [Google Scholar] [CrossRef] [Green Version]
  17. Zhao, X.; Yuan, Y.; Song, M.; Ding, Y.; Lin, F.; Liang, D.; Zhang, D. Use of Unmanned Aerial Vehicle Imagery and Deep Learning Unet to Extract Rice Lodging. Sensors 2019, 19, 3859. [Google Scholar] [CrossRef] [Green Version]
  18. Mardanisamani, S.; Maleki, F.; Hosseinzadeh Kassani, S.; Rajapaksa, S.; Duddu, H.; Wang, M.; Shirtliffe, S.; Ryu, S.; Josuttes, A.; Zhang, T. Crop Lodging Prediction from UAV-Acquired Images of Wheat and Canola using a DCNN Augmented with Handcrafted Texture Features. In Proceedings of the IEEE Conference on Computer Vision and Pattern Recognition Workshops (CVPRW), Long Beach, CA, USA, 16–20 June 2019. [Google Scholar]
  19. Kwak, G.; Park, N. Impact of Texture Information on Crop Classification with Machine Learning and UAV Images. Appl. Sci. 2019, 9, 643. [Google Scholar] [CrossRef] [Green Version]
  20. Yang, Q.; Shi, L.; Han, J.; Zha, Y.; Zhu, P. Deep Convolutional Neural Networks for Rice Grain Yield Estimation at the Ripening Stage using UAV-Based Remotely Sensed Images. Field Crops Res. 2019, 235, 142–153. [Google Scholar] [CrossRef]
  21. Huang, H.; Deng, J.; Lan, Y.; Yang, A.; Deng, X.; Zhang, L. A Fully Convolutional Network for Weed Mapping of Unmanned Aerial Vehicle (UAV) Imagery. PLoS ONE 2018, 13, e0196302. [Google Scholar] [CrossRef] [PubMed] [Green Version]
  22. Sa, I.; Popović, M.; Khanna, R.; Chen, Z.; Lottes, P.; Liebisch, F.; Nieto, J.; Stachniss, C.; Walter, A.; Siegwart, R. Weedmap: A Large-Scale Semantic Weed Mapping Framework using Aerial Multispectral Imaging and Deep Neural Network for Precision Farming. Remote Sens. 2018, 10, 1423. [Google Scholar] [CrossRef] [Green Version]
  23. Ma, X.; Deng, X.; Qi, L.; Jiang, Y.; Li, H.; Wang, Y.; Xing, X. Fully Convolutional Network for Rice Seedling and Weed Image Segmentation at the Seedling Stage in Paddy Fields. PLoS ONE 2019, 14, e0215676. [Google Scholar] [CrossRef] [PubMed]
  24. Ferentinos, K.P. Deep Learning Models for Plant Disease Detection and Diagnosis. Comput. Electron. Agric. 2018, 145, 311–318. [Google Scholar] [CrossRef]
  25. Kerkech, M.; Hafiane, A.; Canals, R. Deep Learning Approach with Colorimetric Spaces and Vegetation Indices for Vine Diseases Detection in UAV Images. Comput. Electron. Agric. 2018, 155, 237–243. [Google Scholar] [CrossRef]
  26. Fuentes-Pacheco, J.; Torres-Olivares, J.; Roman-Rangel, E.; Cervantes, S.; Juarez-Lopez, P.; Hermosillo-Valadez, J.; Rendón-Mancha, J.M. Fig Plant Segmentation from Aerial Images using a Deep Convolutional Encoder-Decoder Network. Remote Sens. 2019, 11, 1157. [Google Scholar] [CrossRef] [Green Version]
  27. Grinblat, G.L.; Uzal, L.C.; Larese, M.G.; Granitto, P.M. Deep Learning for Plant Identification using Vein Morphological Patterns. Comput. Electron. Agric. 2016, 127, 418–424. [Google Scholar] [CrossRef]
  28. Gonzalez, R.C.; Woods, R.E. Digital Image Processing; Pearson Education: Cranbury, NJ, USA, 2002. [Google Scholar]
  29. Richards, J.A.; Richards, J. Remote Sensing Digital Image Analysis; Springer: Berlin/Heidelberg, Germany, 1999. [Google Scholar] [CrossRef]
  30. Woebbecke, D.M.; Meyer, G.E.; Von Bargen, K.; Mortensen, D. Color Indices for Weed Identification under various Soil, Residue, and Lighting Conditions. Trans. ASAE 1995, 38, 259–269. [Google Scholar] [CrossRef]
  31. Meyer, G.E.; Neto, J.C. Verification of Color Vegetation Indices for Automated Crop Imaging Applications. Comput. Electron. Agric. 2008, 63, 282–293. [Google Scholar] [CrossRef]
  32. Badrinarayanan, V.; Kendall, A.; Cipolla, R. Segnet: A Deep Convolutional Encoder-Decoder Architecture for Image Segmentation. IEEE Trans. Pattern Anal. Mach. Intell. 2017, 39, 2481–2495. [Google Scholar] [CrossRef] [PubMed]
  33. Long, J.; Shelhamer, E.; Darrell, T. Fully Convolutional Networks for Semantic Segmentation. In Proceedings of the IEEE Conference on Computer Vision and Pattern Recognition, Boston, MA, USA, 7–12 June 2015; pp. 3431–3440. [Google Scholar] [CrossRef] [Green Version]
  34. Kingma, D.P.; Ba, J. Adam: A Method for Stochastic Optimization. arXiv 2014, arXiv:1412.6980. [Google Scholar]
  35. Yang, M.D.; Su, T.C.; Pan, N.F.; Yang, Y.F.; Su, T.C.; Pan, N.F.; Yang, Y.F. Systematic image quality assessment for sewer inspection. Expert Syst. Appl. 2011, 38, 1766–1776. [Google Scholar] [CrossRef]
  36. Paszke, A.; Chaurasia, A.; Kim, S.; Culurciello, E. Enet: A Deep Neural Network Architecture for Real-Time Semantic Segmentation. arXiv 2016, arXiv:1606.02147. [Google Scholar]
  37. Huang, G.; Liu, Z.; Van Der Maaten, L.; Weinberger, K.Q. Densely Connected Convolutional Networks. In Proceedings of the IEEE Conference on Computer Vision and Pattern Recognition, Honolulu, HI, USA, 21–26 July 2017; pp. 4700–4708. [Google Scholar] [CrossRef] [Green Version]
Figure 1. Study area with testing area enlarged on the right.
Remotesensing 12 00633 g001
Figure 2. High-resolution orthomosaic images: (a) 2019 image, (b) 2019 image with histogram matching process, and (c) 2017 image.
Remotesensing 12 00633 g002
Figure 3. Research flowchart.
Remotesensing 12 00633 g003
Figure 4. Illustration of the labeled ground truth on UAV images.
Remotesensing 12 00633 g004
Figure 5. Ground truth of rich lodging portion in white: (a) 2017 image and (b) 2019 image.
Remotesensing 12 00633 g005
Figure 6. SegNet structure illustration (reproduced from Badrinarayanan et al. [32]).
Remotesensing 12 00633 g006
Figure 7. FCN-AlexNet structure illustration (reproduced from Long et al. [33]).
Remotesensing 12 00633 g007
Figure 8. Performance evaluated by Per-category F1-score for the validation dataset.
Remotesensing 12 00633 g008
Figure 9. Rice lodging identification validation: (a) original image, (b) ground truth, (c1–c4) represents FCN-AlexNet (RGB), (RGB+ExG), (RGB+ExGR), (RGB+ExG+ExGR), respectively. (d1–d4) represents SegNet (RGB), (RGB+ExG), (RGB+ExGR), (RGB+ExG+ExGR), respectively.
Remotesensing 12 00633 g009
Figure 10. F1-score and accuracy comparison on the 2017 testing dataset for rice lodging.
Remotesensing 12 00633 g010
Figure 11. F1-score and accuracy comparison on the 2019 testing dataset for rice lodging.
Remotesensing 12 00633 g011
Figure 12. Results of FCN-AlexNet identification for rice lodging on 2017 testing dataset using various spectrum information: (a) RGB, (b) RGB+ExG, (c) RGB+ExGR, and (d) RGB+ExG+ExGR.
Remotesensing 12 00633 g012
Figure 13. Results of SegNet identification for rice lodging on 2017 testing dataset using various spectrum information: (a) RGB, (b) RGB+ExG, (c) RGB+ExGR, and (d) RGB+ExG+ExGR.
Remotesensing 12 00633 g013
Figure 14. Results of MLC identification for rice lodging on 2017 testing dataset using various spectrum information: (a) RGB, (b) RGB+ExG, (c) RGB+ExGR, and (d) RGB+ExG+ExGR.
Remotesensing 12 00633 g014
Figure 15. Results of rice lodging identification on 2019 testing dataset (white: rice lodging, black: others): (a) FCN-AlexNet using RGB+ExGR information, (b) SegNet using RGB+ExGR information, (c) ground truth. Results comparison with ground truth for (d) FCN-AlexNet using RGB+ExGR information and (e) SegNet using RGB+ExGR information.
Remotesensing 12 00633 g015
Figure 16. Results of identification on the total 230 ha. area by the best performance models: (a) 2017 dataset orthoimage, (b) 2017 dataset prediction of FCN-AlexNet using RGB+ExGR information, (c) 2017 dataset prediction of SegNet using RGB+ExGR, (d) ground truth, (e) 2019 dataset orthoimage, (f) 2019 dataset prediction of FCN-AlexNet using RGB+ExGR information, (g) 2019 dataset prediction of SegNet using RGB+ExGR.
Remotesensing 12 00633 g016
Table 1. UAV imaging sensor details.
DescriptionSony QX100DJI Phantom 4 Pro
Pixel size (um)2.4
Focal length (mm)10.48.8
Resolution (width × height) (pixel)5472 × 3648
Image data (bit)8
Spatial resolution from 200m height image (cm/pixel)4.645.48
Sensor size (mm)13.2 × 8.8
Field of View (horizontal, vertical) (degree)64.8, 45.973.7, 53.1
Table 2. Details of data collection.
CameraSony QX-100DJI Phantom 4 Pro
Collection Date2017/06/082019/05/23
Resolution (width/height)46,343 × 25,65815,977 × 8191
Flight Height (m)230200
Area covered (ha)430120
GSD (cm)5.35.7
Tile resolution (col/row) pixels480 × 480480 × 4801440 × 14401440 × 1440
# effective tiles20826947272
Attributetrainvalidationtesttest
Table 3. Formulas of vegetation indices.
Vegetation IndicesFormulaReferences
ExG 2 × G n R n B n Woebbecke et al. (1995) [30]
ExR 1.4 × R n G n Meyer and Neto (2008) [31]
ExGR ExG ExR = 3 × G n 2.4 × R n B n Meyer and Neto (2008) [31]
Table 4. Computation resource for model training, validation, and testing.
CPUIntel Xeon Gold 6154 @3.00GHz (4 cores/GPU node)
RAM90GB/GPU node
AcceleratorNVIDIA Tesla V100 32GB SMX2/GPU node
ImageTensorFlow-19.08-py3
LibrariesPython 3.6.8, NumPy 1.14.5, scikit-image 0.16.1, TensorFlow-GPU 1.14, Keras 2.3.1, Jupiter notebook, CUDA 10.1
Table 5. Evaluation matrices with associated formulas.
Evaluation MatricesFormula
Precision precision c =   T P c T P c + F P c
Recall recall c =   T P c T P c + F N c
Accuracy accuracy c =   T P c + T N c T P c + T N c + F P c + F N c
Overall accuracy OA = c = 1 n   T P c + T N c T P c + T N c + F P c + F N c
F β score F β =   ( 1 + β 2 ) × P r e c i s i o n × R e c a l l β 2 P r e c i s i o n + R e c a l l
F 1 score F 1 =   2 × P r e c i s i o n × R e c a l l P r e c i s i o n + R e c a l l
Table 6. Performance evaluated by Per-category F1-score and Overall Accuracy on the validation dataset (the highest value is shown in bold).
ModelInformationRice Paddy (%)Rice Lodging (%)Road (%)Bareland (%)Background (%)OA (%)
FCN-AlexNetRGB92.7777.9160.0492.9592.9490.57
RGB+ExG92.5176.3260.6793.7292.9190.40
RGB+ExGR93.0080.0856.9595.3693.5291.24
RGB+ExG+ExGR92.4977.0157.7494.3192.8690.38
SegNetRGB91.4970.0062.1392.1093.2789.56
RGB+ExG91.0275.3767.3793.6693.1089.70
RGB+ExGR91.2974.174.2492.2491.1188.04
RGB+ExG+ExGR90.9170.4446.6891.1088.0685.80
Table 7. Results on the 2017 testing dataset for rice lodging category (the highest value is shown in bold and the colors shadow corresponds to three classifiers in Figure 10 and Figure 11).
ClassifierInformationPrecision (%)Recall (%)Accuracy (%)F1-Score (%)Time (s)
FCN-AlexNetRGB84.7382.4394.4383.5659
RGB+ExG84.9280.8594.2582.8465
RGB+ExGR77.0288.8093.5382.4966
RGB+ExG+ExGR82.0284.4494.1583.2172
SegNetRGB83.1069.0692.2875.43101
RGB+ExG71.0389.6491.9479.26108
RGB+ExGR73.9683.3692.1078.38109
RGB+ExG+ExGR87.6657.3891.3069.36106
MLCRGB57.4396.1687.1071.911342
RGB+ExG61.1192.6588.6173.651538
RGB+ExGR63.4291.7689.5075.001492
RGB+ExG+ExGR56.4796.6486.6371.291526
Table 8. Results on the 2019 testing dataset for rice lodging category (the highest value is shown in bold and the colors shadow corresponds to three classifiers in Figure 10 and Figure 11).
ClassifierInformationPrecision (%)Recall (%)Accuracy (%)F1-Score (%)Time (s)
FCN-AlexNetRGB99.1239.5990.6656.5857
RGB+ExG95.0359.1893.2572.9467
RGB+ExGR95.3266.3994.3378.2768
RGB+ExG+ExGR93.1967.0394.1877.9771
SegNetRGB87.5538.6589.7253.6399
RGB+ExG57.0667.5087.1961.84109
RGB+ExGR81.3558.5991.5768.12107
RGB+ExG+ExGR82.4729.0788.1442.99113
MLCRGB58.6779.0788.2267.361416
RGB+ExG50.9987.7185.1564.491572
RGB+ExGR56.8886.3387.8368.581512
RGB+ExG+ExGR57.0380.6787.6866.821562

