Mid-Infrared Few-Cycle Pulse Generation and Amplification

College of Electronics and Information Engineering, Sichuan University, Chengdu 610064, China
*
Author to whom correspondence should be addressed.
Photonics 2021, 8(8), 290; https://doi.org/10.3390/photonics8080290
Submission received: 31 May 2021
/
Revised: 13 July 2021
/
Accepted: 14 July 2021
/
Published: 21 July 2021
(This article belongs to the Special Issue Laser Amplifiers)
Abstract
:In the past decade, mid-infrared (MIR) few-cycle lasers have attracted remarkable research efforts for their applications in strong-field physics, MIR spectroscopy, and bio-medical research. Here we present a review of MIR few-cycle pulse generation and amplification in the wavelength range spanning from 2 to ~20 μm. In the first section, a brief introduction on the importance of MIR ultrafast lasers and the corresponding methods of MIR few-cycle pulse generation is provided. In the second section, different nonlinear crystals including emerging non-oxide crystals, such as CdSiP2, ZnGeP2, GaSe, LiGaS2, and BaGa4Se7, as well as new periodically poled crystals such as OP-GaAs and OP-GaP are reviewed. Subsequently, in the third section, the various techniques for MIR few-cycle pulse generation and amplification including optical parametric amplification, optical parametric chirped-pulse amplification, and intra-pulse difference-frequency generation with all sorts of designs, pumped by miscellaneous lasers, and with various MIR output specifications in terms of pulse energy, average power, and pulse width are reviewed. In addition, high-energy MIR single-cycle pulses are ideal tools for isolated attosecond pulse generation, electron dynamic investigation, and tunneling ionization harness. Thus, in the fourth section, examples of state-of-the-art work in the field of MIR single-cycle pulse generation are reviewed and discussed. In the last section, prospects for MIR few-cycle lasers in strong-field physics, high-fidelity molecule detection, and cold tissue ablation applications are provided.
1. Introduction
The mid-infrared (MIR) wavelength is usually defined in the range of 2–20 μm (500–5000 cm−1). With its unique properties and wide application prospects, lasers in this band have attracted a great deal of attention from researchers all over the world. The main characteristics of an MIR laser can be summarized as the following two aspects. First, as the pondermotive energy is quadratically proportional to the driving laser wavelength, MIR lasers with high peak power have been routinely pursued as the driving sources for novel strong-field phenomenon [1,2,3,4,5,6,7,8,9], such as extreme ultra-violet and X-ray generation [10,11,12,13], attosecond pulse generation [14], and terahertz generation [15,16,17]. Second, most of the vibrational peaks of different molecules fall in the MIR band, which is also called the “molecular fingerprint” regime. Therefore, MIR coherent spectroscopy is a unique method for high-fidelity and high-sensitivity molecule detection and identification [18,19,20,21,22,23,24].
As for MIR solid-state lasers, there are two main technique streams to generate MIR pulses, namely the direct emission of doped ions and optical parametric down conversion. The former is based on a process wherein the gain medium is stimulated after energy storage, and the output wavelength depends on the energy level structures of the gain media. The biggest challenge of this process is that the relaxation energy in the MIR wavelength coincides with the phonon vibration energy, which reduces the gain and hinders the lasing process at the MIR wavelength. The second technique is based on the parametric frequency conversion that is mainly assisted by nonlinear crystals that create the phase-matching conditions. In this process, there is no thermal accumulation, and broadband laser amplification can be realized through broadband phase matching, which supports the generation of few-cycle MIR pulses. At present, parametric down conversion has become an indispensable means to expand the new laser spectrum, generating pulses covering deep ultraviolet, visible, near-infrared, MIR, and THz wavelength regimes. In this paper, we review typical MIR nonlinear crystals and then summarize the techniques for the generation and amplification of ultrafast MIR lasers, including optical parametric amplification (OPA), optical parametric chirped-pulse amplification (OPCPA), and intra-pulse difference-frequency generation (IPDFG) with various kinds of designs. Subsequently, examples of state-of-the-art work in the field of MIR single-cycle pulse generation are reviewed and discussed. In the last part, new prospects for MIR few-cycle lasers in strong-field physics, high-fidelity molecule detection, and cold tissue ablation applications are provided.
2. MIR Nonlinear Crystals
Nonlinear crystals that are commonly used in MIR pulse generation and amplification mainly include KTiOAsO4 (KTA), KTiOPO4 (KTP), and LiNbO3 (LNO), which belong a group known as oxide crystals, and ZnGeP2 (ZGP), CdSiP2 (CSP), AgGaS2 (AGS), AgGaSe2 (AGSe), GaSe, BaGa4S7 (BGS), BaGa4Se7 (BGSe), LiGaS2 (LGS), and LiGaSe2 (LGSe), which are classified as non-oxide crystals. Generally, the damage threshold and mechanical hardness of oxide crystals are excellent, but their transparent range is limited to less than 5 µm, which is not conducive for the generation of long-wavelength MIR pulses. The effective nonlinear coefficient of non-oxide crystals is higher, and the transparency range can reach more than 10 µm, which is commonly used in the generation of long-wavelength infrared pulses. However, the bandgap energy of such crystals is generally around 2 eV, which makes the two-photon absorption non-negligible, and significantly reduces the damage threshold when pumped at an ~1 µm wavelength with high peak power. LGS and LGSe are relatively new MIR nonlinear crystals with large bandgap energy, which enables high peak power pump at an ~1 µm wavelength. However, the transparent range of LGS and LGSe are limited to 10 µm. High quality new MIR nonlinear crystals with large bandgap energy and a broader transparent range are desired. BGSe is one of the candidates, however, the crystal growth quality still needs substantial improvement. In addition to the above MIR nonlinear crystals, periodically poled crystals such as periodically poled LiNbO3 (PPLN), orientation-patterned GaAs (OP-GaAs), and orientation-patterned GaP (OP-GaP) have become an emerging stream in the MIR parametric down conversion with their excellent quasi-phase matching bandwidth and large nonlinear coefficients, although their aperture size is the current bottleneck for pulse energy upscaling. The optical specifications such as the transparent range, effective nonlinear coefficient, and bandgap energy of the commonly used MIR nonlinear crystals are compared and summarized in Table 1.
3. MIR Generation
Among all kinds of nonlinear polarizations, the most commonly used in down conversion is probably the second-order nonlinear effect due to the good efficiency. The three-wave mixing process introduced by the second-order nonlinear effect is the basis of second harmonics generation (SHG), difference-frequency generation (DFG), and OPA. DFG and OPA are the main methods of broadband MIR pulse generation and amplification. In a further step, combined with the theory of OPA and chirped-pulse amplification (CPA) technologies, OPCPA have emerged to scale up the pulse energy and peak power of MIR few-cycle lasers. In this section, we will review the state-of-the-art works using MIR few-cycle pulse generation and amplification via OPA, OPCPA, and IPDFG.
3.1. OPA
OPA is an old parametric technique with emission in the visible and near-infrared wavelength regimes. It has the merits of broadband emission and simple dispersion control. Recently, the OPA emission bad has been extended to MIR wavelengths pumped at ~1 and ~2 µm wavelengths, as summarized in Table 2. Typical work using MIR OPA are selected and reviewed in the following paragraphs.
In 2017, H. K. Liang demonstrated a sub-single-cycle MIR pulse synthesizer based on a MIR OPA, pumped by an OPCPA at 2 µm and at a 1 kHz repetition rate, as shown in Figure 1a [35]. A ZGP crystal was employed as the nonlinear crystal for its wide transparent range, large nonlinear coefficient, and broad phase-matching bandwidth. A CaF2 wedge divided the pump beam into two paths. One (~10 μJ) was used as the pump to generate a signal via supercontinuum generation in a BaF2 plate, while the other path entered the pump line of the MIR OPA. A broadband MIR emission covering 2.5–9 µm was demonstrated with 33 µJ pulse energy. A pulse width of 12.4 fs was measured, corresponding to 0.88 optical cycles at a 4.2 µm centre wavelength, as shown in Figure 1b–d.
Subsequently, in 2019, H. K. Liang’s group extended the centre wavelength of the single-cycle OPA to 8.8 µm using a GaSe nonlinear crystal that had a broader transmission range on the long-wavelength side compared to that of ZGP [36]. As shown in Figure 2a, the 2.15 µm pump with a duration of 51 fs and a repetition rate of 1 kHz was derived using a Ti:sapphire laser pumped OPA (TOPAS). A 1-mm-thick GaSe crystal was employed as the OPA crystal. An ultra-broadband idler pulse with its spectrum spanning from 4.2 to 16 µm supporting a Fourier-transform-limited pulse width of 19 fs and centered at 8.8 µm was generated, as presented in Figure 2b. Considering all of the losses, the idler pulse energy of 3.4 µJ through a Si plate and a long pass filter was obtained.
S. Nam et al. presented an octave-spanning 3–10 µm MIR OPA system based on a ZGP crystal, pumped by a 1 kHz, 2.4 µm, 250 fs Cr:ZnSe CPA [37]. The OPA system was seeded either by white light generation from a YAG plate or optical parametric generation (OPG) in a ZGP crystal, as shown in Figure 3. By combining the signal seed and pump with orthogonal polarization through a Si wafer placed at the Brewster angle, the signal beam was amplified in a 5 mm-long ZGP crystal, and the long-wavelength idler pulses were generated. With 0.55 mJ pump pulse energy, 130 μJ or 55 μJ overall OPA output (signal + idler) were obtained from the MIR OPA seeded by OPG or white light generation, which corresponds to a pump to signal + idler conversion efficiency of 23% or 10%, respectively.
In 2018, M. Seidel et al. employed PPLN crystal and wide-bandgap nonlinear crystal BGS in a MIR OPA pumped by a thin-disc laser at ~1 µm. As shown in Figure 4, MIR emission covering a spectral range of 2 to 11 µm was generated, with an output power of 5 W at 4.1 µm and 1.3 W at 8.5 µm [38]. Subsequently, in 2019, B. Chen reported a MIR laser source with a spectrum covering the 5–11 µm range and a pulse width of 32 fs [34]. The generated MIR pulse had a pulse energy of 220 nJ at a 50 kHz repetition rate.
In 2020, Heiner et al. presented an OPA system pumped by a Yb:KGd(WO4)2 laser system with a repetition rate of 100 kHz and pulse width of 180 fs at 1028 nm [33]. The pump was divided to produce white light as the seed of the amplification stage, where the crystal could be BGS or LGS with large bandgap energy. After the Ge lens, average pulse power of 59 mW at 10 µm and 81 mW at 8.1 µm through the BGS and LGS crystals of the same length respectively were obtained, and their pulse widths were measured as 126 fs (3.8 cycle) and 121 fs (4.5 cycle), as shown in Figure 5. This comparison indicates that BGS is a promising candidate for 1-µm-pumped OPAs generating MIR emission beyond 5 µm because of its larger size availability and longer transmission cutoff up to 13.7 µm.
3.2. MIR OPCPA
3.2.1. 2–4 µm OPCPA
OPCPA systems have superior energy and power upscaling capability. With careful dispersion management, amplified pulses with a pulse width close to the transform limit could be generated. High-energy, few-cycle light sources with a central wavelength of 2–4 µm, and multi-millijoule pulse energy have been realized in many research groups via OPCPA techniques. Table 3 summarizes the specifications of few-cycle 2–4 µm OPCPA. Subsequently, some a variety of previously published works are selected to elaborate in detail.
In a pioneer work, F. Krausz’s research group employed the broadband Ti:sapphire laser (oscillator and amplifier) as both the signal and pump at the same time [39]. As shown in Figure 6, the 1030 nm component of the broadband spectrum output from the Ti:sapphire oscillator was extracted and injected into a Yb:YAG thin disk amplifier to obtain the pump light synchronized with the signal beam. Non-collinear OPAs (NOPAs) were carried out in two stages using PPLN crystals and during the last power amplifier stage with a LNO crystal. Finally, a MIR output at a central wavelength of 2.1 µm and a repetition frequency of 3 kHz with a pulse energy of 1.2 mJ and a pulse width of 10.5 fs (1.5 cycles) was obtained.
In 2020, U. Keller’s research group presented an OPCPA system centered at a wavelength of 2.2 µm, generating 16.5 fs pulses (2.2 cycles) with 25 W of average power at 100 kHz [42]. As shown in Figure 7, the seed from a Ti:sapphire oscillator was amplified in a BBO crystal. The idler was then generated from the NOPA in another BBO. Through three NOPA stages, idler pulses were amplified to 300 μJ. Finally, after the compressor, pulses of 250 μJ and 16.5 fs were obtained. Based on the MIR OPCPA, soft-X ray emission with the spectrum extending to 0.6 keV was demonstrated.
The most famous MIR OPCPA in the 3–4 µm band is probably from the research team led by A. Baltuska. The MIR laser output with a central wavelength of 3.9 µm, pulse energy of 8–20 mJ, pulse width of ~90 fs, and a repetition rate of 20 Hz is demonstrated [52]. As shown in Figure 8, a Yb:KGW Kerr-lens mode-locked oscillator was used as the seed source. A signal light with an energy of 65 µJ and a central wavelength of 1460 nm generated from white light continuum was then obtained using successive three-stage parametric amplification based on KTP crystals. On the other hand, the 1064 nm component of the output spectrum of the oscillator was extracted and amplified into a pulse energy of 250 mJ by Nd:YAG CPAs, which served as the pumping source of the subsequent OPCPA system. Two-stage OPCPA was then constructed to obtain a 1.46 µm signal light of 22 mJ and a 3.9 µm idler light of 13 mJ. The output pulse with 8 mJ, ~80 fs was obtained by compressing the idle light. Further energy upscaling of the system to ~20 mJ has been demonstrated in subsequent work.
In the 3–4 µm band, J. Biegert’s team demonstrated a high-average-power MIR OPCPA with 21 W output power at a central wavelength of 3.25 µm and a repetition rate of 160 kHz [49]. As shown in Figure 9, the MIR seed at 3.25 µm was generated by a two-color fiber front-end in combination with a DFG stage. Afterwards, the MIR pulses were stretched and consecutively amplified in a preamplifier and two booster amplifiers. As it was being pumped, a Nd:YVO4-based master oscillator power amplifier (MOPA) was employed, providing 1.1 mJ, 9 ps pulses at a 1064 nm wavelength at a 160 kHz repetition rate. After three pre-amplifiers and four booster amplifiers, a MIR pulse with a 131 µJ pulse energy and a 21 W average power was obtained. The MIR laser output was then compressed down to 1.35 cycles via soliton self-compression in a noble gas filled anti-resonance photonic crystal fiber, yielding 14.5 fs pulses at 3.3 µm with a 9.6 W average power.
Y. Leng’s research team reported a 4 µm OPCPA with a 2.6 mJ pulse energy and a 1.6 cycle pulse width [53]. As shown in Figure 10, a CEP-sTable 4 µm seed with ~120 µJ energy was generated from a home-built OPA pumped by a commercial Ti:sapphire femtosecond laser. The pump laser for the MIR OPCPA was from a picosecond Nd:YAG laser that could deliver a 1064 nm pulses with up to 300 mJ energy and 50 ps pulse duration running at 100 Hz repetition rate. After two amplifier stages, the amplified 4 µm chirped pulse with 11.8 mJ energy was compressed to 105 fs by employing a grating compressor. In order to obtain a near-single-cycle pulse at 4 µm, a noble gas filled hollow-core fiber with a 1-mm inner core diameter and 3-m length was employed. Combined with a CaF2 bulk material, the MIR pulse with a pulse energy of 2.6 mJ was further compressed to 21.5 fs, corresponding to a 1.6 optical cycle at a 4 µm centre wavelength.
In 2021, H. K. Liang’s team demonstrated a high-energy and high-power 3 µm OPCPA pumped by a shaped flat-top beam [45]. With the combination of a commercial diffractive phase plate and a focus lens, a 1 µm Gaussian pump was transformed into a flat-top profile with a high beam shaping ratio of more than 95%, as shown in Figure 11a. An MIR OPCPA stage with a 2-fold efficiency enhancement of up to 13.5% was achieved with the shaped flat-top pump beam. 2.7 mJ, 27 W, 125 fs, 3 µm pulses with a 10 kHz repetition rate were generated, as measured in Figure 11b–d. The amplified flat-top-like MIR pulse was subsequently compressed to 50 fs through nonlinear compression in a thin YAG crystal, corresponding to 5 optical cycles, with ~90% compression efficiency. Equipping an OPCPA with a diffractive phase plate as the beam shaper is a simple, robust and cost-effective method. It could also, in principle, be applied to other parametric conversions at other wavelength ranges.
3.2.2. 5–10 µm OPCPA
In recent years, there have been emerging reports of long-wavelength MIR OPCPA systems with lasing wavelengths exceeding 5 µm. Table 4 summarizes long-wavelength MIR OPCPA systems with the centre wavelengths of 5 µm, 7 µm, and 9 µm.
In 2020, a 5 µm OPCPA system delivering multi-10 GW peak power femtosecond pulses at a 1 kHz repetition rate were reported [54]. The signal and pump seed pulses were provided by a fiber-based 40 MHz multi-color laser system, as shown in Figure 12. It contained three separate erbium (Er)-doped fiber amplifiers and generated pulses at 1.55 µm as well as two supercontinua. The latter pulses were then generated separately in two nonlinear fibers, optimized for supercontinuum with center wavelengths at 1.0 and 2.0 µm, respectively. The signal at 3.5 µm was provided by DFG using a 1.5 µm oscillator and 1 µm supercontinuum pulses. The pulses with a center of gravity at 2 µm served as seed for the pump 36 mJ pump. Subsequently, through four-stage OPAs, a 5 µm MIR emission with 3.4 mJ pulse energy and 89.4 fs pulse width was obtained.
In 2016, J. Biegert’s team demonstrated a high-energy, few-cycle 7 µm OPCPA [55]. As shown in Figure 13, the system started with an Er:Tm:Ho:fiber laser which generated a 7 µm seed via DFG in a CSP crystal. The 7 µm seed pulse was then amplified in a ZGP-based OPCPA chain pumped by a cryogenic-cooled Ho:YLF CPA system with a 260 mJ pump energy at 2052 nm and a 16 ps pulse width. The pulses were first put through both a pre-amplifier and booster amplifier stage, and finally put through a compressor, after which a 7 µm pulses with a 0.75 mJ pulse energy and a 188 fs pulse width were obtained.
Recently, H. K. Liang’s research group reported a 9 µm, few cycle MIR OPCPA based on LiGaS2 crystals pumped by a 1 µm Yb:YAG laser at a 10 kHz repetition rate [56]. This is the first long-wavelength MIR OPCPA pumped at the 1 µm wavelength. As shown in Figure 14, a small fraction separated from the Yb:YAG pump was injected into the YAG crystal to produce a white-light continuum with a central wavelength of 1.16 µm. The stretched signal pulses were amplified in two consecutive amplification stages. Finally, long-wavelength MIR idler pulses centered at 9 µm with a 14 μJ pulse energy and a 142 fs (4.7 optical cycles) duration at a 10 kHz repetition rate were achieved. The 9 µm pulses were further compressed to 45 fs corresponding to 1.5 optical cycles by nonlinear compression using a KrS-5 bulk material [57].
3.3. MIR Intra-Pulse DFG
DFG has remarkable advantages such as a single pass structure without complex cavity adjustment and a broad tuning range of the output spectrum. Intra-pulse DFG (IPDFG) is a special DFG process that uses the low and high frequency components of an ultra-broadband pump pulse to realize MIR femtosecond emission. In this method, only an ultra-broadband pump laser with a few-cycle pulse width is needed, which further simplifies the DFG process. Table 5 lists the state-of-the-art work that have generated few-cycle MIR laser pulses.
In 2015, I. Pupeza et al. presented a pioneer work on MIR IPDFG. As shown in Figure 15, a Yb:YAG high-average power laser was employed to pump a LGS crystal that had large bandgap energy. The compact apparatus generated MIR pulses with a 0.1 W output power and a spectral coverage of 6.8–16.4 µm. A 66 fs pulse width corresponding to sub-two cycles centered at 11.5 µm wavelength was measured. Through a proof-of-concept demonstration, the MIR IPDFG provided a simple and robust method for generating MIR pulses with high average power and high dynamic range that could for molecular spectroscopy and hyperspectral imaging applications as well as time-domain coherent control of vibrational dynamics [59].
Based on MIR nonlinear crystals with a larger nonlinear coefficient, such as ZGP, GaSe, and AGSe, a number of research groups have performed MIR IPDFG pumped at an ~2 µm wavelength. C. Gaida et. al, demonstrated a source of coherent MIR radiation with the combination of 150 mW average power and 3.7–18 µm spectral coverage in the molecular fingerprint region pumped at 1.9 µm wavelength, as shown in Figure 16 [60].
J. Zhang et al. demonstrated few-cycle pulse generation by means of the soliton self-compression of the pump pulse in a silica-core photonic-crystal fiber, and subsequently, LWIR generation using IPDFG, resulting in a two-octave-spanning spectrum (−30 dB) from 5 to 20 µm at an average power of 24 mW, as shown in Figure 17 [62].
O. Novak et al. implemented a MIR IPDFG pumped by a 2 µm OPCPA in a AGSe crystal in 2018 [63], where carrier-envelope phase-stable idler pulses covering the wavelength range of 7–11 µm were achieved, as shown in Figure 18.
S. Vasilyev et al. demonstrated efficient generation of coherent long-wave MIR transients using, a compact 2.5 µm Cr:ZnS MOPA laser system as a pump source that could directly produce < 20 fs pulses without additional pulse compression, as shown in Figure 19 [64]. A ZGP crystal was suited for the generation of an octave-wide spectrum (5.8–12.5 µm) with an output power of 0.15 W and an optical conversion efficiency of 3% while a GaSe crystal allowed, with types I and II phase matching, the coverage of a 2 octave spectral span (4.3–17.6 µm), although with lower output power (13 mW).
The pump-to-MIR conversion efficiency of IPDFG could be improved by using a long driving wavelength to reduce the quantum defect. In 2019, H. K. Liang’s group investigated a MIR IPDFG pumped at a 3 µm pump wavelength in a GaSe crystal. As shown in Figure 20, the MIR output had a 5 µJ pulse energy and an average power of 50 mW. It spanned over a spectral range from 6–13.2 µm, with a record-high conversion efficiency of up to 5.3% [65].
4. Single-Cycle MIR Generation
High energy single- or sub-cycle MIR pulses can provide unique opportunities to explore phase-sensitive strong-field light-matter interactions in atoms, molecules, and solids. Tremendous efforts have been made to reduce the duration of a laser pulse down to a few-cycle or to the single-cycle regime. Obtaining such an ultrashort laser pulse requires spectral broadening and phase control over the ultrabroad spectrum that supports a single-cycle pulse. At present, four methods have been used to generate single-cycle MIR pulses, namely DFG, four-wave mixing (FWM), OPA, and IPDFG. Table 6 shows several works that have generated single- or sub-cycle MIR pulses.
4.1. MIR Single-Cycle Pulse Generation via DFG
In 2010, F. Junginger et al. employed a cascaded OPA and DFG system, which produced a phase-stable single-cycle transients with frequency components of 1–60 THz and a peak field intensity of 12 MV/cm, pumped by a high pulse energy of a regenerative Ti:sapphire amplifier [67]. This amplifier delivered a 5 mJ, 1 kHz pulse, pumping two OPAs both seeded by a shared white-light continuum. The output wavelengths of the two OPAs were 1.28 µm and 1.18 µm with a pulse energy of 150 µJ and 360 µJ, respectively, serving as the input of the MIR DFG. The two broadband outputs from two OPAs were mixed in a type-I GaSe crystal. The DFG output was a single-cycle MIR pulse with a 46 fs pulse width, with its spectrum centered at the 22 THz.
In 2015, A. A. Lanin et al. presented a MIR transient centered at a wavelength of 7.9 µm with the pulse width of 45 fs (~1.2 cycle) and the spectrum ranged from 3–18 µm at 1 kHz repetition rate [68]. As shown in Figure 21, first, a seed produced by supercontinuum in a sapphire plate, which was driven by 810 nm, 0.8 mJ, 65 fs, 1 kHz pulses delivered by a Ti:sappire laser. This seed was sent to an OPA with a BBO crystal, generating tunable signal and idler pulses that ranged from 1150–1580 nm and 1620–2300 nm, respectively. In the second step, the signal and idler from the OPA were used for DFG in an AGS crystal, producing a MIR pulse with a pulse duration of 150 fs and pulse energy of ~2 µJ at the central wavelength of 7.9 µm. After that, the MIR radiation underwent spectral broadening and self-compression in a 5 mm GaAs plate with high nonlinearity, leading to a spectrum covering 3–18 µm, and the pulse width compressed into 45 fs. In 2016, A. A. Lanin and his group repeated the experiment and changed the centre wavelength of the DFG output to 6.8 µm, the spectrum of which hit the point of zero group-velocity dispersion (GVD). Using this method, even more efficient spectral broadening and self-compression could take place, which generated a source of sub-cycle pulse with 1 µJ pulse energy [72].
In 2017, P. Krogen et al. used the adiabatic DFG (ADFG) to transfer the near-infrared frequencies to the MIR spectrum and produce a single-cycle MIR pulse [69]. The ADFG system consisted of an octave spanning Ti:sapphire oscillator seed source, which was used to seed a 1 kHz Nd:YLF CPA, and a 2-stage OPCPA system pumped by the same Nd:YLF amplifier. The OPCPA system used 2 grism pairs and an acousto-optic programmable dispersive filters to chirp the near-IR pulses to an approximately 3 ps duration for efficient amplification by the second harmonic of the Nd:YLF laser. The resulting chirped near-infrared pulses were down-converted to the MIR using chirped pulse difference frequency generation with the narrowband 1047 nm output of the Nd:YLF amplifier using the ADFG crystal to generate chirped pulses in the MIR. Finally, these were compressed in a 21-mm thick silicon block back to their transform-limited duration. The MIR output spanning 1.8–4.4 µm at −10 dB from the peak, with a pulse duration of 10.7 fs (1.2 optical cycles), and a pulse energy of 1 µJ at 1 kHz repetition rate are shown in Figure 22.
4.2. MIR Single-Cycle Pulse Generation via FWM
In 2012, Y. Nomura et al. investigated MIR sub-cycle pulse generation via FWM. The fundamental mode and second-harmonic pulses of a 25 fs Ti:sappire amplifier output with the wavelength of 800 nm and energy of 0.9 mJ at 1 kHz were focused into argon gas, producing a phase-stable sub-cycle MIR pulse through FWM assisted by filament [70]. As shown in Figure 23, a phase-stable 250 nJ, 7.4 fs (0.57 cycles) MIR conical emission centered at 3.9 µm with its spectrum coverage of 2–20 µm was created.
4.3. MIR Single-Cycle Pulse Generation via OPA
In 2017, H. K. Liang et al. generated a MIR sub-cycle pulse from an OPA with the signal and idler pulses at 3.2 µm and 6.4 µm [35]. It was demonstrated that with the stable carrier-envelope phase for both the signal and idler pulses and the careful control of the relative delay, the signal and idler pulses were synthesized without extra coherent control. As shown in Figure 24, the synthesized pulse had a spectral coverage from 2.5 to 9.0 µm, and a pulse width of 12.4 fs which corresponded to 0.88 cycles for a central wavelength of 4.2 µm.
4.4. MIR Single-Cycle Pulse Generation via IPDFG
In 2018, H. Timmers et al. presented a scheme for generating super-octave spanning MIR frequency combs with a bandwidth spanning from 4 to 12 µm through IPDFG in an OP-GaP crystal driven by a few-cycle Er-pump infrastructure [28]. As shown in Figure 25a, the output of an Er mode-locked laser was amplified using an Er-doped fiber amplifier. The amplified pulses then undergo nonlinear broadening in a nonlinear fiber and were compressed to a few-cycle pulse width serving as the pump of IPDFG. MIR radiation spanning from 4 to 12 µm was generated from an OP-GaP crystal. Subsequently, in 2019, from the same group, A. S. Kowligy et al. measured the temporal profile of the MIR pulse via electro-optical sampling using an ultra-short near-infrared reference pulse. A 1.2-cycle MIR pulse oscillating at a 7.6 µm centre wavelength was obtained [73].
In 2019, T. P. Butler et al. reported a phase-stable source with watt-scale average power and broad bandwidth (6–18 µm) via the IPDFG in GaSe crystal pumped by thulium-doped fiber-laser system at 2 µm [71]. The 2 µm pump pulses from the fiber chirped-pulse amplifier had an average power of 100 W and were compressed by grating pairs to the output of 40 W. The compressed 2 µm output was then divided into two parts and further compressed nonlinearly through photonic crystal fibers to 13 fs with 4.5 W power and 32 fs with a 30 W power, respectively. The 32 fs pulse was focused into a 1 mm GaSe crystal for MIR IPDFG. As shown in Figure 26, after a 6 mm of bulk germanium for compression, a MIR transient with a broad spectral range (6–18 µm) and ultra-short pulse duration of 43 fs (~1 cycle) at 50 MHz was characterized through electro-optical sampling with the help of the 13 fs near-infrared reference.
5. Prospects of High-Power Broad-Band Few-Cycle MIR Lasers
The development of high-power broadband few-cycle MIR lasers has been driven by a number of applications in the field of strong-field physics, high-fidelity molecule detection, and cold tissue ablation applications. In strong-field physics, high-order harmonic generation (HHG) with excellent spatial coherence is probably one of the biggest driving forces of strong MIR OPCPA. Extreme ultra-violet harmonics with the photon energy exceeding the water absorption window have been generated via the MIR OPCPA pump [17]. The famous 3.9 µm OPCPA has enabled the generation of soft X-ray HHG with the photon energy extended to 1500 eV. Besides HHG, femtosecond hard X-ray covering tens of keV photon energy has been excited through plasma generation in a metallic target, pumped by the MIR OPCPA [13]. Attosecond pulse generation is another main application of MIR OPCPA in the field of strong-field physics. A total of 40–50 as isolated attosecond pulses have been generated pumped by 1.8 μm OPCPA/OPA [1]. Moreover, terahertz generation with a high conversion efficiency of 2.36% has been achieved via MIR two-colour filamentation in air pumped by MIR OPCPA centred at 3.9 µm. Besides the peak power of the MIR OPCPA system, which sets the threshold and cut-off of the aforementioned strong-field applications, the average power is another important parameter to pursue, which accounts for photon flux. Therefore, it is suggested high-average power MIR OPCPAs with decent pulse energy be the next research phase focus serving as the enablers to reveal a more uncharted continent in the field of strong-field physics.
Molecule detection is another important application of MIR OPCPA. Laser filamentation in air pumped by energetic MIR OPCPAs has been realized at the 3.9 and 2 µm wavelengths [74,75]. Stand-off detection of ambient air molecules such as CO2 have been demonstrated via air filamentation pumped using MIR OPCPA [22]. By using the atmospheric transparent windows in the MIR wavelength region, namely the 2–5.5 µm and 8–14 µm bands, more molecules in the air could be detected with MIR OPCPAs, especially at longer wavelengths such as 5 and 9 µm. In addition, dual-frequency combs (DFCs) based on broadband MIR lasers have been developed for sensitive and precision molecule sensing. With DFCs at the 3–5 µm wavelength range, the detection of molecular species in a gas mixture, including isotopologues containing isotopes such as 13C, 18O, 17O, 15N, 34S, 33S, and deuterium, with part-per-billion sensitivity and sub-Doppler resolution has been demonstrated [23]. At longer wavelengths covering 4 to 12 µm, DFCs have enabled the high-precision vapor detection of methanol and ethanol. With the high-average power of the MIR broadband laser sources at a 100 MHz repetition rate, a good signal-to-noise ratio (67 Hz1/2) has been achieved with a sub-ms acquisition time.
Besides strong-field physics and spectroscopic applications, high-power, broadband, few-cycle lasers have also been used in minimally invasive surgery. However, limited by the available femtosecond laser wavelengths, its current applications in bio-medical micro processing/surgery are only limited to cataract surgery [76,77] and myopia correction surgery [78,79,80]. An MIR wavelength at 3–10 µm coincides with strong molecular resonant peaks, which results in strong and sharp absorption peaks for various molecules. The strong absorption resonances of water, protein, and lipids have been investigated using MIR femtosecond laser exposure from a free-electron laser facility in ocular, brain, and dermis tissues. A new mechanism for tissue ablation was proposed. It was found that when a MIR femtosecond laser at the 6.2–6.7 µm wavelength is chosen, the laser output power is absorbed by both water and proteins. Reaching ~60 °C, collagen undergoes structural transitions from highly ordered arrays to amorphous gelatin with less resilience, which enables better tissue ablation efficiency and less lateral damages. With the emerging and development of high-power MIR femtosecond lasers at more flexible wavelengths, we foresee promising prospects for watt-level MIR femtosecond lasers in the soft and hard tissue cold ablation applications.
6. Conclusions
In this paper, we have shown that the field of high-energy, high-power, few-cycle MIR lasers has experienced rapid development over the last 10 years that has been driven by the demands of strong-field physics (such as in HHG, attosecond generation, and terahertz generation experiments), high-fidelity molecule detection (such as in MIR dual-comb spectroscopy), and tissue cold ablation. Possible trends for the next phase would include increasing the high average power (high repetition rate), for example, by a few to a few tens watts of MIR few-cycle pulses with mJ pulse energy output, would be highly desired to boost the photon flux, enhance the signal-to-noise ratio, and reduce detection time. This puts requirements and challenges in place to improve on both the high-power pump source and techniques to raise the parametric conversion efficiency, for example, by using a quasi-parametric amplifier [81,82], cascaded extraction from OPA [83], or a flat-top pumped parametric process.
Author Contributions
Writing—original draft preparation, K.T., L.H. and X.Y.; writing—review and editing, H.L. All authors have read and agreed to the published version of the manuscript.
Funding
National Natural Science Foundation of China (62075144) and the Engineering Featured Team Fund of Sichuan University (2020SCUNG105).
Institutional Review Board Statement
Not applicable.
Informed Consent Statement
Not applicable.
Data Availability Statement
No new data were created or analyzed in this study. Data sharing is not applicable to this article.
Conflicts of Interest
The authors declare no conflict of interest.
References
- Li, J.; Ren, X.; Yin, Y.; Zhao, K.; Chew, A.; Cheng, Y.; Cunningham, E.; Wang, Y.; Hu, S.; Wu, Y.; et al. 53-attosecond X-ray pulses reach the carbon K-edge. Nat. Commun. 2017, 8, 186. [Google Scholar] [CrossRef] [Green Version]
- Popmintchev, T.; Chen, M.; Popmintchev, D.; Arpin, P.; Brown, S.; Ališauskas, S.; Andriukaitis, G.; Balčiunas, T.; Mücke, O.D.; Pugzlys, A.; et al. Bright coherent ultrahigh harmonics in the keV X-ray regime from mid-infrared femtosecond lasers. Science 2012, 336, 1287–1291. [Google Scholar] [CrossRef] [PubMed]
- Wolter, B.; Pullen, M.G.; Le, A.-T.; Baudisch, M.; Doblhoff-Dier, K.; Senftleben, A.; Hemmer, M.; Schröter, C.D.; Ullrich, J.; Pfeifer, T.; et al. Ultrafast electron diffraction imaging of bond breaking in di-ionized acetylene. Science 2016, 354, 308–312. [Google Scholar] [CrossRef] [PubMed] [Green Version]
- Colosimo, P.; Doumy, G.; Blaga, C.I.; Wheeler, J.; Hauri, C.; Catoire, F.; Tate, J.; Chirla, R.; March, A.M.; Paulus, G.G.; et al. Scaling strong-field interactions towards the classical limit. Nat. Phys. 2008, 4, 386–389. [Google Scholar] [CrossRef]
- Herink, G.; Solli, D.R.; Gulde, M.; Ropers, C. Field-driven photoemission from nanostructures quenches the quiver motion. Nature 2012, 483, 190–193. [Google Scholar] [CrossRef]
- Hohenleutner, M.; Langer, F.; Schubert, O.; Knorr, M.; Huttner, U.; Koch, S.W.; Kira, M.; Huber, R. Real-time observation of interfering crystal electrons in high-harmonic generation. Nature 2015, 523, 572–575. [Google Scholar] [CrossRef] [Green Version]
- Ghimire, S.; DiChiara, A.D.; Sistrunk, E.; Agostini, P.; DiMauro, L.F.; Reis, D.A. Observation of high-order harmonic generation in a bulk crystal. Nat. Phys. 2011, 7, 138–141. [Google Scholar] [CrossRef]
- Schubert, O.; Hohenleutner, M.; Langer, F.; Urbanek, B.; Lange, C.; Huttner, U.; Golde, D.; Meier, T.; Kira, M.; Koch, S.W.; et al. Sub-cycle control of terahertz high-harmonic generation by dynamical Bloch oscillations. Nat. Photonics 2014, 8, 119–123. [Google Scholar] [CrossRef] [Green Version]
- Rybka, T.; Ludwig, M.; Schmalz, M.F.; Knittel, V.; Brida, D.; Leitenstorfer, A. Sub-cycle optical phase control of nanotunnelling in the single-electron regime. Nat. Photonics 2016, 10, 667–670. [Google Scholar] [CrossRef] [Green Version]
- Schliesser, A.; Picqué, N.; Hänsch, T.W. Mid-infrared frequency combs. Nat. Photonics 2012, 6, 440–449. [Google Scholar] [CrossRef] [Green Version]
- Haas, J.; Mizaikoff, B. Advances in mid-infrared spectroscopy for chemical analysis. Annu. Rev. Anal. Chem. 2016, 9, 45–68. [Google Scholar] [CrossRef] [PubMed]
- Kara, O.; Maidment, L.; Gardiner, T.; Schunemann, P.G.; Reid, D.T. Dual-comb spectroscopy in the spectral fingerprint region using OPGaP optical parametric oscillators. Opt. Express 2017, 25, 32713–32721. [Google Scholar] [CrossRef]
- Keilmann, F.; Gohle, C.; Holzwarth, R. Time-domain mid-infrared frequency-comb spectrometer. Opt. Lett. 2004, 29, 1542–1544. [Google Scholar] [CrossRef] [PubMed] [Green Version]
- Schmidt, C.; Pertot, Y.; Balciunas, T.; Zinchenko, K.; Matthews, M.; Wörner, H.J.; Wolf, J.-P. High-order harmonic source spanning up to the oxygen K-edge based on filamentation pulse compression. Opt. Express 2018, 26, 11834–11842. [Google Scholar] [CrossRef] [Green Version]
- Teichmann, S.M.; Silva, F.; Cousin, S.L.; Hemmer, M.; Biegert, J. 0.5-keV Soft X-ray attosecond continua. Nat. Commun. 2016, 7, 11493. [Google Scholar] [CrossRef] [Green Version]
- Popmintchev, D.; Galloway, B.R.; Chen, M.; Dollar, F.; Mancuso, C.A.; Hankla, A.; Miaja-Avila, L.; O’Neil, G.; Shaw, J.M.; Fan, G.; et al. Near- and extended-edge X-ray-absorption fine-structure spectroscopy using ultrafast coherent high-order harmonic supercontinua. Phys. Rev. Lett. 2018, 120, 093002. [Google Scholar] [CrossRef] [Green Version]
- Weisshaupt, J.; Juvé, V.; Holtz, M.; Ku, S.; Woerner, M.; Elsaesser, T.; Ališauskas, S.; Pugžlys, A.; Baltuška, A. High-brightness table-top hard X-ray source driven by sub-100-femtosecond mid-infrared pulses. Nat. Photonics 2014, 8, 927–930. [Google Scholar] [CrossRef]
- Gaumnitz, T.; Jain, A.; Pertot, Y.; Huppert, M.; Jordan, I.; Ardana-Lamas, F.; Wörner, H.J. Streaking of 43-attosecond soft-X-ray pulses generated by a passively CEP-stable mid-infrared driver. Opt. Express 2017, 25, 27506–27518. [Google Scholar] [CrossRef]
- Koulouklidis, A.D.; Gollner, C.; Shumakova, V.; Fedorov, V.Y.; Pugžlys, A.; Baltuška, A.; Tzortzakis, S. Observation of extremely efficient terahertz generation from mid-infrared two-color laser filaments. Nat. Commun. 2020, 11, 292. [Google Scholar] [CrossRef] [Green Version]
- Manceau, J.-M.; Loukakos, P.A.; Tzortzakis, S. Direct acoustic phonon excitation by intense and ultrashort terahertz pulses. Appl. Phys. Lett. 2010, 97, 251904. [Google Scholar] [CrossRef]
- Mitrofanov, A.V.; Sidorov-Biryukov, D.A.; Nazarov, M.M.; Voronin, A.A.; Rozhko, M.V.; Shutov, A.D.; Serebryannikov, E.E.; Fedotov, A.B.; Zheltikov, A.M. Ultraviolet-to-millimeter-band supercontinua driven by ultrashort mid-infrared laser pulses. Optica 2020, 7, 15–19. [Google Scholar] [CrossRef]
- Ycas, G.; Giorgetta, F.R.; Baumann, E.; Coddington, I.; Herman, D.; Diddams, S.A.; Newbury, N.R. High-coherence mid-infrared dual-comb spectroscopy spanning 2.6 to 5.2 μm. Nat. Photonics 2018, 12, 202–208. [Google Scholar] [CrossRef] [Green Version]
- Muraviev, A.V.; Smolski, V.O.; Loparo, Z.E.; Vodopyanov, K.L. Massively parallel sensing of trace molecules and their isotopologues with broadband subharmonic mid-infrared frequency combs. Nat. Photonics 2018, 12, 209–214. [Google Scholar] [CrossRef]
- Timmers, H.; Kowligy, A.; Lind, A.; Cruz, C.F.; Nader, N.; Silfies, M.; Ycas, G.; Allison, T.K.; Schunemann, P.G.; Papp, S.B.; et al. Molecular fingerprinting with bright, broadband infrared frequency combs. Optica 2018, 5, 727–732. [Google Scholar] [CrossRef]
- Catella, G.C.; Burlage, D. Crystal growth and optical properties of AgGaS2 and AgGaSe2. MRS Bull. 1998, 23, 28–36. [Google Scholar] [CrossRef]
- Zhang, X.; Yao, J.; Yin, W.; Zhu, Y.; Wu, Y.; Chen, C. Determination of the nonlinear optical coefficients of the BaGa4Se7 crystal. Opt. Express 2015, 23, 552–558. [Google Scholar] [CrossRef] [PubMed]
- Schunemann, P.G.; Zawilski, K.T.; Pollak, T.M.; Petrov, V.; Zelmon, D.E. CdSiP2: A new nonlinear optical crystal for 1- and 1.5-micron-pumped mid-IR generation. In Advanced Solid-State Photonics; Optical Society of America: Denver, CO, USA, 2009; p. TuC6. [Google Scholar]
- Wandel, S.; Lin, M.; Yin, Y.; Xu, G.; Jovanovic, I. Parametric generation and characterization of femtosecond mid-infrared pulses in ZnGeP2. Opt. Express 2016, 24, 5287–5299. [Google Scholar] [CrossRef] [PubMed]
- Weber, M.J. Handbook of Optical Materials; CRC Press: Boca Raton, FL, USA, 2002. [Google Scholar]
- Petrov, V. Frequency down-conversion of solid-state laser sources to the mid-infrared spectral range using non-oxide nonlinear crystals. Prog. Quant. Electron. 2015, 42, 1–106. [Google Scholar] [CrossRef]
- Skauli, T.; Vodopyanov, K.L.; Pinguet, T.J.; Schober, A.; Levi, O.; Eyres, L.A.; Fejer, M.M.; Harris, J.S.; Gerard, B.; Becouarn, L.; et al. Measurement of the nonlinear coefficient of orientation-patterned GaAs and demonstration of highly efficient second-harmonic generation. Opt. Lett. 2002, 27, 628–630. [Google Scholar] [CrossRef]
- Schunemann, P.G.; Zawilski, K.T.; Pomeranz, L.A.; Creeden, D.J.; Budni, P.A. Advances in nonlinear optical crystals for mid-infrared coherent sources. J. Opt. Soc. Am. B 2016, 33, D36–D43. [Google Scholar] [CrossRef]
- Heiner, Z.; Petrov, V.; Mero, M. Efficient, sub-4-cycle, 1-µm-pumped optical parametric amplifier at 10 µm based on BaGa4S7. Opt. Lett. 2020, 45, 5692–5695. [Google Scholar] [CrossRef]
- Chen, B.; Wittmann, E.; Morimoto, Y.; Baum, P.; Riedle, E. Octave-spanning single-cycle middle-infrared generation through optical parametric amplification in LiGaS2. Opt. Express 2019, 27, 21306–21318. [Google Scholar] [CrossRef] [Green Version]
- Liang, H.; Krogen, P.; Wang, Z.; Park, H.; Kroh, T.; Zawilski, K.; Schunemann, P.; Moses, J.; Dimauro, L.; Kartner, F.X.; et al. High-energy mid-infrared sub-cycle pulse synthesis from a parametric amplifier. Nat. Commun. 2017, 8, 141. [Google Scholar] [CrossRef]
- Liu, K.; Liang, H.; Wang, L.; Qu, S.; Lang, T.; Li, H.; Wang, Q.J.; Zhang, Y. Multimicrojoule GaSe-based midinfrared optical parametric amplifier with an ultrabroad idler spectrum covering 4.2–16 µm. Opt. Lett. 2019, 44, 1003–1006. [Google Scholar] [CrossRef] [PubMed] [Green Version]
- Nam, S.-H.; Fedorov, V.; Mirov, S.; Hong, K.-H. Octave-spanning mid-infrared femtosecond OPA in a ZnGeP2 pumped by a 2.4 µm Cr:ZnSe chirped-pulse amplifier. Opt. Express 2020, 28, 32403–32414. [Google Scholar] [CrossRef]
- Seidel, M.; Xiao, X.; Hussain, S.A.; Arisholm, G.; Hartung, A.; Zawilski, K.T.; Schunemann, P.G.; Habel, F.; Trubetskov, M.; Pervak, V.; et al. Multi-watt, multi-octave, mid-infrared femtosecond source. Sci. Adv. 2018, 4, eaaq1526. [Google Scholar] [CrossRef] [Green Version]
- Deng, Y.; Schwarz, A.; Fattahi, H.; Ueffing, M.; Gu, X.; Ossiander, M.; Metzger, T.; Pervak, V.; Ishizuki, H.; Taira, T.; et al. Carrier-envelope-phase-stable, 1.2 mJ, 1.5 cycle laser pulses at 2.1 µm. Opt. Lett. 2012, 37, 4973–4975. [Google Scholar] [CrossRef] [Green Version]
- Feng, T.; Heilmann, A.; Bock, M.; Ehrentraut, L.; Witting, T.; Yu, H.; Stiel, H.; Eisebitt, S.; Schnürer, M. 27 W 2.1 µm OPCPA system for coherent soft X-ray generation operating at 10 kHz. Opt. Express 2020, 28, 8724–8733. [Google Scholar] [CrossRef] [PubMed]
- Lai, C.; Hong, K.; NSiqueira, J.P.; Krogen, P.; Chang, C.; Stein, G.J.; Liang, H.; Keathley, P.D.; Laurent, G.; Moses, J. Multi-mJ mid-infrared kHz OPCPA and Yb-doped pump lasers for tabletop coherent soft x-ray generation. J. Opt. 2015, 17, 094009. [Google Scholar] [CrossRef]
- Pupeikis, J.; Chevreuil, P.-A.; Bigler, N.; Phillips, C.R.; Keller, U. Water window soft x-ray source enabled by a 25 W few-cycle 2.2 µm OPCPA at 100 kHz. Optica 2020, 7, 168–171. [Google Scholar] [CrossRef] [Green Version]
- Bigler, N.; Pupeikis, J.; Hrisafov, S.; Gallmann, L.; Phillips, C.R.; Keller, U. High-power OPCPA generating 1.7 cycle pulses at 2.5 µm. Opt. Express 2018, 26, 26750–26757. [Google Scholar] [CrossRef] [PubMed]
- Zou, X.; Li, W.; Liang, H.; Liu, K.; Qu, S.; Wang, Q.J.; Zhang, Y. 300 µJ, 3 W, few-cycle, 3 µm OPCPA based on periodically poled stoichiometric lithium tantalate crystals. Opt. Lett. 2019, 44, 2791–2794. [Google Scholar] [CrossRef]
- Zou, X.; Li, W.; Qu, S.; Liu, K.; Li, H.; Wang, Q.J.; Zhang, Y.; Liang, H. Flat-top pumped multi-millijoule mid-infrared parametric chirped-pulse amplifier at 10 kHz repetition rate. Laser Photonics Rev. 2021, 15, 2000292. [Google Scholar] [CrossRef]
- Rigaud, P.; Walle, A.V.; Hanna, M.; Forget, N.; Guichard, F.; Zaouter, Y.; Guesmi, K.; Druon, F.; Georges, P. Supercontinuum-seeded few-cycle mid-infrared OPCPA system. Opt. Express 2016, 24, 26494–26502. [Google Scholar] [CrossRef] [PubMed]
- Mero, M.; Heiner, Z.; Petrov, V.; Rottke, H.; Branchi, F.; Thomas, G.M.; Vrakking, M.J.J. 43 W, 1.55 µm and 12.5 W, 3.1 µm dual-beam, sub-10 cycle, 100 kHz optical parametric chirped pulse amplifier. Opt. Lett. 2018, 43, 5246–5249. [Google Scholar] [CrossRef]
- Thiré, N.; Maksimenka, R.; Kiss, B.; Ferchaud, C.; Gitzinger, G.; Pinoteau, T.; Jousselin, H.; Jarosch, S.; Bizouard, P.; Piero, V.D.; et al. Highly stable, 15 W, few-cycle, 65 mrad CEP noise mid-IR OPCPA for statistical physics. Opt. Express 2018, 26, 26907–26915. [Google Scholar] [CrossRef]
- Elu, U.; Baudisch, M.; Pires, H.; Tani, F.; Frosz, M.H.; Köttig, F.; Ermolov, A.; Russell, P.S.J.; Biegert, J. High average power and single-cycle pulses from a mid-IR optical parametric chirped pulse amplifier. Optica 2017, 4, 1024–1029. [Google Scholar] [CrossRef]
- Mayer, B.W.; Phillips, C.R.; Gallmann, L.; Fejer, M.M.; Keller, U. Sub-four-cycle laser pulses directly from a high-repetition-rate optical parametric chirped-pulse amplifier at 3.4 μm. Opt. Lett. 2013, 38, 4265–4268. [Google Scholar] [CrossRef] [PubMed] [Green Version]
- Zhao, K.; Zhong, H.; Yuan, P.; Xie, G.; Wang, J.; Ma, J.; Qian, L. Generation of 120 GW mid-infrared pulses from a widely tunable noncollinear optical parametric amplifier. Opt. Lett. 2013, 38, 2159–2161. [Google Scholar] [CrossRef] [Green Version]
- Andriukaitis, G.; Balčiūnas, T.; Ališauskas, S.; Pugžlys, A.; Baltuška, A.; Popmintchev, T.; Chen, M.-C.; Murnane, M.M.; Kapteyn, H.C. 90 GW peak power few-cycle mid-infrared pulses from an optical parametric amplifier. Opt. Lett. 2011, 36, 2755–2757. [Google Scholar] [CrossRef]
- Wang, P.; Li, Y.; Li, W.; Su, H.; Shao, B.; Li, S.; Wang, C.; Wang, D.; Zhao, R.; Peng, Y.; et al. 2.6 mJ/100 Hz CEP-stable near-single-cycle 4 µm laser based on OPCPA and hollow-core fiber compression. Opt. Lett. 2018, 43, 2197–2200. [Google Scholar] [CrossRef]
- Grafenstein, L.V.; Bock, M.; Ueberschaer, D.; Escoto, E.; Koç, A.; Zawilski, K.; Schunemann, P.; Griebner, U.; Elsaesser, T. Multi-millijoule, few-cycle 5 µm OPCPA at 1 kHz repetition rate. Opt. Lett. 2020, 45, 5998–6001. [Google Scholar] [CrossRef]
- Elu, U.; Steinle, T.; Sanchez, D.; Maidment, L.; Zawilski, K.; Schunemann, P.; Zeitner, U.D.; Simon-Boisson, C.; Biegert, J. Table-top high-energy 7 µm OPCPA and 260 mJ Ho:YLF pump laser. Opt. Lett. 2019, 44, 3194–3197. [Google Scholar] [CrossRef] [PubMed] [Green Version]
- Qu, S.; Liang, H.; Liu, K.; Zou, X.; Li, W.; Wang, Q.J.; Zhang, Y. 9 µm few-cycle optical parametric chirped-pulse amplifier based on LiGaS2. Opt. Lett. 2019, 44, 2422–2425. [Google Scholar] [CrossRef] [PubMed]
- Qu, S.; Nagar, G.C.; Li, W.; Liu, K.; Zou, X.; Luen, S.H.; Dempsey, D.; Hong, K.-H.; Wang, Q.J.; Zhang, Y.; et al. Long-wavelength-infrared laser filamentation in solids in the near-single-cycle regime. Opt. Lett. 2020, 45, 2175–2178. [Google Scholar] [CrossRef]
- Chen, B.-H.; Nagy, T.; Baum, P. Efficient middle-infrared generation in LiGaS2 by simultaneous spectral broadening and difference-frequency generation. Opt. Lett. 2018, 43, 1742–1745. [Google Scholar] [CrossRef] [Green Version]
- Pupeza, I.; Sánchez, D.; Zhang, J.; Lilienfein, N.; Seidel, M.; Karpowicz, N.; Paasch-Colberg, T.; Znakovskaya, I.; Pescher, M.; Schweinberger, W.; et al. High-power sub-two-cycle mid-infrared pulses at 100 MHz repetition rate. Nat. Photonics 2015, 9, 721–724. [Google Scholar] [CrossRef]
- Gaida, C.; Gebhardt, M.; Heuermann, T.; Stutzki, F.; Jauregui, C.; Antonio-Lope, J.; Schulzgen, A.; Amezcua-Correa, R.; Tunnermann, A.; Pupeza, L.; et al. Watt-scale super-octave mid-infrared intrapulse difference frequency generation. Light Sci. Appl. 2018, 7, 94. [Google Scholar] [CrossRef]
- Zhang, J.; Fritsch, K.; Wang, Q.; Krause, F.; Mak, K.F.; Pronin, O. Intra-pulse difference-frequency generation of mid-infrared (2.7–20 µm) by random quasi-phase-matching. Opt. Lett. 2019, 44, 2986–2989. [Google Scholar] [CrossRef] [Green Version]
- Zhang, J.; Mak, K.F.; Nagl, N.; Seidel, M.; Bauer, D.; Sutter, D.; Pervak, V.; Krausz, F.; Pronin, O. Multi-mW, few-cycle mid-infrared continuum spanning from 500 to 2250 cm–1. Light Sci. Appl. 2018, 7, 17180. [Google Scholar] [CrossRef]
- Novak, O.; Krogen, P.R.; Kroh, T.; Mocek, T.; Kartner, F.X.; Hong, K.-H. Femtosecond 8.5 µm source based on intrapulse difference-frequency generation of 2.1 µm pulses. Opt. Lett. 2018, 43, 1335–1338. [Google Scholar] [CrossRef] [PubMed]
- Vasilyev, S.; Moskalev, I.S.; Smolski, V.O.; Peppers, J.M.; Mirov, M.; Muraviev, A.V.; Zawilski, K.; Schunemann, P.G.; Mirov, S.B.; Vodopyanov, K.L.; et al. Super-octave longwave mid-infrared coherent transients produced by optical rectification of few-cycle 2.5-μm pulses. Optica 2019, 6, 111–114. [Google Scholar] [CrossRef] [Green Version]
- Liu, K.; Liang, H.; Qu, S.; Li, W.; Zou, X.; Zhang, Y.; Wang, Q.J. High-energy mid-infrared intrapulse difference-frequency generation with 5.3% conversion efficiency driven at 3 µm. Opt. Express 2019, 27, 37706–37713. [Google Scholar] [CrossRef] [PubMed]
- Cinque, G.; Frogley, M.D.; Bartolini, R. Far-IR/THz spectral characterization of the coherent synchrotron radiation emission at diamond IR beamline B22. Rend. Fis. Acc. Lincei. 2011, 22, 33–47. [Google Scholar] [CrossRef]
- Junginger, F.; Sell, A.; Schubert, O.; Mayer, B.; Brida, D.; Marangoni, M.; Cerullo, G.; Leitenstorfer, A.; Huber, R. Single-cycle multiterahertz transients with peak fields above 10 MV/cm. Opt. Lett. 2010, 35, 2645–2647. [Google Scholar] [CrossRef] [Green Version]
- Lanin, A.A.; Voronin, A.A.; Stepanov, E.A.; Fedotov, A.B.; Zheltikov, A.M. Multioctave, 3–18 µm sub-two-cycle supercontinua from self-compressing, self-focusing soliton transients in a solid. Opt. Lett. 2015, 40, 974–977. [Google Scholar] [CrossRef]
- Krogen, P.; Suchowski, H.; Liang, H.; Flemens, N.; Hong, K.-H.; Kärtner, F.X.; Moses, J. Generation and multi-octave shaping of mid-infrared intense single-cycle pulses. Nat. Photon. 2017, 11, 222–226. [Google Scholar] [CrossRef]
- Nomura, Y.; Shirai, H.; Ishii, K.; Tsurumachi, N.; Voronin, A.A.; Zheltikov, A.M.; Fuji, T. Phase-stable sub-cycle mid-infrared conical emission from filamentation in gases. Opt. Express 2012, 20, 24741–24747. [Google Scholar] [CrossRef]
- Butler, T.P.; Gerz, D.; Hofer, C.; Xu, J.; Gaida, C.; Heuermann, T.; Gebhardt, M.; Vamos, L.; Schweinberger, W.; Gessner, J.A.; et al. Watt-scale 50-MHz source of single-cycle waveform-stable pulses in the molecular fingerprint region. Opt. Lett. 2019, 44, 1730–1733. [Google Scholar] [CrossRef] [Green Version]
- Stepanov, E.A.; Lanin, A.A.; Voronin, A.A.; Fedotov, A.B.; Zheltikov, A.M. Solid-state source of subcycle pulses in the midinfrared. Phys. Rev. Lett. 2016, 117, 043901. [Google Scholar] [CrossRef] [Green Version]
- Kowligy, A.S.; Timmers, H.; Lind, A.J.; Elu, U.; Cruz, F.C.; Schunemann, P.G.; Biegert, J.; Diddams, S.A. Infrared electric field sampled frequency comb spectroscopy. Sci. Adv. 2019, 5, eaaw8794. [Google Scholar] [CrossRef] [PubMed] [Green Version]
- Mitrofanov, A.V.; Voronin, A.A.; Sidorov-Biryukov, D.A.; Pugžlys, A.; Stepanov, E.A.; Andriukaitis, G.; Flöry, T.; Ališauskas, S.; Fedotov, A.B.; Baltuška, A.; et al. Mid-infrared laser filaments in the atmosphere. Sci. Rep. 2015, 5, 8368. [Google Scholar] [CrossRef] [PubMed] [Green Version]
- Liang, H.; Weerawarne, D.L.; Krogen, P.; Grynko, R.I.; Lai, C.J.; Shim, B.; Kärtner, F.X.; Hong, K.H. Mid-infrared laser filaments in air at a kilohertz repetition rate. Optica 2016, 3, 678–681. [Google Scholar] [CrossRef] [Green Version]
- Nagy, Z.; Takacs, A.; Filkorn, T.; Sarayba, M. Initial clinical evaluation of an intraocular femtosecond laser in cataract surgery. J. Refract. Surg. 2009, 25, 1053–1060. [Google Scholar] [CrossRef] [Green Version]
- Taravella, M.J.; Meghpara, B.; Frank, G.; Gensheimer, W.; Davidson, R. Femtosecond laser–assisted cataract surgery in complex cases. J. Cataract Refract. Surg. 2016, 42, 813–816. [Google Scholar] [CrossRef]
- Shah, R.; Shah, S. Effect of scanning patterns on the results of femtosecond laser lenticule extraction refractive surgery. J. Cataract Refract. Surg. 2011, 37, 1636–1647. [Google Scholar] [CrossRef]
- Sekundo, W.; Kunert, K.; Russmann, C.; Gille, A.; Bissmann, W.; Stobrawa, G.; Sticker, M.; Bischoff, M.; Blum, M. First efficacy and safety study of femtosecond lenticule extraction for the correction of myopia: Six-month results. J. Cataract Refract. Surg. 2008, 34, 1513–1520. [Google Scholar] [CrossRef]
- Blum, M.; Kunert, K.; Schröder, M.; Sekundo, W. Femtosecond lenticule extraction for the correction of myopia: Preliminary 6-month results. Graefes Arch. Clin. Exp. Ophthalmol. 2010, 248, 1019–1027. [Google Scholar] [CrossRef]
- Ma, J.; Wang, J.; Yuan, P.; Xie, G.; Xiong, K.; Tu, Y.; Tu, X.; Shi, E.; Zheng, Y.; Qian, L. Quasi-parametric amplification of chirped pulses based on a Sm3+-doped yttrium calcium oxyborate crystal. Optica 2015, 2, 1006–1009. [Google Scholar] [CrossRef]
- Ma, J.; Wang, J.; Zhou, B.; Yuan, P.; Xie, G.; Xiong, K.; Zheng, Y.; Zhu, H.; Qian, L. Broadband, efficient, and robust quasi-parametric chirped-pulse amplification. Opt. Express 2017, 25, 25149–25164. [Google Scholar] [CrossRef]
- Cao, H.; Tóth, S.; Kalashnikov, M.; Chvykov, V.; Osvay, K. Highly efficient, cascaded extraction optical parametric amplifier. Opt. Express 2018, 26, 7516–7527. [Google Scholar] [CrossRef]
Figure 1.
(a) The schematic of the high-energy phase-stable sub-cycle MIR OPA. Polarizations of the beams are marked by double-headed arrows and concentric circles. 300-µm thick Si wafers at Brewster angle were used as polarization beam splitter and beam combiner to transmit the 2.1-µm pump pulse and reflected the signal and idler pulses. The synthesized pulses and a branch of 2.1-µm reference pulses were sent into XFROG with 30-µm thick GaSe nonlinear crystal. The synthesis of a sub-cycle MIR pulse by coherently combining the sub-2-cycle signal and idler pulses is shown conceptually at the top of the figure. (b) The signal spectrum from WLG at BaF2, measured after a 2400 nm long-pass filter. (c) The measured output spectrum of the MIR OPA. The dotted line separates the signal and idler spectra. The retrieved temporal (d) intensity profiles of the synthesized pulse. Reprinted with permission from [35].

Figure 2.
(a) The schematic of the GaSe-based MIR OPA. The pump, the generated supercontinuum, and the amplified MIR pulses are shown in maroon, purple, and pink, respectively. (HWP: half wave plate, DL: delay line, LPF: long pass filter, BD: beam dump, CS: characterization setup, and L1–L6 are CaF2 lenses). The measured (solid blue, 20 nm resolution) and simulated (dashed red) spectra of the amplified signal (b) and the idler pulses (c). Reprinted with permission from [36].

Figure 3.
Experimental setup of MIR ZGP OPA. Red lines, 2.4 µm pump beam; green line, signal (seed) beam; blue dotted line, idler beam. M1–M4: Al mirrors; L1–L4: CaF2 lenses; F1: 3 µm LPF; F2: 4.5 or 7 µm LPF; W: ZnSe wedge; D: delay stage; NL: nonlinear crystal (YAG or ZGP); B: 300-μm-thick Brewster Si plate; WP: λ/2 waveplate. Reprinted with permission from [37].

Figure 4.
Tuning curves. (a) Generated MIR power for maximal pump power and tuning periods from 28 to 25.5 µm of the PPLN. The spectrum centered at 4.2 µm is shaped through CO2 absorption. The power was measured 25 cm behind the nonlinear crystal. (b) Tuning curve measured with a type I phase-matched LGS crystal. The OPA operated the most powerfully around 8.2 µm (slightly blue-shifted from type II). Upon detuning from this central point, the phase-matched wavelengths split, allowing the generation of very broadband spectra (vine red line). The spectra below 6 µm (black line) and above 10 µm (light blue line) needed different delays to be generated because of the uncompressed seed pulse. With type I phase matching, a maximal MIR power of 1.0 W could be generated. Type I, however, allowed the generation of slightly more broadband spectra than type II. Power spectral density is provided in units of mW/cm−1 and μW/frep, where frep = 37.5 MHz is the oscillator repetition rate. Reprinted with permission from [38].

Figure 5.
Illustration of BGS OPA laser system. BS, beam sampler; PR, partial reflector; WLC, white light continuum generation unit; L, lens; BD, beam dump. DM1, dichroic mirror, high reflection (HR) at 1.03 µm and high transmission (HT) at >1.1 µm; DM2, dichroic mirror, HR at 1.0–1.2 µm and HT at 6–12 µm; OPA, LGS or BGS crystal; Ge, germanium-based temporal chirp compensation unit. Reprinted with permission from [33].

Figure 6.
Schematic of 2.1 µm few-cycle OPCPA system. Reprinted with permission from [39].
Figure 6.
Schematic of 2.1 µm few-cycle OPCPA system. Reprinted with permission from [39].

Figure 7.
(a) 2.2 µm OPCPA layout. The inset on the top right shows the long-term output stability of the system and beam profile after cylindrical reshaping telescopes. (b) The retrieved pulse shape of the amplifier output. (c) Blue line, measured spectrum; blue-dashed line, retrieved spectrum; orange line, retrieved phase. Reprinted with permission from [42].

Figure 8.
Layout of the 3.9 µm OPCPA system. Reprinted with permission from [52].
Figure 8.
Layout of the 3.9 µm OPCPA system. Reprinted with permission from [52].

Figure 9.
Setup of the high-power, MIR OPCPA system. The seed was generated by a two-color fiber front-end in combination with a DFG stage. Afterward, the MIR pulses were stretched and consecutively amplified in a pre-amplifier and two booster amplifiers. Maximum conversion efficiencies were achieved by multiple uses of the pump beam and by individually tailored seed-to-pump pulse durations. Reprinted with permission from [49].

Figure 10.
Schematic of the 4 µm OPCPA and post-compression system. Reprinted with permission from [53].
Figure 10.
Schematic of the 4 µm OPCPA and post-compression system. Reprinted with permission from [53].

Figure 11.
(a) The schematic of flat-top beam shaping of the high-energy and high-average-power 3 µm OPCPA. The MIR pulses centered at 3 µm were generated and amplified to 300 µJ from 3-stage OPCPA preamplifiers via periodically poled lithium niobate (PPLN) and KTA crystals. The 4th OPCPA stage was designed to boost up the MIR output and enhance the parametric efficiency through the flat-top beam shaping. The Gaussian pump beam of the 4th-stage OPCPA was sent to a flat-top beam shaper consisting of a phase plate and a focus lens, and the flat-top pump beam is formed at the imaging plane of the lens. The Gaussian idler beam generated from the first 3 OPCPA stages was amplified with a flat-top pump, producing a high-energy and high-average-power flat-top-like 3 µm output. The measured pump beam profiles (b) with and (c) without the flat-top beam shaper on the KTA crystal. The cross-section beam profiles on the x and y axes are included too. (d) The pulse energy measurements of the 3 µm idler pulse from the OPCPA with flat-top (red) and Gaussian (black) pump beam profiles. 2.7 mJ and 1.45 mJ MIR pulse energy were obtained from the flat-top and Gaussian pump, corresponding to 7% and 13.5% pump-to-idler efficiency for the 4th-OPCPA stage, respectively. Reprinted with permission from [45].

Figure 12.
Setup of the 2 µm pumped MIR OPCPA. Reprinted with permission from [54].
Figure 12.
Setup of the 2 µm pumped MIR OPCPA. Reprinted with permission from [54].

Figure 13.
Layout of the 7 µm OPCPA. The MIR seed was generated using the two broadband femtosecond outputs from a three-color fiber frontend via DFG. Afterwards, the MIR pulses were stretched in a dielectric bulk and consecutively amplified in a pre-amplifier and a booster amplifier separated with a chirp inversion stage. Maximum efficiency of the OPCPA was achieved by tailoring the seed-to-pump pulse durations in the pre-amplifier and booster amplifier. The broadband high-energy MIR pulses were recompressed using a dielectric bulk rod of BaF2. Reprinted with permission from [55].

Figure 14.
(a) The schematic of the 9 µm OPCPA. YAG, Yttrium aluminum garnet; ZnSe, zinc selenide window; HR, high reflective mirror; TFP, thin film polarizer; BS, beam splitter; LGS, LiGaS2 crystal; Ge, germanium window. For TFP, the reflectance of the S-polarized pump and the transmittance of the P-polarized signal were measured as >99% and 91% respectively. (b) The spectra of signal pulses after SC generation (blue dotted), the pre-amplification stage (red) and the main-amplification stage (black dashed); (c) the measured (black) and simulated (red dashed) spectra of the output idler pulse. Reprinted with permission from [56].

Figure 15.
(a) MIR generation and detection setup. (b) Normalized PSD of the Fourier transforms for the EOS time-domain trace of the retrieved field and of the NIR probe pulse. The dynamic measurement range, determined as the peak of the signal PSD divided by the average detector noise floor (blue, continuous line), was 2.7 × 10⁴. The absolute power per comb line of the generated MIR radiation, obtained by calibrating the normalized PSD of the retrieved MIR power spectrum by the independently measured total power and considering the pulse repetition frequency, is shown on the right axis. Reprinted with permission from [59].

Figure 16.
(a) Schematic experimental setup for IPDFG. (b) Brightness comparison of IPDPG and synchrotron radiation. High-power MIR spectra generated by IPDFG pumped at 2 µm wavelength (this work, red). The brightness of the high-power table-top MIR source in this work exceeds that of large-scale facility synchrotrons, e.g., the Diamond B22 IR beamline [66], by 4 orders of magnitude in the 7.5–15 µm wavelength range. Reprinted with permission from [60].

Figure 17.
(a) Self-compression and MIR generation setup. (b) MIR spectrum and beam profile. The MIR spectrum (red line) together with the noise floor (gray line) measured using a monochromator. The MIR spectrum extends from 500 cm−1 to 2250 cm−1 (−30 dB), corresponding to the wavelength range from 4.5 to 20 µm. Inset: the beam profile measured using a Pyrocam beam profiler. Reprinted with permission from [62].

Figure 18.
Schematic of the experimental setup for IPDFG. NDF, neutral density filter; λ/2, half-wave plate at 2020 nm in a rotation mount; L, lens; AGSe, 2 mm thick AGSe crystal; LPF, long-pass filter; P, power meter; OAP, off-axis parabola; FB, MIR fiber; M, MIR monochromator with MCT detector. Reprinted with permission from [63].

Figure 19.
(a) Schematic of the IPDFG setup. Normalized IPDFG spectra: (b) Obtained from ZGP at 4.5 W (black line) and 5.9 W (red line) pump. The spectral power density at the peak was 76 µW/nm and 71 µW/nm, respectively. (c) Obtained from GaSe for type I and type II phase-matching at 5.9 W pump, with the peak IPDFG spectral density of 3.1 µW/nm and 5.2 µW/nm, respectively. Scattered dots show the noise floor. Gray background shows transmission of 1 m standard air. Reprinted with permission from [64].

Figure 20.
(a) The schematic of experimental setups. (b) The measured IPDFG spectrum with p-polarization at 5 µJ output energy. Reprinted with permission from [65].
Figure 20.
(a) The schematic of experimental setups. (b) The measured IPDFG spectrum with p-polarization at 5 µJ output energy. Reprinted with permission from [65].

Figure 21.
Experimental setup. Ti:S, mode-locked Ti:sapphire master oscillator; MPA, multipass amplifier; OPA, optical parametric amplifier; AGS, AgGaS2 crystal; LPF, longpass filter; PM, parabolic mirror; L, BK7 glass lens; OD, optical delay line; PMH, parabolic mirror with a hole; FWM, four-wave mixing in a gas medium; SPF, shortpass filter; Spec, spectrometer. Reprinted with permission from [68].

Figure 22.
(a) A chirped adiabatic frequency conversion scheme employed the uncompressed broadband output of a near-IR OPCPA mixed with a longer-wavelength picosecond pump pulse in a periodically poled quasi-phase-matching grating, a bulk silicon post-compressor and a frequency-resolved optical gating (FROG) characterization device. Measurement of a single-cycle MIR pulse. (b) Retrieved pulse as a function of time (blue, temporal intensity; gray, temporal phase) showing a 10.7-fs full-width at half-maximum (FWHM) pulse duration (1.2 optical cycles at the central wavelength of 2.8 µm), which is 1.15 times the transform-limited duration. (c) Spectral intensity (red, measured; blue, retrieved) and retrieved spectral phase (gray). Reprinted with permission from [69].

Figure 23.
(a) Experimental and (b) retrieved XFROG traces. The retrieved pulse in (c) time and (d) frequency domain. The spectrum measured with Fourier transform spectrometer (brown solid curve) is also shown. Reprinted with permission from [70].
Figure 23.
(a) Experimental and (b) retrieved XFROG traces. The retrieved pulse in (c) time and (d) frequency domain. The spectrum measured with Fourier transform spectrometer (brown solid curve) is also shown. Reprinted with permission from [70].

Figure 24.
Temporal characterisation of the synthesised MIR pulse. The retrieved spectral (a) and temporal (b) intensity profiles of the synthesised pulse. The dotted curves are the retrieved phase. Pulse width (12.4 fs) at full width at half maximum is measured with a centre wavelength at 4.2 µm. It corresponds to 0.88 optical cycle. Reprinted with permission from [35].

Figure 25.
(a) Experimental layout for IPDFG comb generation. (b) The spectrum of this few-cycle driver. The inset of (b) displays the measured intensity profile of the pump pulse, corresponding to a pulse duration of 10.6 fs. (c) Super-octave longwave infrared (LWIR) spectra containing up to 0.25 mW of power. Reprinted with permission from [24].

Figure 26.
(a) Measured (left)and retrieved (right) FROG spectrograms of the longer pulse PCF compression channel. (b) Retrieved FROG temporal intensity and phase. (c) Retrieved FROG spectral intensity and phase compared to independently measured spectrum obtained using a NIR grating spectrometer. (d–f) shows the same information as (a–c), this time measured for the shorter pulse PCF channel. Reprinted with permission from [71].


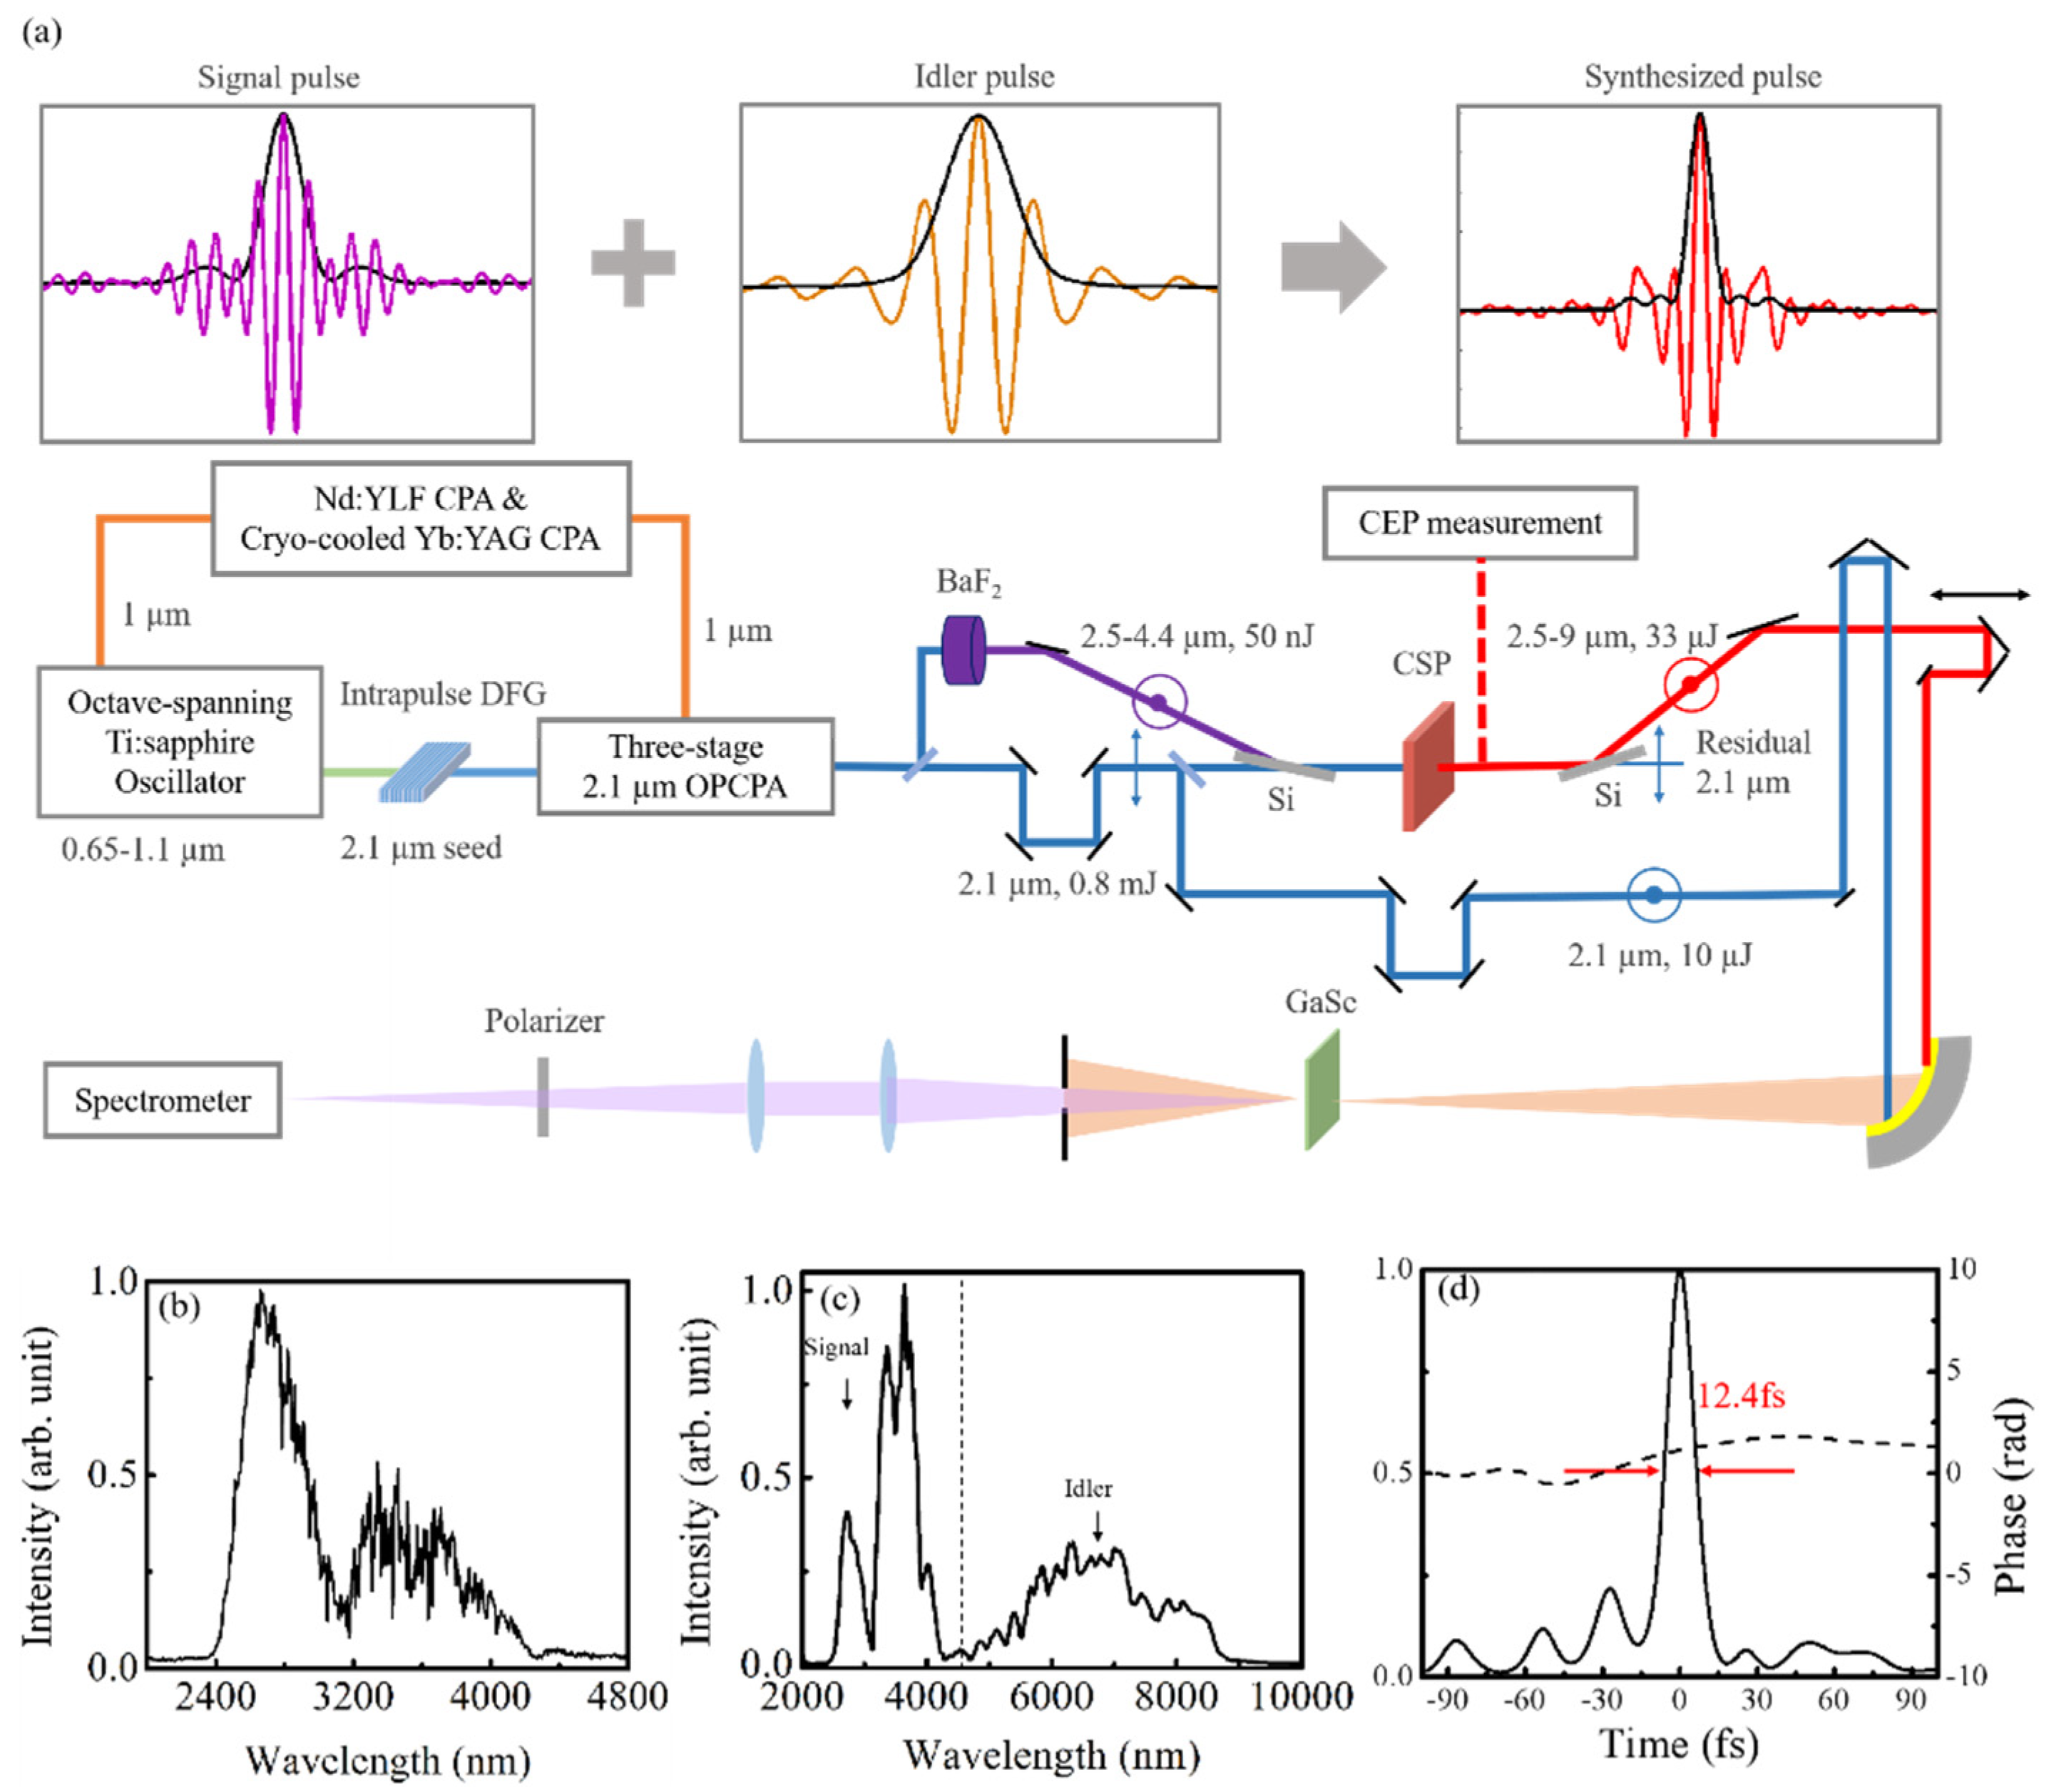
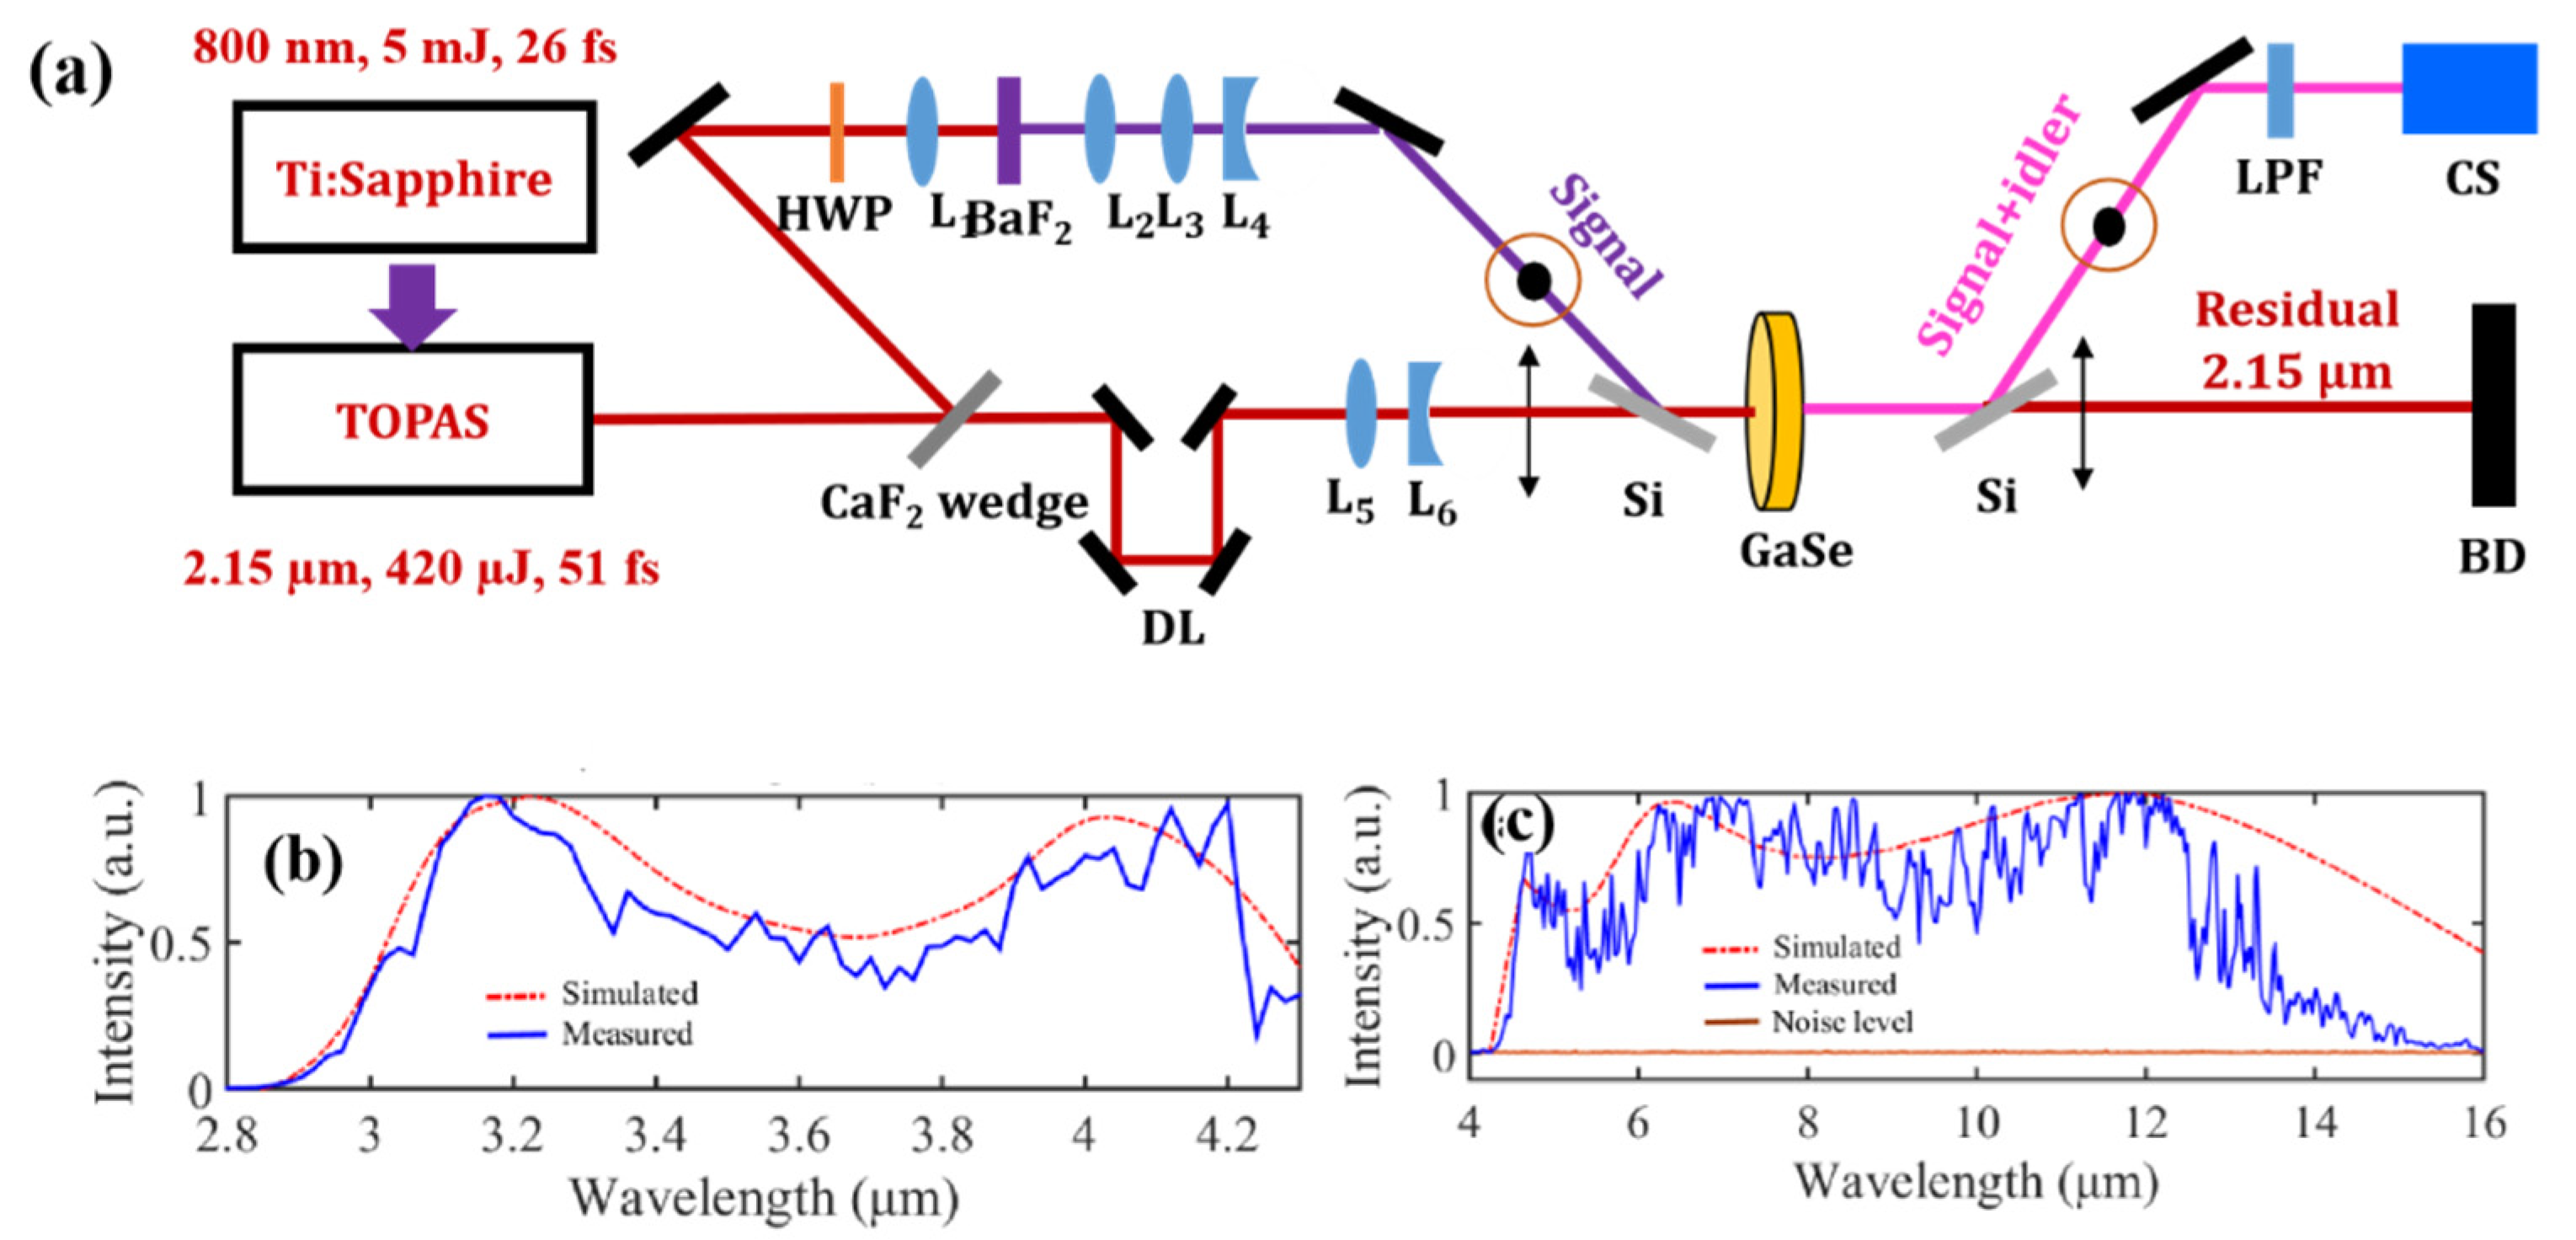
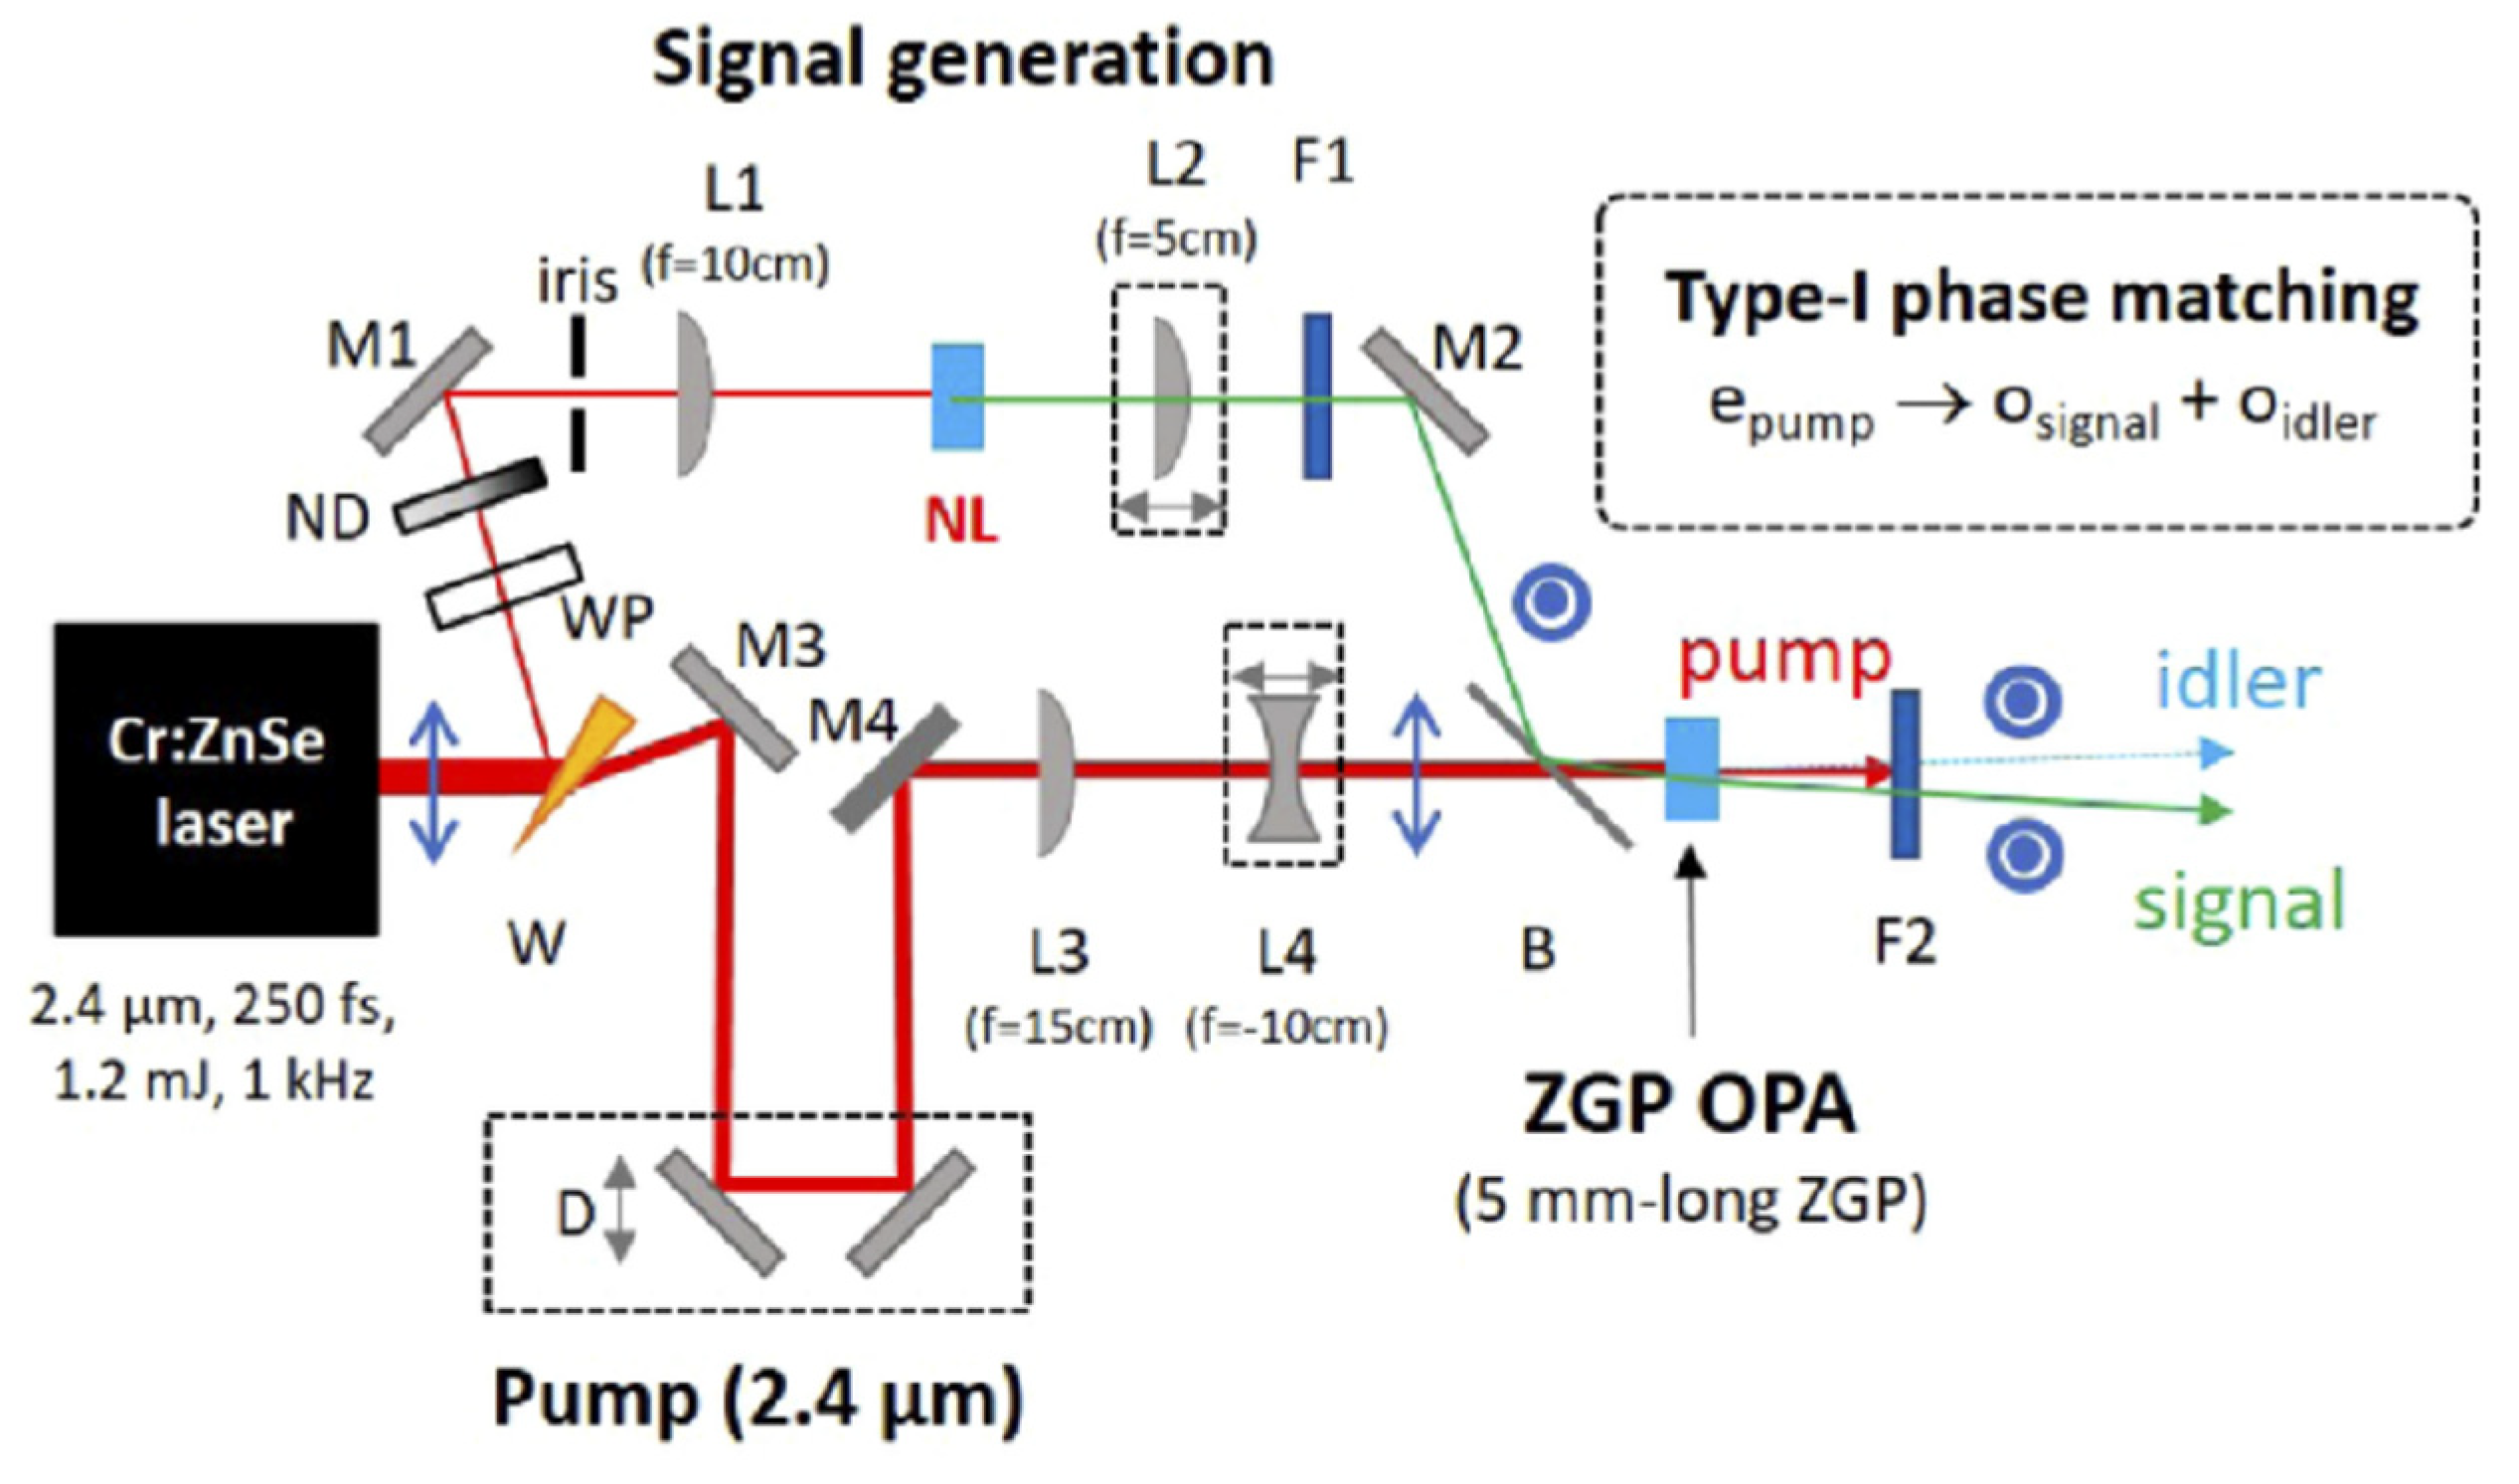
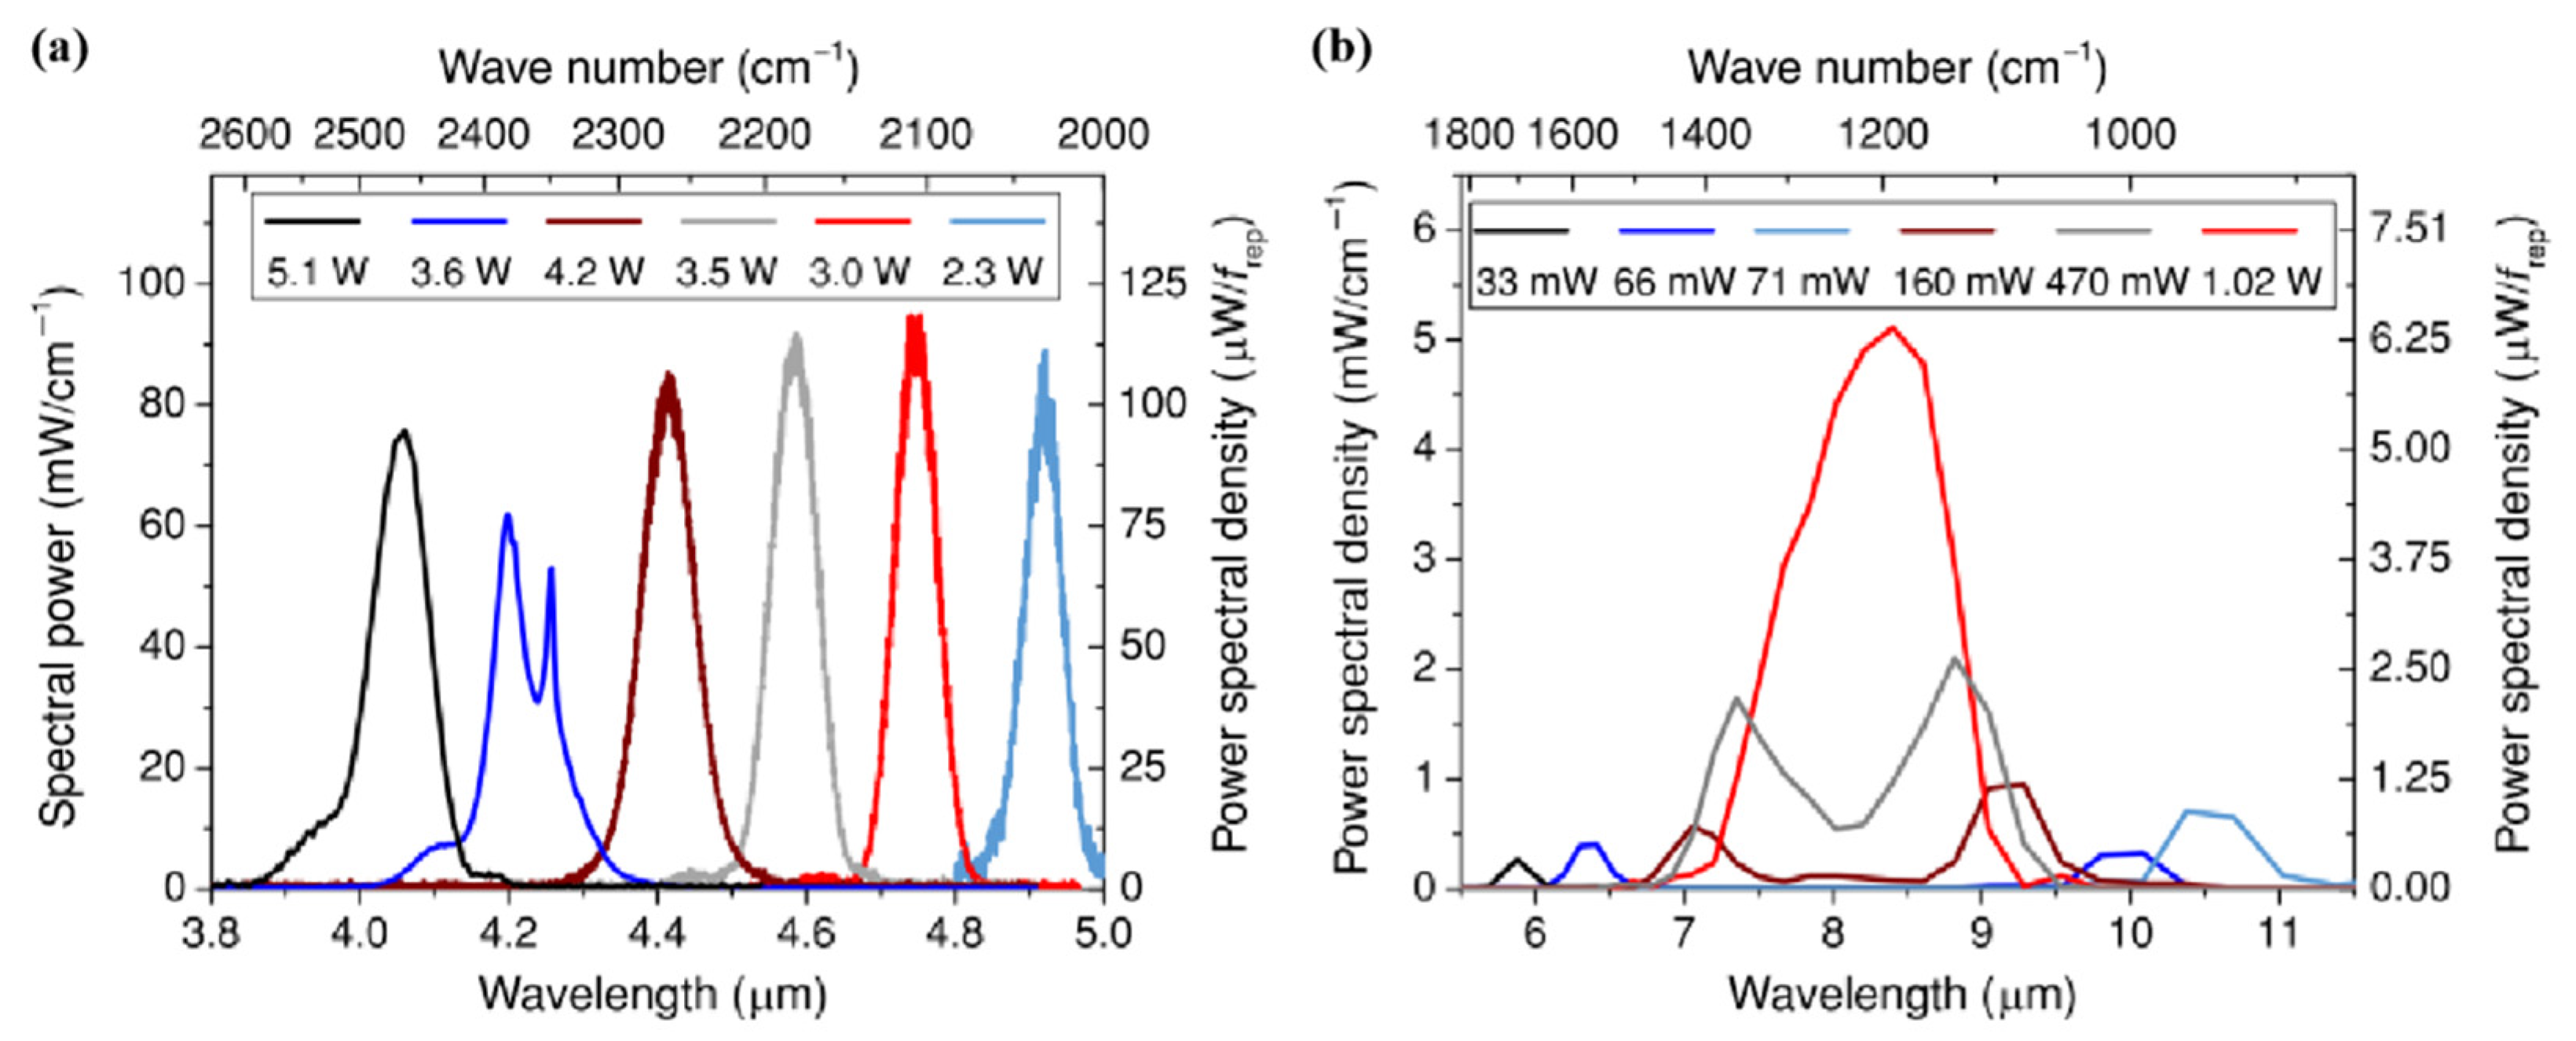
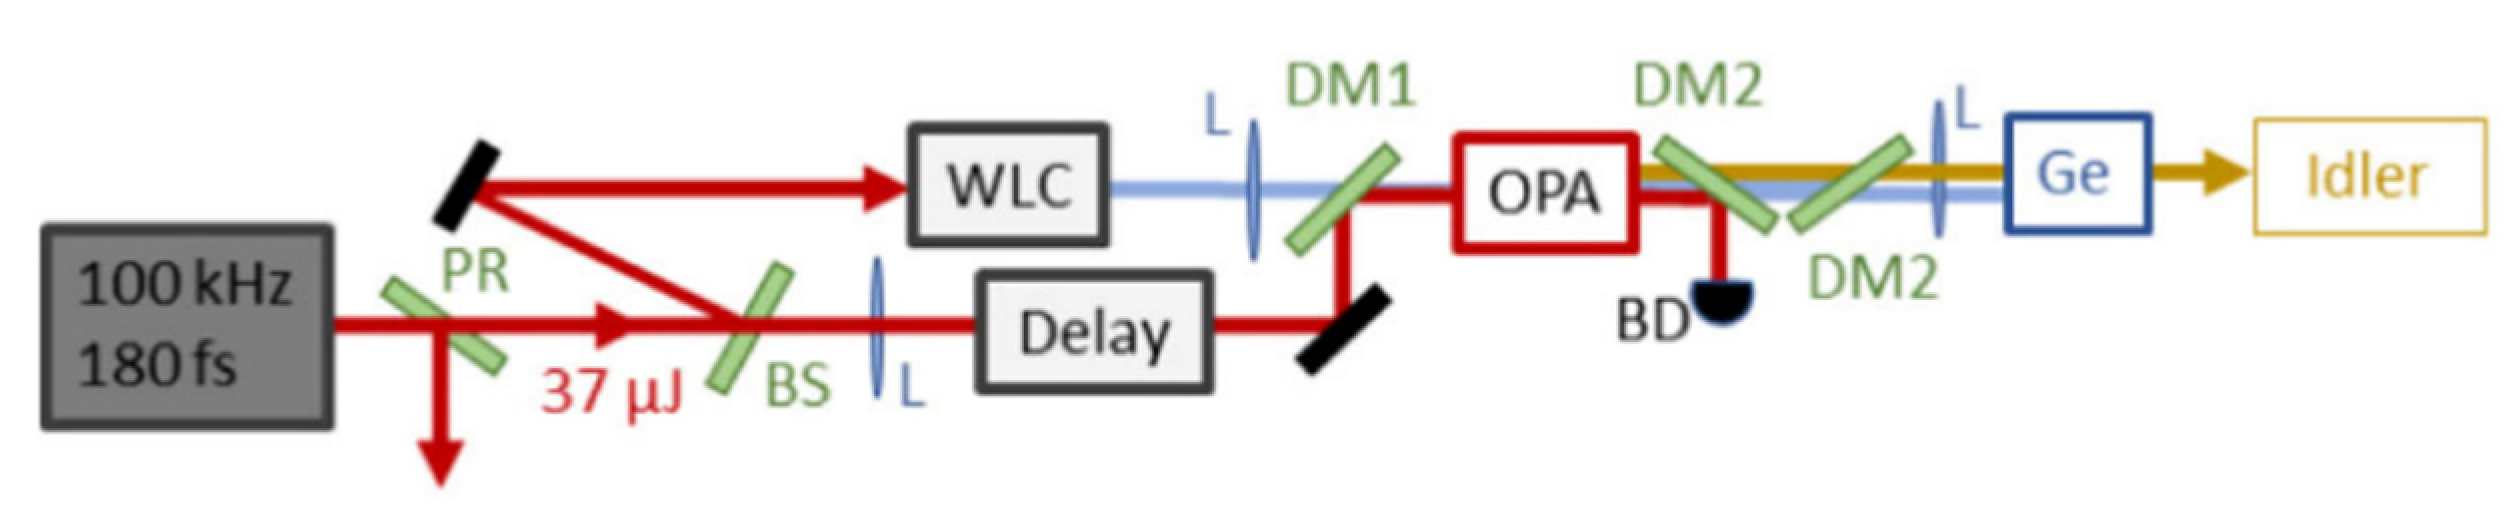
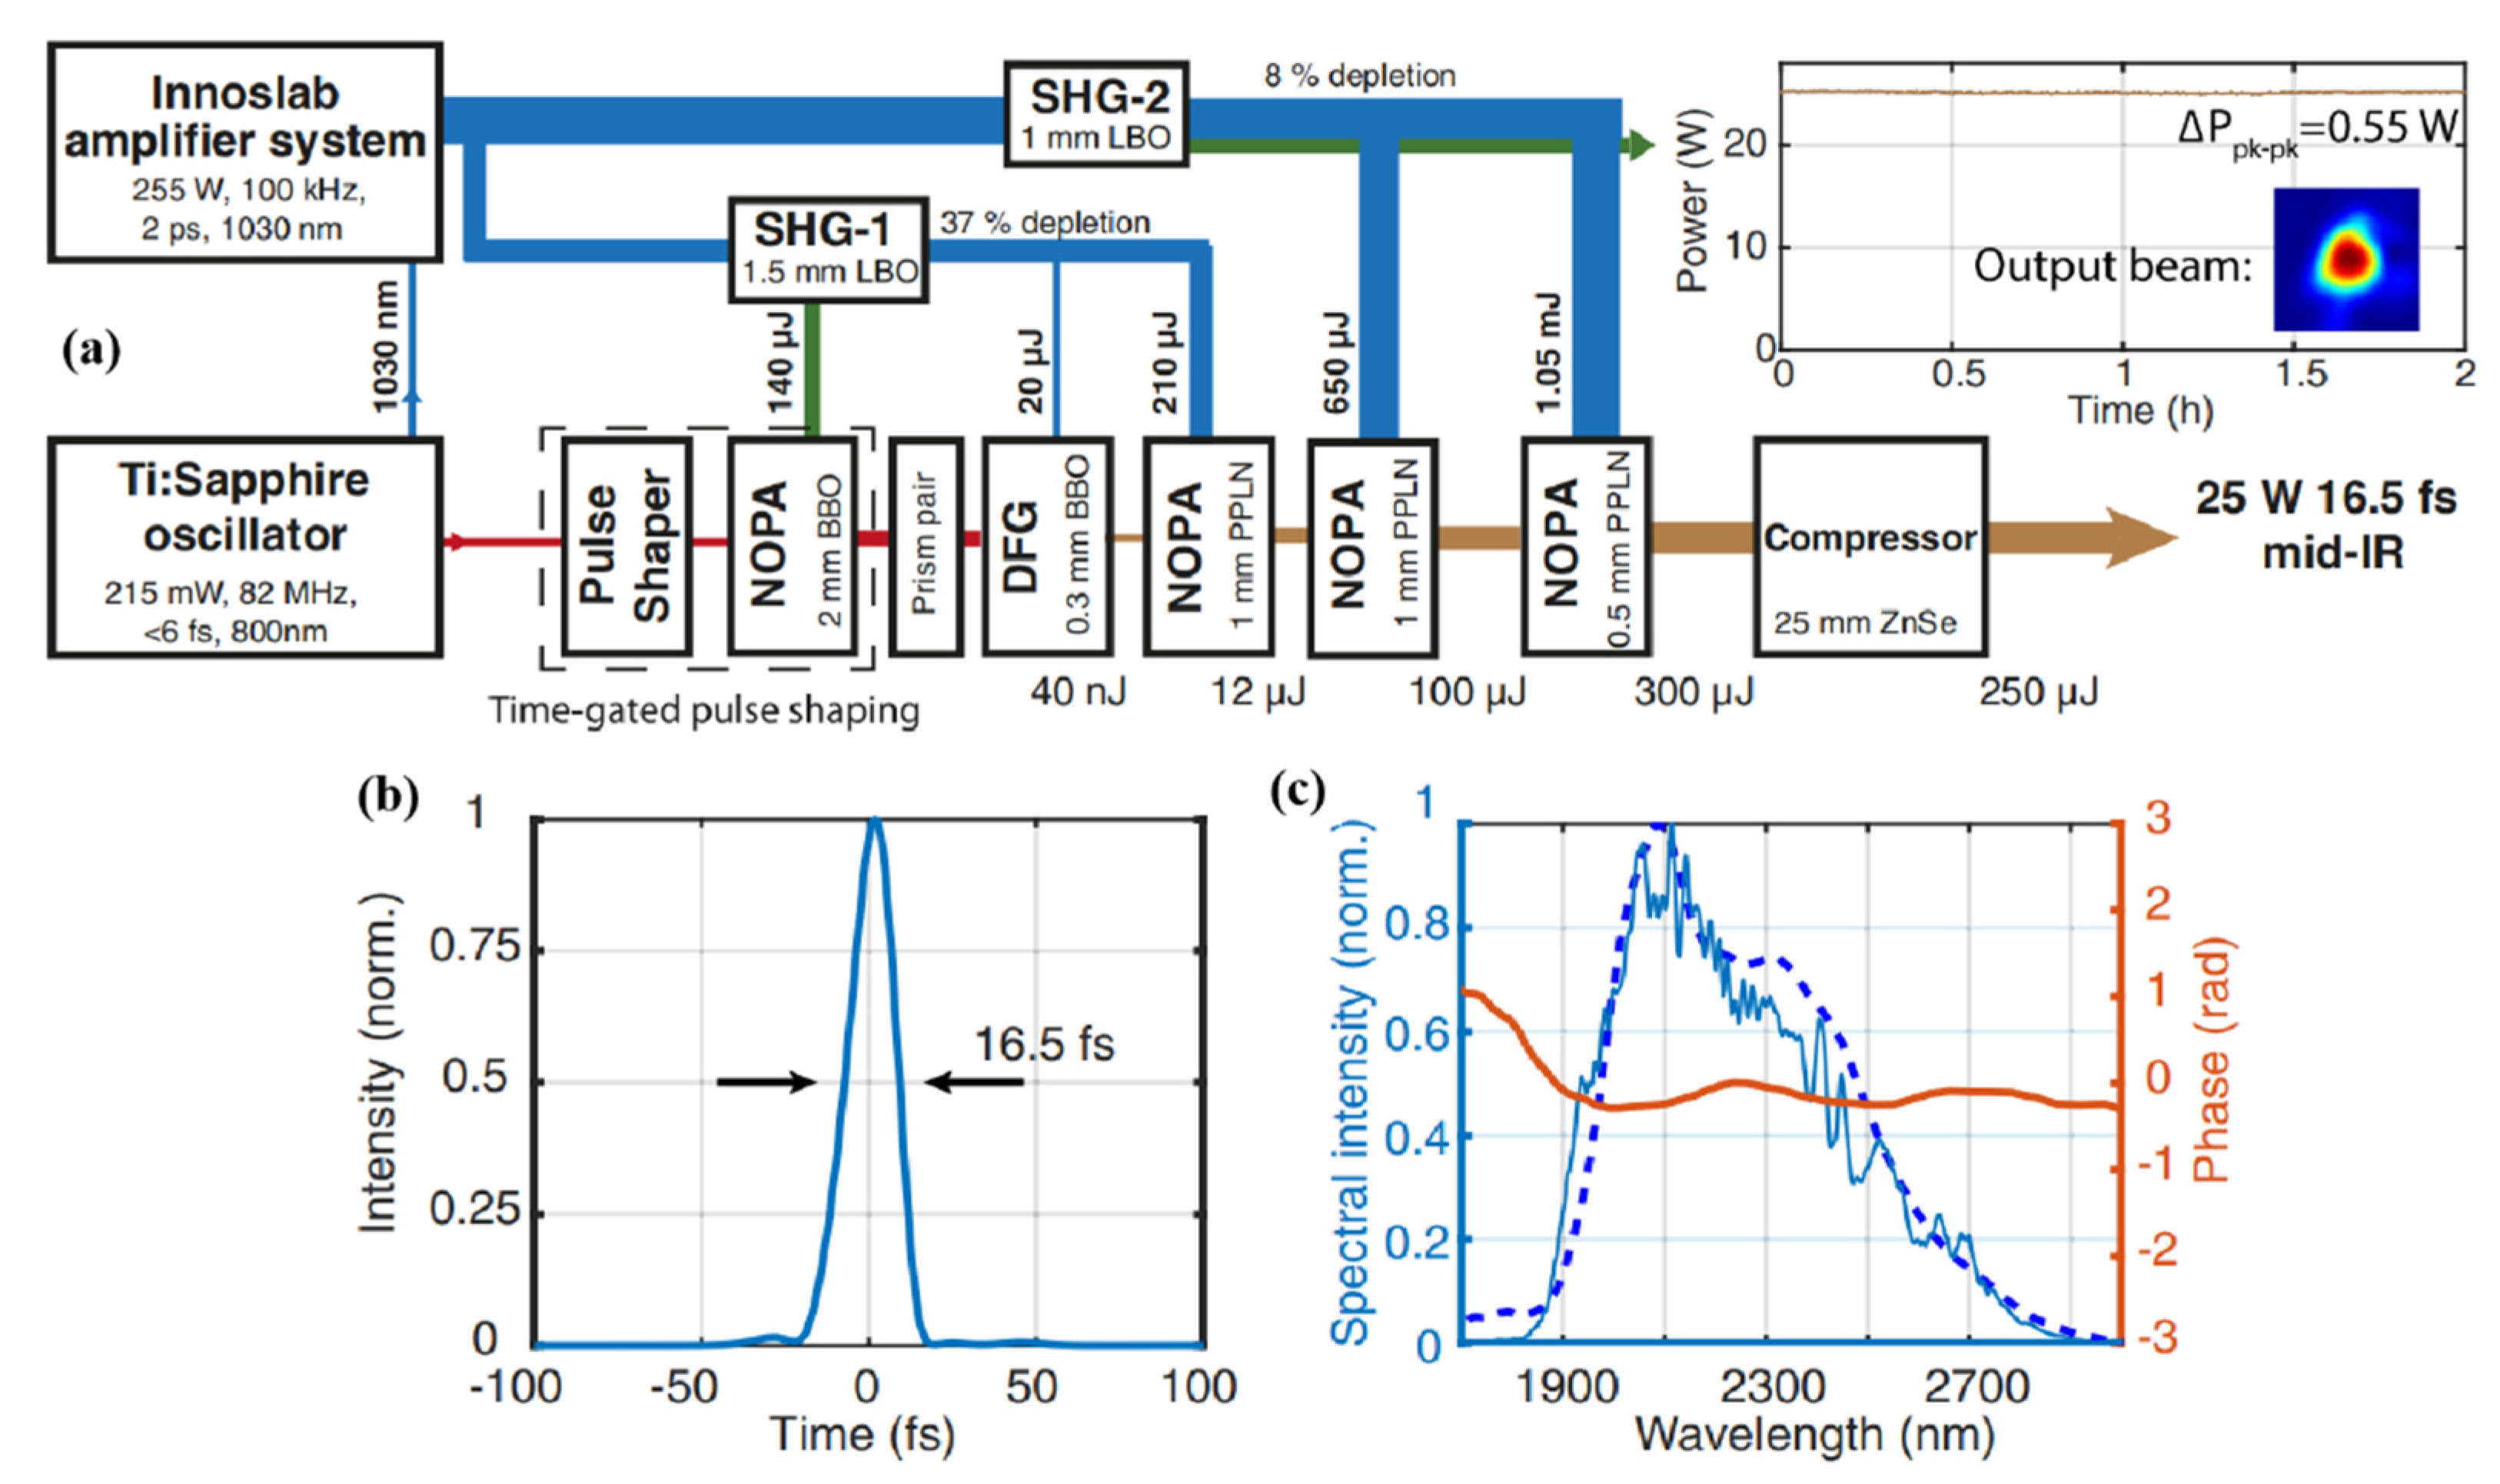
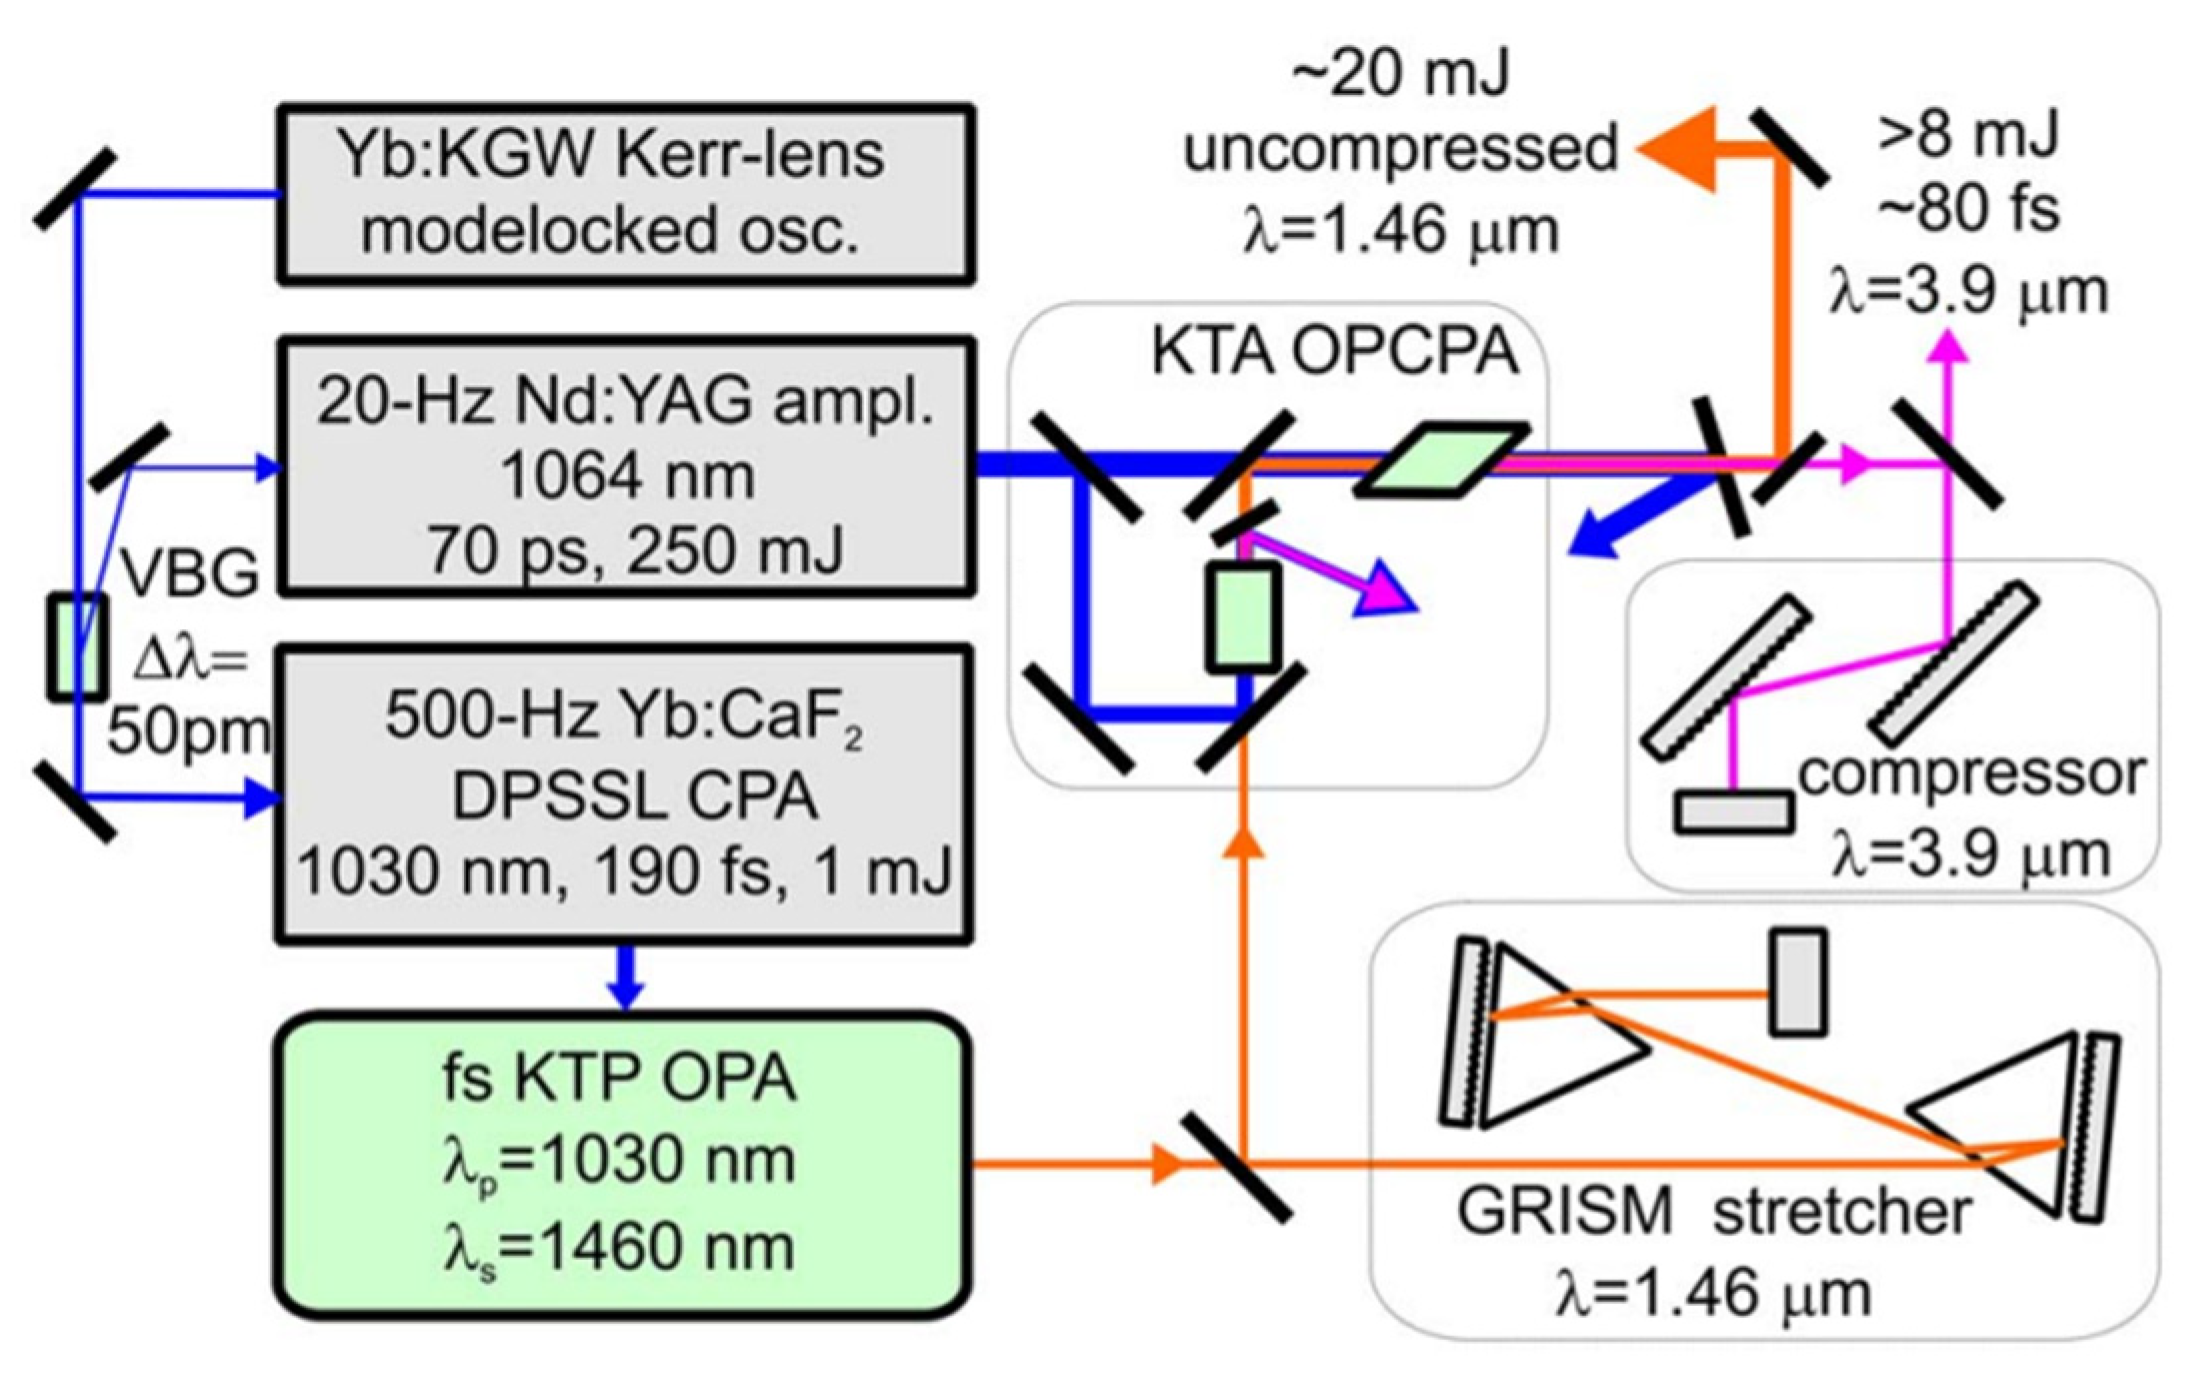
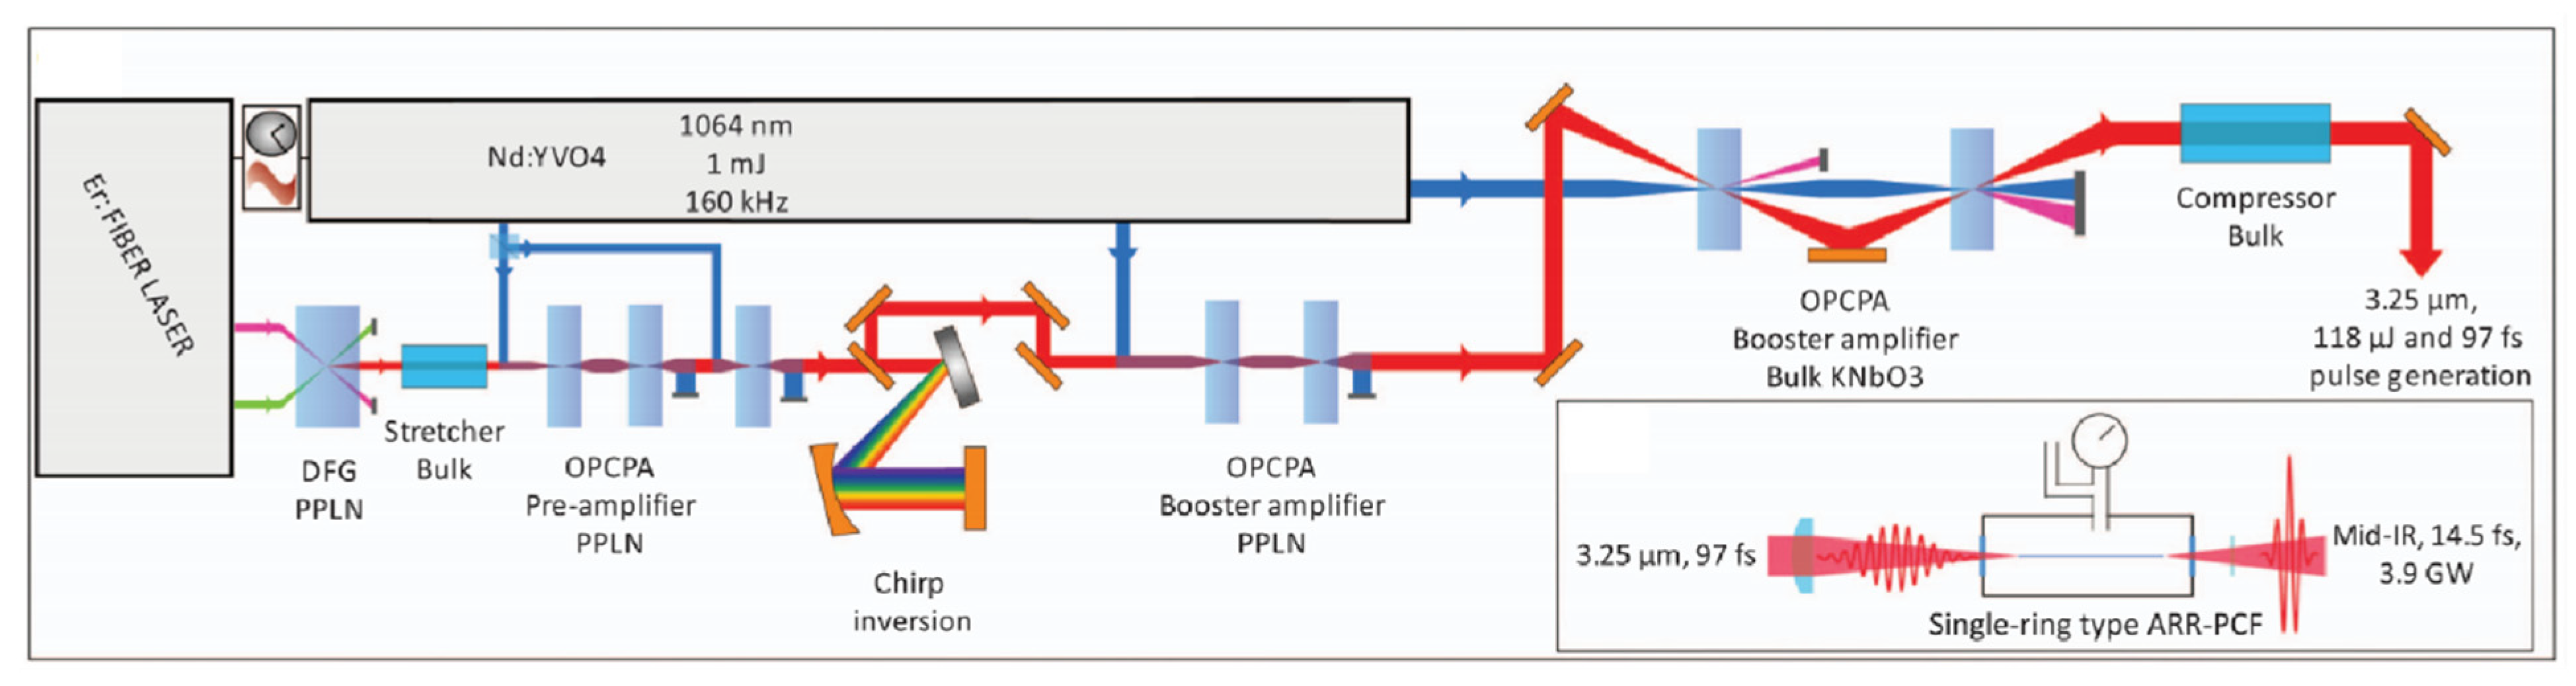
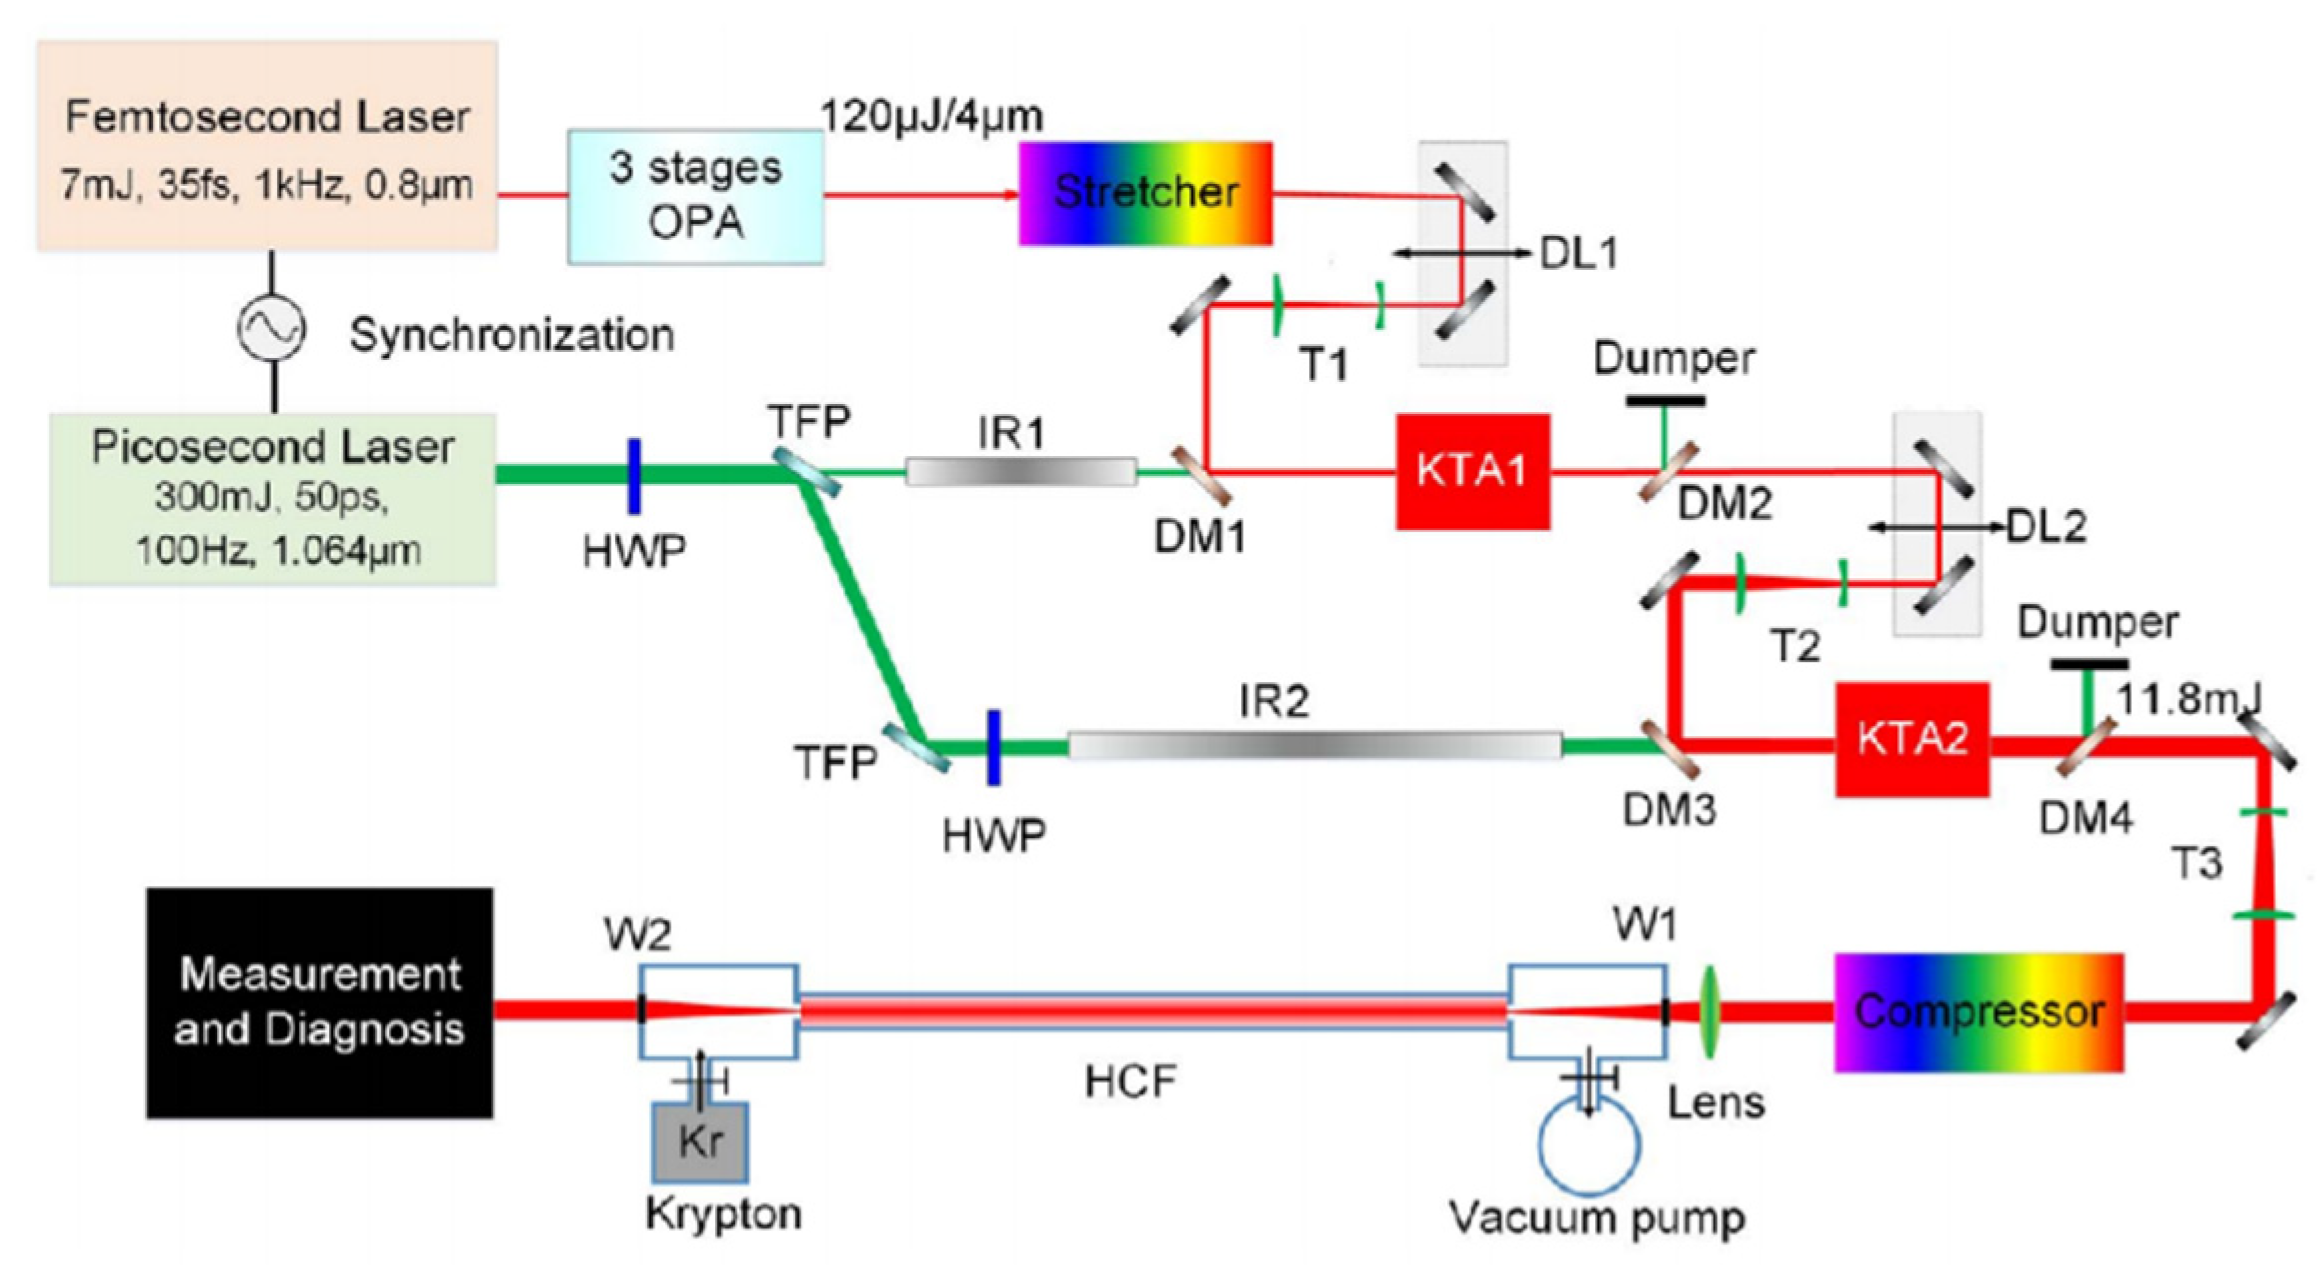
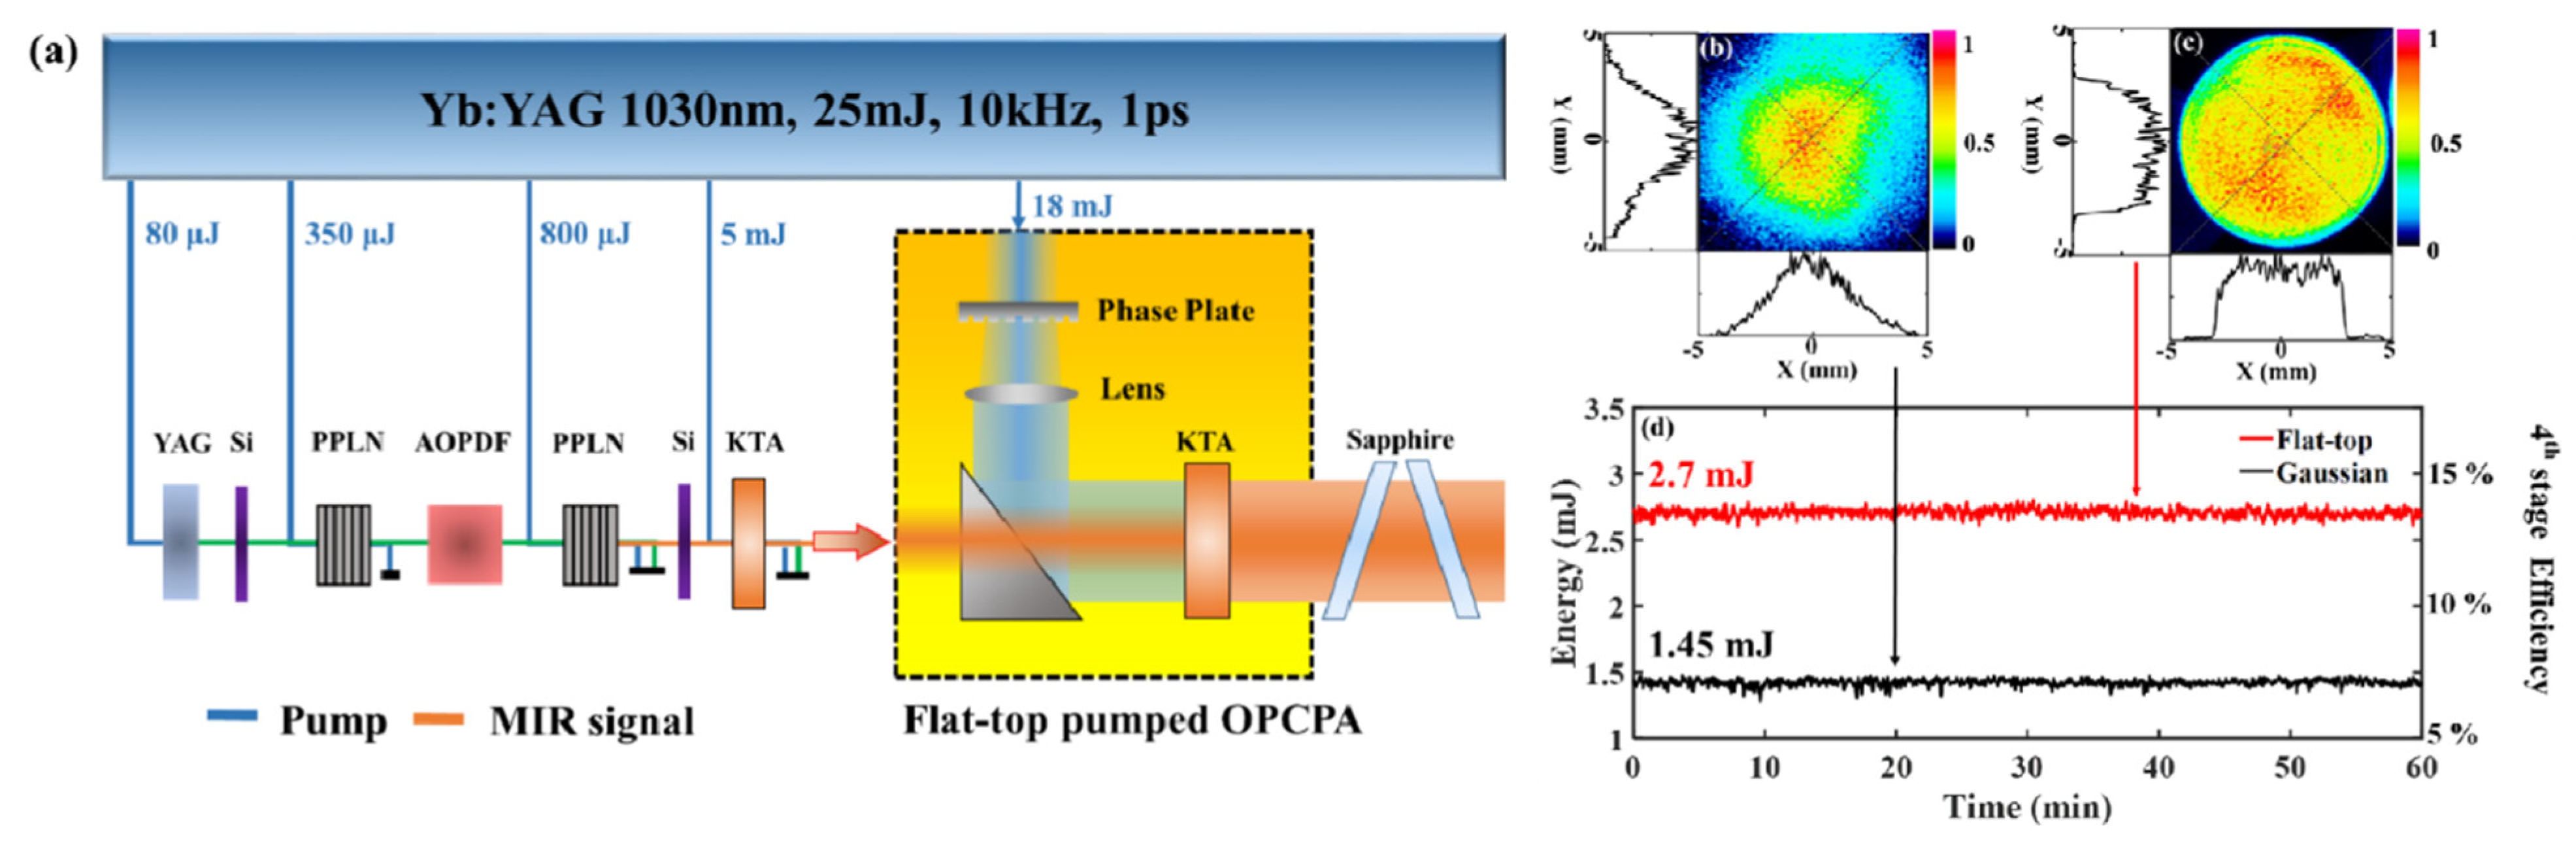
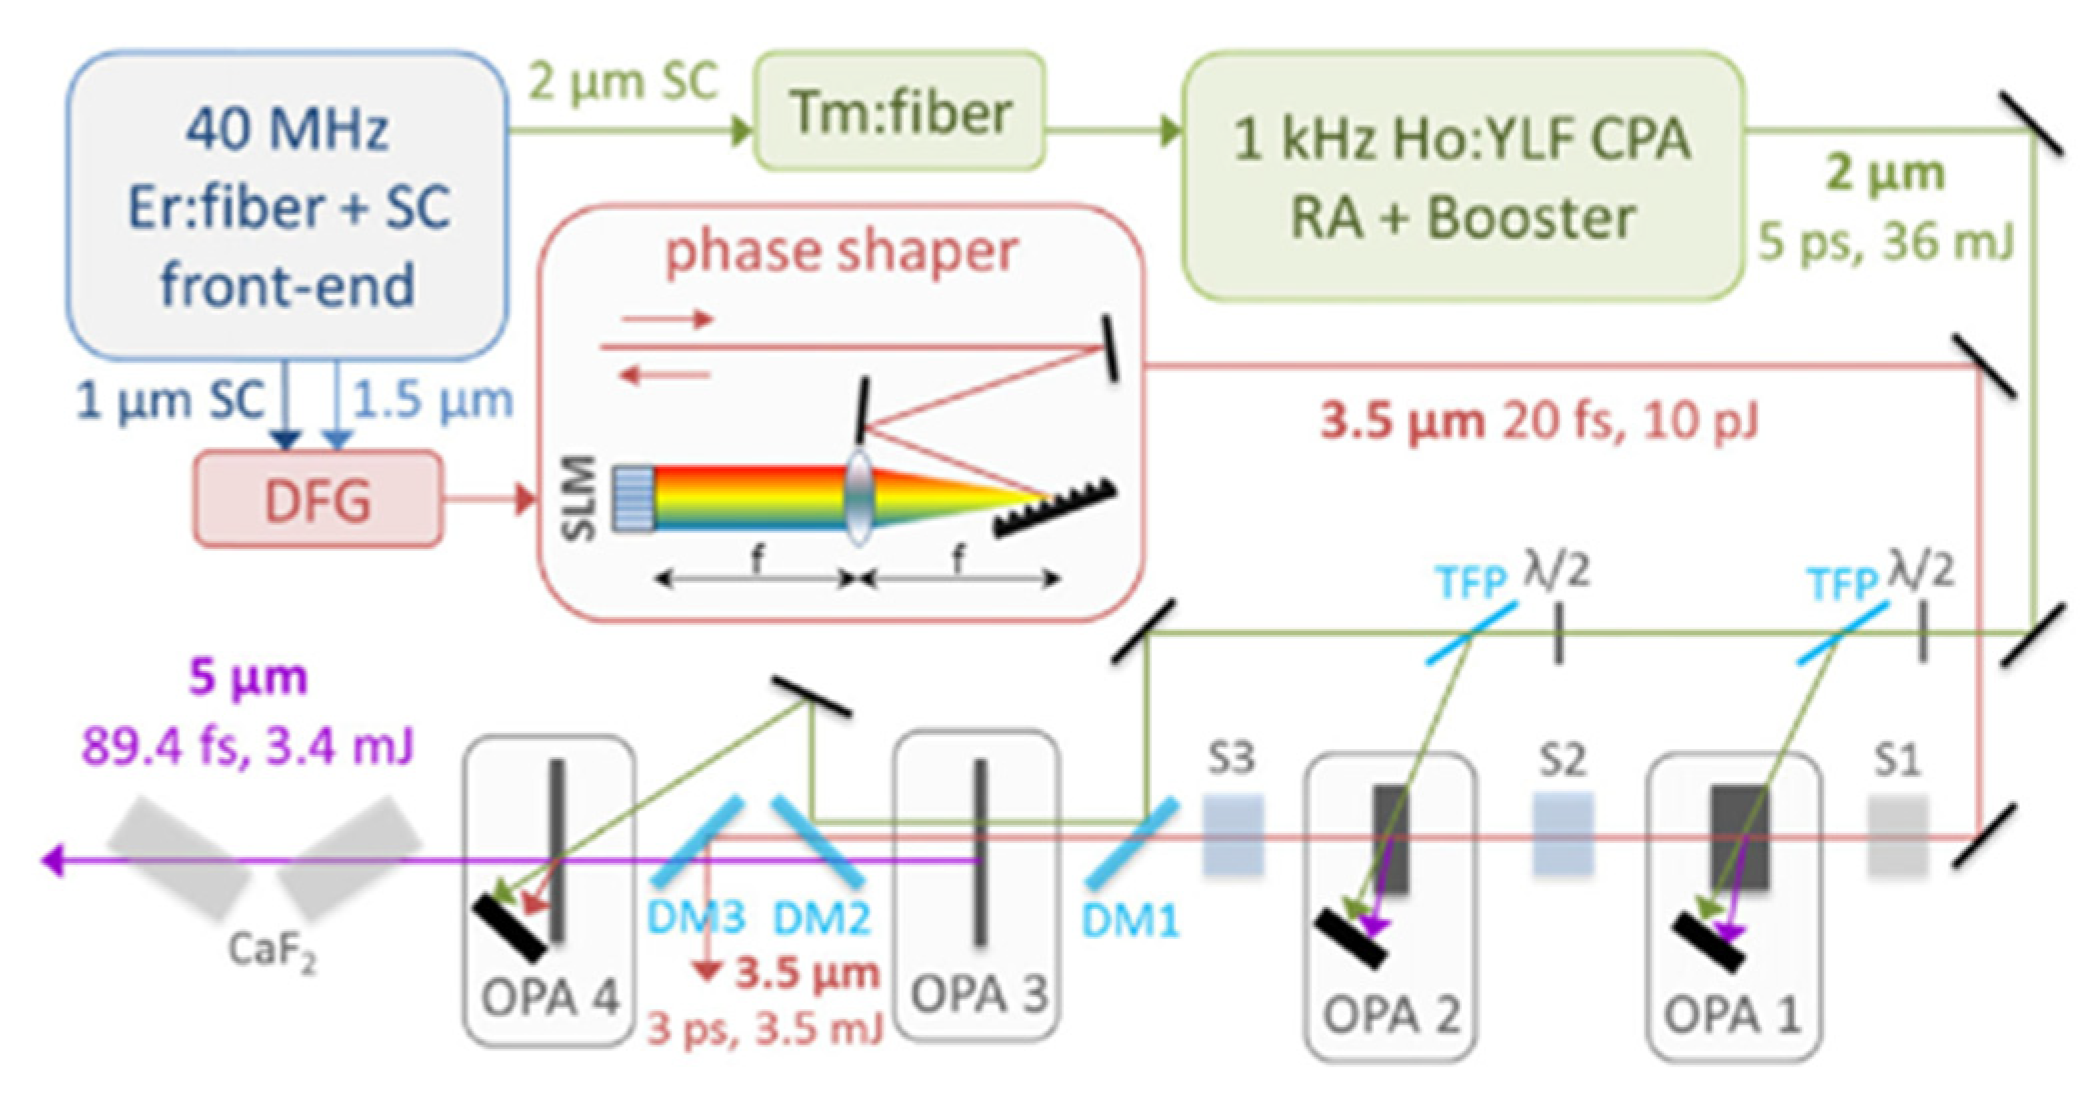
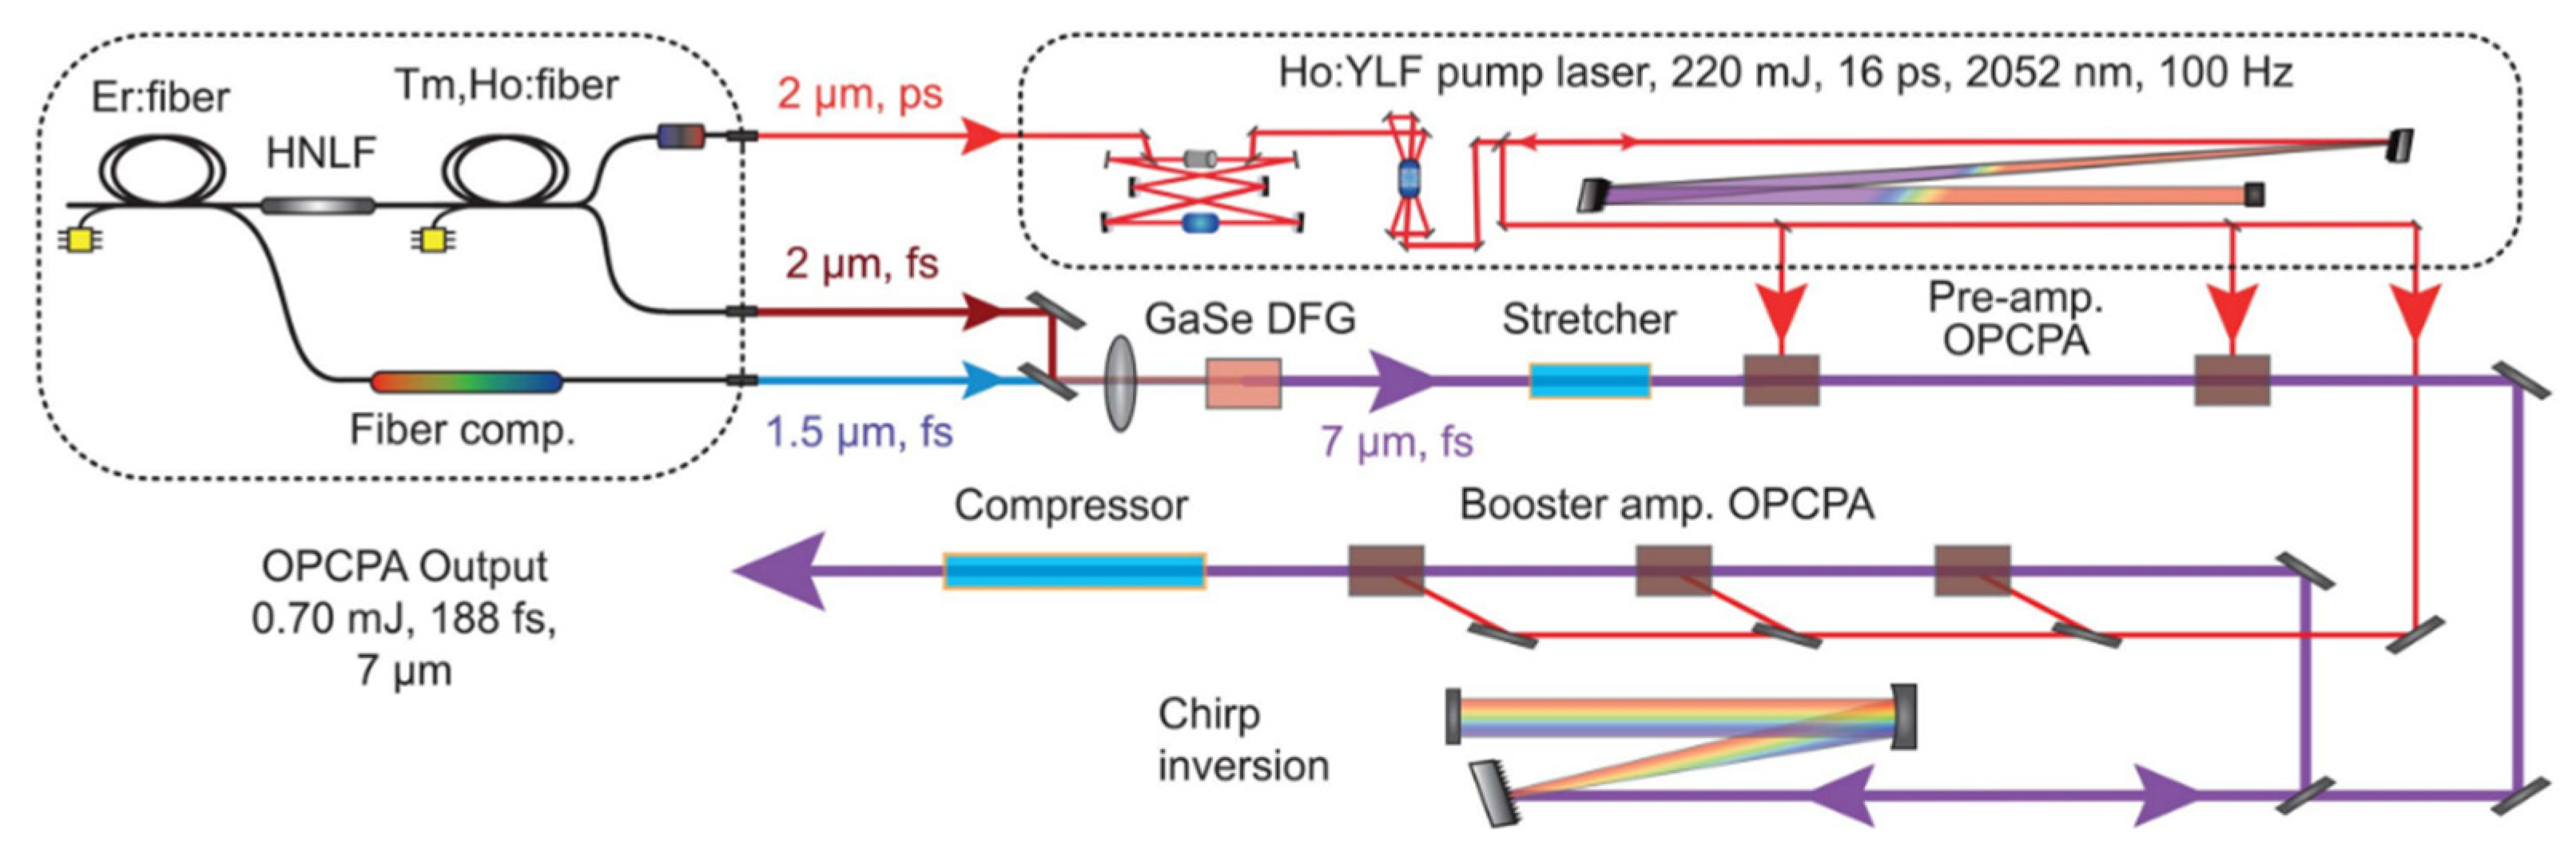
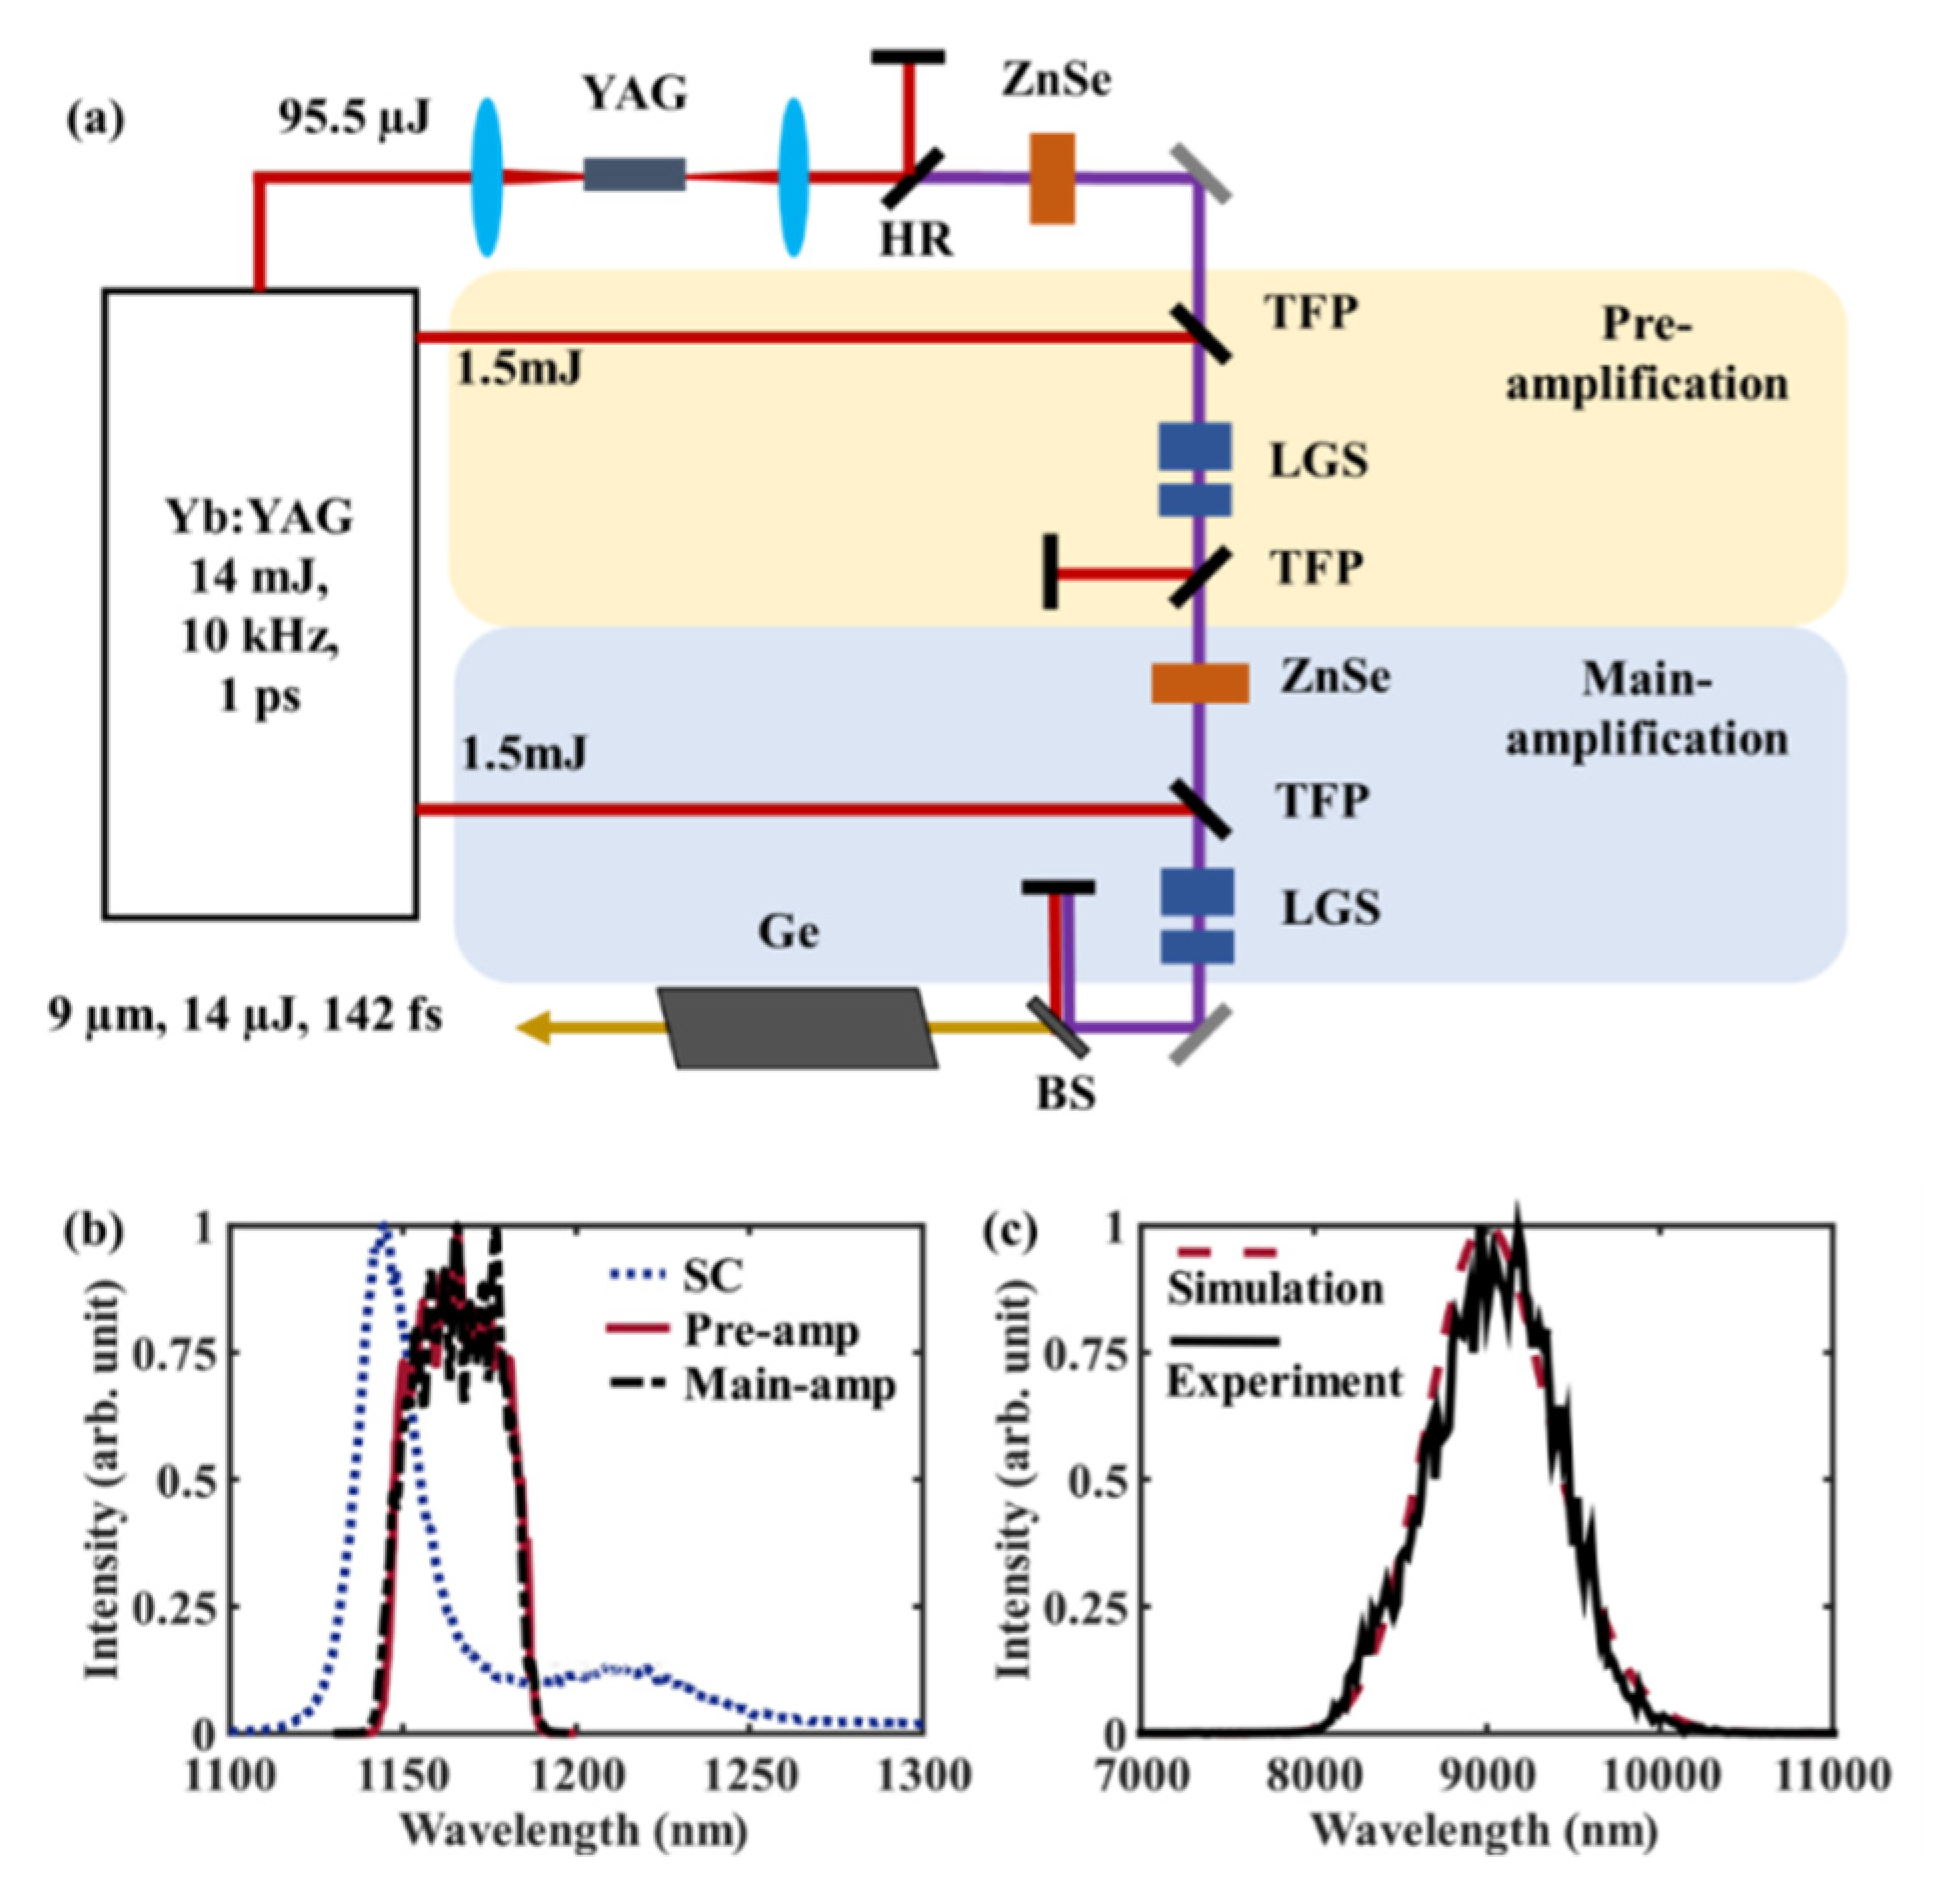
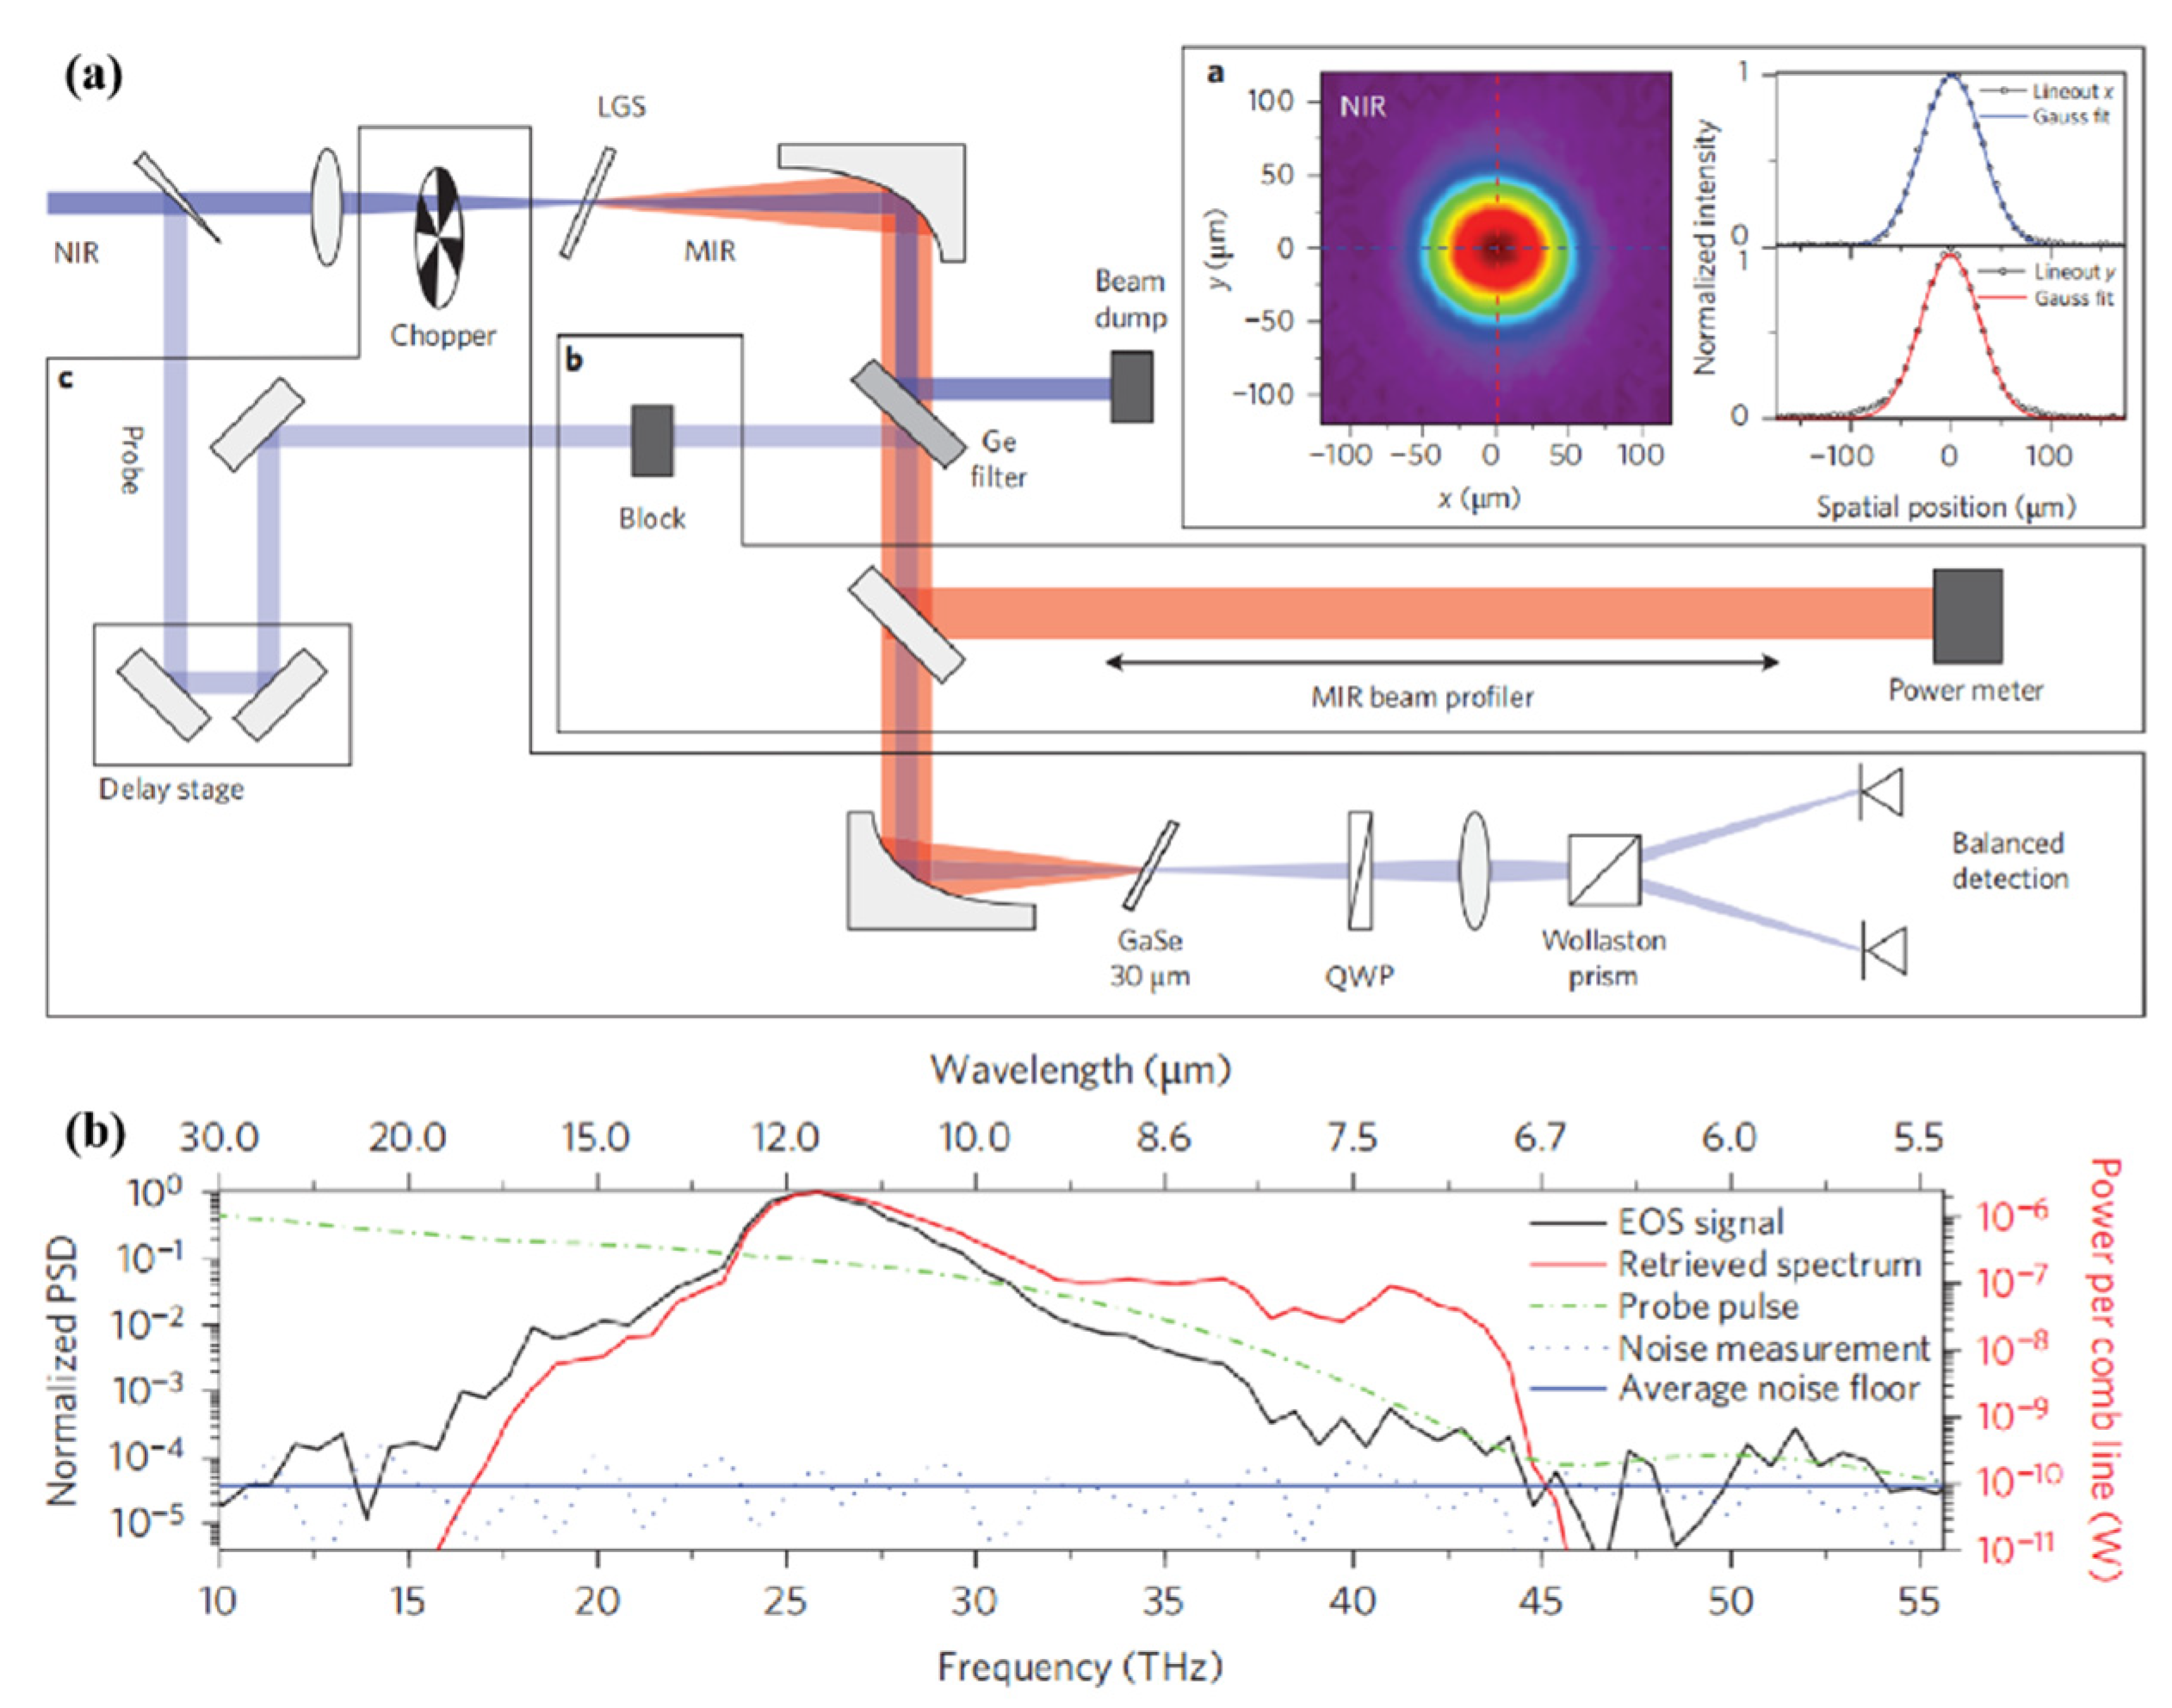
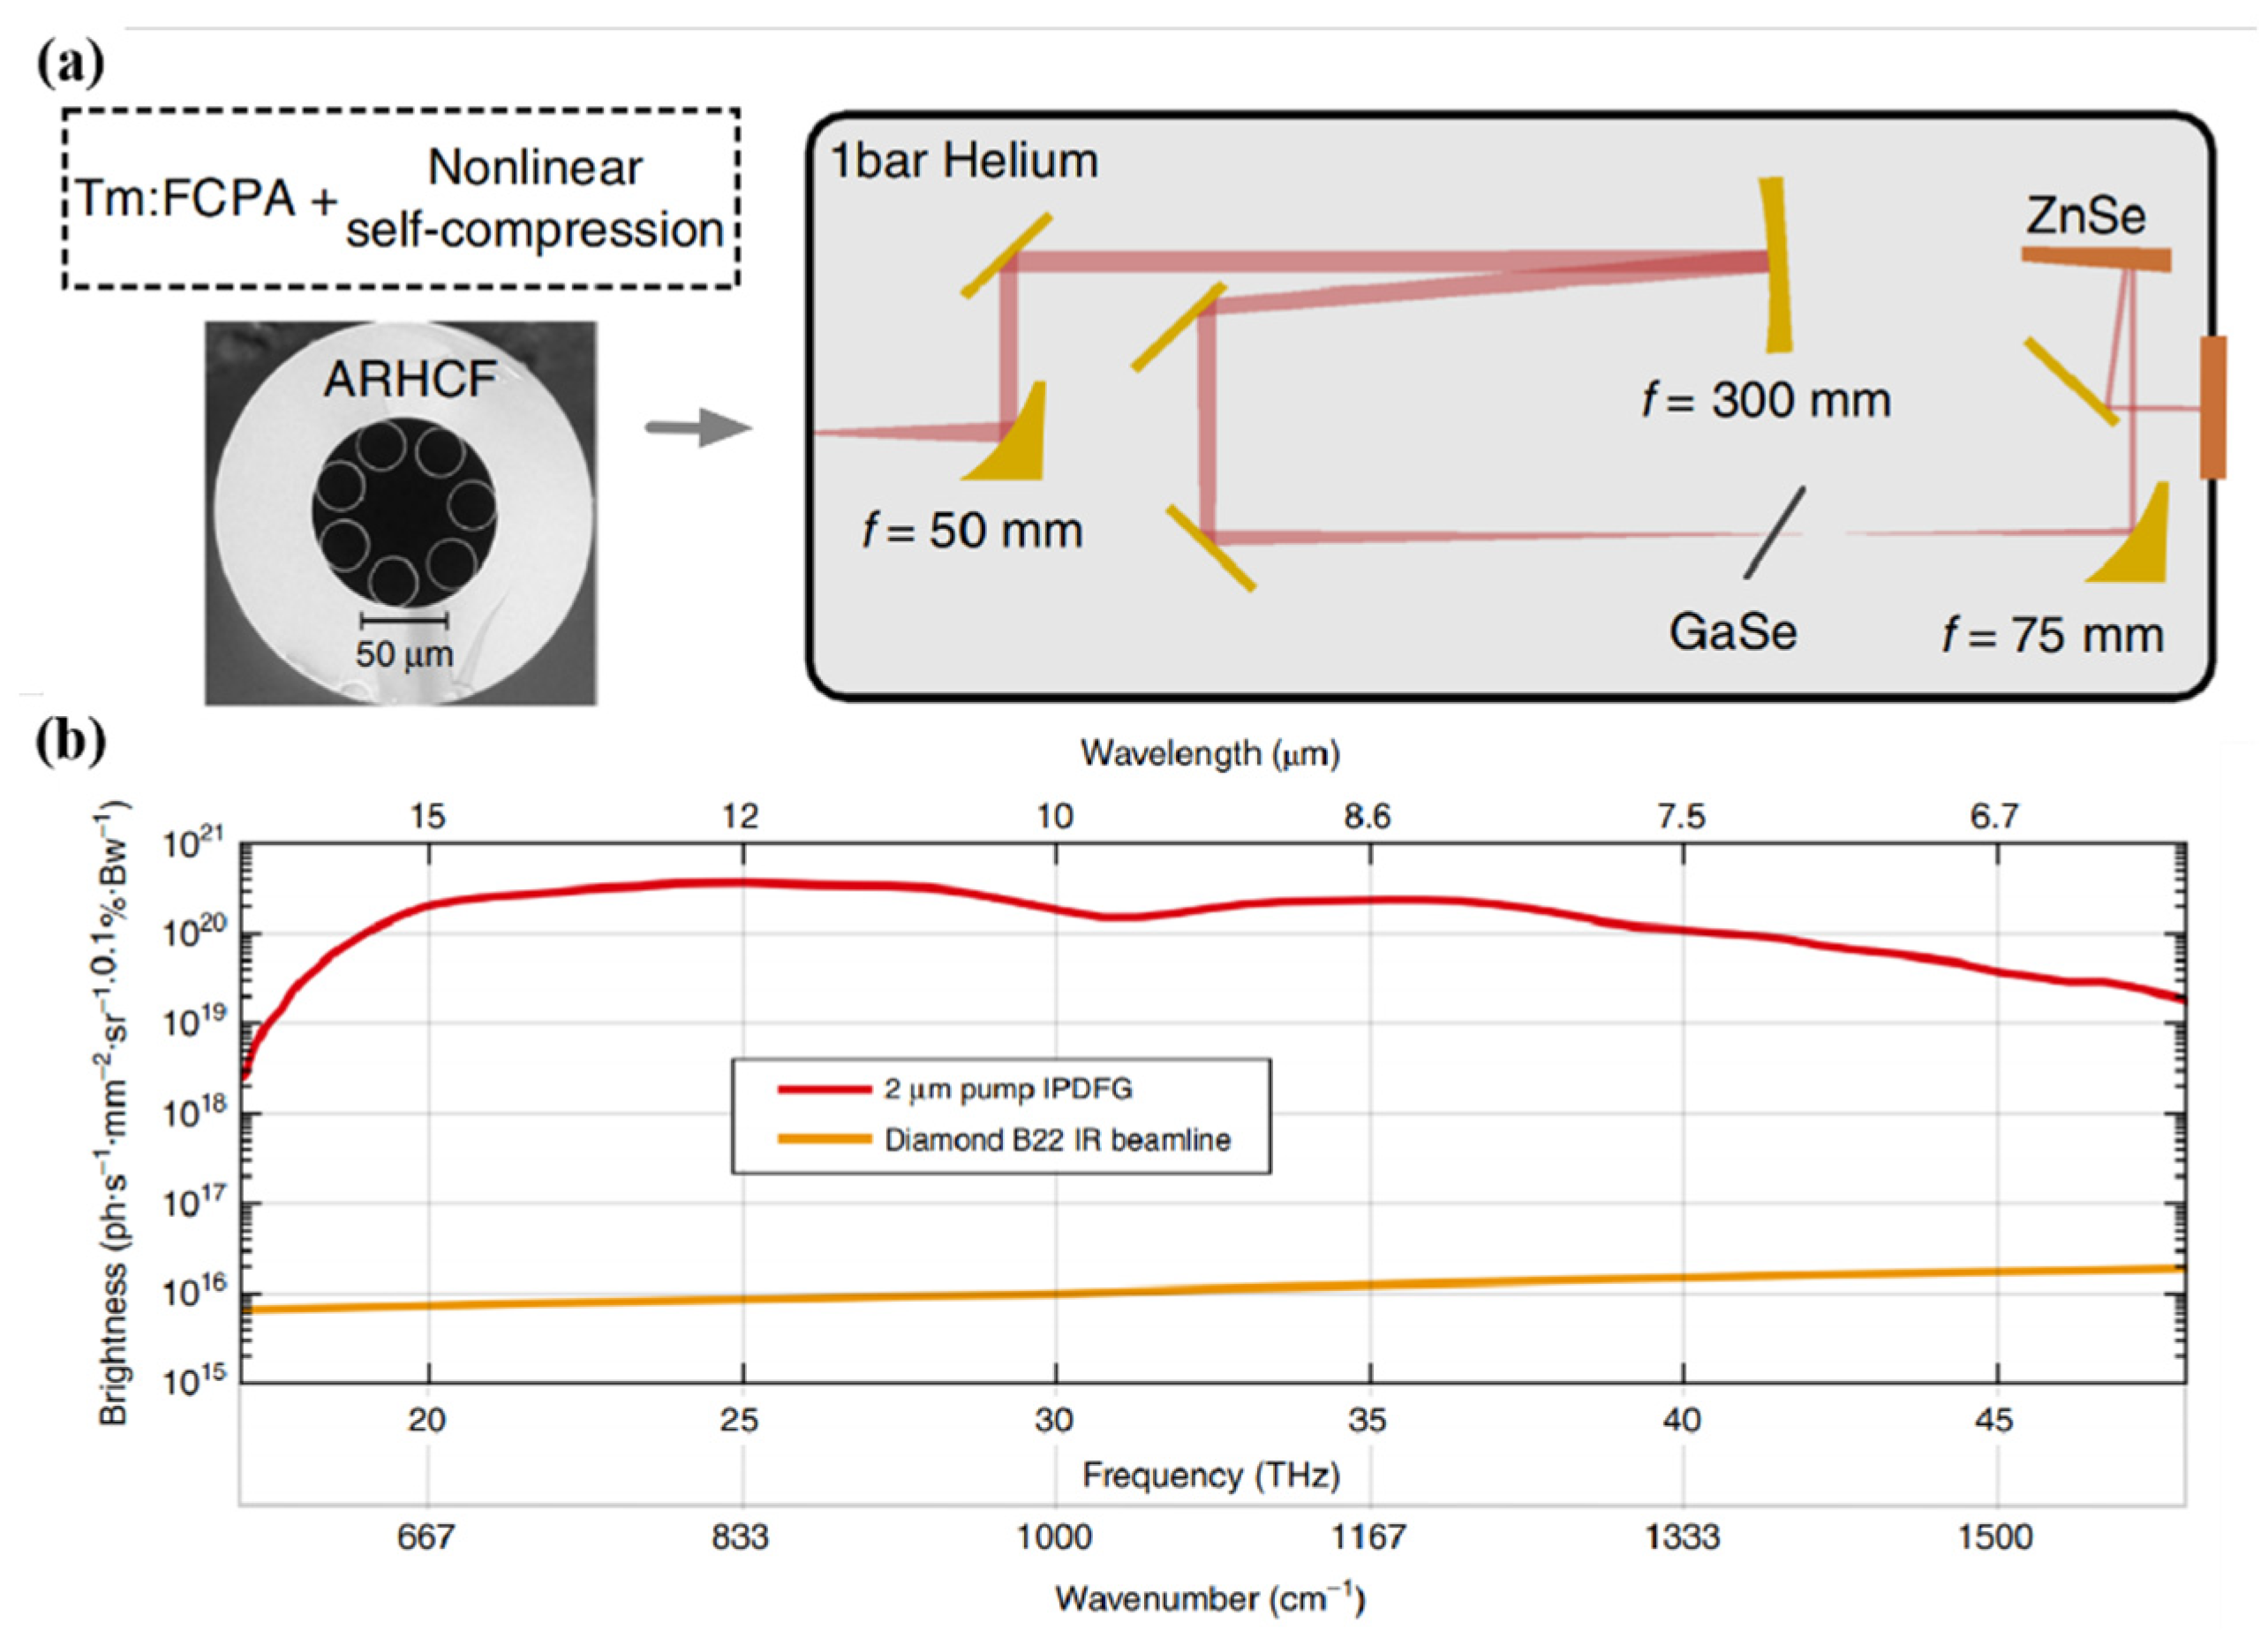
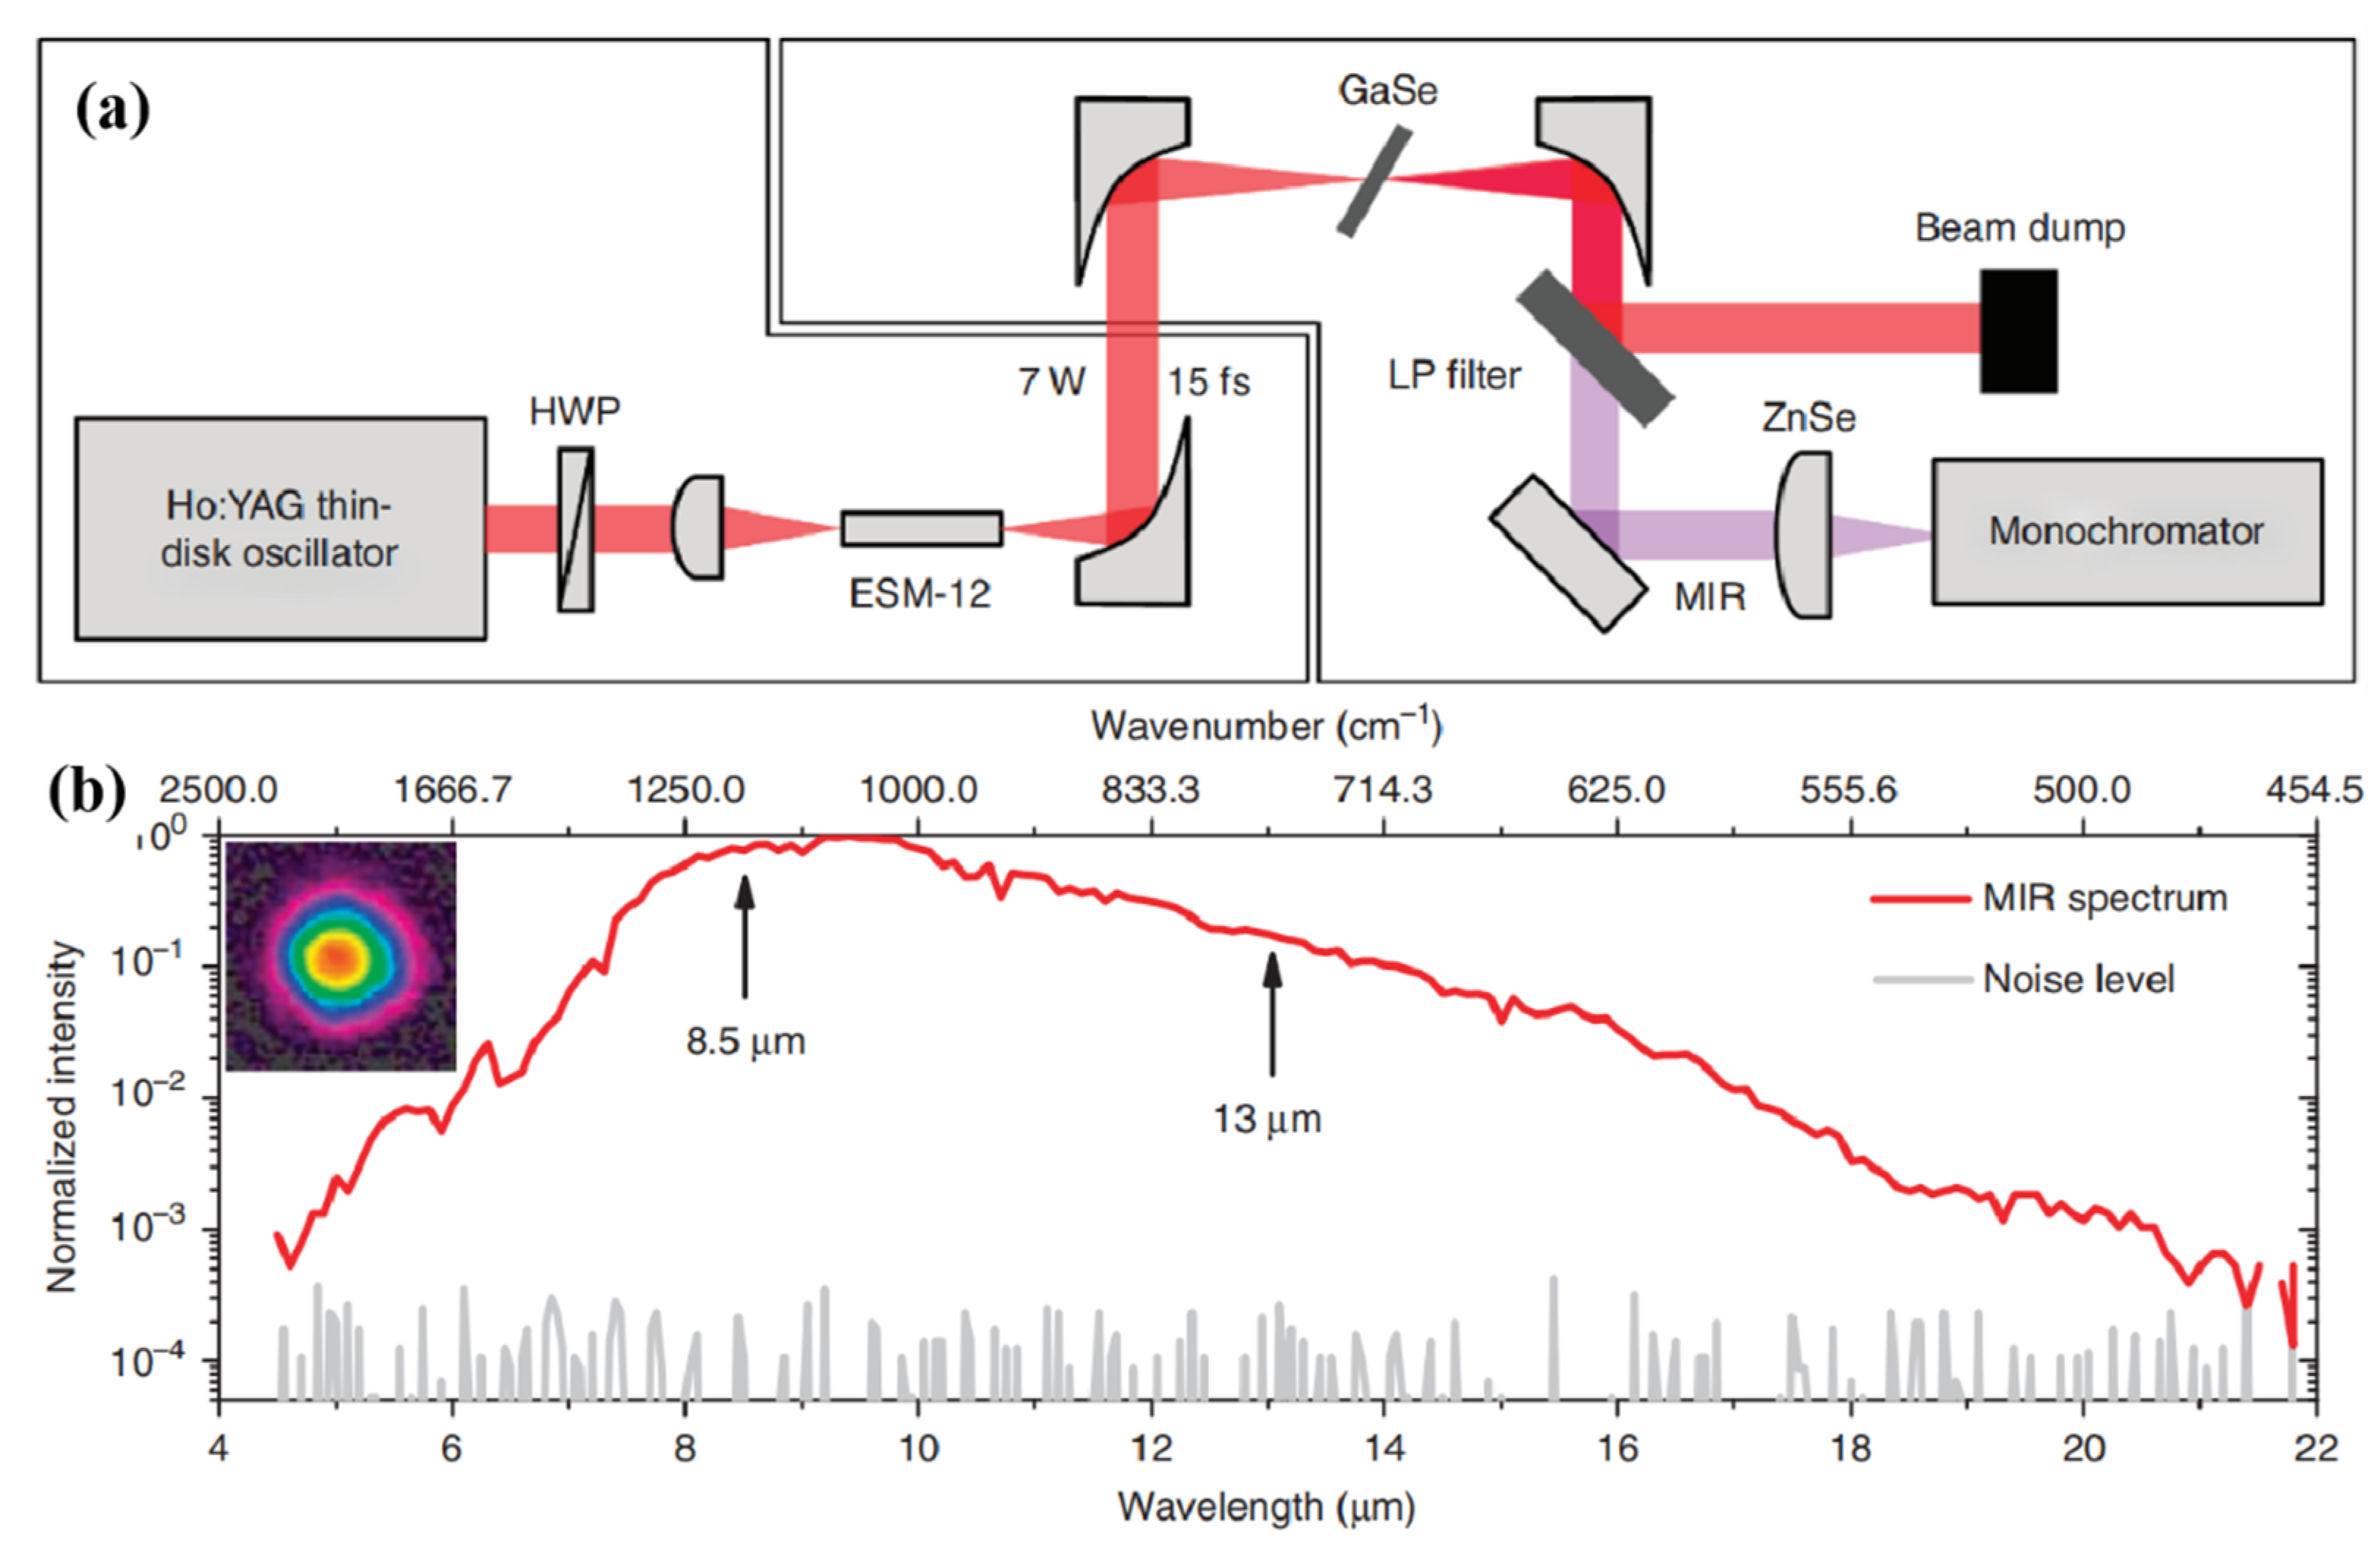
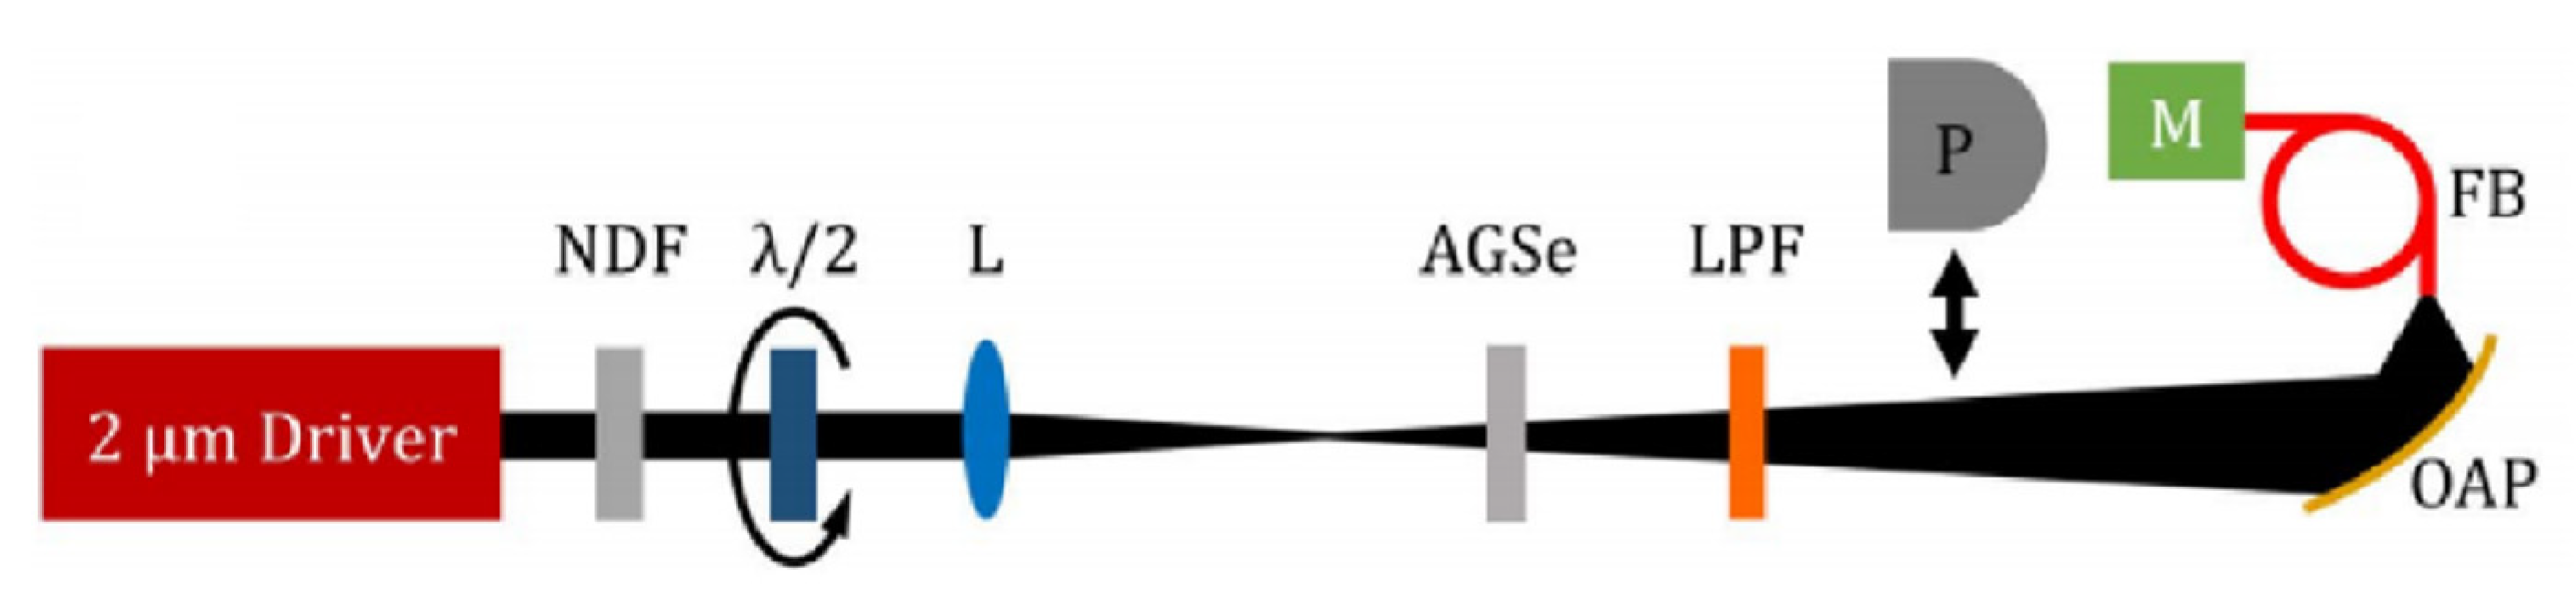
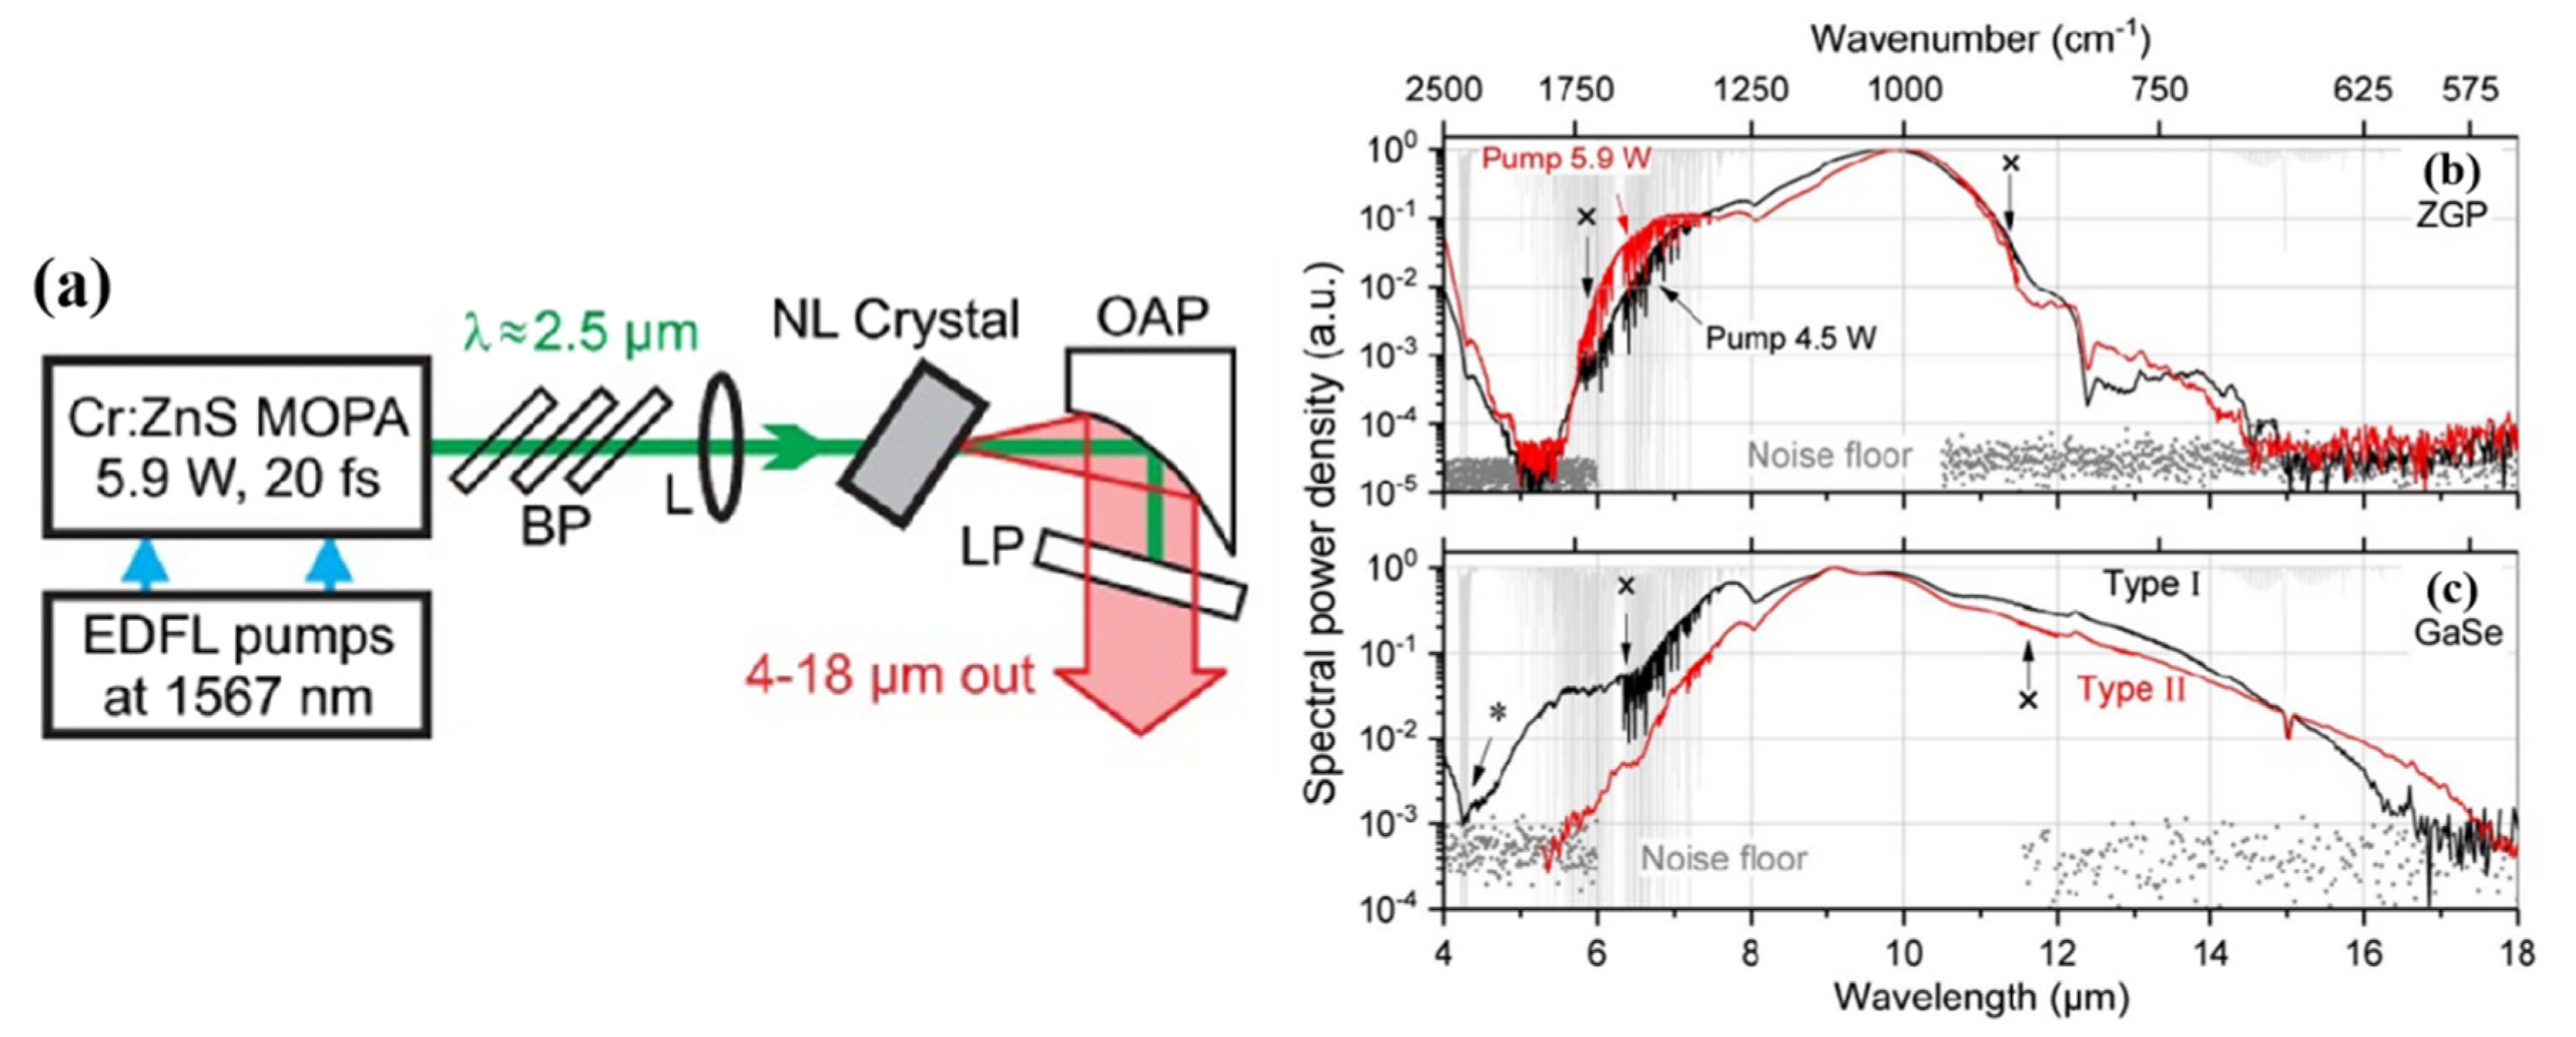
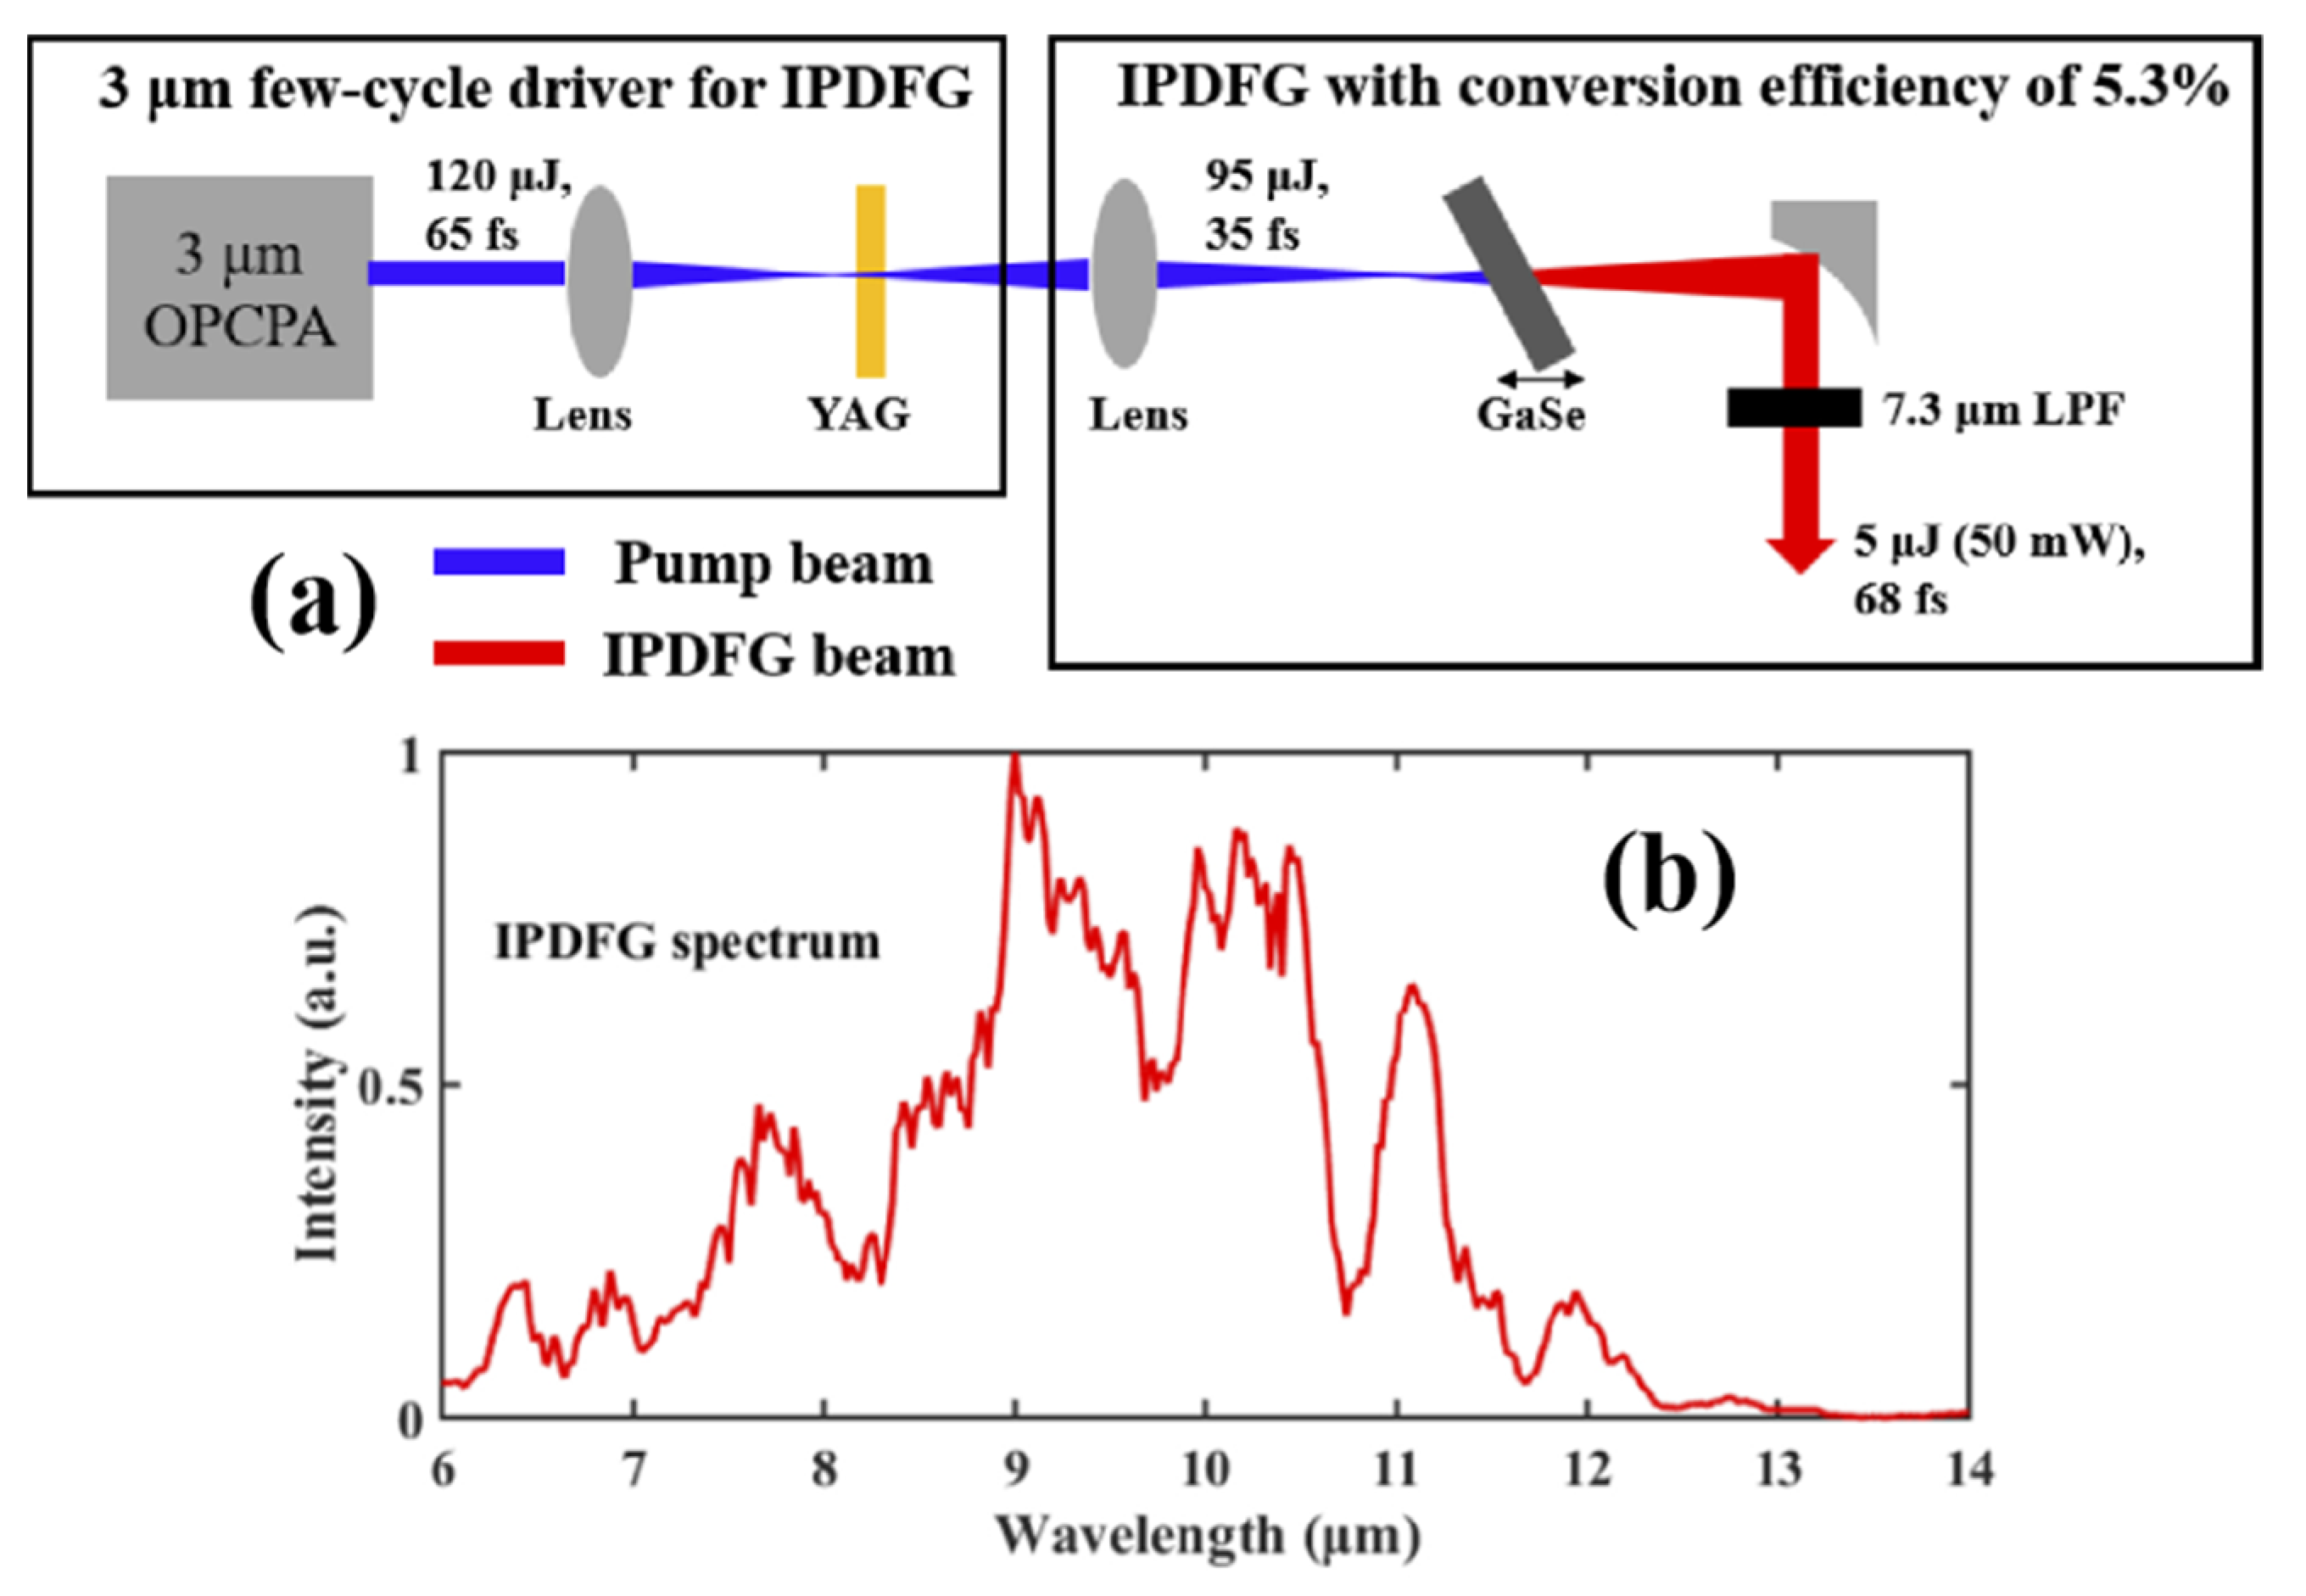
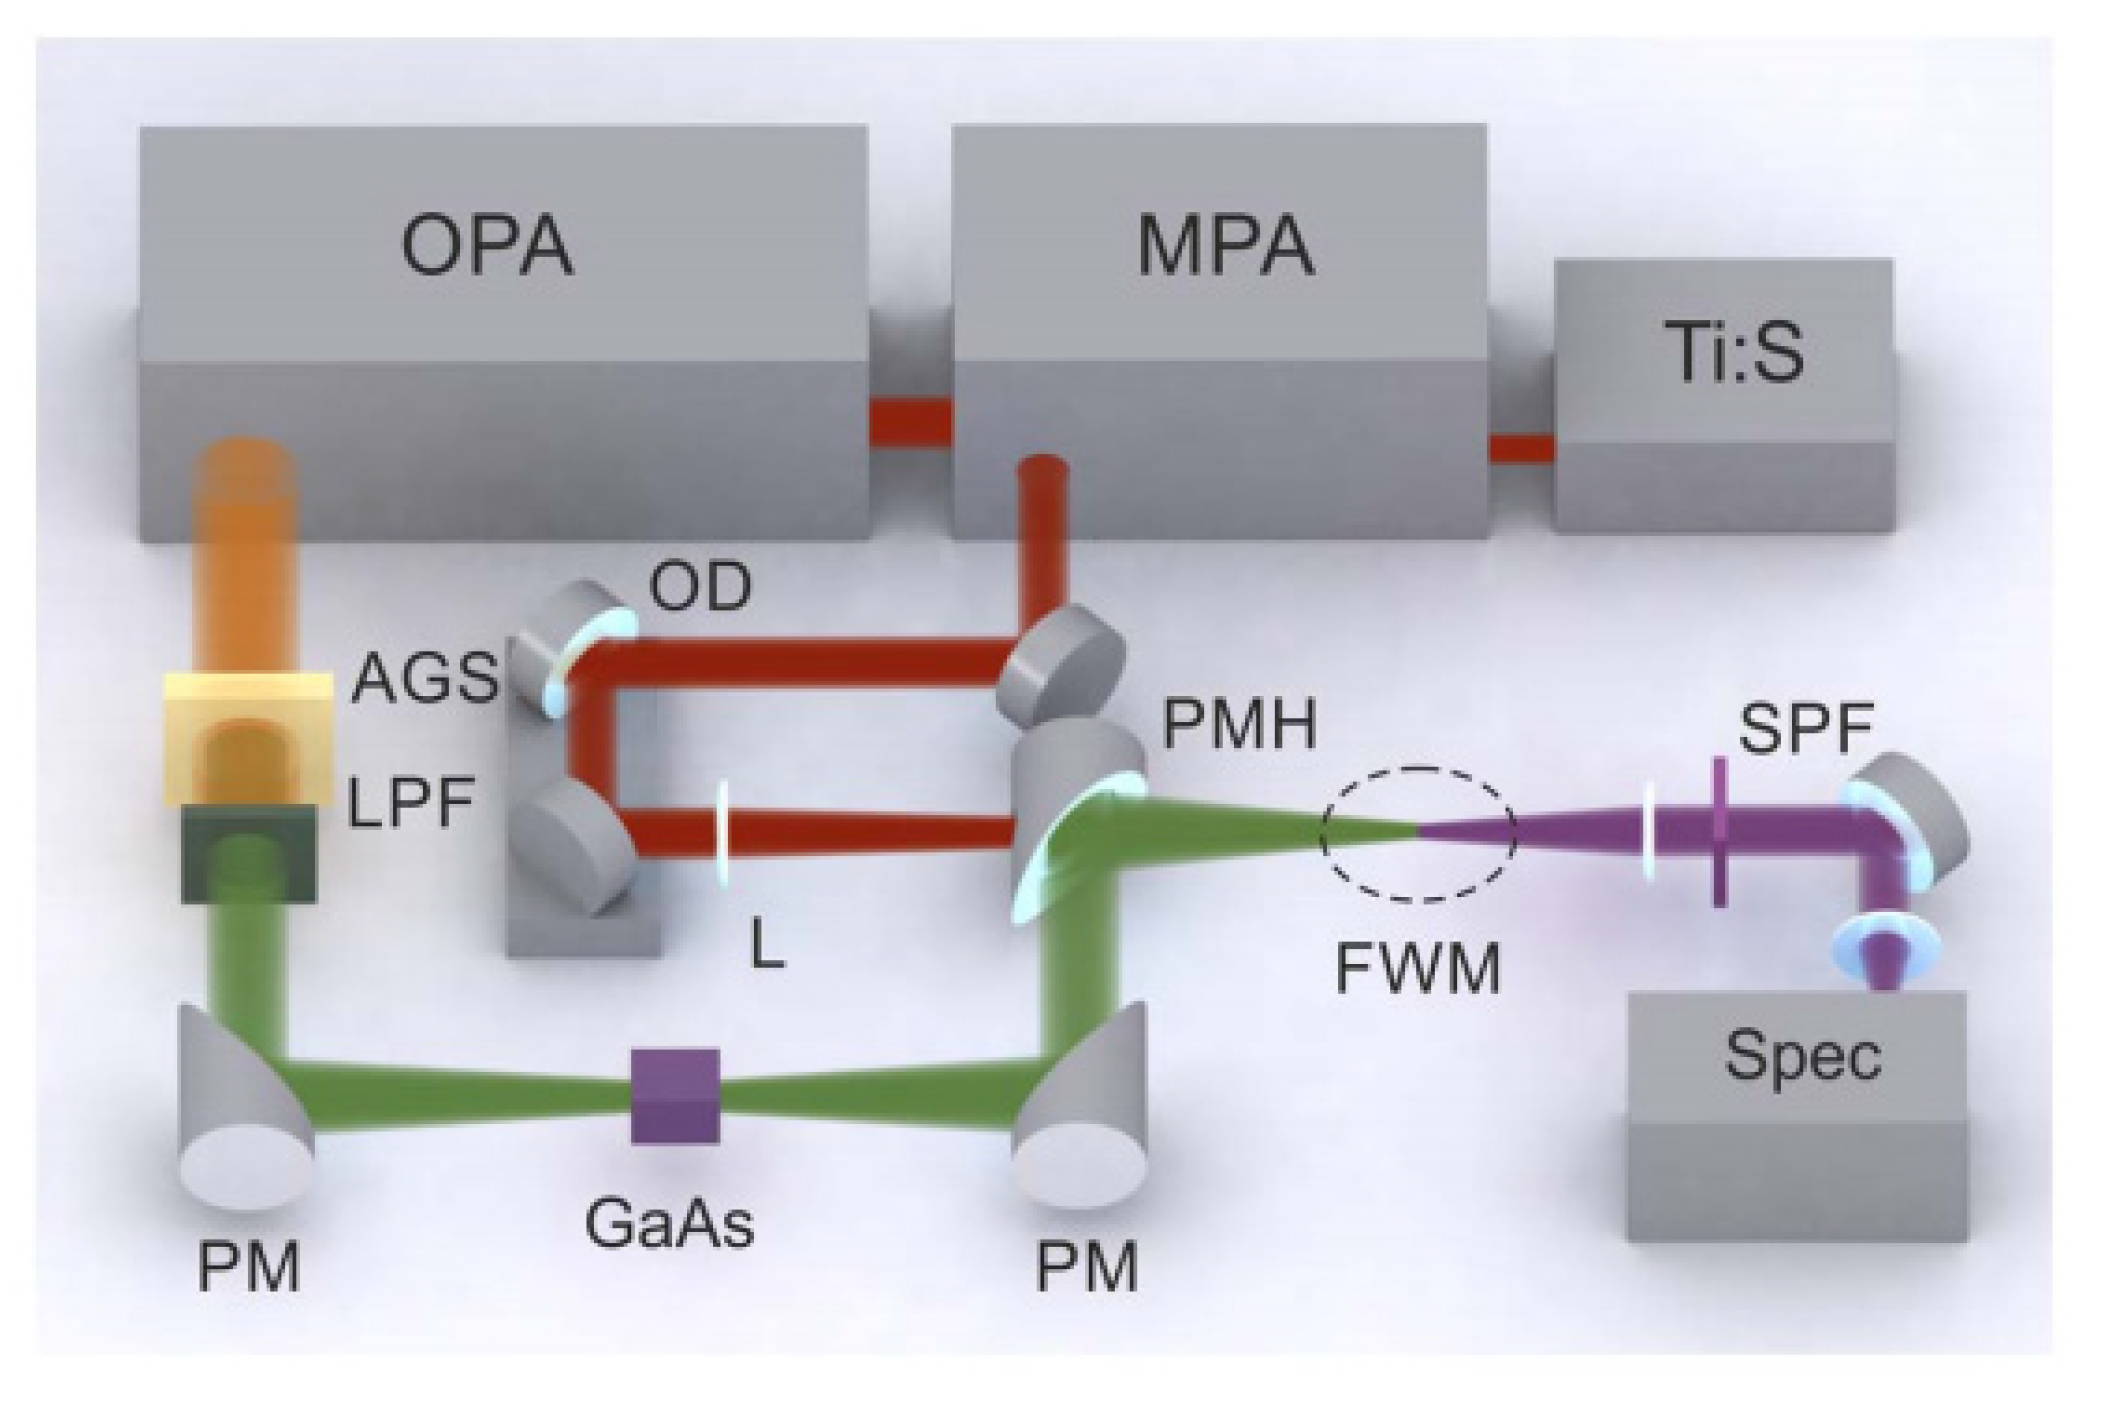
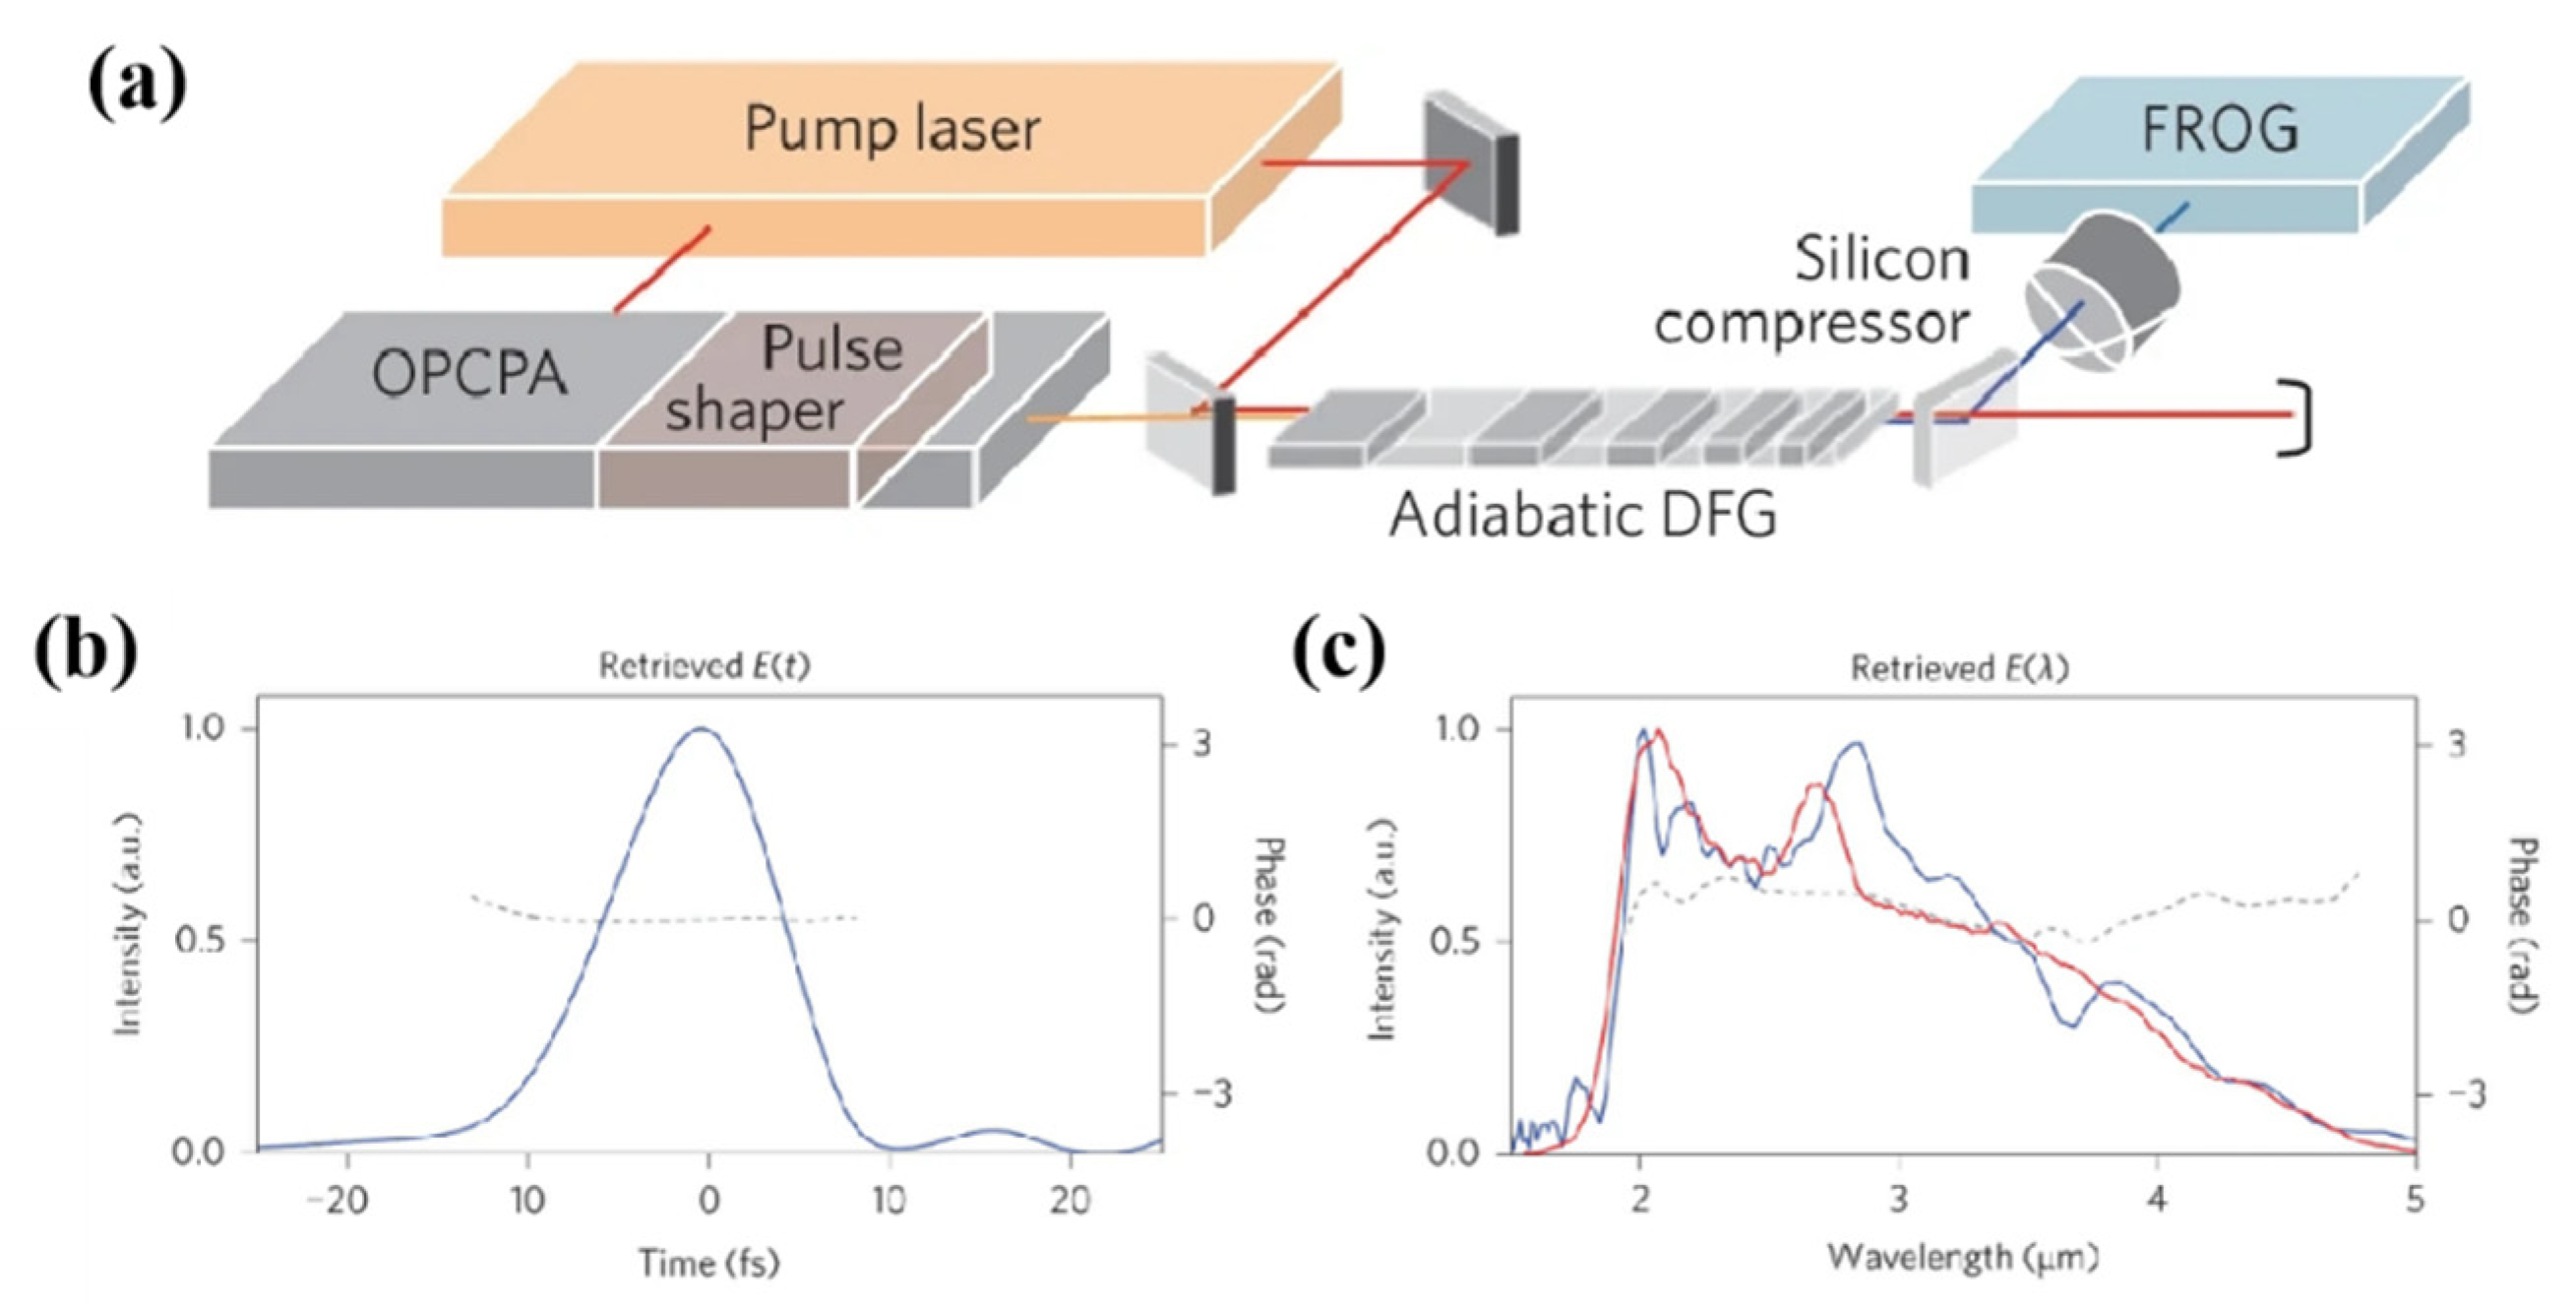
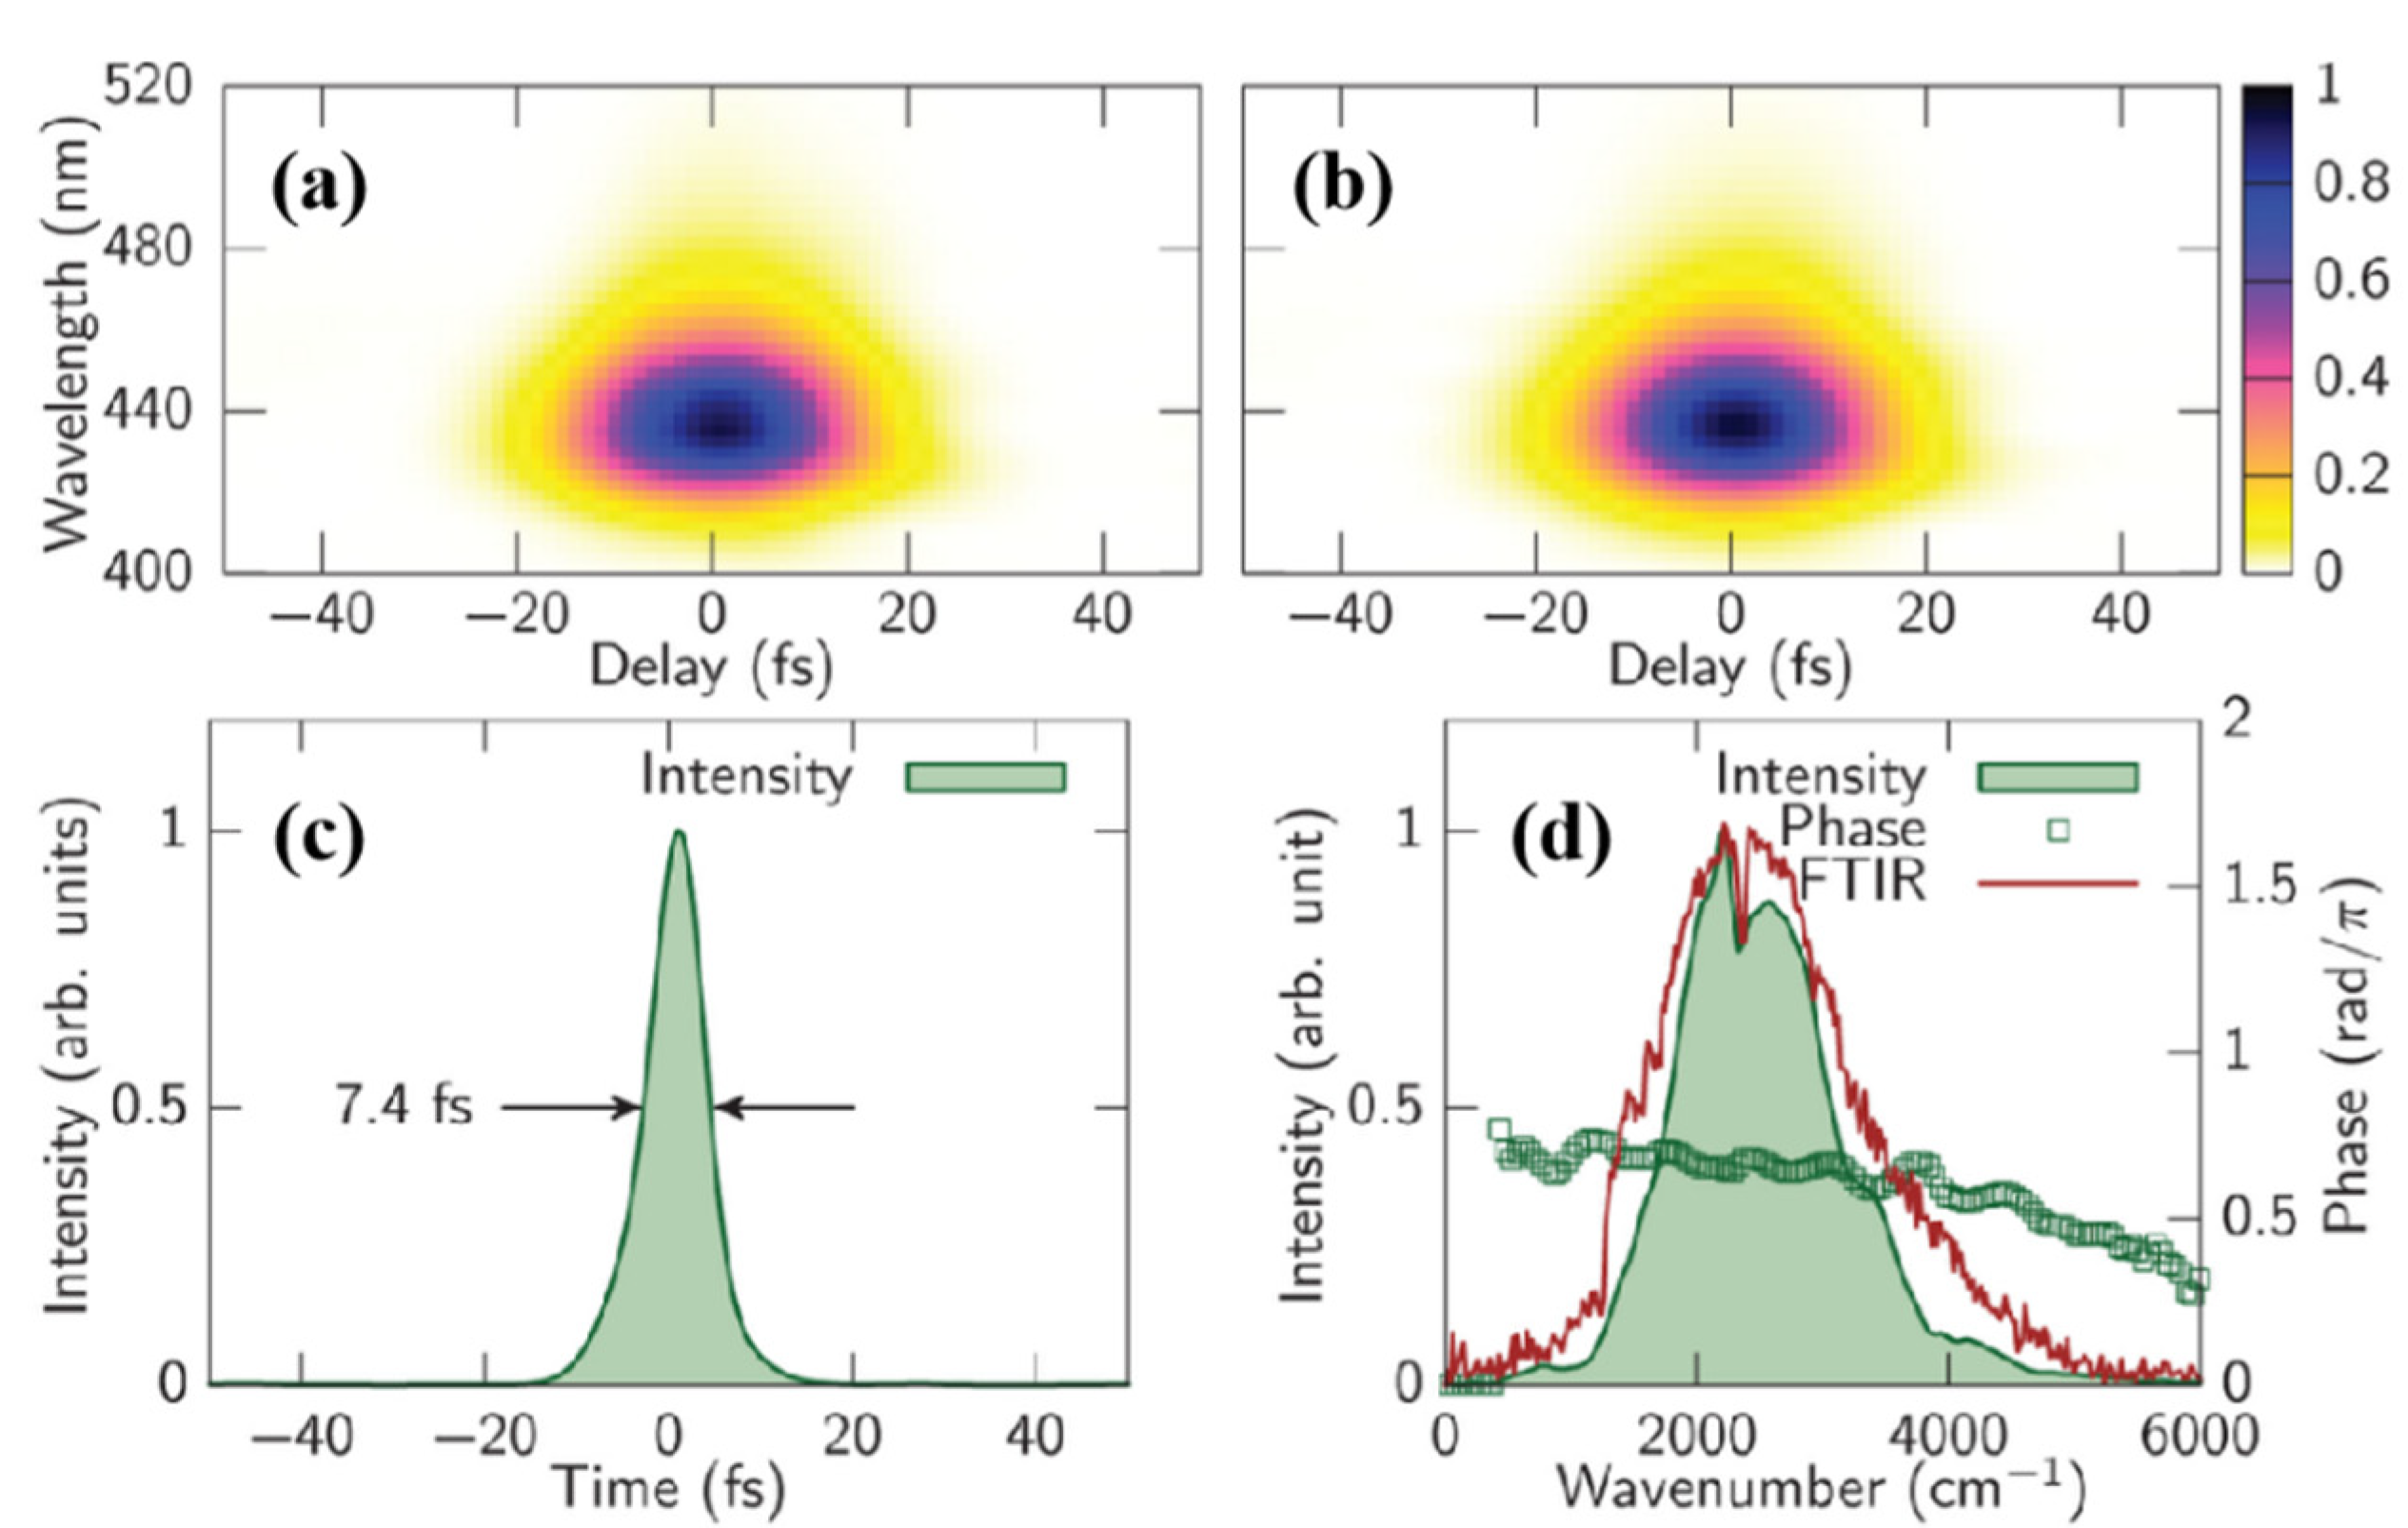
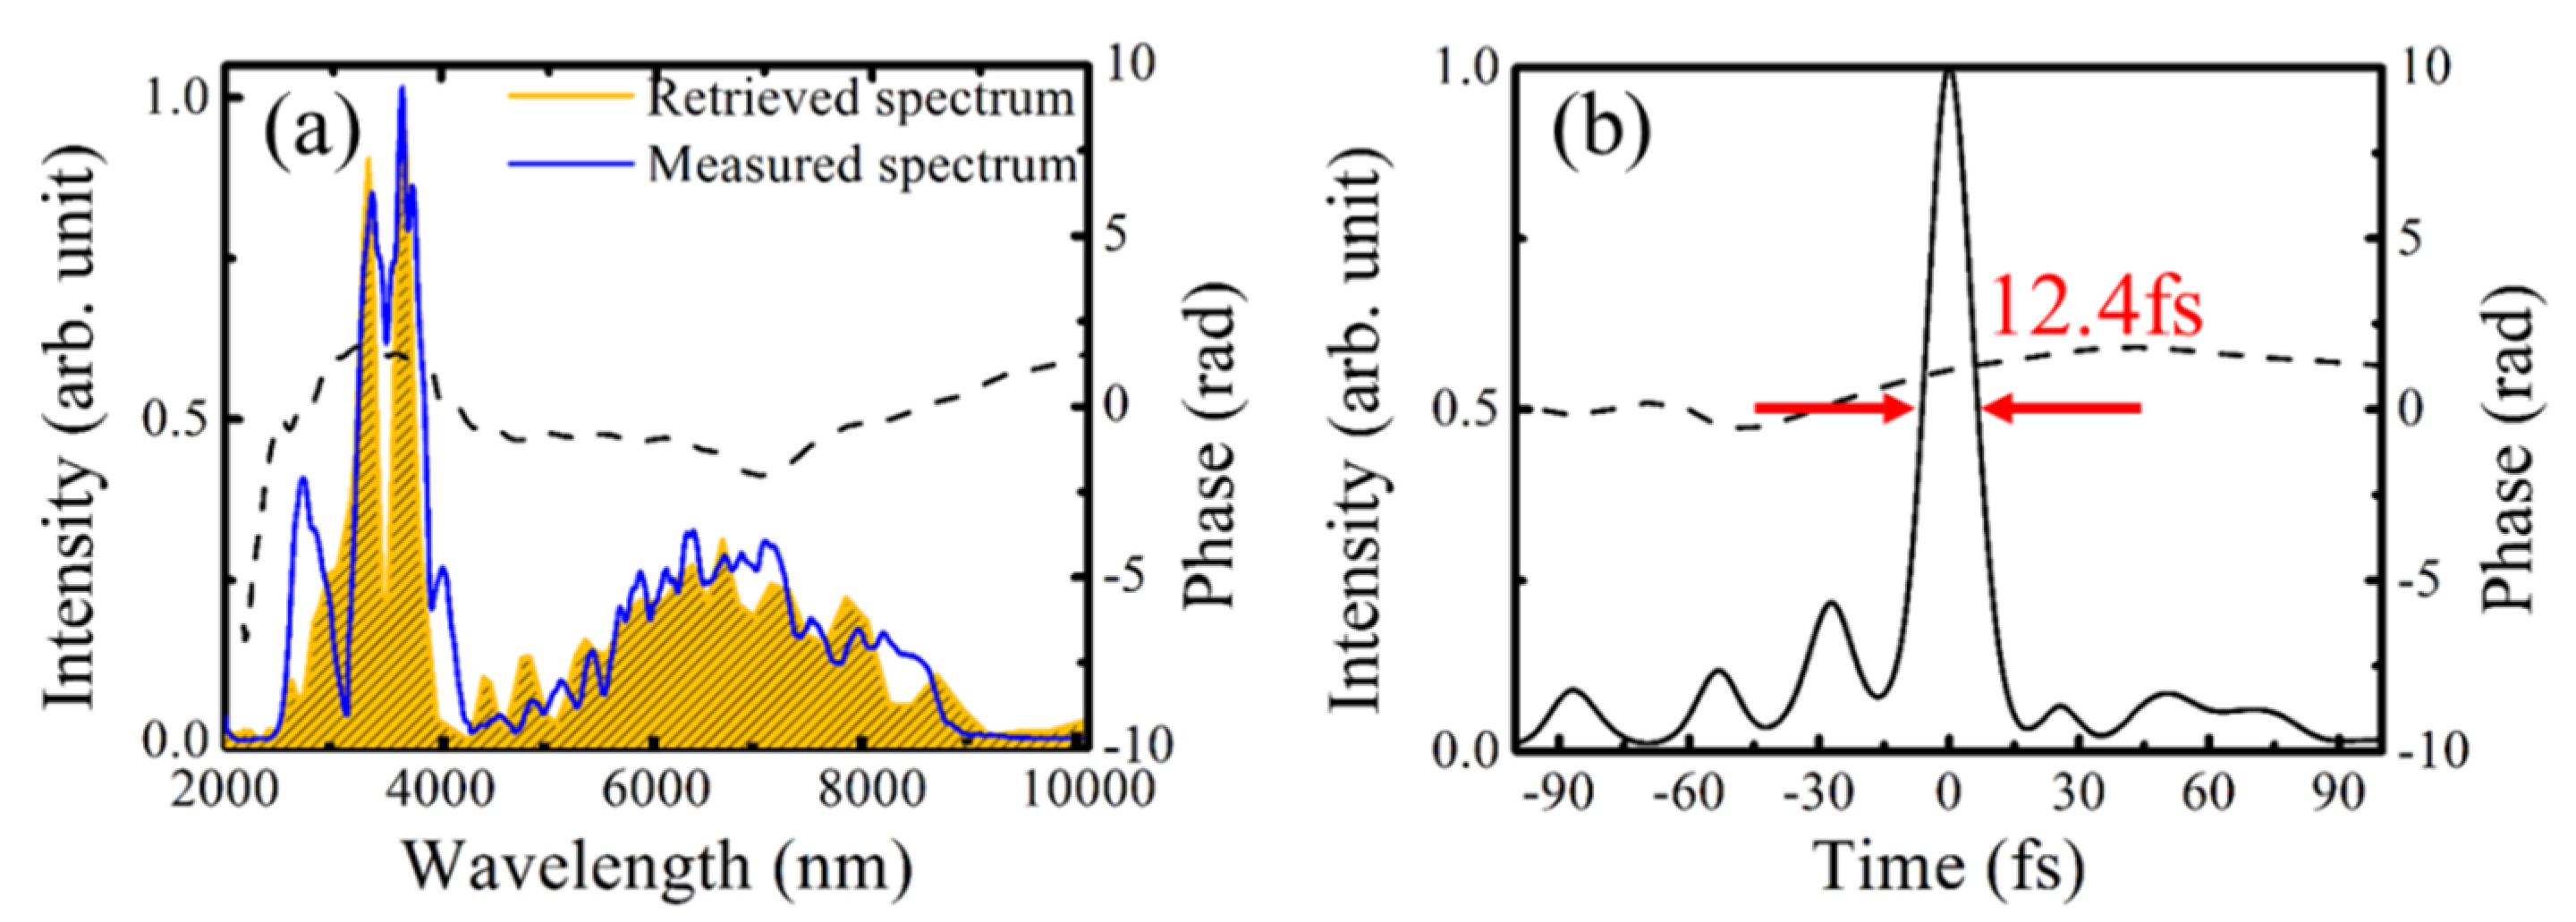
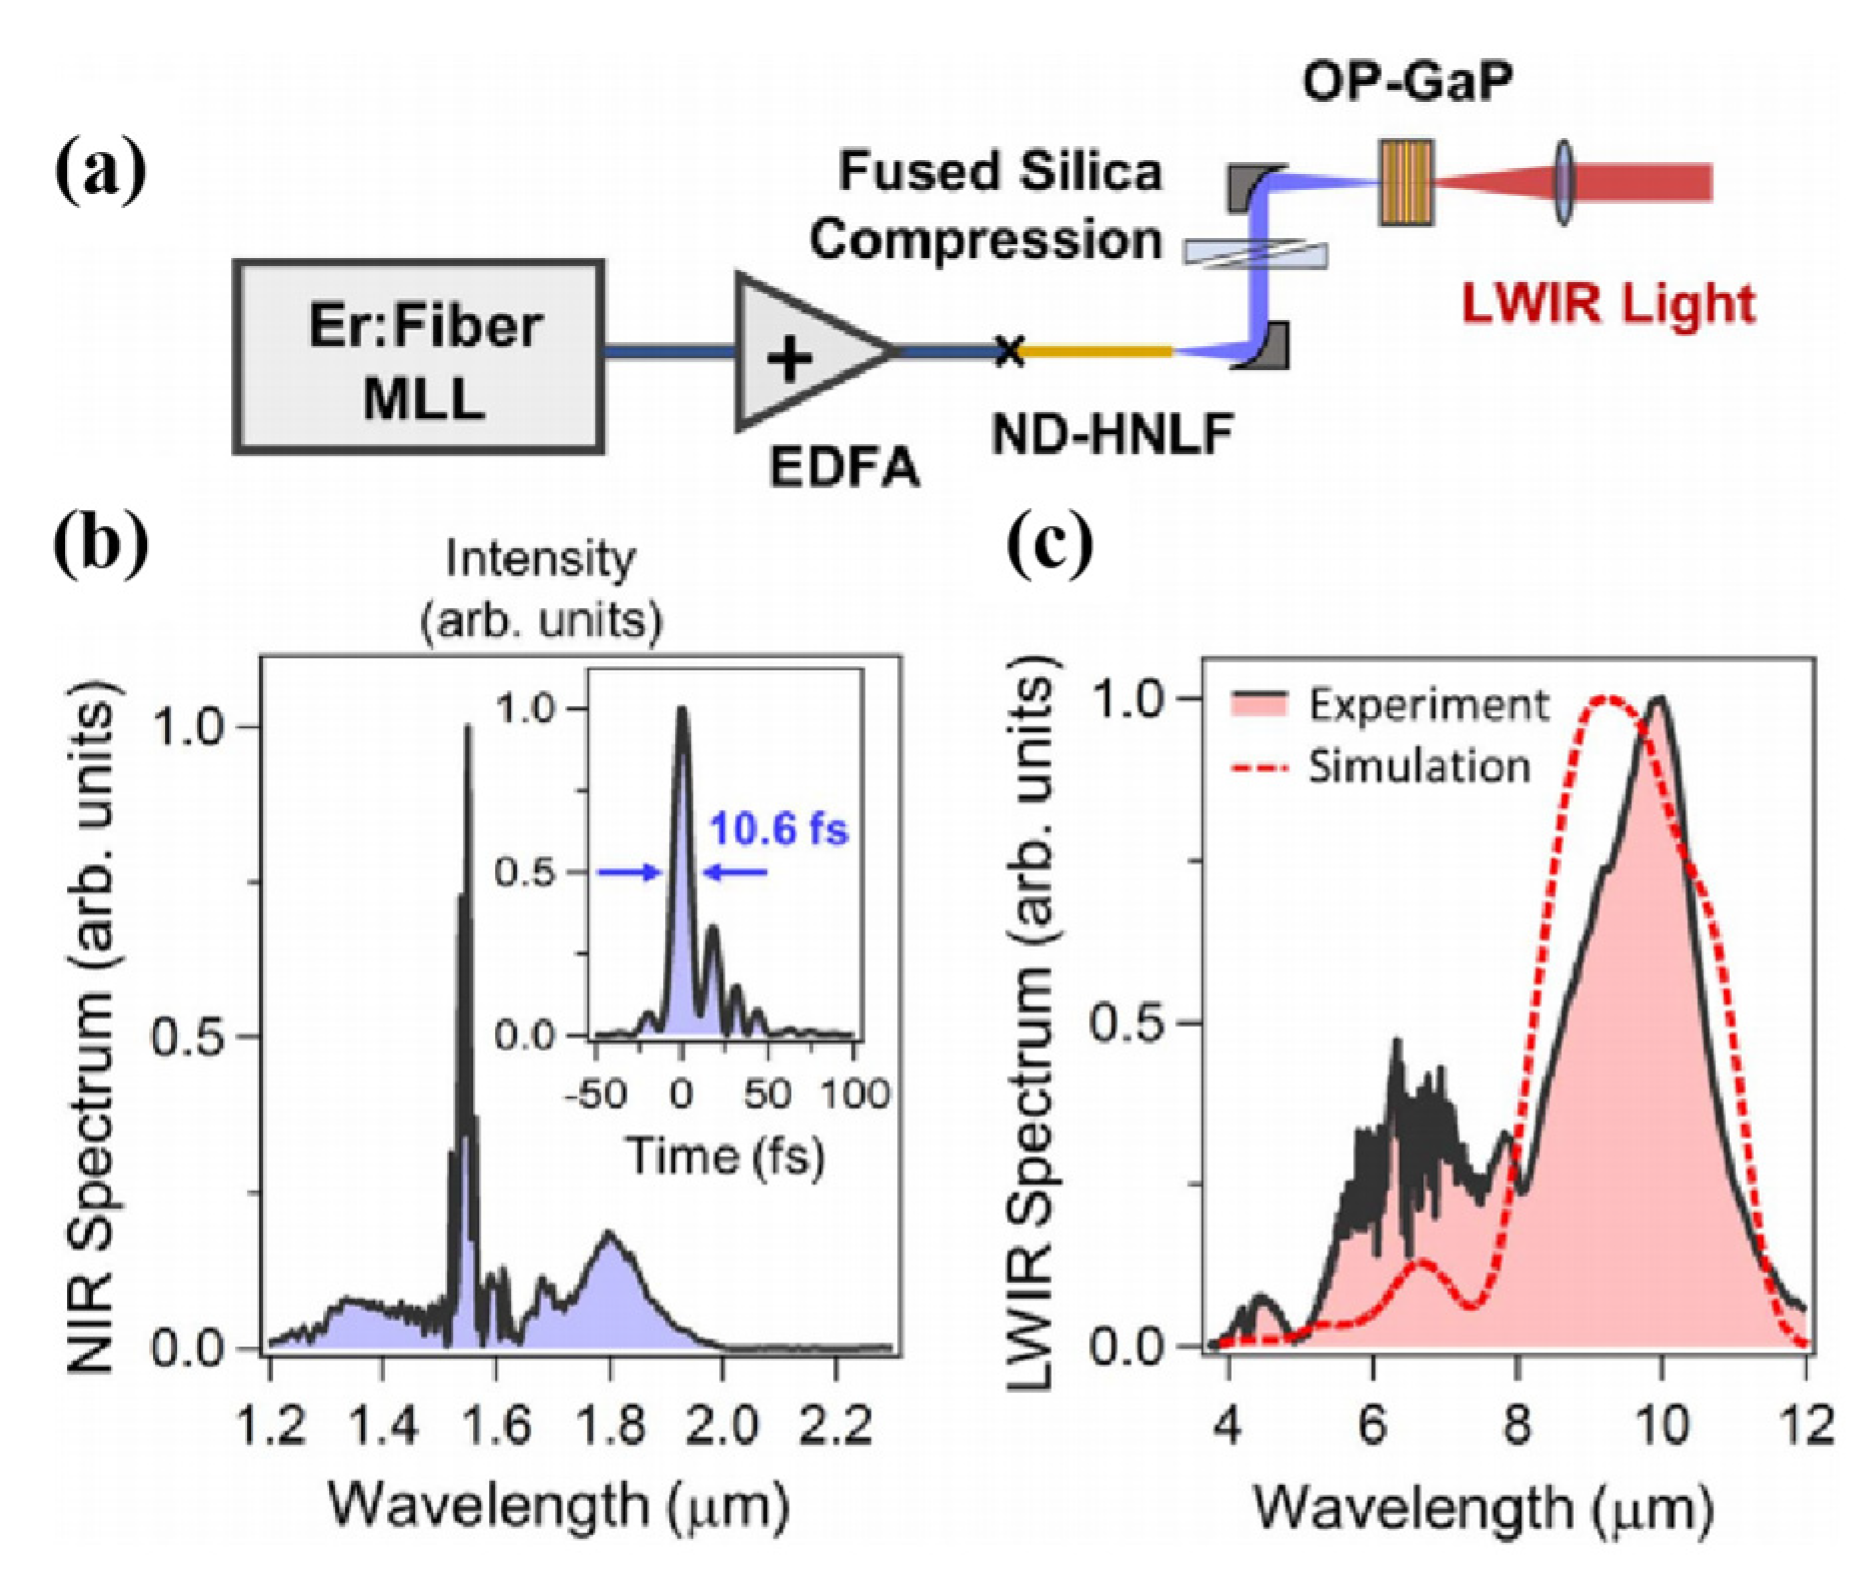
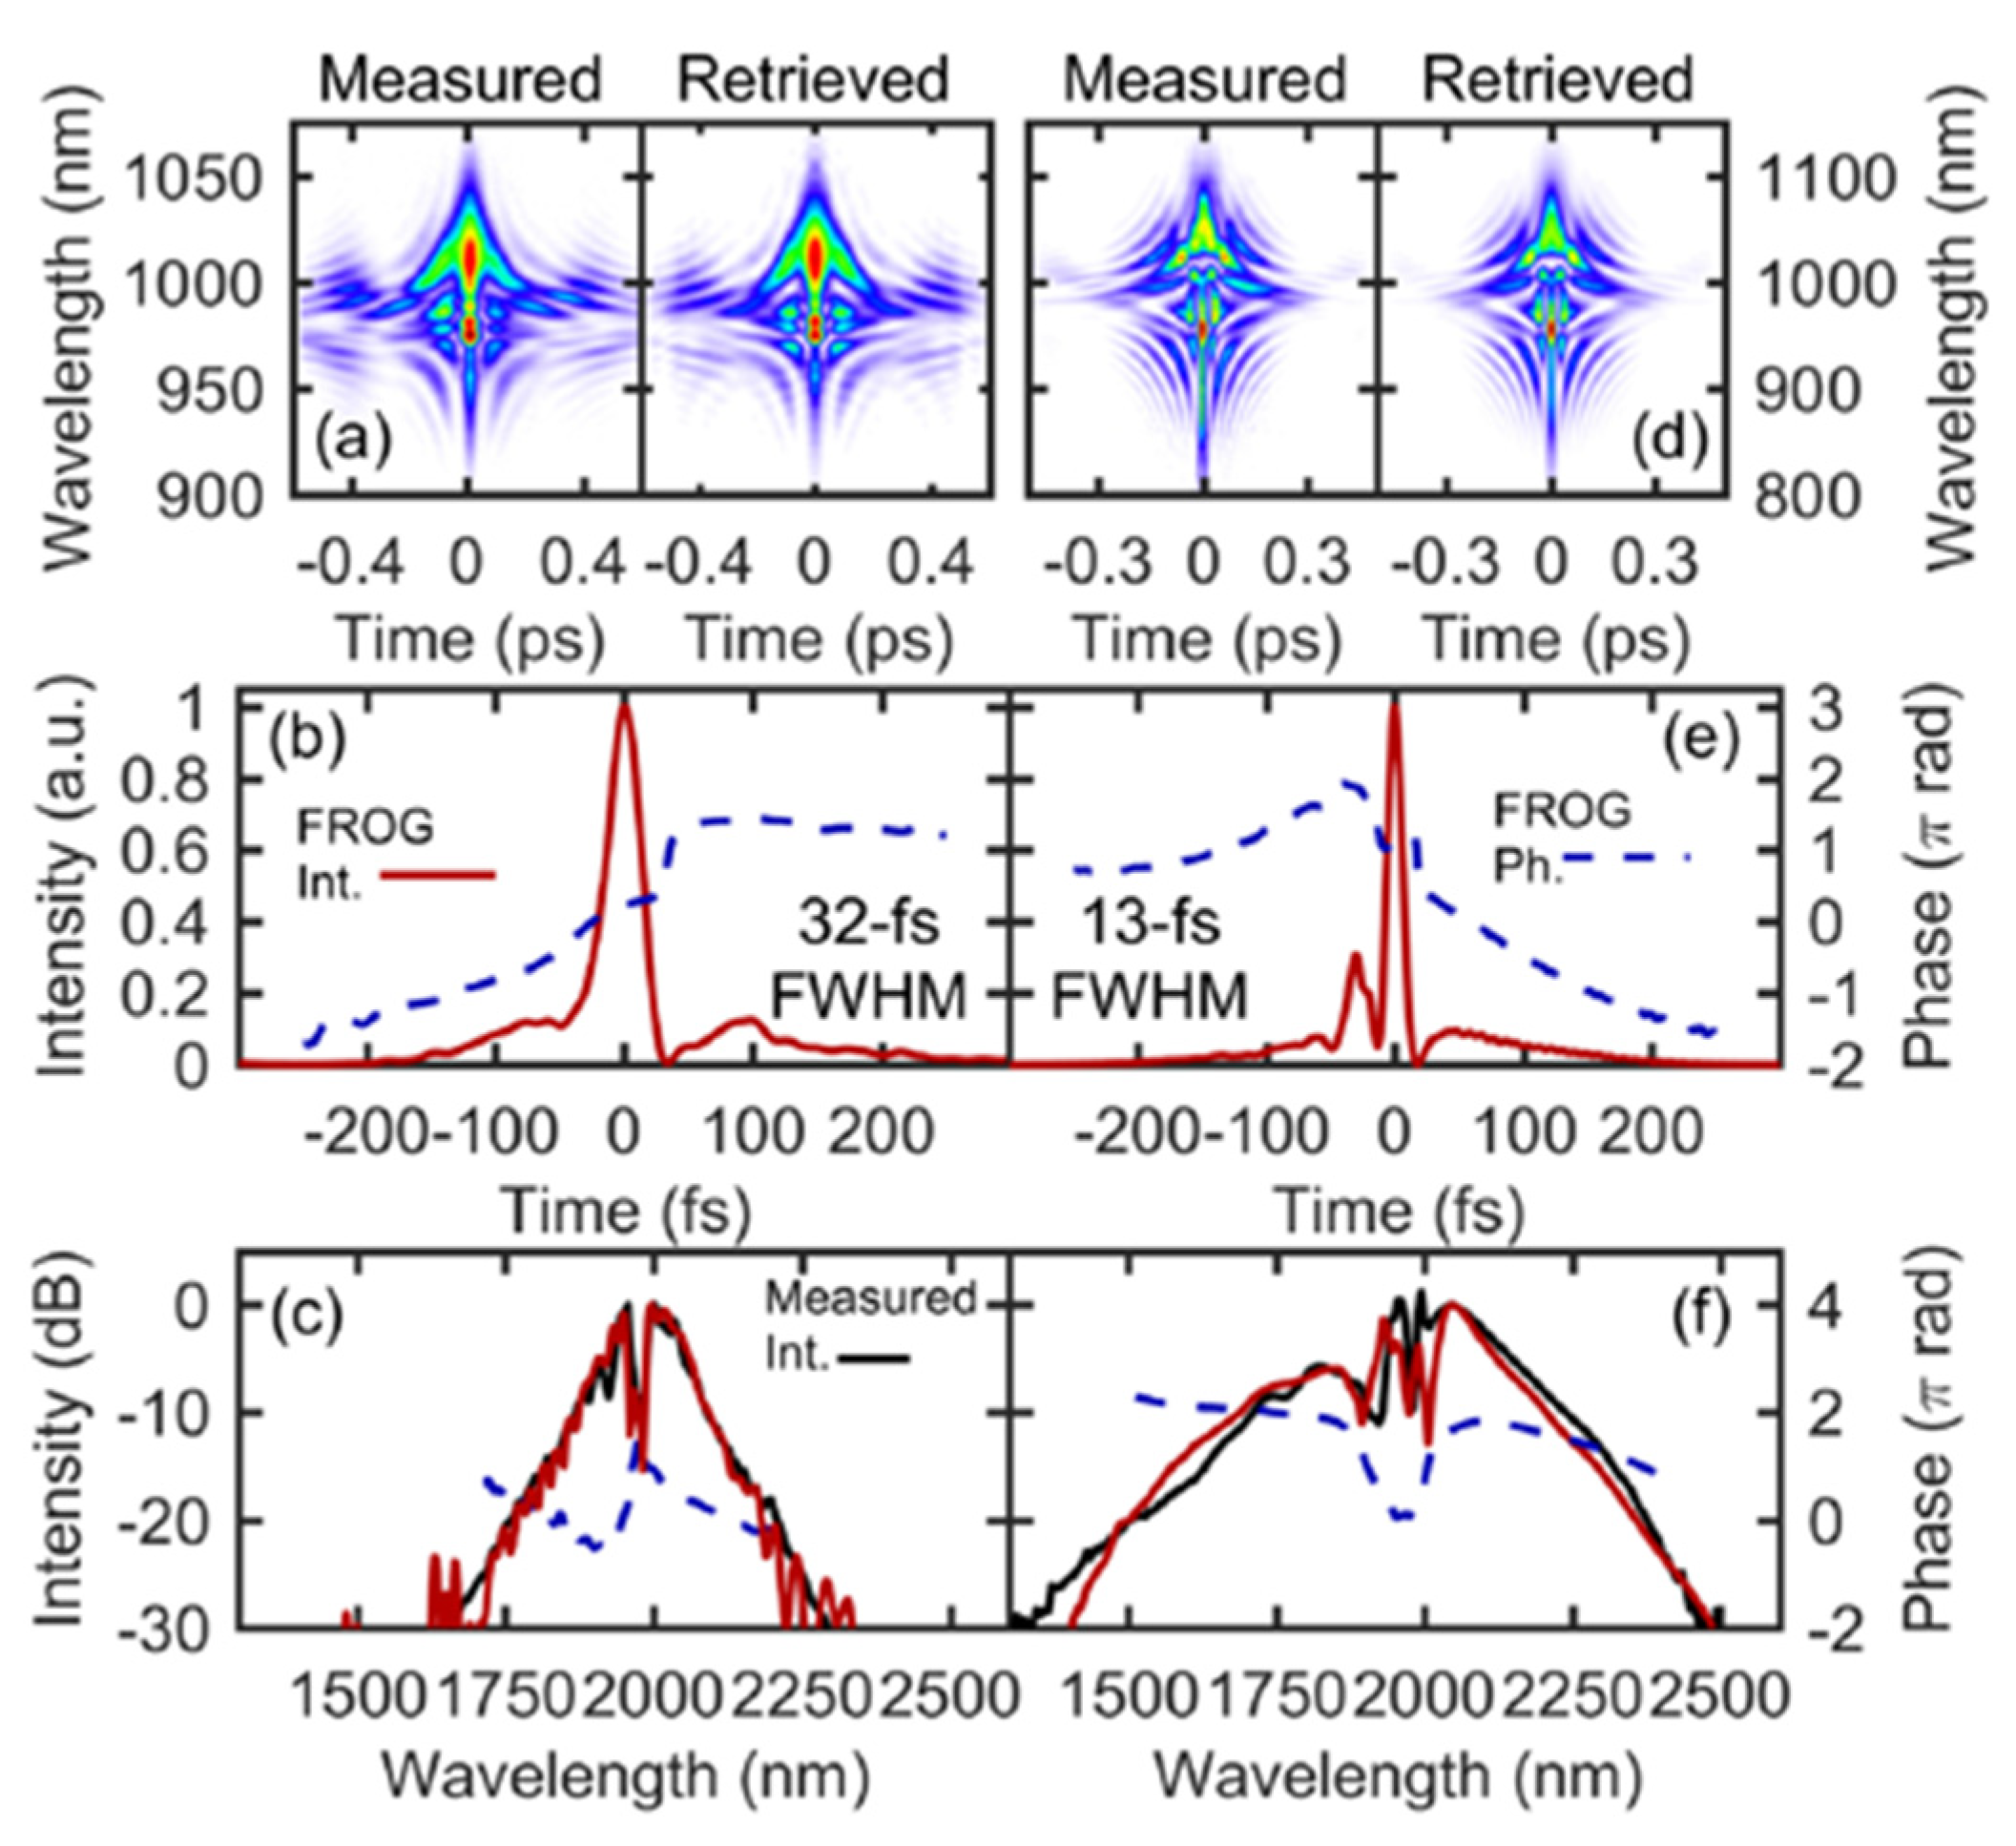
Table 1.
Comparison of different MIR nonlinear crystals.
| Nonlinear Crystal | Transparency (µm) | Nonlinear Coefficient (pm/V) | Bandgap (eV) | Reference |
|---|---|---|---|---|
| AGS | 0.5–13 | 13.4 | 2.76 | [25] |
| AGSe | 0.75–15 | 26.8 | 1.83 | [25] |
| BGSe | 0.47–18 | 24.3 | 2.64 | [26] |
| CSP | 0.5–9 | 84.5 | 2.45 | [27] |
| ZGP | 2–12 | 72 | 2.2 | [28] |
| GaSe | 0.65–18 | 57 | 2.1 | [29] |
| LGS | 0.32–11.6 | 5.9 | 3.76 | [30] |
| OP-GaAs | 0.9–17 | 94 | 2.1 | [31] |
| OP-GaP | 0.57–12 | 70 | 2.26 | [32] |
Table 2.
Parameters of selected OPA system pumped by 1 and 2 µm.
| Pump (μm) | Wavelength (μm) | Pulse Energy (μJ) | Repetition Rate (kHz) | Power (mW) | Pulse Width (fs) | Optical Cycle | Reference |
|---|---|---|---|---|---|---|---|
| 1 | 7.6–11.5 | 0.59 | 100 | 59 | 126 | 3.8 | [33] |
| 1 | 5–11 | 0.22 | 50 | 11 | 32 | 1.2 | [34] |
| 2 | 2.5–9 | 33 | 1 | 33 | 12.4 | 0.88 | [35] |
| 2 | 4.2–16 | 3.4 | 1 | 3.4 | 19 | 0.64 | [36] |
| 2.4 | 3–10 | 130 | 1 | 130 | 318 | 15.1 | [37] |
Table 3.
Parameters of selected 2–4 µm OPCPA system.
| Wavelength (µm) | Pulse Energy (mJ) | Repetition Rate (kHz) | Power (W) | Pulse Width (fs) | Optical Cycle | Reference |
|---|---|---|---|---|---|---|
| 2.1 | 1.2 | 3 | 3.6 | 10.5 | 1.5 | [39] |
| 2.1 | 2.7 | 10 | 27 | 30 | 4.3 | [40] |
| 2.1 | 2.6 | 1 | 2.6 | 39 | 5.6 | [41] |
| 2.2 | 0.25 | 100 | 25 | 16.5 | 2.2 | [42] |
| 2.5 | 0.126 | 100 | 12.6 | 14.4 | 1.7 | [43] |
| 3 | 0.3 | 10 | 3 | 21 | 2.1 | [44] |
| 3 | 2.4 | 10 | 24 | 50 | 5 | [45] |
| 3.07 | 0.01 | 125 | 1.25 | 72 | 7 | [46] |
| 3.1 | 0.125 | 100 | 12.5 | 73 | 7 | [47] |
| 3.2 | 0.152 | 100 | 15.2 | 38 | 3.6 | [48] |
| 3.25 | 0.06 | 160 | 9.6 | 14.5 | 1.4 | [49] |
| 3.4 | 0.012 | 50 | 0.6 | 41.6 | 3.7 | [50] |
| 3.425 | 13.3 | 0.01 | 0.133 | 111 | 9.7 | [51] |
| 3.9 | 8 | 0.02 | 0.16 | 83 | 6.4 | [52] |
| 4 | 2.6 | 0.1 | 0.26 | 21.5 | 1.6 | [53] |
Table 4.
Parameters of the long-wavelength MIR OPCPA systems.
| Wavelength (μm) | Pulse Energy (mJ) | Repetition Rate (kHz) | Power (W) | Pulse Width (fs) | Optical Cycle | Reference |
|---|---|---|---|---|---|---|
| 5 | 3.4 | 1 | 3.4 | 89.4 | 5.4 | [54] |
| 7 | 0.7 | 0.1 | 0.07 | 188 | 8 | [55] |
| 9 | 0.014 | 10 | 0.14 | 142 | 4.7 | [56] |
Table 5.
Parameters of selected IPDFG source.
| Pump Wavelength (µm) | Nonlinear Crystal | IPDFG Spectral Span (µm) | Conversion Efficiency (%) | Reference |
|---|---|---|---|---|
| 1.03 | LGS | 8–11 | 0.037 | [58] |
| 1.03 | LGS | 6.8–16.4 | 0.11 | [59] |
| 1.57 | OP-GaP | 4–12 | 0.071 | [24] |
| 1.9 | GaSe | 3.7–18 | 1.4 | [60] |
| 2 | ZnSe | 2.7–20 | 0.51 | [61] |
| 2 | GaSe | 4.5–20 | 0.13 | [62] |
| 2.1 | AGSe | 7–11 | 0.8 | [63] |
| 2.5 | GaSe | 4.3–17.6 | 0.22 | [64] |
| 2.5 | ZGP | 5.8–12.5 | 3.3 | [64] |
| 3 | GaSe | 6–13.2 | 5.3 | [65] |
Table 6.
Parameters of single- or sub-cycle MIR.
| Method | Wavelength (µm) | Repetition Rate (kHz) | Pulse Energy (µJ) | Pulse Width (fs) | Optical Cycle | Reference |
|---|---|---|---|---|---|---|
| DFG | 5–300 | 1 | 0.4 | 46 | 1 | [67] |
| 3–18 | 1 | 2 | 45 | 1.2 | [68] | |
| 1.8–4.4 | 1 | 1.5 | 11 | 1.2 | [69] | |
| FWM | 2–20 | 1 | 0.25 | 7.4 | 0.57 | [70] |
| OPA | 2.5–9 | 1 | 33 | 12.4 | 0.88 | [35] |
| IPDFG | 4–12 | 1 × 10⁵ | 2.5 × 10⁻⁶ | − | − | [24] |
| 6–18 | 5 × 10⁴ | 0.01 | 43 | 1.16 | [71] |
Publisher’s Note: MDPI stays neutral with regard to jurisdictional claims in published maps and institutional affiliations. |
© 2021 by the authors. Licensee MDPI, Basel, Switzerland. This article is an open access article distributed under the terms and conditions of the Creative Commons Attribution (CC BY) license (https://creativecommons.org/licenses/by/4.0/).
Share and Cite
MDPI and ACS Style
Tian, K.; He, L.; Yang, X.; Liang, H. Mid-Infrared Few-Cycle Pulse Generation and Amplification. Photonics 2021, 8, 290. https://doi.org/10.3390/photonics8080290
AMA Style
Tian K, He L, Yang X, Liang H. Mid-Infrared Few-Cycle Pulse Generation and Amplification. Photonics. 2021; 8(8):290. https://doi.org/10.3390/photonics8080290
Chicago/Turabian StyleTian, Kan, Linzhen He, Xuemei Yang, and Houkun Liang. 2021. "Mid-Infrared Few-Cycle Pulse Generation and Amplification" Photonics 8, no. 8: 290. https://doi.org/10.3390/photonics8080290
Note that from the first issue of 2016, this journal uses article numbers instead of page numbers. See further details here.