The Segregated Intestinal Flow Model (SFM) for Drug Absorption and Drug Metabolism: Implications on Intestinal and Liver Metabolism and Drug–Drug Interactions

Abstract
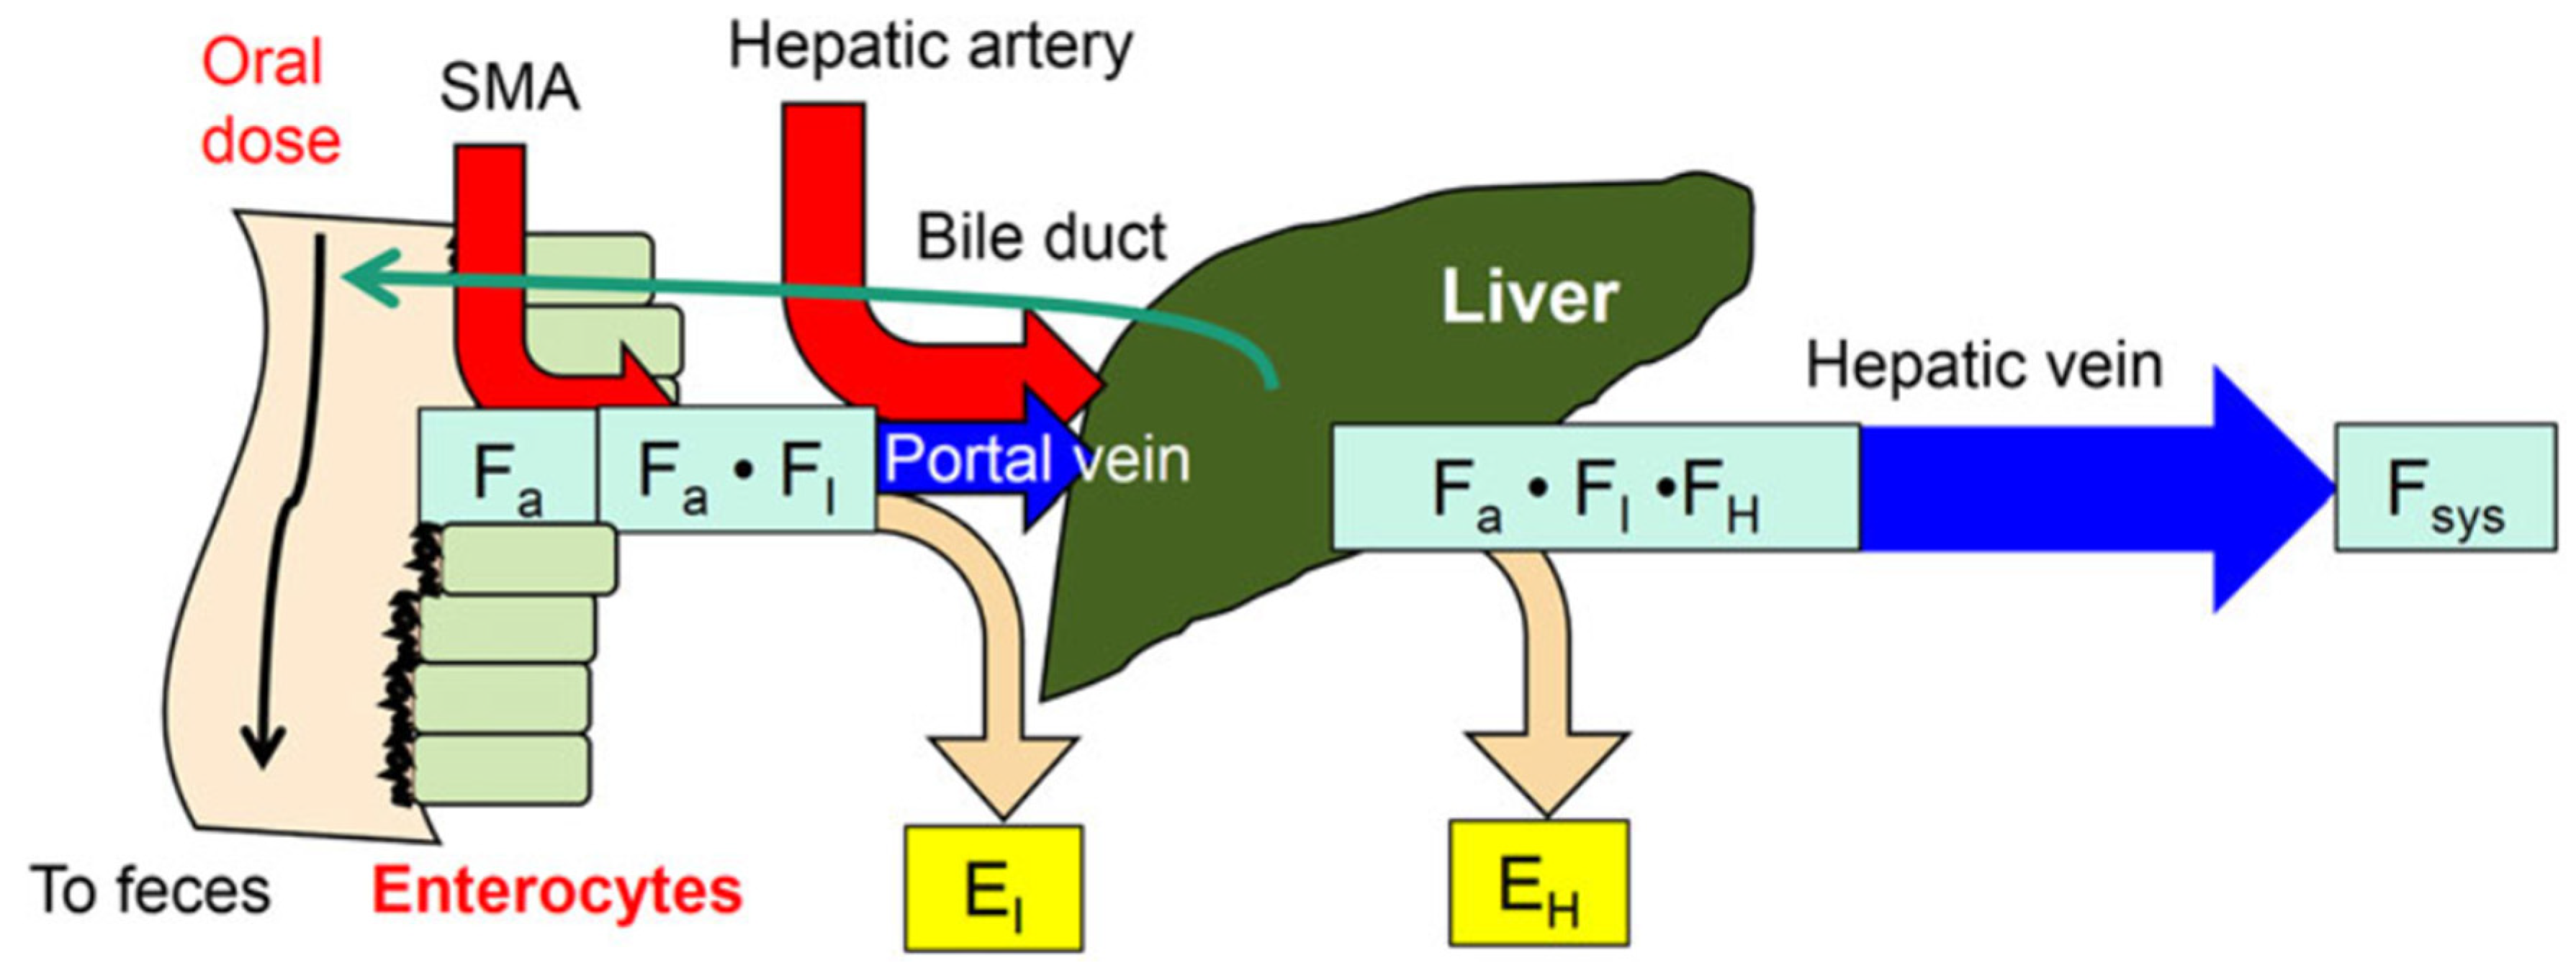
:1. The Intestine–Liver Unit
2. Reason or Need for Intestinal Flow Models
3. Route-Dependent Intestinal Metabolism
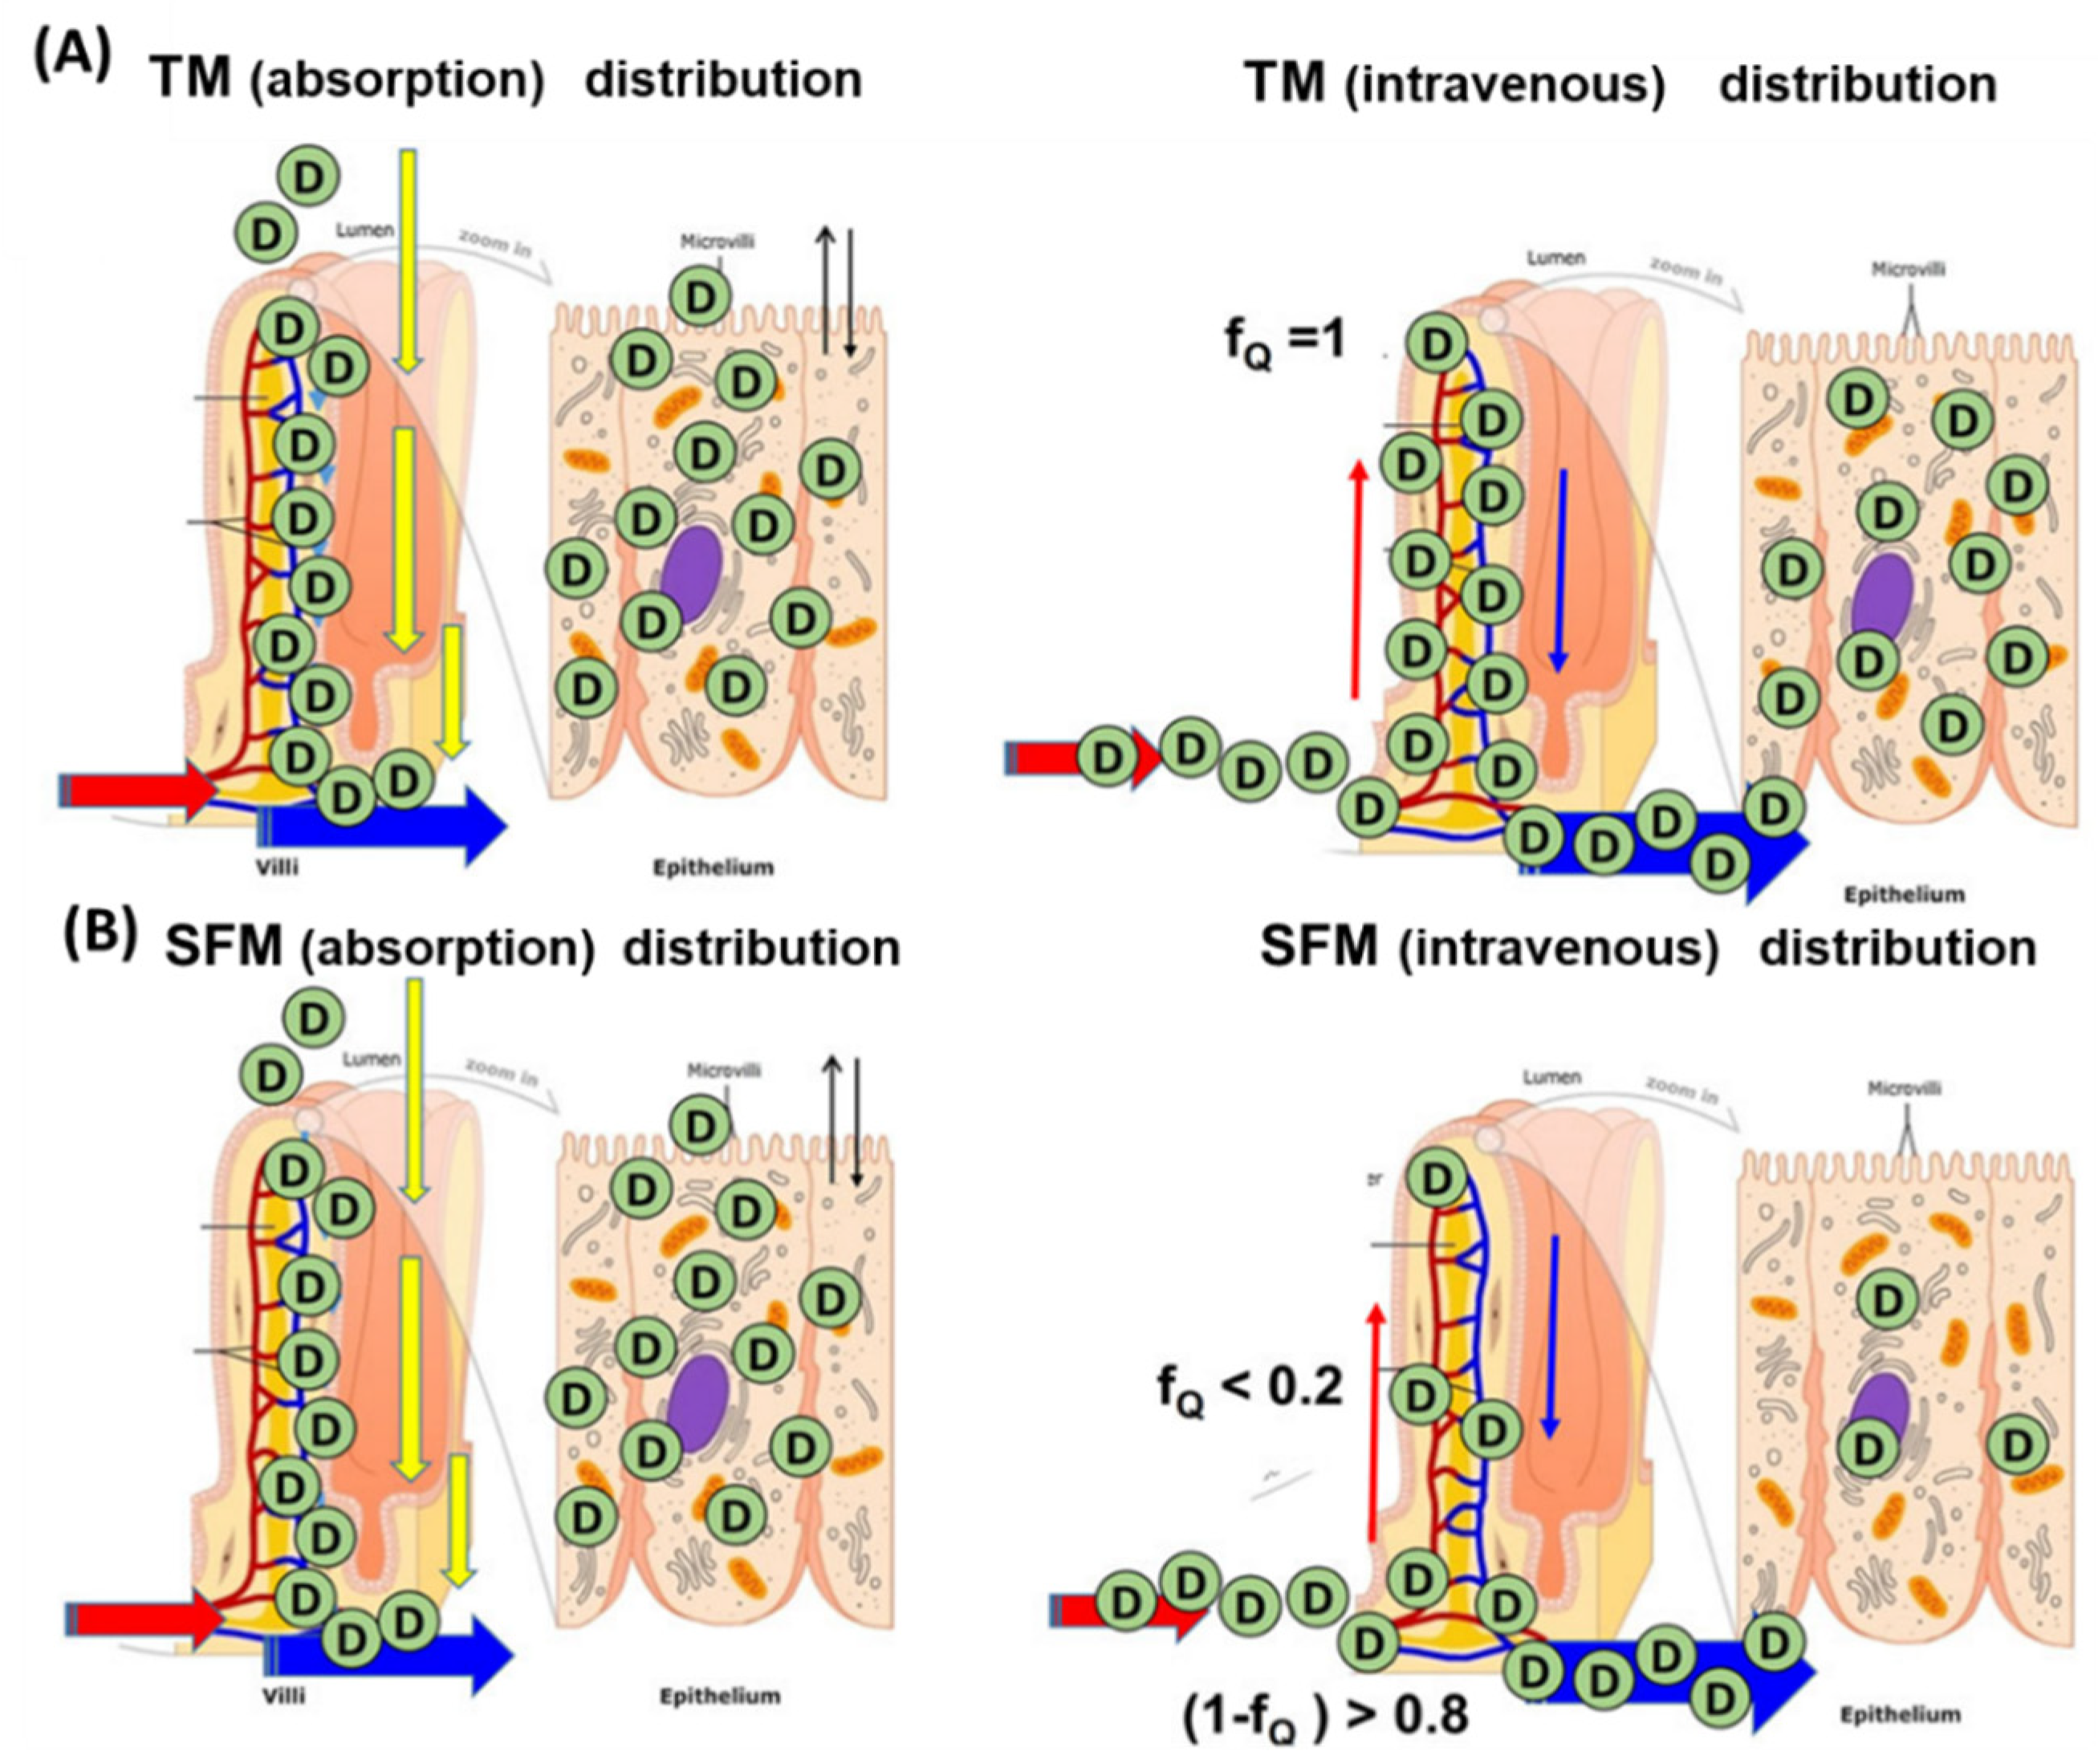
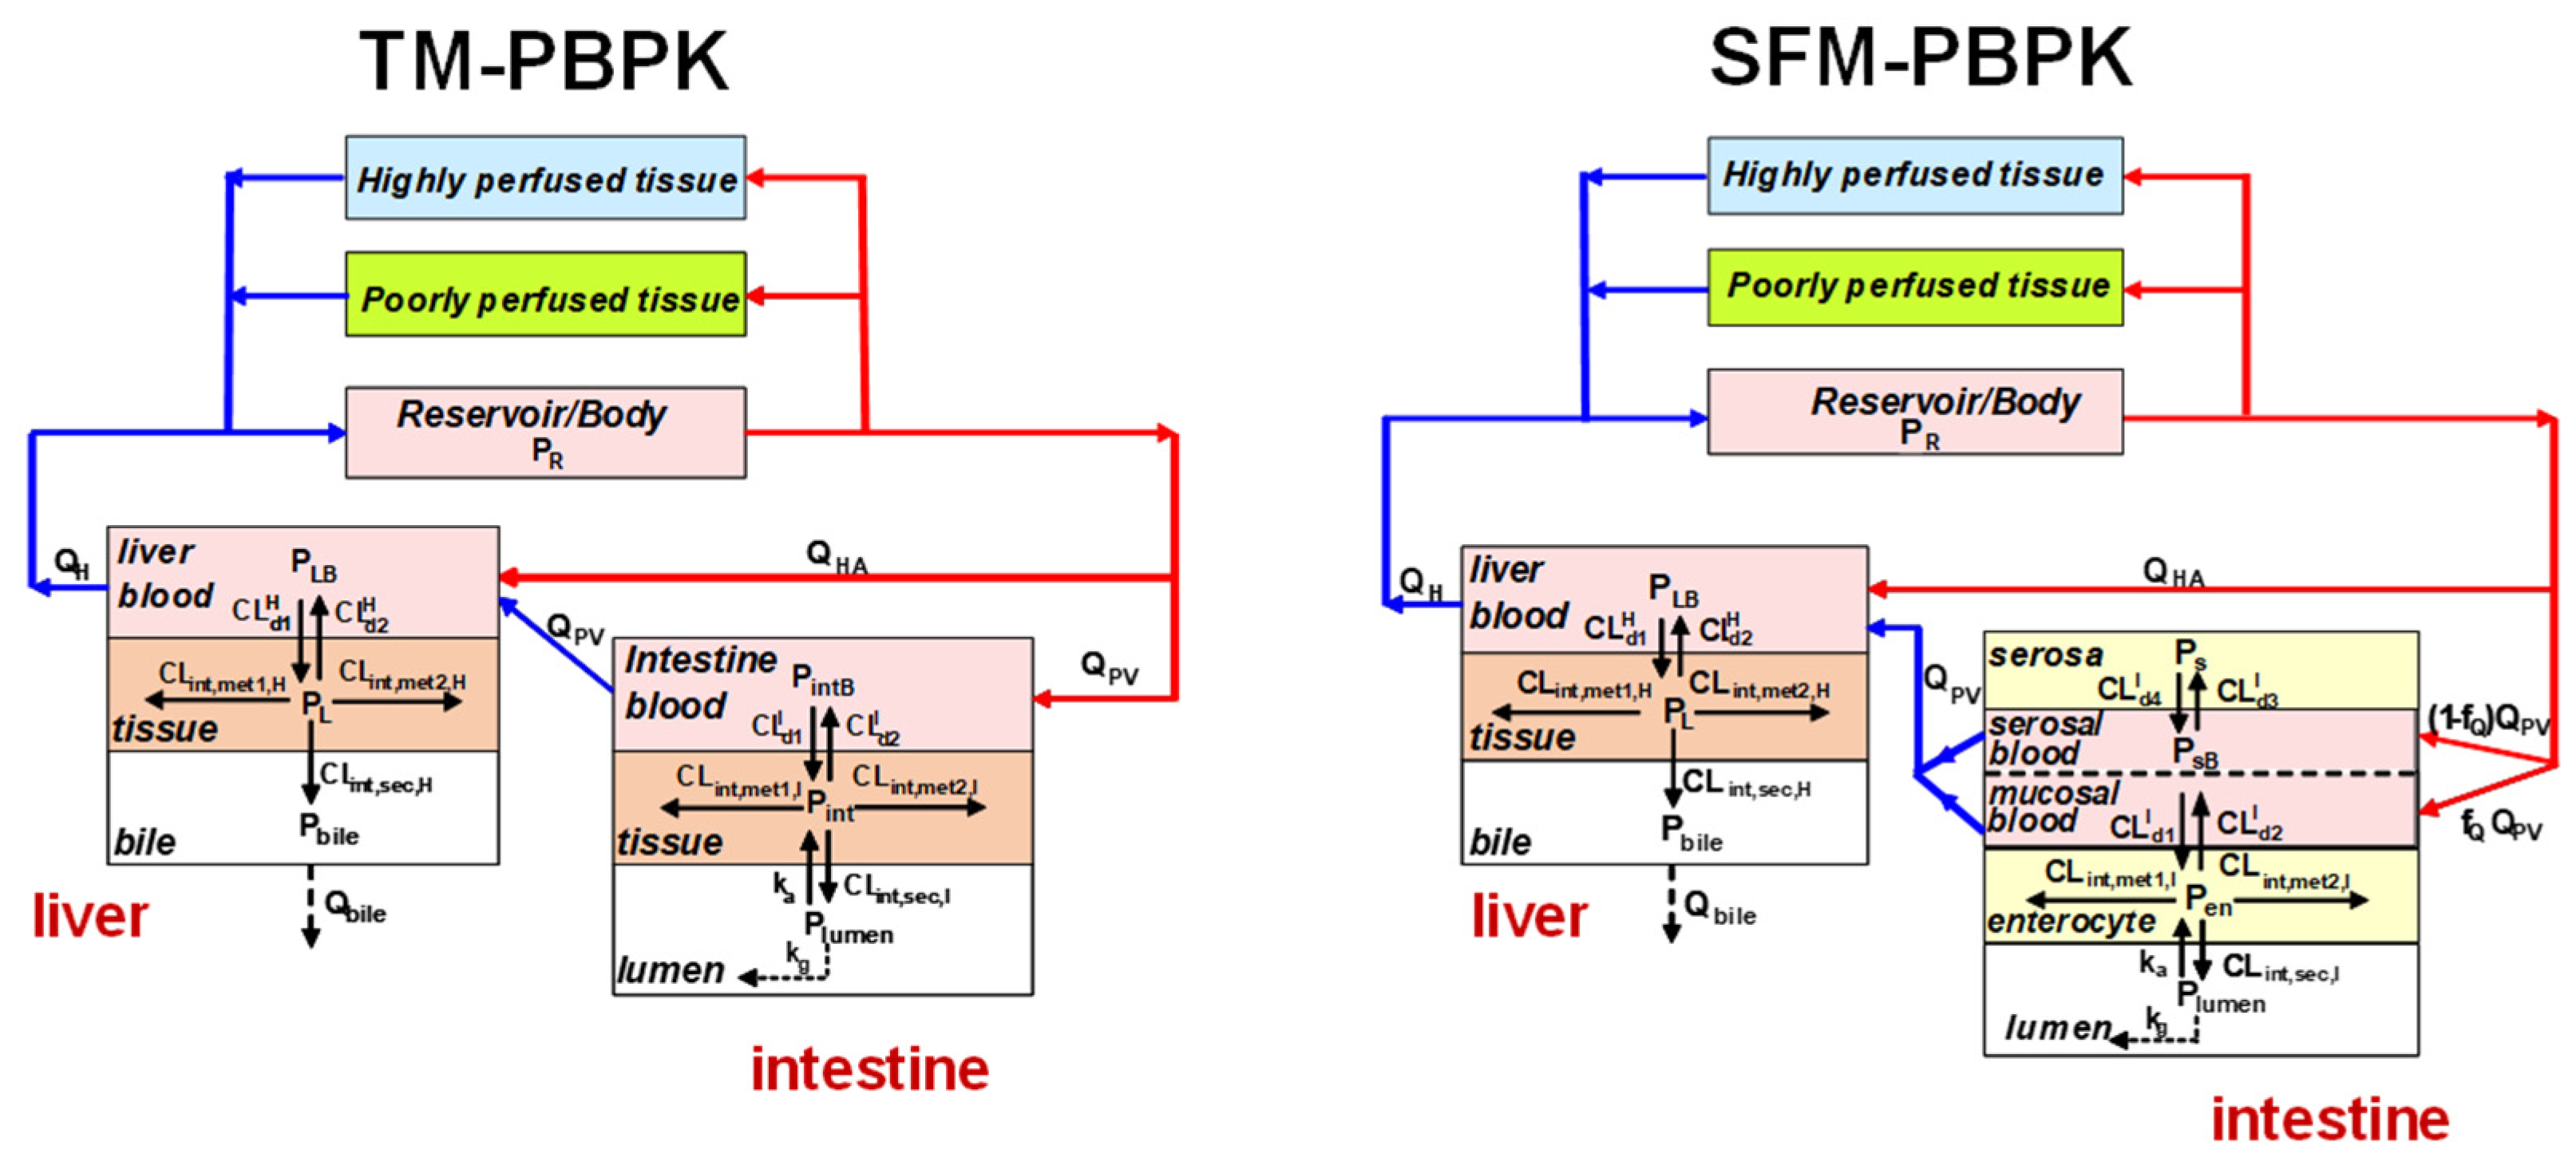
4. Intestinal Flow Models: Segregated Flow (SFM), QGut, and Traditional (TM) Models
5. Equations for Prediction of Route-Dependent Intestinal Removal
6. Is the SFM the Better Intestinal Flow Model Compared to the TM?
6.1. Implications on Formation of Intestinal and Liver Metabolites
6.2. Implications of the SFM on Drug–Drug Interactions (DDIs)
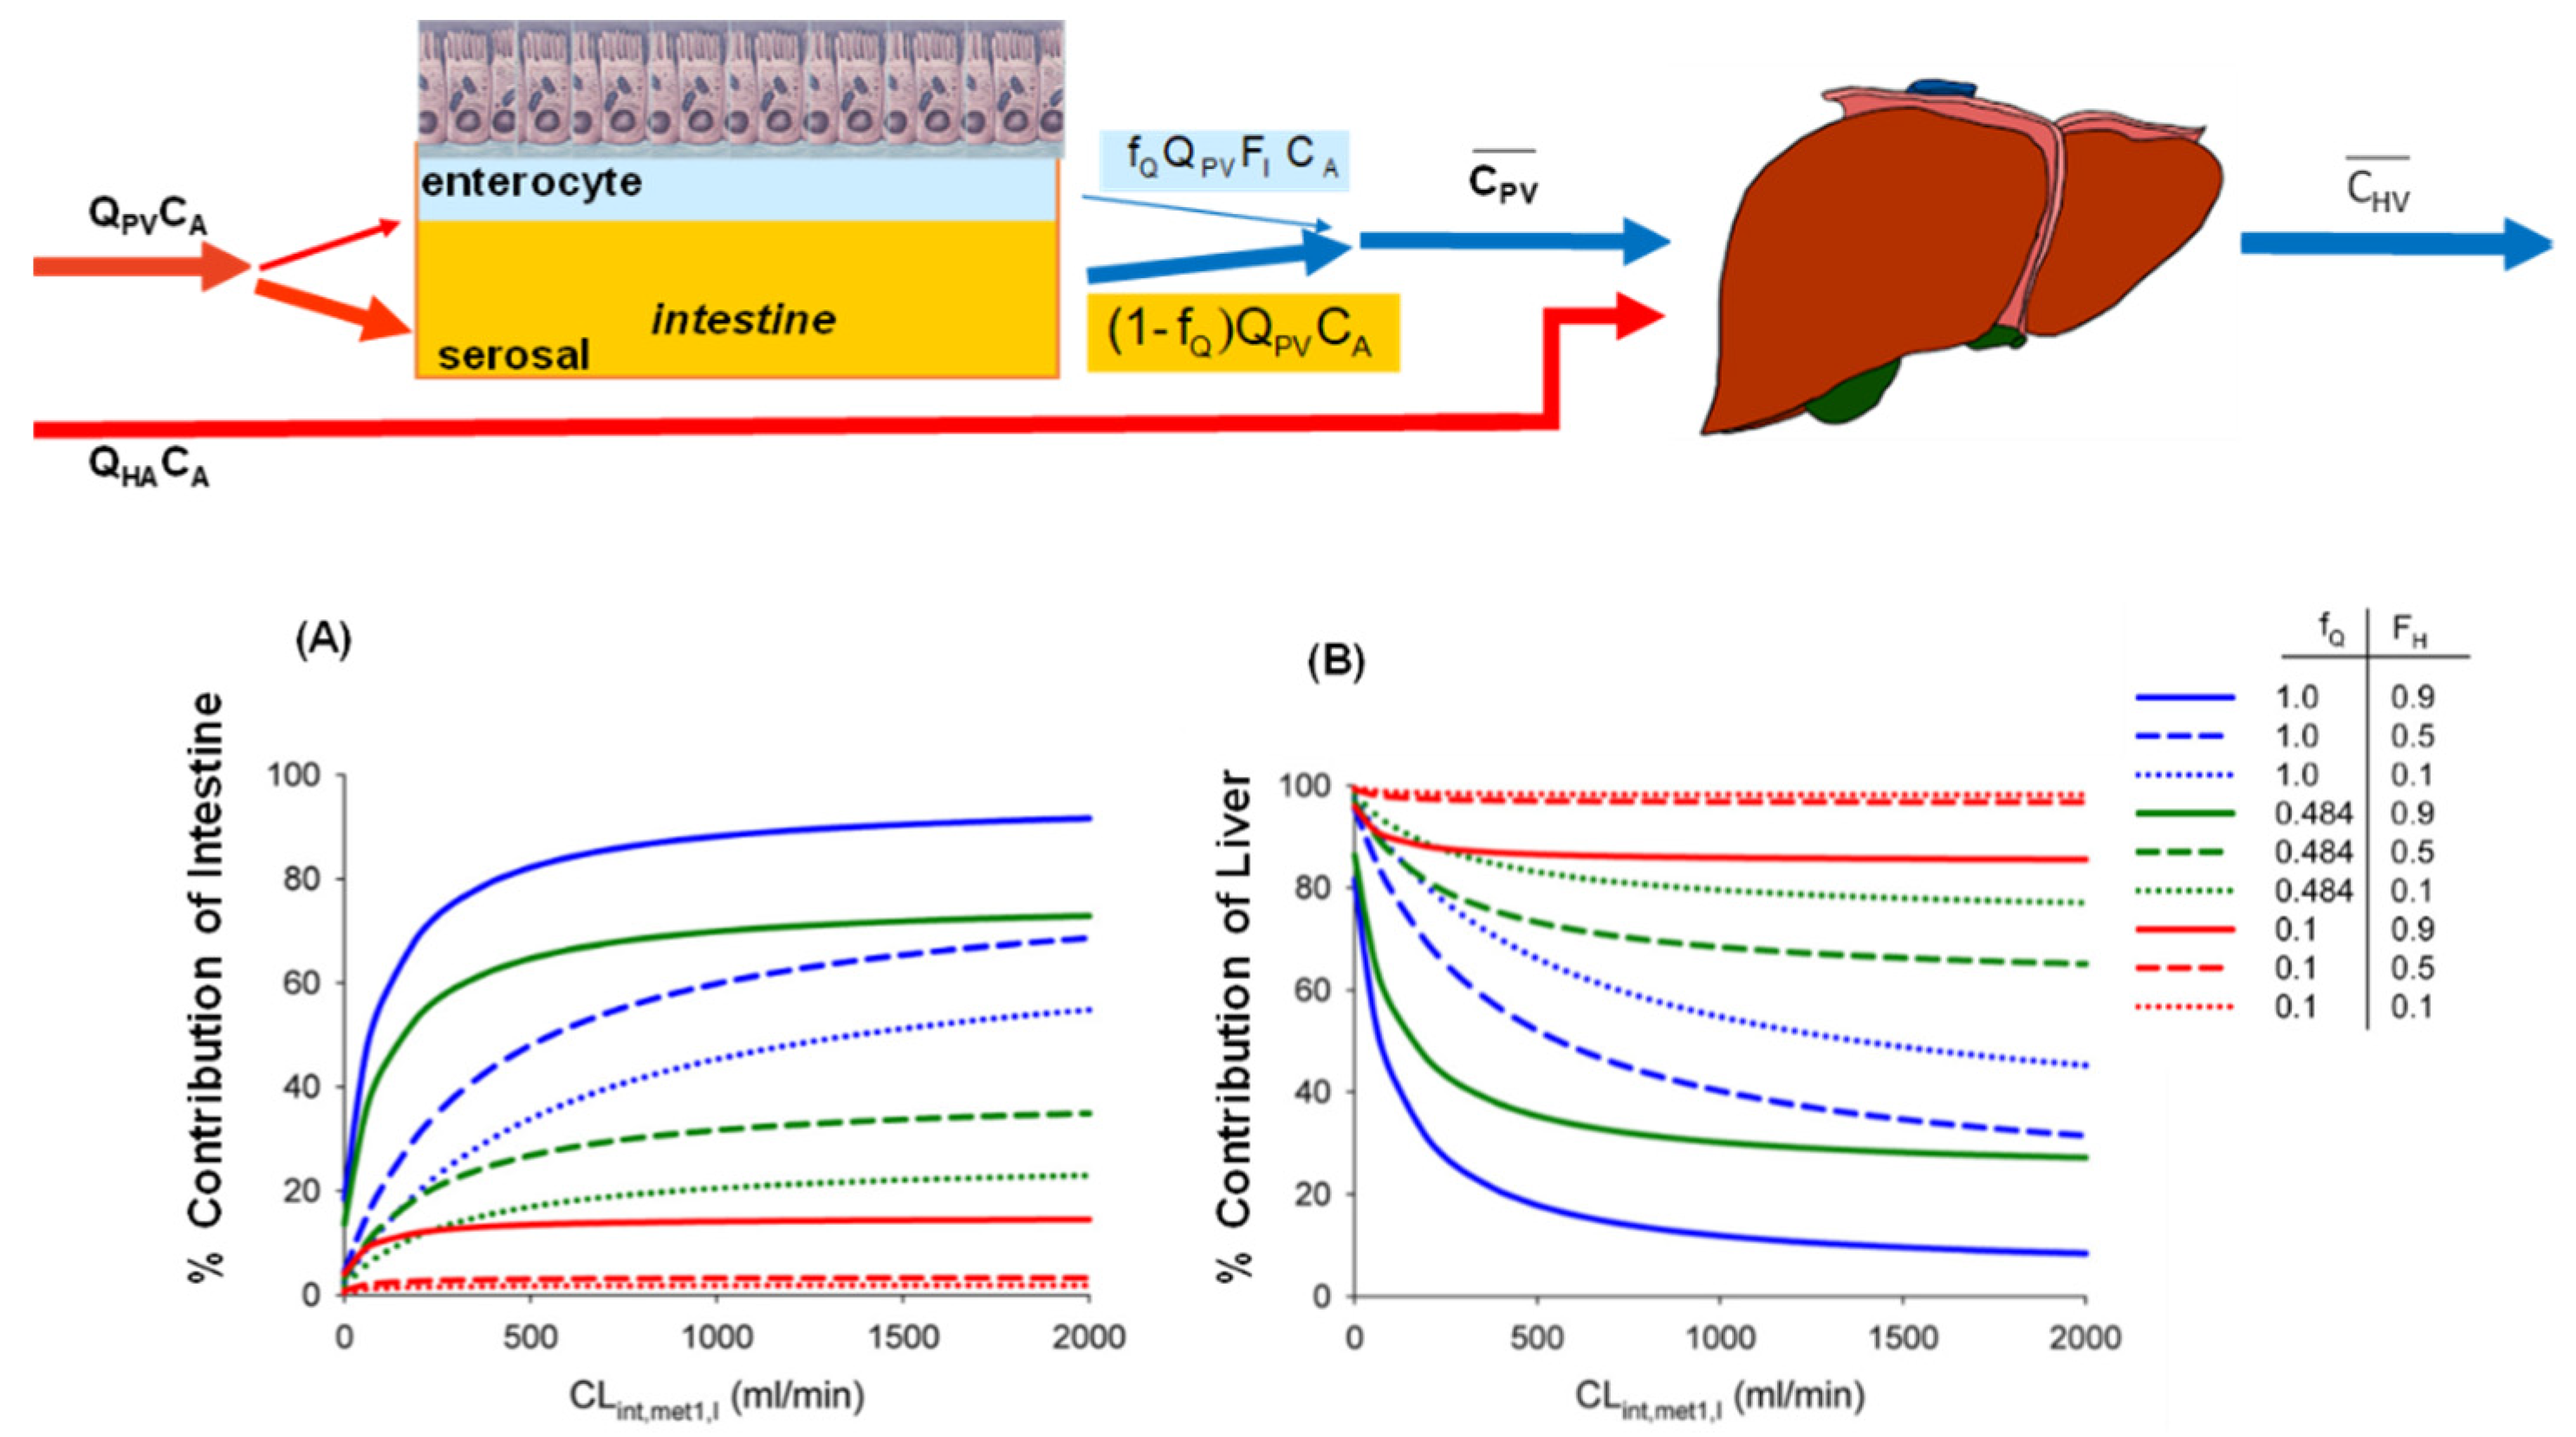
6.3. Changes in Intestinal and Liver Metabolism with Respect to Flow to Intestine and Liver
6.4. Implications of the SFM on IVIVE
7. Other Intestinal Models
8. Conclusions
Funding
Acknowledgments
Conflicts of Interest
References
- Yu, L.X.; Lipka, E.; Crison, J.R.; Amidon, G.L. Transport approaches to the biopharmaceutical design of oral drug delivery systems: Prediction of intestinal absorption. Adv. Drug Deliv. Rev. 1996, 19, 359–376. [Google Scholar] [CrossRef]
- Yu, L.X.; Amidon, G.L. A compartmental absorption and transit model for estimating oral drug absorption. Int. J. Pharm. 1999, 186, 119–125. [Google Scholar] [CrossRef]
- Dressman, J.B.; Thelen, K.; Jantratid, E. Towards quantitative prediction of oral drug absorption. Clin. Pharmacokinet. 2008, 47, 655–667. [Google Scholar] [CrossRef] [PubMed]
- Willmann, S.; Schmitt, W.; Keldenich, J.; Dressman, J.B. A physiologic model for simulating gastrointestinal flow and drug absorption in rats. Pharm. Res. 2003, 20, 1766–1771. [Google Scholar] [CrossRef]
- Willmann, S.; Edginton, A.N.; Dressman, J.B. Development and validation of a physiology-based model for the prediction of oral absorption in monkeys. Pharm. Res. 2007, 24, 1275–1282. [Google Scholar] [CrossRef]
- Dahan, A.; West, B.T.; Amidon, G.L. Segmental-dependent membrane permeability along the intestine following oral drug administration: Evaluation of a triple single-pass intestinal perfusion (TSPIP) approach in the rat. Eur. J. Pharm. Sci. 2009, 36, 320–329. [Google Scholar] [CrossRef]
- Dahan, A.; Amidon, G.L. Segmental dependent transport of low permeability compounds along the small intestine due to P-glycoprotein: The role of efflux transport in the oral absorption of bcs class iii drugs. Mol. Pharm. 2009, 6, 19–28. [Google Scholar] [CrossRef]
- Dahan, A.; Miller, J.M.; Hilfinger, J.M.; Yamashita, S.; Yu, L.X.; Lennernäs, H.; Amidon, G.L. High-permeability criterion for BCS classification: Segmental/pH dependent permeability considerations. Mol. Pharm. 2010, 7, 1827–1834. [Google Scholar] [CrossRef]
- Agoram, B.; Woltosz, W.S.; Bolger, M.B. Predicting the impact of physiological and biochemical processes on oral drug bioavailability. Adv. Drug Deliv. Rev. 2001, 50 (Suppl. 1), S41–S67. [Google Scholar] [CrossRef]
- Daga, P.R.; Bolger, M.B.; Haworth, I.S.; Clark, R.D.; Martin, E.J. Physiologically based pharmacokinetic modeling in lead optimization. 1. Evaluation and adaptation of GastroPlus to predict bioavailability of medchem series. Mol. Pharm. 2018, 15, 821–830. [Google Scholar] [CrossRef]
- Hens, B.; Bolger, M.B. Application of a dynamic fluid and pH model to simulate intraluminal and systemic concentrations of a weak base in GastroPlusTM. J. Pharm. Sci. 2019, 108, 305–315. [Google Scholar] [CrossRef] [Green Version]
- Tsuji, A.; Tamai, I. Carrier-mediated intestinal transport of drugs. Pharm. Res. 1996, 13, 963–977. [Google Scholar] [CrossRef] [PubMed]
- Adibi, S.A. The oligopeptide transporter (PEPT-1) in human intestine: Biology and function. Gastroenterology 1997, 113, 332–340. [Google Scholar] [CrossRef]
- Zhang, L.; Brett, C.M.; Giacomini, K.M. Role of organic cation transporters in drug absorption and elimination. Ann. Rev. Pharmacol. Toxicol. 1998, 38, 431–460. [Google Scholar] [CrossRef]
- Brandsch, M.; Knutter, I.; Leibach, F.H. The intestinal H+/peptide symporter PEPT1: Structure-affinity relationships. Eur. J. Pharm. Sci. 2004, 21, 53–60. [Google Scholar] [CrossRef]
- Terada, T.; Inui, K. Peptide transporters: Structure, function, regulation and application for drug delivery. Curr. Drug Metab. 2004, 5, 85–94. [Google Scholar] [CrossRef] [PubMed]
- Muller, J.; Keiser, M.; Drozdzik, M.; Oswald, S. Expression, regulation and function of intestinal drug transporters: An update. Biol. Chem. 2017, 398, 175–192. [Google Scholar] [CrossRef] [PubMed]
- Noh, K.; Pang, K.S. Theoretical consideration of the properties of intestinal flow models on route-dependent drug removal: Segregated flow (SFM) vs. traditional (TM). Biopharm. Drug Dispos. 2019, 40, 195–213. [Google Scholar] [CrossRef] [PubMed]
- Englund, G.; Rorsman, F.; Ronnblom, A.; Karlbom, U.; Lazorova, L.; Grasjo, J.; Kindmark, A.; Artursson, P. Regional levels of drug transporters along the human intestinal tract: Co-expression of ABC and SLC transporters and comparison with Caco-2 cells. Eur. J. Pharm. Sci. 2006, 29, 269–277. [Google Scholar] [CrossRef]
- Greiner, B.; Eichelbaum, M.; Fritz, P.; Kreichgauer, H.P.; Von Richter, O.; Zundler, J.; Kroemer, H.K. The role of intestinal P-glycoprotein in the interaction of digoxin and rifampin. J. Clin. Investig. 1999, 104, 147–153. [Google Scholar] [CrossRef] [Green Version]
- Dawson, P.A.; Hubbert, M.; Haywood, J.; Craddock, A.L.; Zerangue, N.; Christian, W.V.; Ballatori, N. The heteromeric organic solute transporter alpha-beta, Ostα-Ostβ, is an ileal basolateral bile acid transporter. J. Biol. Chem. 2005, 280, 6960–6968. [Google Scholar] [CrossRef] [PubMed] [Green Version]
- Abbott, N.J.; Khan, E.U.; Rollinson, C.M.; Reichel, A.; Janigro, D.; Dombrowski, S.M.; Dobbie, M.S.; Begley, D.J. Drug resistance in epilepsy: The role of the blood-brain barrier. Novartis Found. Symp. 2002, 243, 38–47. [Google Scholar] [PubMed]
- Fromm, M.F.; Kim, R.B.; Stein, C.M.; Wilkinson, G.R.; Roden, D.M. Inhibition of p-glycoprotein-mediated drug transport: A unifying mechanism to explain the interaction between digoxin and quinidine. Circulation 1999, 99, 552–557. [Google Scholar] [CrossRef] [PubMed] [Green Version]
- Lin, J.H.; Chiba, M.; Chen, I.W.; Nishime, J.A.; DeLuna, F.A.; Yamazaki, M.; Lin, Y.J. Effect of dexamethasone on the intestinal first-pass metabolism of indinavir in rats: Evidence of cytochrome P-450 A and P-glycoprotein induction. Drug Metab. Dispos. 1999, 27, 1187–1193. [Google Scholar]
- Bruyère, A.; Decleves, X.; Bouzom, F.; Ball, K.; Marques, C.; Treton, X.; Pocard, M.; Valleur, P.; Bouhnik, Y.; Panis, Y.; et al. Effect of variations in the amounts of P-glycoprotein (ABCB1), BCRP (ABCG2) and CYP3A4 along the human small intestine on PBPK models for predicting intestinal first pass. Mol. Pharm. 2010, 7, 1596–1607. [Google Scholar] [CrossRef]
- Liu, S.; Tam, D.; Chen, X.; Pang, K.S. P-glycoprotein and an unstirred water layer barring digoxin absorption in the vascularly perfused rat small intestine preparation: Induction studies with pregnenolone-16alpha-carbonitrile. Drug Metab. Dispos. 2006, 34, 1468–1479. [Google Scholar] [CrossRef] [Green Version]
- Helander, H.F.; Fandriks, L. Surface area of the digestive tract—Revisited. Scand. J. Gastroenterol. 2014, 49, 681–689. [Google Scholar] [CrossRef]
- Badhan, R.; Penny, J.; Galetin, A.; Houston, J.B. Methodology for development of a physiological model incorporating CYP3A and P-glycoprotein for the prediction of intestinal drug absorption. J. Pharm. Sci. 2009, 98, 2180–2197. [Google Scholar] [CrossRef]
- Fisher, M.B.; Paine, M.F.; Strelevitz, T.J.; Wrighton, S.A. The role of hepatic and extrahepatic UDP-glucuronosyltransferases in human drug metabolism. Drug Metab. Rev. 2001, 33, 273–297. [Google Scholar] [CrossRef]
- Mizuma, T. Intestinal glucuronidation metabolism may have a greater impact on oral bioavailability than hepatic glucuronidation metabolism in humans: A study with raloxifene, substrate for UGT1A1, 1A8, 1A9, and 1A10. Int. J. Pharm. 2009, 378, 140–141. [Google Scholar] [CrossRef]
- Paine, M.F.; Hart, H.L.; Ludington, S.S.; Haining, R.L.; Rettie, A.E.; Zeldin, D.C. The human intestinal cytochrome P-450 “pie”. Drug Metab. Dispos. 2006, 34, 880–886. [Google Scholar] [CrossRef] [PubMed]
- Radominska-Pandya, A.; Little, J.M.; Pandya, J.T.; Tephly, T.R.; King, C.D.; Barone, G.W.; Raufman, J.P. UDP-glucuronosyltransferases in human intestinal mucosa. Biochim. Biophys. Acta 1998, 1394, 199–208. [Google Scholar] [CrossRef]
- Barter, Z.E.; Bayliss, M.K.; Beaune, P.H.; Boobis, A.R.; Carlile, D.J.; Edwards, R.J.; Houston, J.B.; Lake, B.G.; Lipscomb, J.C.; Pelkonen, O.R.; et al. Scaling factors for the extrapolation of in vivo metabolic drug clearance from in vitro data: Reaching a consensus on values of human microsomal protein and hepatocellularity per gram of liver. Curr. Drug Metab. 2007, 8, 33–45. [Google Scholar] [CrossRef]
- Ito, K.; Houston, J.B. Prediction of human drug clearance from in vitro and preclinical data using physiologically based and empirical approaches. Pharm. Res. 2005, 22, 103–112. [Google Scholar] [CrossRef]
- Shin, H.C.; Kim, H.R.; Cho, H.J.; Yi, H.; Cho, S.M.; Lee, D.G.; Abd El-Aty, A.M.; Kim, J.S.; Sun, D.; Amidon, G.L. Comparative gene expression of intestinal metabolizing enzymes. Biopharm. Drug Dispos. 2009, 30, 411–421. [Google Scholar] [CrossRef] [PubMed] [Green Version]
- Bullingham, R.E.; Nicholls, A.J.; Kamm, B.R. Clinical pharmacokinetics of mycophenolate mofetil. Clin. Pharmacokinet. 1998, 34, 429–455. [Google Scholar] [CrossRef]
- Inoue, H.; Yuki, G.; Yokota, H.; Kato, S. Bisphenol a glucuronidation and absorption in rat intestine. Drug Metab. Dispos. 2003, 31, 140–144. [Google Scholar] [CrossRef] [Green Version]
- Iwamoto, K.; Klaassen, C.D. First-pass effect of nalorphine in rats. J. Pharmcol. Exp. Ther. 1977, 203, 365–376. [Google Scholar]
- Kosaka, K.; Sakai, N.; Endo, Y.; Fukuhara, Y.; Tsuda-Tsukimoto, M.; Ohtsuka, T.; Kino, I.; Tanimoto, T.; Takeba, N.; Takahashi, M.; et al. Impact of intestinal glucuronidation on the pharmacokinetics of raloxifene. Drug Metab. Dispos. 2011, 39, 1495–1502. [Google Scholar] [CrossRef] [Green Version]
- Tukey, R.H.; Strassburg, C.P. Genetic multiplicity of the human UDP-glucuronosyltransferases and regulation in the gastrointestinal tract. Mol. Pharmacol. 2001, 59, 405–414. [Google Scholar] [CrossRef] [Green Version]
- Kemp, D.C.; Fan, P.W.; Stevens, J.C. Characterization of raloxifene glucuronidation in vitro: Contribution of intestinal metabolism to presystemic clearance. Drug Metab. Dispos. 2002, 30, 694–700. [Google Scholar] [CrossRef] [PubMed] [Green Version]
- Thummel, K.E.; O’Shea, D.; Paine, M.F.; Shen, D.D.; Kunze, K.L.; Perkins, J.D.; Wilkinson, G.R. Oral first-pass elimination of midazolam involves both gastrointestinal and hepatic CYP3A-mediated metabolism. Clin. Pharmacol. Ther. 1996, 59, 491–502. [Google Scholar] [CrossRef]
- De Waziers, I.; Cugnenc, P.H.; Yang, C.S.; Leroux, J.P.; Beaune, P.H. Cytochrome P 450 isoenzymes, epoxide hydrolase and glutathione transferases in rat and human hepatic and extrahepatic tissues. J. Pharmacol. Exp. Ther. 1990, 253, 387–394. [Google Scholar] [PubMed]
- Ozer, N.; Erdemli, O.; Sayek, I.; Ozer, I. Resolution and kinetic characterization of glutathione S-transferases from human jejunal mucosa. Biochem. Med. Metab. Biol. 1990, 44, 142–150. [Google Scholar] [CrossRef]
- Maiti, S.; Chen, G. Ethanol up-regulates phenol sulfotransferase (Sult1a1) and hydroxysteroid sulfotransferase (Sult2a1) in rat liver and intestine. Arch. Physiol. Biochem. 2015, 121, 68–74. [Google Scholar] [CrossRef]
- Gibaldi, M.; Boyes, R.N.; Feldman, S. Influence of first-pass effect on availability of drugs on oral administration. J. Pharm. Sci. 1971, 60, 1338–1340. [Google Scholar] [CrossRef]
- Chen, J.; Pang, K.S. Effect of flow on first-pass metabolism of drugs: Single pass studies on 4-methylumbelliferone conjugation in the serially perfused rat intestine and liver preparations. J. Pharmcol. Exp. Ther. 1997, 280, 24–31. [Google Scholar]
- Hirayama, H.; Pang, K.S. First-pass metabolism of gentisamide: Influence of intestinal metabolism on hepatic formation of conjugates. Studies in the once-through vascularly perfused rat intestine-liver preparation. Drug Metab. Dispos. 1990, 18, 580–587. [Google Scholar]
- Pang, K.S.; Chow, E.C.Y. Commentary: Theoretical predictions of flow effects on intestinal and systemic availability in physiologically based pharmacokinetic intestine models: The traditional model, segregated flow model, and QGut model. Drug Metab. Dispos. 2012, 40, 1869–1877. [Google Scholar] [CrossRef] [Green Version]
- Pang, K.S.; Mulder, G.J. The effect of hepatic blood flow on formation of metabolites. Drug Metab. Dispos. 1990, 18, 270–275. [Google Scholar]
- Pang, K.S.; Han, Y.R.; Noh, K.; Lee, P.I.; Rowland, M. Hepatic clearance concepts and misconceptions: Why the well-stirred model is still used even though it is not physiologic reality? Biochem. Pharmacol. 2019, 169, 113596. [Google Scholar] [CrossRef]
- Pang, K.S.; Rowland, M. Hepatic clearance of drugs. I. Theoretical considerations of a “well-stirred” model and a “parallel tube” model. Influence of hepatic blood flow, plasma and blood cell binding, and the hepatocellular enzymatic activity on hepatic drug clearance. J. Pharmacokinet. Biopharm. 1977, 5, 625–653. [Google Scholar] [CrossRef]
- Roberts, M.S.; Rowland, M. A dispersion model of hepatic elimination: 1. Formulation of the model and bolus considerations J. Pharmacokinet. Biopharm. 1986, 14, 227–260. [Google Scholar] [CrossRef] [PubMed]
- Chapron, B.; Risler, L.; Phillips, B.; Collins, C.; Thummel, K.; Shen, D. Reversible, time-dependent inhibition of CYP3A-mediated metabolism of midazolam and tacrolimus by telaprevir in human liver microsomes. J. Pharm. Pharm. Sci. 2015, 18, 101–111. [Google Scholar] [CrossRef] [PubMed] [Green Version]
- Guo, H.; Liu, C.; Li, J.; Zhang, M.; Hu, M.; Xu, P.; Liu, L.; Liu, X. A mechanistic physiologically based pharmacokinetic-enzyme turnover model involving both intestine and liver to predict CYP3A induction-mediated drug-drug interactions. J. Pharm. Sci. 2013, 102, 2819–2836. [Google Scholar] [CrossRef] [PubMed]
- Shirasaka, Y.; Chang, S.Y.; Grubb, M.F.; Peng, C.C.; Thummel, K.E.; Isoherranen, N.; Rodrigues, A.D. Effect of CYP3A5 expression on the inhibition of CYP3A-catalyzed drug metabolism: Impact on modeling cyp3a-mediated drug-drug interactions. Drug Metab. Dispos. 2013, 41, 1566–1574. [Google Scholar] [CrossRef] [Green Version]
- Tsunoda, S.M.; Velez, R.L.; Von Moltke, L.L.; Greenblatt, D.J. Differentiation of intestinal and hepatic cytochrome P450 3A activity with use of midazolam as an in vivo probe: Effect of ketoconazole. Clin. Pharmacol. Ther. 1999, 66, 461–471. [Google Scholar] [CrossRef]
- Wang, J.S.; Wen, X.; Backman, J.T.; Taavitsainen, P.; Neuvonen, P.J.; Kivisto, K.T. Midazolam alpha-hydroxylation by human liver microsomes in vitro: Inhibition by calcium channel blockers, itraconazole and ketoconazole. Pharmacol. Toxicol. 1999, 85, 157–161. [Google Scholar] [CrossRef]
- Paine, M.F.; Shen, D.D.; Kunze, K.L.; Perkins, J.D.; Marsh, C.L.; McVicar, J.P.; Barr, D.M.; Gillies, B.S.; Thummel, K.E. First-pass metabolism of midazolam by the human intestine. Clin. Pharmacol. Ther. 1996, 60, 14–24. [Google Scholar] [CrossRef]
- Lown, K.S.; Thummel, K.E.; Benedict, P.E.; Shen, D.D.; Turgeon, D.K.; Berent, S.; Watkins, P.B. The erythromycin breath test predicts the clearance of midazolam. Clin. Pharmacol. Ther. 1995, 57, 16–24. [Google Scholar] [CrossRef]
- Doherty, M.M.; Pang, K.S. Route-dependent metabolism of morphine in the vascularly perfused rat small intestine preparation. Pharm. Res. 2000, 17, 291–298. [Google Scholar] [CrossRef] [PubMed]
- Pang, K.S.; Cherry, W.F.; Ulm, E.H. Disposition of enalapril in the perfused rat intestine-liver preparation: Absorption, metabolism and first-pass effect. J. Pharmacol. Exp. Ther. 1985, 233, 788–795. [Google Scholar] [PubMed]
- Pang, K.S.; Yuen, V.; Fayz, S.; Te Koppele, J.M.; Mulder, G.J. Absorption and metabolism of acetaminophen by the in situ perfused rat small intestine preparation. Drug Metab. Dispos. 1986, 14, 102–111. [Google Scholar]
- Wen, Y.; Remmel, R.P.; Zimmerman, C.L. First-pass disposition of (-)-6-aminocarbovir in rats. I. Prodrug activation may be limited by access to enzyme. Drug Metab. Dispos. 1999, 27, 113–121. [Google Scholar]
- Sahali-Sahly, Y.; Balani, S.K.; Lin, J.H.; Baillie, T.A. In vitro studies on the metabolic activation of the furanopyridine l-754,394, a highly potent and selective mechanism-based inhibitor of cytochrome P450 3A4. Chem. Res. Toxicol. 1996, 9, 1007–1012. [Google Scholar] [CrossRef] [PubMed]
- Ducharme, M.P.; Warbasse, L.H.; Edwards, D.J. Disposition of intravenous and oral cyclosporine after administration with grapefruit juice. Clin. Pharmacol. Ther. 1995, 57, 485–491. [Google Scholar] [CrossRef]
- Darbar, D.; Fromm, M.F.; Dell’Orto, S.; Kim, R.B.; Kroemer, H.K.; Eichelbaum, M.; Roden, D.M. Modulation by dietary salt of verapamil disposition in humans. Circulation 1998, 98, 2702–2708. [Google Scholar] [CrossRef] [Green Version]
- Talseth, T. Studies on hydralazine. III. Bioavailability of hydralazine in man. Eur. J. Clin. Pharmacol. 1976, 10, 395–401. [Google Scholar] [CrossRef] [PubMed]
- Till, A.E.; Constanzer, M.L.; Demetriades, J.; Irvin, J.D.; Lee, R.B.; Ferguson, R.K. Evidence for route dependent biotransformation of cyclobenzaprine hydrochloride. Biopharm. Drug Dispos. 1982, 3, 19–28. [Google Scholar] [CrossRef]
- Paine, M.F.; Khalighi, M.; Fisher, J.M.; Shen, D.D.; Kunze, K.L.; Marsh, C.L.; Perkins, J.D.; Thummel, K.E. Characterization of interintestinal and intraintestinal variations in human CYP3A-dependent metabolism. J. Pharmacol. Exp. Ther. 1997, 283, 1552–1562. [Google Scholar]
- Kwan, K.C.; Foltz, E.L.; Breault, G.O.; Baer, J.E.; Totaro, J.A. Pharmacokinetics of methyldopa in man. J. Pharmacol. Exp. Ther. 1976, 198, 264–277. [Google Scholar] [PubMed]
- Darbar, D.; Dell’Orto, S.; Morike, K.; Wilkinson, G.R.; Roden, D.M. Dietary salt increases first-pass elimination of oral quinidine. Clin. Pharmacol. Ther. 1997, 61, 292–300. [Google Scholar] [CrossRef]
- Mano, Y.; Sugiyama, Y.; Ito, K. Use of a physiologically based pharmacokinetic model for quantitative prediction of drug-drug interactions via CYP3A4 and estimation of the intestinal availability of CYP3A4 substrates. J. Pharm. Sci. 2015, 104, 3183–3193. [Google Scholar] [CrossRef] [PubMed] [Green Version]
- Marzolini, C.; Rajoli, R.; Battegay, M.; Elzi, L.; Back, D.; Siccardi, M. Physiologically based pharmacokinetic modeling to predict drug-drug interactions with efavirenz involving simultaneous inducing and inhibitory effects on cytochromes. Clin. Pharmacokinet. 2017, 56, 409–420. [Google Scholar] [CrossRef]
- Quinney, S.K.; Galinsky, R.E.; Jiyamapa-Serna, V.A.; Chen, Y.; Hamman, M.A.; Hall, S.D.; Kimura, R.E. Hydroxyitraconazole, formed during intestinal first-pass metabolism of itraconazole, controls the time course of hepatic CYP3A inhibition and the bioavailability of itraconazole in rats. Drug Metab. Dispos. 2008, 36, 1097–1101. [Google Scholar] [CrossRef] [Green Version]
- Yang, Q.J.; Fan, J.; Chen, S.; Liu, L.; Sun, H.; Pang, K.S. Metabolite kinetics: The segregated flow model for intestinal and whole body physiologically based pharmacokinetic modeling to describe intestinal and hepatic glucuronidation of morphine in rats in vivo. Drug Metab. Dispos. 2016, 44, 1123–1138. [Google Scholar] [CrossRef] [Green Version]
- Noh, K.; Chen, S.; Yang, Q.J.; Pang, K.S. Physiologically based pharmacokinetic modeling revealed minimal codeine intestinal metabolism in first-pass removal in rats. Biopharm. Drug Dispos. 2017, 38, 50–74. [Google Scholar] [CrossRef]
- Zhang, X.; Quinney, S.K.; Gorski, J.C.; Jones, D.R.; Hall, S.D. Semiphysiologically based pharmacokinetic models for the inhibition of midazolam clearance by diltiazem and its major metabolite. Drug Metab. Dispos. 2009, 37, 1587–1597. [Google Scholar] [CrossRef] [Green Version]
- Klippert, P.J.M.; Noordhoek, J. Influence of administration route and blood sampling site on the area under the curve. Assessment of gut wall, liver, and lung metabolism from a physiological model. Drug Metab. Dispos. 1983, 11, 62–66. [Google Scholar]
- Cong, D.; Doherty, M.; Pang, K.S. A new physiologically based, segregated-flow model to explain route-dependent intestinal metabolism. Drug Metab. Dispos. 2000, 28, 224–235. [Google Scholar]
- Gertz, M.; Harrison, A.; Houston, J.B.; Galetin, A. Prediction of human intestinal first-pass metabolism of 25 CYP3A substrates from in vitro clearance and permeability data. Drug Metab. Dispos. 2010, 38, 1147–1158. [Google Scholar] [CrossRef] [PubMed]
- Gertz, M.; Houston, J.B.; Galetin, A. Physiologically based pharmacokinetic modeling of intestinal first-pass metabolism of CYP3A substrates with high intestinal extraction. Drug Metab. Dispos. 2011, 39, 1633–1642. [Google Scholar] [CrossRef] [PubMed] [Green Version]
- Yang, J.; Jamei, M.; Yeo, K.R.; Tucker, G.T.; Rostami-Hodjegan, A. Prediction of intestinal first-pass drug metabolism. Curr. Drug Metab. 2007, 8, 676–684. [Google Scholar] [CrossRef] [PubMed]
- Sun, H.; Pang, K.S. Physiological modeling to understand the impact of enzymes and transporters on drug and metabolite data and bioavailability estimates. Pharm. Res. 2010, 27, 1237–1254. [Google Scholar] [CrossRef]
- Svanvik, J. Mucosal blood circulation and its influence on passive absorption in the small intestine. An experimental study in the cat. Acta Physiol. Scand. Suppl. 1973, 385, 1–44. [Google Scholar]
- Granger, D.N.; Richardson, P.D.; Kvietys, P.R.; Mortillaro, N.A. Intestinal blood flow. Gastroenterology 1980, 78, 837–863. [Google Scholar] [CrossRef]
- Yang, Q.J.; Bukuroshi, P.; Quach, H.P.; Chow, E.C.Y.; Pang, K.S. Highlighting vitamin D receptor-targeted activities of 1α,25-dihydroxyvitamin D3 in mice via physiologically based pharmacokinetic-pharmacodynamic modeling. Drug Metab. Dispos. 2018, 46, 75–87. [Google Scholar] [CrossRef] [Green Version]
- Cong, D.; Fong, A.K.; Lee, R.; Pang, K.S. Absorption of benzoic acid in segmental regions of the vascularly perfused rat small intestine preparation. Drug Metab. Dispos. 2001, 29, 1539–1547. [Google Scholar]
- Chow, E.C.; Durk, M.R.; Cummins, C.L.; Pang, K.S. 1α,25-Dihydroxyvitamin D3 upregulates P-glycoprotein activities via the vitamin D receptor and not farnesoid X receptor in both fxr(-/-) and fxr(+/+) mice, and increased renal and brain efflux of digoxin in mice in vivo. J. Pharmacol. Exp. Ther. 2011, 337, 846–859. [Google Scholar] [CrossRef] [Green Version]
- Ogasawara, A.; Utoh, M.; Nii, K.; Ueda, A.; Yoshikawa, T.; Kume, T.; Fukuzaki, K. Effect of oral ketoconazole on oral and intravenous pharmacokinetics of simvastatin and its acid in cynomolgus monkeys. Drug Metab. Dispos. 2009, 37, 122–128. [Google Scholar] [CrossRef]
- Eeckhoudt, S.L.; Horsmans, Y.; Verbeeck, R.K. Differential induction of midazolam metabolism in the small intestine and liver by oral and intravenous dexamethasone pretreatment in rat. Xenobiotica 2002, 32, 975–984. [Google Scholar] [CrossRef]
- Song, X.; Ju, Y.; Zhao, H.; Qiu, W. Effect of purple grape juice on the pharmacokinetics of digoxin: Results of a food-drug interaction study. Int. J. Clin. Pharmacol. Ther. 2019, 57, 101–109. [Google Scholar] [CrossRef] [PubMed]
- Westphal, K.; Weinbrenner, A.; Zschiesche, M.; Franke, G.; Knoke, M.; Oertel, R.; Fritz, P.; Von Richter, O.; Warzok, R.; Hachenberg, T.; et al. Induction of P-glycoprotein by rifampin increases intestinal secretion of talinolol in human beings: A new type of drug/drug interaction. Clin. Pharmacol. Ther. 2000, 68, 345–355. [Google Scholar] [CrossRef] [PubMed]
- Hebert, M.F.; Fisher, R.M.; Marsh, C.L.; Dressler, D.; Bekersky, I. Effects of rifampin on tacrolimus pharmacokinetics in healthy volunteers. J. Clin. Pharmacol. 1999, 39, 91–96. [Google Scholar] [CrossRef] [PubMed]
- Boni, J.; Leister, C.; Burns, J.; Cincotta, M.; Hug, B.; Moore, L. Pharmacokinetic profile of temsirolimus with concomitant administration of cytochrome P450-inducing medications. J. Clin. Pharmacol. 2007, 47, 1430–1439. [Google Scholar] [CrossRef] [PubMed]
- Dong, J.; Yu, X.; Wang, L.; Sun, Y.B.; Chen, X.J.; Wang, G.J. Effects of cyclosporin a and itraconazole on the pharmacokinetics of atorvastatin in rats. Acta Pharmacol. Sin. 2008, 29, 1247–1252. [Google Scholar] [CrossRef] [Green Version]
- Amioka, K.; Kuzuya, T.; Kushihara, H.; Ejiri, M.; Nitta, A.; Nabeshima, T. Carvedilol increases ciclosporin bioavailability by inhibiting P-glycoprotein-mediated transport. J. Pharm. Pharmacol. 2007, 59, 1383–1387. [Google Scholar] [CrossRef]
- Gomez, D.Y.; Wacher, V.J.; Tomlanovich, S.J.; Hebert, M.F.; Benet, L.Z. The effects of ketoconazole on the intestinal metabolism and bioavailability of cyclosporine. Clin. Pharmacol. Ther. 1995, 58, 15–19. [Google Scholar] [CrossRef]
- Lundahl, J.; Regardh, C.G.; Edgar, B.; Johnsson, G. Effects of grapefruit juice ingestion—Pharmacokinetics and haemodynamics of intravenously and orally administered felodipine in healthy men. Eur. J. Clin. Pharmacol. 1997, 52, 139–145. [Google Scholar] [CrossRef]
- Yang, S.H.; Cho, Y.A.; Choi, J.S. Effects of ticlopidine on pharmacokinetics of losartan and its main metabolite exp-3174 in rats. Acta Pharmacol. Sin. 2011, 32, 967–972. [Google Scholar] [CrossRef]
- Gorski, J.C.; Jones, D.R.; Haehner-Daniels, B.D.; Hamman, M.A.; O’Mara, E.M., Jr.; Hall, S.D. The contribution of intestinal and hepatic CYP3A to the interaction between midazolam and clarithromycin. Clin. Pharmacol. Ther. 1998, 64, 133–143. [Google Scholar] [CrossRef]
- Kupferschmidt, H.H.; Ha, H.R.; Ziegler, W.H.; Meier, P.J.; Krahenbuhl, S. Interaction between grapefruit juice and midazolam in humans. Clin. Pharmacol. Ther. 1995, 58, 20–28. [Google Scholar] [CrossRef]
- Olkkola, K.T.; Ahonen, J.; Neuvonen, P.J. The effects of the systemic antimycotics, itraconazole and fluconazole, on the pharmacokinetics and pharmacodynamics of intravenous and oral midazolam. Anesth. Anal. 1996, 82, 511–516. [Google Scholar]
- Olkkola, K.T.; Aranko, K.; Luurila, H.; Hiller, A.; Saarnivaara, L.; Himberg, J.J.; Neuvonen, P.J. A potentially hazardous interaction between erythromycin and midazolam. Clin. Pharmacol. Ther. 1993, 53, 298–305. [Google Scholar] [CrossRef] [PubMed]
- Palkama, V.J.; Ahonen, J.; Neuvonen, P.J.; Olkkola, K.T. Effect of saquinavir on the pharmacokinetics and pharmacodynamics of oral and intravenous midazolam. Clin. Pharmacol. Ther. 1999, 66, 33–39. [Google Scholar] [CrossRef]
- Saari, T.I.; Laine, K.; Leino, K.; Valtonen, M.; Neuvonen, P.J.; Olkkola, K.T. Effect of voriconazole on the pharmacokinetics and pharmacodynamics of intravenous and oral midazolam. Clin. Pharmacol. Ther. 2006, 79, 362–370. [Google Scholar] [CrossRef]
- Choi, J.S.; Choi, J.S.; Choi, D.H. Effects of licochalcone a on the bioavailability and pharmacokinetics of nifedipine in rats: Possible role of intestinal CYP3A4 and P-gp inhibition by licochalcone a. Biopharm. Drug Dispos. 2014, 35, 382–390. [Google Scholar] [CrossRef]
- Rashid, T.J.; Martin, U.; Clarke, H.; Waller, D.G.; Renwick, A.G.; George, C.F. Factors affecting the absolute bioavailability of nifedipine. Br. J. Clin. Pharmacol. 1995, 40, 51–58. [Google Scholar] [CrossRef] [Green Version]
- Kupferschmidt, H.H.; Fattinger, K.E.; Ha, H.R.; Follath, F.; Krahenbuhl, S. Grapefruit juice enhances the bioavailability of the hiv protease inhibitor saquinavir in man. Br. J. Clin. Pharmacol. 1998, 45, 355–359. [Google Scholar] [CrossRef]
- Floren, L.C.; Bekersky, I.; Benet, L.Z.; Mekki, Q.; Dressler, D.; Lee, J.W.; Roberts, J.P.; Hebert, M.F. Tacrolimus oral bioavailability doubles with coadministration of ketoconazole. Clin. Pharmacol. Ther. 1997, 62, 41–49. [Google Scholar] [CrossRef]
- Harwood, M.D.; Neuhoff, S.; Carlson, G.L.; Warhurst, G.; Rostami-Hodjegan, A. Absolute abundance and function of intestinal drug transporters: A prerequisite for fully mechanistic in vitro-in vivo extrapolation of oral drug absorption. Biopharm. Drug Dispos. 2013, 34, 2–28. [Google Scholar] [CrossRef]
- Kadono, K.; Akabane, T.; Tabata, K.; Gato, K.; Terashita, S.; Teramura, T. Quantitative prediction of intestinal metabolism in humans from a simplified intestinal availability model and empirical scaling factor. Drug Metab. Dispos. 2010, 38, 1230–1237. [Google Scholar] [CrossRef] [PubMed]
- Glaeser, H.; Drescher, S.; Van der Kuip, H.; Behrens, C.; Geick, A.; Burk, O.; Dent, J.; Somogyi, A.; Von Richter, O.; Griese, E.U.; et al. Shed human enterocytes as a tool for the study of expression and function of intestinal drug-metabolizing enzymes and transporters. Clin. Pharmacol. Ther. 2002, 71, 131–140. [Google Scholar] [CrossRef] [PubMed]
- Von Richter, O.; Burk, O.; Fromm, M.F.; Thon, K.P.; Eichelbaum, M.; Kivisto, K.T. Cytochrome P450 3A4 and P-glycoprotein expression in human small intestinal enterocytes and hepatocytes: A comparative analysis in paired tissue specimens. Clin. Pharmacol. Ther. 2004, 75, 172–183. [Google Scholar] [CrossRef] [PubMed]
- Nishimuta, H.; Sato, K.; Yabuki, M.; Komuro, S. Prediction of the intestinal first-pass metabolism of CYP3A and UGT substrates in humans from in vitro data. Drug Metab. Pharmacokinet. 2011, 26, 592–601. [Google Scholar] [CrossRef] [Green Version]
- Tam, D.; Tirona, R.G.; Pang, K.S. Segmental intestinal transporters and metabolic enzymes on intestinal drug absorption. Drug Metab. Dispos. 2003, 31, 373–383. [Google Scholar] [CrossRef] [Green Version]
- Watanabe, T.; Maeda, K.; Nakai, C.; Sugiyama, Y. Investigation of the effect of the uneven distribution of CYP3A4 and P-glycoprotein in the intestine on the barrier function against xenobiotics: A simulation study. J. Pharm. Sci. 2013, 102, 3196–3204. [Google Scholar] [CrossRef]
- Cao, X.; Gibbs, S.T.; Fang, L.; Miller, H.A.; Landowski, C.P.; Shin, H.C.; Lennernäs, H.; Zhong, Y.; Amidon, G.L.; Yu, L.X.; et al. Why is it challenging to predict intestinal drug absorption and oral bioavailability in human using rat model. Pharm. Res. 2006, 23, 1675–1686. [Google Scholar] [CrossRef]
- Chen, X.; Chen, F.; Liu, S.; Glaeser, H.; Dawson, P.A.; Hofmann, A.F.; Kim, R.B.; Shneider, B.L.; Pang, K.S. Transactivation of rat apical sodium-dependent bile acid transporter and increased bile acid transport by 1α,25-dihydroxyvitamin D3 via the vitamin d receptor. Mol. Pharmacol. 2006, 69, 1913–1923. [Google Scholar] [CrossRef] [Green Version]
- Mottino, A.D.; Hoffman, T.; Dawson, P.A.; Luquita, M.G.; Monti, J.A.; Sanchez Pozzi, E.J.; Catania, V.A.; Cao, J.; Vore, M. Increased expression of ileal apical sodium-dependent bile acid transporter in postpartum rats. Am. J. Physiol. Gastrointest. Liver Physiol. 2002, 282, G41–G50. [Google Scholar] [CrossRef] [Green Version]
- Ngo, L.Y.; Patil, S.D.; Unadkat, J.D. Ontogenic and longitudinal activity of Na(+)-nucleoside transporters in the human intestine. Am. J. Physiol. Gastrointest. Liver Physiol. 2001, 280, G475–G481. [Google Scholar] [CrossRef] [PubMed]
- Chow, E.C.; Sun, H.; Khan, A.A.; Groothuis, G.M.; Pang, K.S. Effects of 1α,25-dihydroxyvitamin D3 on transporters and enzymes of the rat intestine and kidney in vivo. Biopharm. Drug Dispos. 2010, 31, 91–108. [Google Scholar] [PubMed]
- Liu, B.; Crewe, H.K.; Ozdemir, M.; Rowland Yeo, K.; Tucker, G.; Rostami-Hodjegan, A. The absorption kinetics of ketoconazole plays a major role in explaining the reported variability in the level of interaction with midazolam: Interplay between formulation and inhibition of gut wall and liver metabolism. Biopharm. Drug Dispos. 2017, 38, 260–270. [Google Scholar] [CrossRef] [PubMed]
- Bolger, M.B.; Lukacova, V.; Woltosz, W.S. Simulations of the nonlinear dose dependence for substrates of influx and efflux transporters in the human intestine. AAPS J. 2009, 11, 353–363. [Google Scholar] [CrossRef] [PubMed]
- Jones, H.M.; Chen, Y.; Gibson, C.; Heimbach, T.; Parrott, N.; Peters, S.A.; Snoeys, J.; Upreti, V.V.; Zheng, M.; Hall, S.D. Physiologically based pharmacokinetic modeling in drug discovery and development: A pharmaceutical industry perspective. Clin. Pharmacol. Ther. 2015, 97, 247–262. [Google Scholar] [CrossRef]
- Jamei, M.; Bajot, F.; Neuhoff, S.; Barter, Z.; Yang, Z.; Rostami-Hodjegan, A.; Rowland-Yeo, K. A mechanistic framework for in vitro–in vivo extrapolation of liver membrane transporters: Ppion of drug–drug interaction between rosuvastatin and cyclosporine. Clin. Pharmacokinet. 2014, 53, 73–87. [Google Scholar] [CrossRef] [PubMed] [Green Version]
- Bi, Y.; Deng, J.; Murry, D.J.; An, G. Awhole-body physiologically based pharmacokinetic model of gefitinib in mice and scale-up to humans. AAPS J. 2015, 18. [Google Scholar] [CrossRef] [Green Version]
- Kharasch, E.D.; Walker, A.; Hoffer, C.; Sheffels, P. Intravenous and oral alfentanil as in vivo probes for hepatic and first-pass cytochrome P450 3A activity: Noninvasive assessment by use of pupillary miosis. Clin. Pharmacol. Ther. 2004, 76, 452–466. [Google Scholar] [CrossRef] [PubMed]
- Hebert, M.F.; Roberts, J.P.; Prueksaritanont, T.; Benet, L.Z. Bioavailability of cyclosporine with concomitant rifampin administration is markedly less than predicted by hepatic enzyme induction. Clin. Pharmacol. Ther. 1992, 52, 453–457. [Google Scholar] [CrossRef]
- Mitschke, D.; Reichel, A.; Fricker, G.; Moenning, U. Characterization of cytochrome p450 protein expression along the entire length of the intestine of male and female rats. Drug Metab. Dispos. 2008, 36, 1039–1045. [Google Scholar] [CrossRef] [Green Version]
- Huijghebaert, S.M.; Sim, S.M.; Back, D.J.; Eyssen, H.J. Distribution of estrone sulfatase activity in the intestine of germfree and conventional rats. J. Steroid Biochem. 1984, 20, 1175–1179. [Google Scholar] [CrossRef]
- Pinkus, L.M.; Ketley, J.N.; Jakoby, W.B. The glutathione S-transferases as a possible detoxification system of rat intestinal epithelium. Biochem. Pharmacol. 1977, 26, 2359–2363. [Google Scholar] [CrossRef]
- Koster, A.S.; Frankhuijzen-Sierevogel, A.C.; Noordhoek, J. Glucuronidation of morphine and six beta 2-sympathomimetics in isolated rat intestinal epithelial cells. Drug Metab. Dispos. 1985, 13, 232–238. [Google Scholar] [PubMed]
- Meier, Y.; Eloranta, J.J.; Darimont, J.; Ismair, M.G.; Hiller, C.; Fried, M.; Kullak-Ublick, G.A.; Vavricka, S.R. Regional distribution of solute carrier mRNA expression along the human intestinal tract. Drug Metab. Dispos. 2007, 35, 590–594. [Google Scholar] [CrossRef] [Green Version]
- Mouly, S.; Paine, M.F. P-glycoprotein increases from proximal to distal regions of human small intestine. Pharm. Res. 2003, 20, 1595–1599. [Google Scholar] [CrossRef]
- Haslam, I.S.; Wright, J.A.; O’Reilly, D.A.; Sherlock, D.J.; Coleman, T.; Simmons, N.L. Intestinal ciprofloxacin efflux: The role of breast cancer resistance protein (ABCG2). Drug Metab. Dispos. 2011, 39, 2321–2328. [Google Scholar] [CrossRef] [Green Version]
- Berggren, S.; Gall, C.; Wollnitz, N.; Ekelund, M.; Karlbom, U.; Hoogstraate, J.; Schrenk, D.; Lennernäs, H. Gene and protein expression of P-glycoprotein, MRP1, MRP2, and CYP3A4 in the small and large human intestine. Mol. Pharm. 2007, 4, 252–257. [Google Scholar] [CrossRef]
- Prime-Chapman, H.M.; Fearn, R.A.; Cooper, A.E.; Moore, V.; Hirst, B.H. Differential multidrug resistance-associated protein 1 through 6 isoform expression and function in human intestinal epithelial Caco-2 cells. J. Pharmacol. Exp. Ther. 2004, 311, 476–484. [Google Scholar] [CrossRef]
- Zimmermann, C.; Gutmann, H.; Hruz, P.; Gutzwiller, J.P.; Beglinger, C.; Drewe, J. Mapping of multidrug resistance gene 1 and multidrug resistance-associated protein isoform 1 to 5 mRNA expression along the human intestinal tract. Drug Metab. Dispos. 2005, 33, 219–224. [Google Scholar] [CrossRef] [Green Version]
- Strassburg, C.P.; Kneip, S.; Topp, J.; Obermayer-Straub, P.; Barut, A.; Tukey, R.H.; Manns, M.P. Polymorphic gene regulation and interindividual variation of UDP-glucuronosyltransferase activity in human small intestine. J. Biol. Chem. 2000, 275, 36164–36171. [Google Scholar] [CrossRef] [PubMed] [Green Version]
- Teubner, W.; Meinl, W.; Florian, S.; Kretzschmar, M.; Glatt, H. Identification and localization of soluble sulfotransferases in the human gastrointestinal tract. Biochem. J. 2007, 404, 207–215. [Google Scholar] [CrossRef] [PubMed]
- Khuruna, S.; Corbally, M.T.; Manning, F.; Armenise, T.; Kierce, B.; Kitty, C. Glutathione S-transferase: A potential new marker of intestinal ischemia. J. Pediatr. Surg. 2002, 37, 1543–1548. [Google Scholar] [CrossRef] [PubMed]
- Dahlgren, D.; Lennernäs, H. Intestinal permeability and drug absorption: Predictive experimental, computational and in vivo approaches. Pharmaceutics 2019, 11, 411. [Google Scholar] [CrossRef] [PubMed] [Green Version]
- Dahlgren, D.; Roos, C.; Lundqvist, A.; Abrahamsson, B.; Tannergren, C.; Hellstrom, P.M.; Sjögren, E.; Lennernäs, H. Regional intestinal permeability of three model drugs in human. Mol. Pharm. 2016, 13, 3013–3021. [Google Scholar] [CrossRef] [PubMed]
- Wu, B. Use of physiologically based pharmacokinetic models to evaluate the impact of intestinal glucuronide hydrolysis on the pharmacokinetics of aglycone. J. Pharm. Sci. 2012, 101, 1281–1301. [Google Scholar] [CrossRef] [PubMed]
- Sjögren, E.; Thorn, H.; Tannergren, C. In silico modeling of gastrointestinal drug absorption: Predictive performance of three physiologically based absorption models. Mol. Pharm. 2016, 13, 1763–1778. [Google Scholar] [CrossRef]
- Matsumura, N.; Hayashi, S.; Akiyama, Y.; Ono, A.; Funaki, S.; Tamura, N.; Kimoto, T.; Jiko, M.; Haruna, Y.; Sarashina, A.; et al. Prediction characteristics of oral absorption simulation software evaluated using structurally diverse low-solubility drugs. J. Pharm. Sci. 2019, 109, 1403–1416. [Google Scholar] [CrossRef]
- Kharasch, E.D.; Hoffer, C.; Whittington, D.; Sheffels, P. Role of hepatic and intestinal cytochrome P450 3A and 2B6 in the metabolism, disposition, and miotic effects of methadone. Clin. Pharmacol. Ther. 2004, 76, 250–269. [Google Scholar] [CrossRef]
- Gorski, J.C.; Vannaprasaht, S.; Hamman, M.A.; Ambrosius, W.T.; Bruce, M.A.; Haehner-Daniels, B.; Hall, S.D. The effect of age, sex, and rifampin administration on intestinal and hepatic cytochrome P450 3A activity. Clin. Pharmacol. Ther. 2003, 74, 275–287. [Google Scholar] [CrossRef]
- Holtbecker, N.; Fromm, M.F.; Kroemer, H.K.; Ohnhaus, E.E.; Heidemann, H. The nifedipine-rifampin interaction. Evidence for induction of gut wall metabolism. Drug Metab. Dispos. 1996, 24, 1121–1123. [Google Scholar]


| Compound | System | Enzyme/Metabolite | Examples | References |
|---|---|---|---|---|
| Enalapril | Perfused rat intestine–liver preparation | Esterase/enalaprilat | Enalaprilat formed from enalapril after po administration but not systemic administration | [62] |
| Acetaminophen | Perfused rat small intestine preparation | Ugt1a6/acetaminophen glucuronide | Metabolite observed after intraduodenal but not systemic dosing | [63] |
| (-)-6-aminocarbovir (6AC) | Perfused rat small intestine preparation | Adenosine deaminase activates (-)-carbovir to 6AC | 6AC was highly extracted by intestine after luminal dosing (0.54) compared to reservoir dosing (0.08) | [64] |
| Morphine | Perfused rat small intestine preparation | Ugt2b1/ morphine 3-glucuronide (M3G) | M3G appeared after intraduodenal but not systemic dosing | [61] |
| L-754,394, (furanopyridine derivative) | Rats and dogs in vivo and rat liver perfusion | Cyp3a/ epoxide intermediate | Inhibition of L-754,394 and its metabolites by Cyp3a is much greater for po than iv administration of drug | [65] |
| Cyclosporine | Human in vivo | CYP3A4/AM1 and AM9 | Metabolites: AM1 and AM9 are lower after iv compared to po | [66] |
| Verapamil | Human in vivo | CYP3A4 and 3A5/ norverapamil | Metabolite, norverapamil formation after po > iv | [67] |
| Hydralazine | Human in vivo | Acetyltransferase/ 3-methyl-striazolo-3,4, α-phthalazine (MTP) | More MTP formation observed after oral dosing than iv dosing | [68] |
| Cyclobenzaprine | Human in vivo | UGT/ cyclobenzaprine glucuronide (CBG) | Formation of CBG was greater for the oral than for parenteral case | [69] |
| Midazolam (MDZ) | Human in vivo | CYP3A4/ 1’-OH and 4-OH MDZ | EI after intraduodenal administration >> EI for iv administration | [59,70] |
| Methyldopa | Human in vivo | SULT/ methyldopa sulfate (MS) | Greater formation of MS after po than iv dosing of M | [71] |
| Quinidine | Human in vivo | CYP3A/ 3-hydroxyquinidine | More 3-hydroxyquinidine formed via oral compared to iv route | [72] |
| Drug | Fraction of Intestinal Flow to Enterocytes (fQ) | Experimental Condition | References |
|---|---|---|---|
| Benzoic acid | 0.07 | Rat liver perfusion | [88] |
| Codeine | 0.16 | Rat in vivo | [77] |
| Digoxin | 0.20 | Rat intestinal perfusion | [26] |
| Digoxin | 0.16 | Mouse in vivo | [89] |
| Morphine | 0.10 | Rat in vivo | [76] |
| Morphine | 0.024 | Rat intestinal perfusion | [80] |
| 1,25-Dihydroxyvitamin D3 | 0.11 | Mouse in vivo | [87] |
| Compound | Inducer/Inhibitor (Dosing Route) | Enzyme /Transporter | Outcome | Reference |
|---|---|---|---|---|
| Induction Studies | ||||
| Alfentanil | Rifampicin (po) | CYP | Decrease in AUCpo/AUCiv = 8.2 | [93] |
| Cyclosporin | Rifampicin (po) | CYP | Decrease in AUCpo/AUCiv = 2.6 | [94] |
| Digoxin | Rifampicin (po) | P-gp | Decrease in AUCpo/AUCiv = 1.3 | [20] |
| Indinavir | Dexamethasone (po) | CYP and P-gp | Decrease in AUCpo/AUCiv = 2.3 | [24] |
| Methadone | Rifampicin (po) | CYP | Decrease in AUCpo/AUCiv = 1.4 | [95] |
| Midazolam | Rifampicin (po) | CYP | Decrease in AUCpo/AUCiv = 4.4 | [96] |
| Nifedipine | Rifampicin (po) | CYP | Decrease in AUCpo/AUCiv = 8.5 | [97] |
| Talinolol | Rifampicin (po) | P-gp | Decrease in AUCpo/AUCiv = 1.7 | [98] |
| Tacrolimus | Rifampicin (po) | CYP | Decrease in AUCpo/AUCiv = 2.0 | [99] |
| Temsirolimus | Rifampicin (po) | CYP | Decrease in AUCpo/AUCiv = 1.3 | [100] |
| Inhibition Studies | ||||
| Alfentanil | Grapefruit juice (po) Troleandomycin (po) | CYP | Increase in AUCpo/AUCiv = 1.5–2.6 | [93] |
| Atorvastatin | Itraconazole (iv) | CYP and P-gp | AUCiv +INH /AUCiv,control = 1.3 AUCpo +INH /AUCpo control = 2.2 | [101] |
| Cyclosporine | Carvedilol (po) Grapefruit juice (po) Ketoconazole (po) | CYP | Increase of AUCpo/AUCiv = 1.5–2.8 | [66,102,103] |
| Felodipine | Grapefruit juice (po) | CYP | Increase of AUCpo/AUCiv = 1.9 | [104] |
| Losartan | Ticlopidine (po) | CYP | Increase of AUCpo/AUCiv = 1.2 | [105] |
| Midazolam | Clarithromycin (po) Diltiazem (po) Erythromycin (po) Fluconazole (po) Grapefruit juice (po) Itraconazole (po) Ketoconazole (po) Saquinavir (po) Voriconazole (po) | CYP | Increase of AUCPO/AUCIV = 1.4–3.2 | [57,91,93,106,107,108,109,110,111] |
| Nifedipine | Grapefruit juice (po) licochalcone A (po) | CYP | Increase in AUCpo/AUCiv = 1.2–1.4 | [112,113] |
| Saquanvir | Grapefruit juice (po) | CYP | Increase in AUCpo/AUCiv = 1.7 | [114] |
| Simvastatin | Ketoconazole (po) | CYP | Increase in AUCpo/AUCiv = 5.0 | [90] |
| Tacrolimus | Ketoconazole (po) | CYP | Increase in AUCpo/AUCiv = 1.4 | [115] |
| Transporter/Enzyme | Segmental Distribution | References |
|---|---|---|
| Animals | ||
| Apical sodium-dependent bile acid transporter (Asbt) | highest at ileum duodenum < jejunum < ileum | [130,131] |
| Nucleoside transporters (Cnt) | highest in jejunum | [132] |
| Monocarboxylic acid transporter (Mct1) | duodenum < jejunum > ileum | [88] |
| Organic cation transporter 1 (Oct1) | duodenum < jejunum < ileum | [133] |
| Organic cation transporter 3 (Oct3) | duodenum < jejunum < ileum | [133] |
| Organic anion transporting polypeptide 3 (Oatp3) | highest in jejunum | [133] |
| Oligopeptide transporter 1 (PepT1) | duodenum > jejunum > ileum | [133] |
| Multidrug resistance-associated protein 2 (Mrp2) | duodenum > jejunum > ileum | [133] |
| Multidrug resistance-associated protein 3 (Mrp 3) | duodenum < jejunum < ileum | [133] |
| Multidrug resistance-associated protein 4 (Mrp 4) | duodenum > ileum > jejunum | [88] |
| P-glycoprotein (P-gp) | duodenum < jejunum < ileum | [26] |
| Organic solute transporter α-β (Ostα,β) | duodenum > jejunum > ileum | [21] |
| Cytochrome P450 3A (Cyp3a) | duodenum ~ jejunum > ileum | [134,135] |
| Estrone sulfatase | duodenum > jejunum > ileum | [136] |
| Glutathione S-Transferase (Gst) | duodenum ~ jejunum > ileum | [137] |
| UDP-Glucuronosyltransferase (Ugt) | duodenum ~ jejunum > ileum | [138] |
| Humans | ||
| ASBT | duodenum < ileum | [139] |
| OATP2B1 | duodenum < ileum | [140] |
| PEPT1 | slightly increasing jejunum > ileum > duodenum duodenum ~ ileum | [19,139] |
| MCT1 | slightly decreasing duodenum > ileum | [19] |
| CNT11 CNT2 | even duo > ileum | [138] |
| OCT1 | even | [19] |
| OCTN1 | duodenum < ileum | [138] |
| OCTN2 | even | [19,139] |
| MRP3 | even | [19] |
| P-gp | ileum > jejunum > proximal | [19,25,28,140] |
| BCRP | even jejunum > ileum > duodenum | [19,55,141] |
| MRP2 mRNA MRP1 protein MRP2 protein | slightly decreasing proximal > distal even | [19,142] |
| MRP1 to 5 MRP2 to MRP6 MRP4 | duodenum < jejunum and ileum | [141,143,144] |
| CYP3A4 | proximal > distal | [25,28] |
| UGT1A1 UGT1A3 UGT1A4 UGT1A5 UGT1A6 UGT1A7 UGT1A8 UGT1A9 UGT1A10 UGT2B4 UGT2B7 UGT2B10 UGT2B15 | duodenum ~ jejunum and ileum duodenum < jejunum and ileum duodenum ~ jejunum and ileum duodenum ~ jejunum and ileum duodenum > jejunum and ileum duodenum ~ jejunum and ileum duodenum ~ jejunum and ileum duodenum ~ jejunum and ileum duodenum and jejunum > ileum duodenum and jejunum < ileum duodenum and jejunum < ileum duodenum and jejunum < ileum duodenum < jejunum and ileum | [145] |
| SULT1A1, 1A3, 1B1, 1E1 SULT2A1 | jejunum < ileum jejunum > ileum | [146] |
| GST GST | jejunum > ileum jejunum ~ ileum | [147] |
© 2020 by the authors. Licensee MDPI, Basel, Switzerland. This article is an open access article distributed under the terms and conditions of the Creative Commons Attribution (CC BY) license (http://creativecommons.org/licenses/by/4.0/).
Share and Cite
Pang, K.S.; Peng, H.B.; Noh, K. The Segregated Intestinal Flow Model (SFM) for Drug Absorption and Drug Metabolism: Implications on Intestinal and Liver Metabolism and Drug–Drug Interactions. Pharmaceutics 2020, 12, 312. https://doi.org/10.3390/pharmaceutics12040312
Pang KS, Peng HB, Noh K. The Segregated Intestinal Flow Model (SFM) for Drug Absorption and Drug Metabolism: Implications on Intestinal and Liver Metabolism and Drug–Drug Interactions. Pharmaceutics. 2020; 12(4):312. https://doi.org/10.3390/pharmaceutics12040312
Chicago/Turabian StylePang, K. Sandy, H. Benson Peng, and Keumhan Noh. 2020. "The Segregated Intestinal Flow Model (SFM) for Drug Absorption and Drug Metabolism: Implications on Intestinal and Liver Metabolism and Drug–Drug Interactions" Pharmaceutics 12, no. 4: 312. https://doi.org/10.3390/pharmaceutics12040312