Article

Deep Learning to Predict Deterioration Region of Hot Ductility in High-Mn Steel by Using the Relationship between RA Behavior and Time-Temperature-Precipitation

1
Institute for Materials Research, Tohoku University, Sendai 980-8577, Miyagi, Japan
2
Graduate Institute of Ferrous & Energy Materials Technology, Pohang University of Science and Technology, Pohang 37673, Korea
*
Authors to whom correspondence should be addressed.
Metals 2022, 12(10), 1689; https://doi.org/10.3390/met12101689
Submission received: 4 September 2022 / Revised: 5 October 2022 / Accepted: 7 October 2022 / Published: 10 October 2022
(This article belongs to the Special Issue Continuous Casting and Hot Ductility of Advanced High-Strength Steels)

Abstract

:
Reduction of area (RA) measurement in a hot ductility test is widely used to define the susceptibility of surface crack of cast steel, but the test is complex because it entails processes such as specimen fabrication, heat treatment, tensile testing, and analysis. As an alternative, this study proposes a model that can predict RA. The model exploits the relationship between precipitation and RA behavior, which has a major effect on hot ductility degradation in high-Mn steels. Hot ductility tests were performed using four grades of high-Mn steels that had different V-Mo compositions, and the RA behavior was compared with the precipitation behavior obtained from a time-temperature-precipitation (TTP) graph. The ductility deterioration of high-Mn steels shows a tendency to start at the nose temperature TN at which precipitation is most severe. Using this relationship, we developed a model to predict the hot ductility degradation temperature of high-Mn steels. TN was calculated using J-matpro software (version 12) for 1500 compositions of high-Mn steels containing the precipitating elements V, Mo, Nb, and Ti, and by applying this to a deep neural network (DNN), then using the result to develop a model that can predict TN for various compositions of high-Mn steel. The model was tested by comparing its predicted RA degradation temperature with RAs extracted from reference data for five high-Mn steels. In all five steels, the temperature at which the RA decreases coincided with the value predicted by the DNN model. Use of this model can eliminate the cost and time required for hot ductility testing to measure RA.

1. Introduction

During the conventional continuous casting process, the slab goes through bending and unbending zones. In the unbending zone, the stress accumulated on the slab can cause defects such as surface cracks. To quantify the susceptibility of surface crack of slab, the steel’s hot ductility is measured using tensile tests at high temperatures. The tensile test that applies the thermal condition of continuous casting yields the reduction of area (RA), which is the rate of change in cross-sectional area at each temperature. RA can represent the hot ductility behavior.
Hot ductility can decrease (i.e., RA can decrease) in certain temperature ranges as a consequence of phase transformation that can form ferrite film, and of segregation that can deposit precipitates along austenite grain boundaries [1,2,3,4]. RA measurements to evaluate hot ductility require a complex experimental process that entails specimen fabrication, solution treatment, tensile test, measuring RA, and analyzing the data. However, the process is too slow and costly to be applied to all steel grades, so an alternative method to predict RA would be desirable. Methods to provide this ability have included simple linear regression [5], multiple linear regression [6], back-propagation neural network (NN) [7,8,9,10], deep neural network (DNN) with Gaussian curve [11,12], and Random Forest with N-shaped fitting [13]. Previous studies have mainly focused on alloy steels [5,6,7,8,9,10,11,12] in which the shape of RA trough is generally U or V, but have also been conducted on alloy steels [13] that show RA troughs shaped like N or W. RA prediction models have evolved from simple regression to machine learning and deep learning, so their prediction accuracy is high, and they have excellent adaptability to variation in components and thermal history. In contrast, databases used to predict RA are limited to general carbon steels, so the RA prediction accuracy is low in steels that have high carbon or manganese content.
Research on steels with increased types and amounts of alloying elements is being expanded with the goal of obtaining high-strength steels and has led to increased complexity of high-temperature properties. In particular, high-Mn steels have excellent properties of high strength, high toughness, and formability, but research to derive conditions for defect control during continuous casting is essential due to their complex high-temperature properties. High-Mn steel remains in the austenite phase even at room temperature; the austenite-ferrite phase transformation does not occur, so it is not related to the decrease in RA. The hot ductility behavior in high-Mn steel is most affected by temperature; the resulting dynamic recrystallization and precipitation behavior are important factors in RA degradation [14]. Especially, addition of elements such as Nb, Ti, V, or Mo to improve strength causes carbide or nitride precipitation, which degrades the hot ductility and the surface quality of the steel [3,4,15]. Precipitates form easily along austenite grain boundaries, and micro-voids form around the precipitates when stress is applied at the boundaries. As the applied stress increases, the size of micro-voids also increases, so intergranular sliding and cracks occur easily. Therefore, the ductility is rapidly reduced in the temperature range that favors formation of precipitates.
The behavior of precipitation can be expressed using a time-temperature-precipitation (TTP) diagram. It is a graph that expresses changes in the fraction of precipitates during isothermal transformation as a function of time and temperature and provides kinetic information on the precipitation process. It can be used to identify the ‘nose’ temperature TN at which precipitation is the most severe. The behavior of precipitation has been used to explain the hot ductility of steel, but not many cases have directly connected the RA and TTP diagrams [16,17,18]. These cases indicate that the RA degradation region can be predicted by using the relationship between the TTP diagram and RA for steels in which the precipitation effect is critical to high-temperature properties. However, those studies cited here showed only steels that had very low carbon content, in which the precipitation behavior due to nitride precipitation such as AlN or Cr2N is a main factor. Conversely, high-Mn steel is generally derived from an alloy that has a high carbon base, so carbide precipitates are expected to have a major influence on RA behavior. Therefore, the relationship between the TTP diagram and RA behavior should be identified for high-Mn steels, especially those that contain Nb, Ti, V, and Mo, which are strong carbide-forming elements.
The goal of this study is to predict the RA deterioration region of high-Mn steels that have complex high temperature from the relationship between RA behavior and TTP diagram. To investigate the TTP diagram and RA behavior of high-Mn steel, the hot ductility test was performed on the steel containing the precipitating elements V and Mo. The result of the hot ductility test was compared with the TTP diagram calculated using J-matpro software (version 12, Sente Software Ltd., Guildford, UK). In addition, TN was collected from the TTP diagram of high-Mn steel that contained V, Mo, Nb, and Ti, and a model to predict the TN from the composition of the added precipitation elements was presented. The presented TN model was compared with the RA behavior of high-Mn steels that had various compositions.

2. Materials and Methods

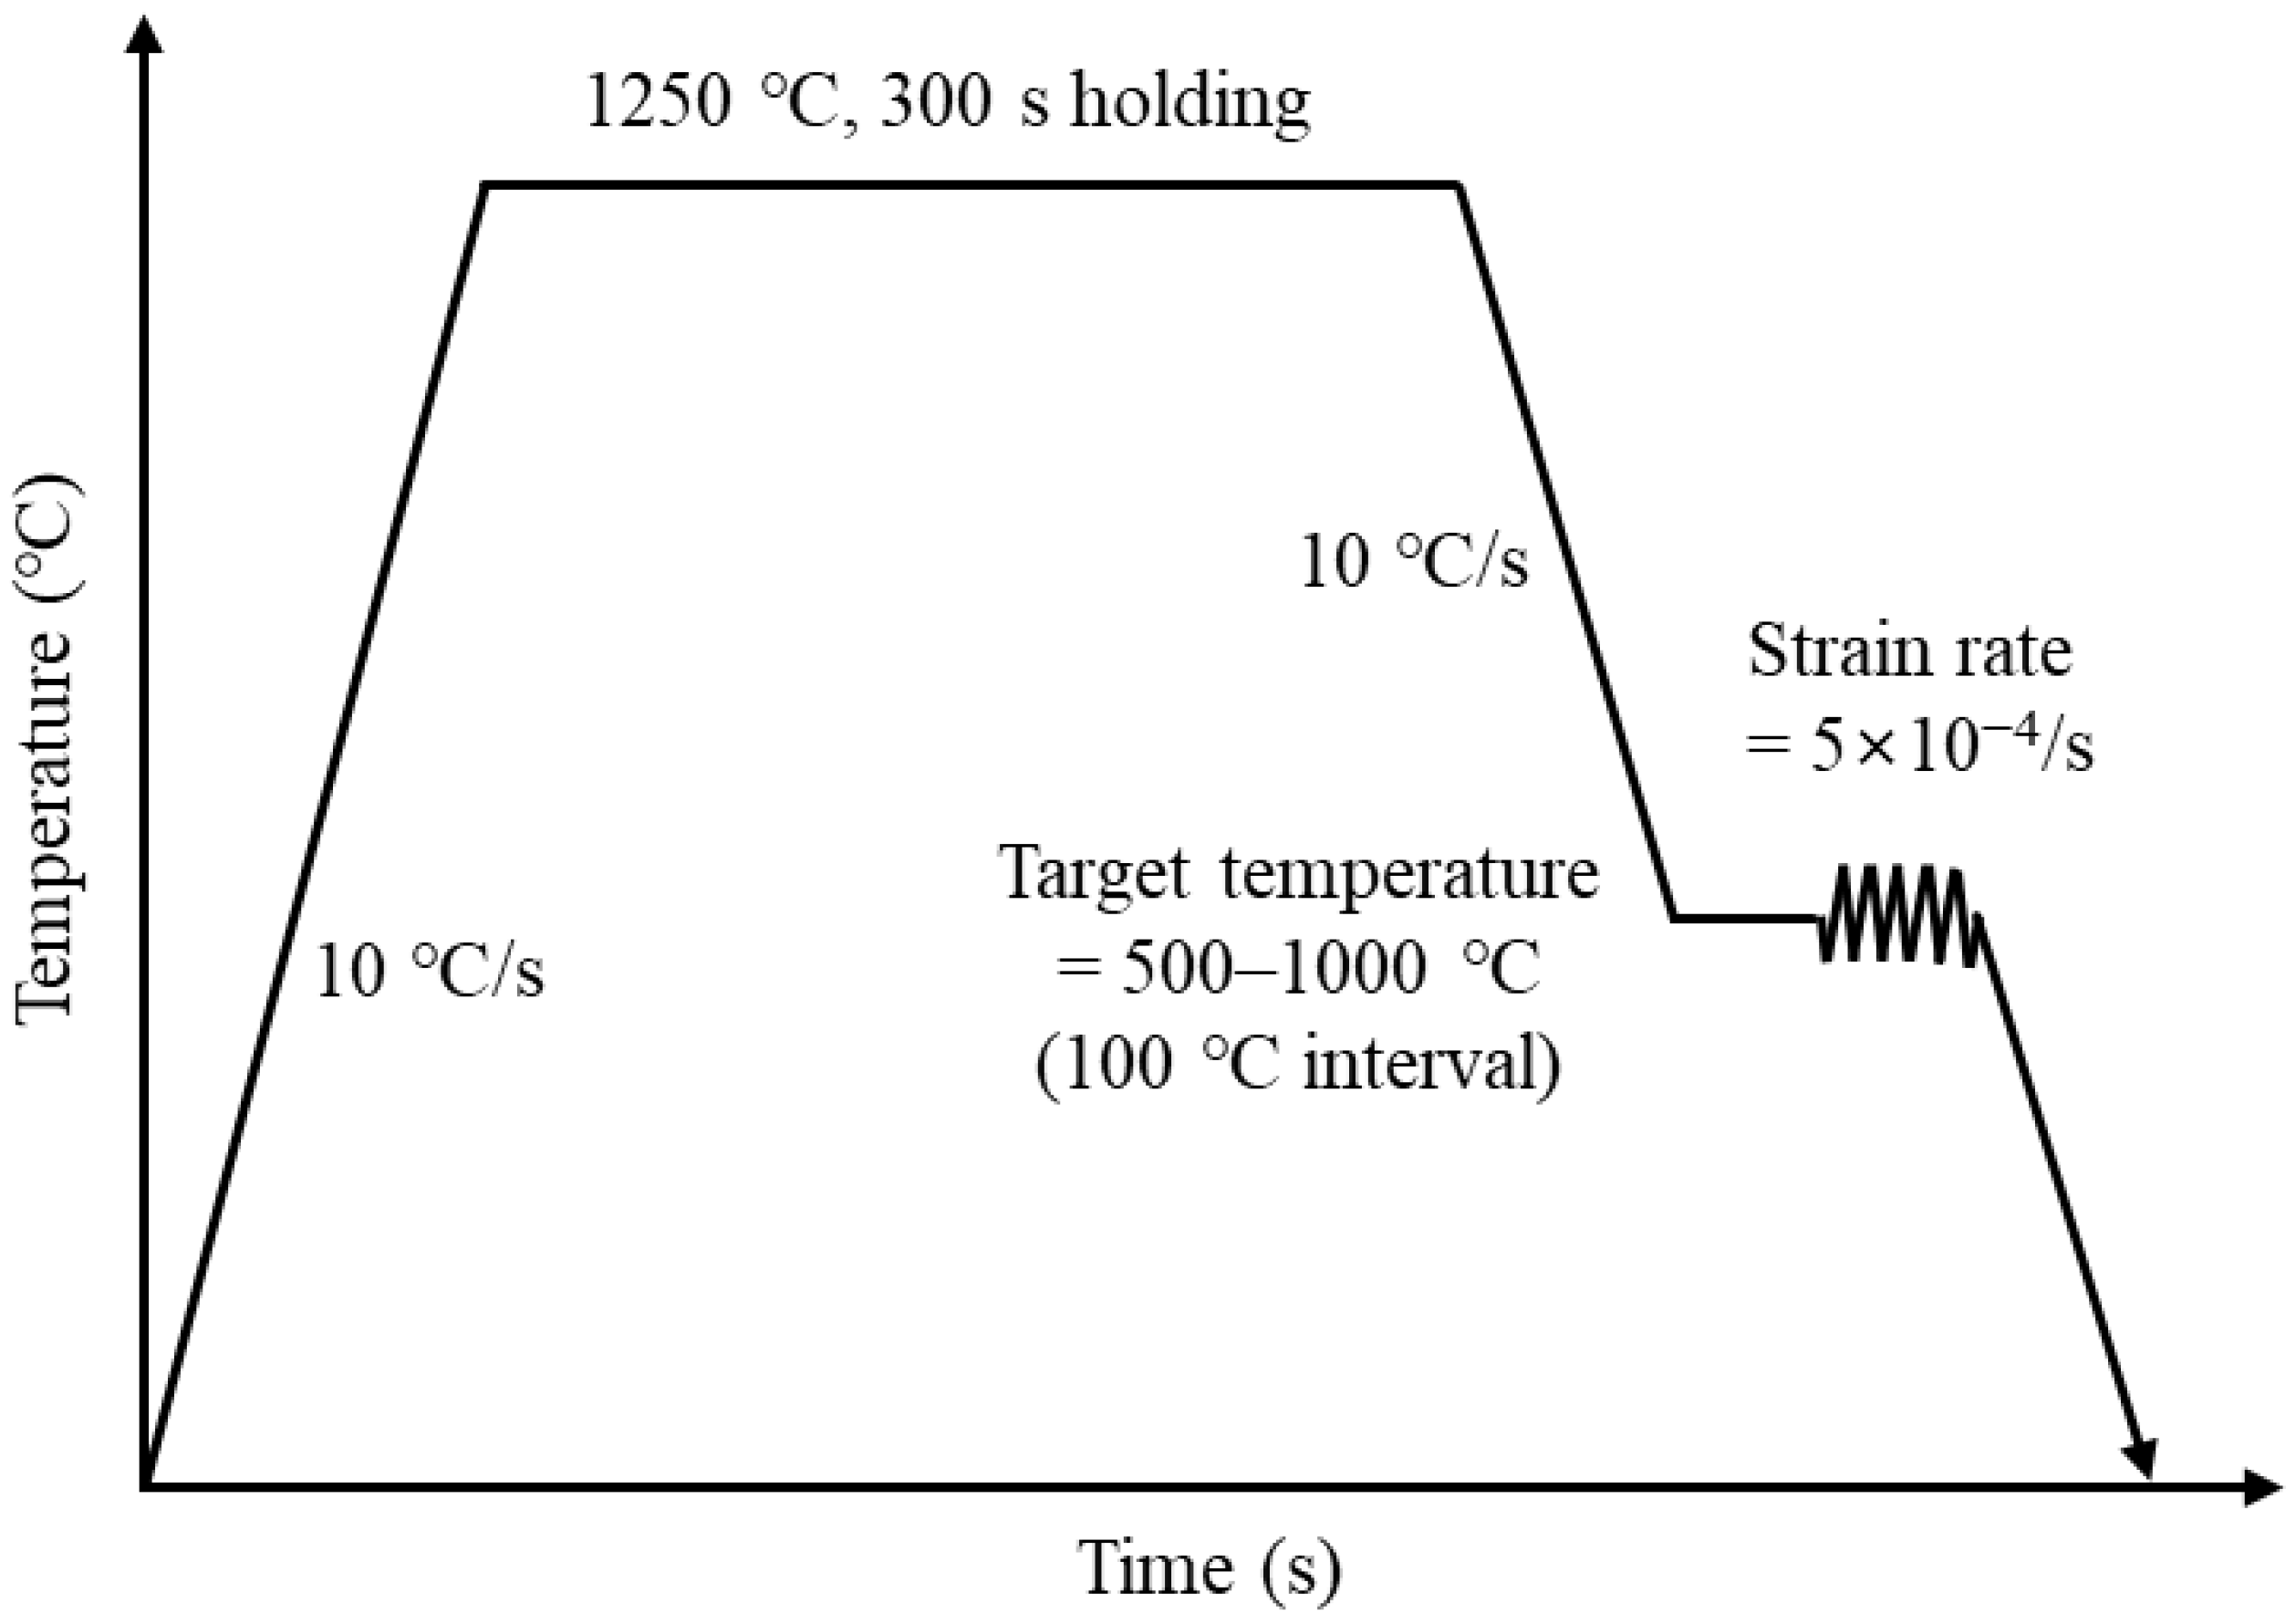
2.1. Hot Ductility Test

The hot ductility test was performed on four high-Mn steels that had different contents of V and Mo (Table 1). A vacuum melting furnace was used to produce 30 kg ingots, then from each, a cylindrical tensile specimen with a length of 90 mm and a diameter of 10 mm was fabricated along the casting direction in the area outside the shrinkage cavity.
Tensile tests were performed using a Caster & Thermo-mechanical simulator (40334, Fuji electronic industrial, Saitama, Japan). The specimen was heated to 1250 °C at 10 °C∙s−1, held for 300 s for solution treatment, then cooled to the target temperature (TT = 600, 700, 800, 900, or 1000 °C) at 10 °C∙s−1. The specimen was held for 60 s at TT to stabilize the temperature, then the tensile test was conducted using strain rate of 5 × 10⁻⁴ s−1 (Figure 1), which is a conventional continuous casting speed (5 × 10⁻³ to 5 × 10⁻⁴ s−1). All tensile tests were performed three times at each TT. Hot ductility was evaluated by RA measured from field emission scanning electron microscope (FE-SEM; JSM-7100F, JEOL Ltd., Tokyo, Japan) images of each fractured specimen after the tensile test. The FE-SEM images were also used to confirm the structure of the fracture surface. The microstructure of a vertical section of the fractured specimen prepared by using cutting machine was observed by electron backscatter diffraction (EBSD; Oxford, UK).

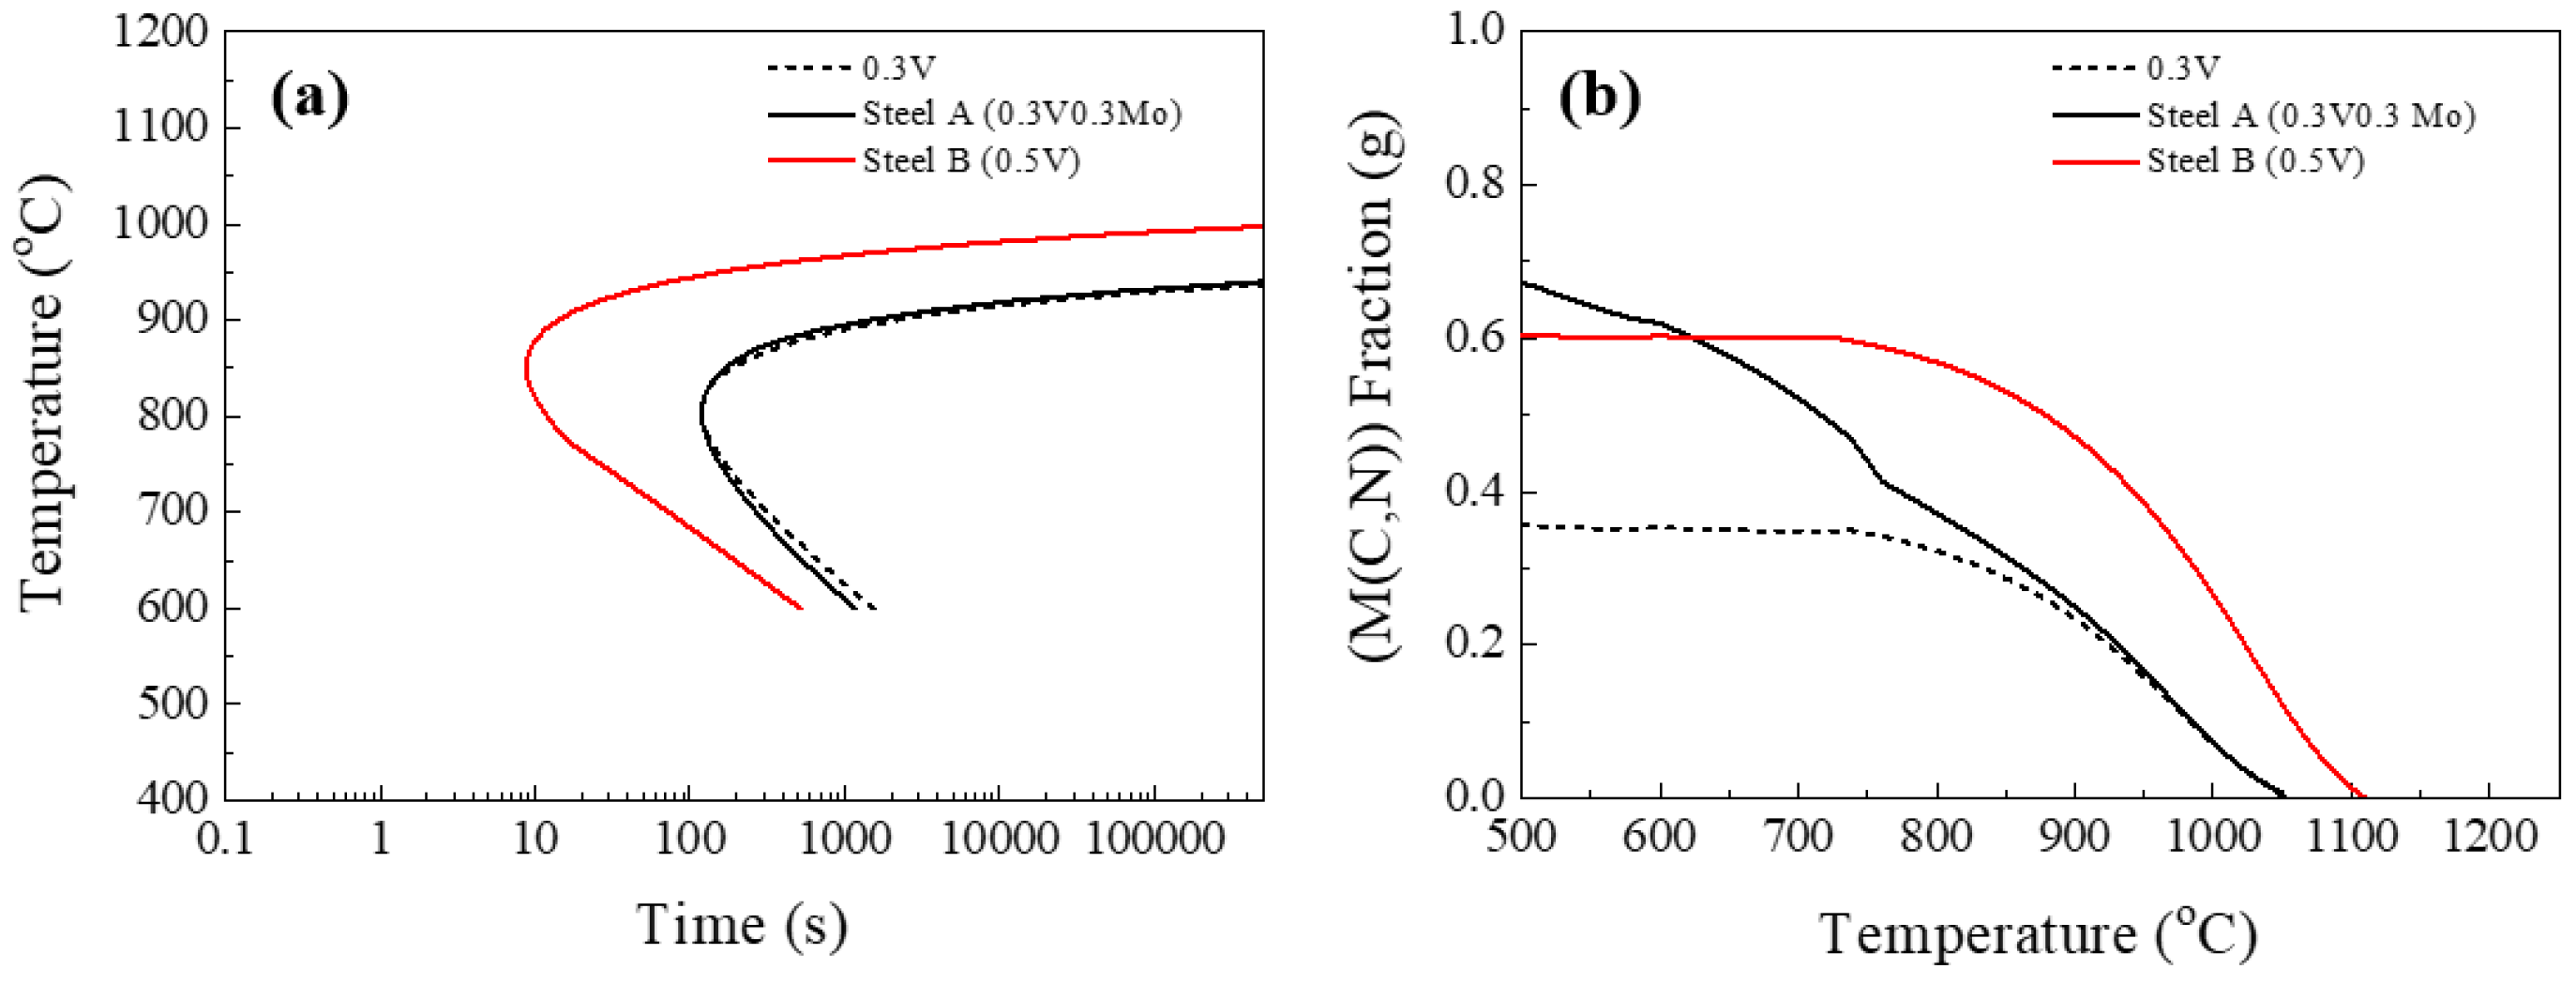
2.2. Calculation of Time-Temperature-Precipitation Diagram

The TTP and the equilibrium precipitation fraction diagram were calculated using J-MatPro software (version 12, Sente Software Ltd., Guildford, UK). The variables used in the calculation were same with the conditions used in the hot ductility test, and the other conditions were set to represent the conditions used in the process of continuous casting. The quenching temperature was set to 1250 °C, which is the solution-treatment temperature in the experiment, and the grain size was set to 1000 μm, which is the size observed in general high-Mn steel. To consider the deformation-induced precipitation behavior, the deformation conditions were used in the calculation. The deformation temperature was set to 850 °C, which is the midrange temperature of conventional bending-unbending region (temperature range: 700 to 1000 °C), and the strain was set to 0.05 considering the maximum total strain during continuous casting process (total strain range: 0.02 to 0.05). The strain rate was set to 5 × 10⁻⁴ s−1, as in the experiment. If variables related to deformation are changed, the time taken for completion of precipitation changes, but it does not significantly affect the TN, so changes to the values of these variable for TN extraction are not constrained. TN that corresponds to matrix M(C, N) precipitation was extracted from the calculated TTP diagram to consider the dynamic precipitates [19].

3. Results

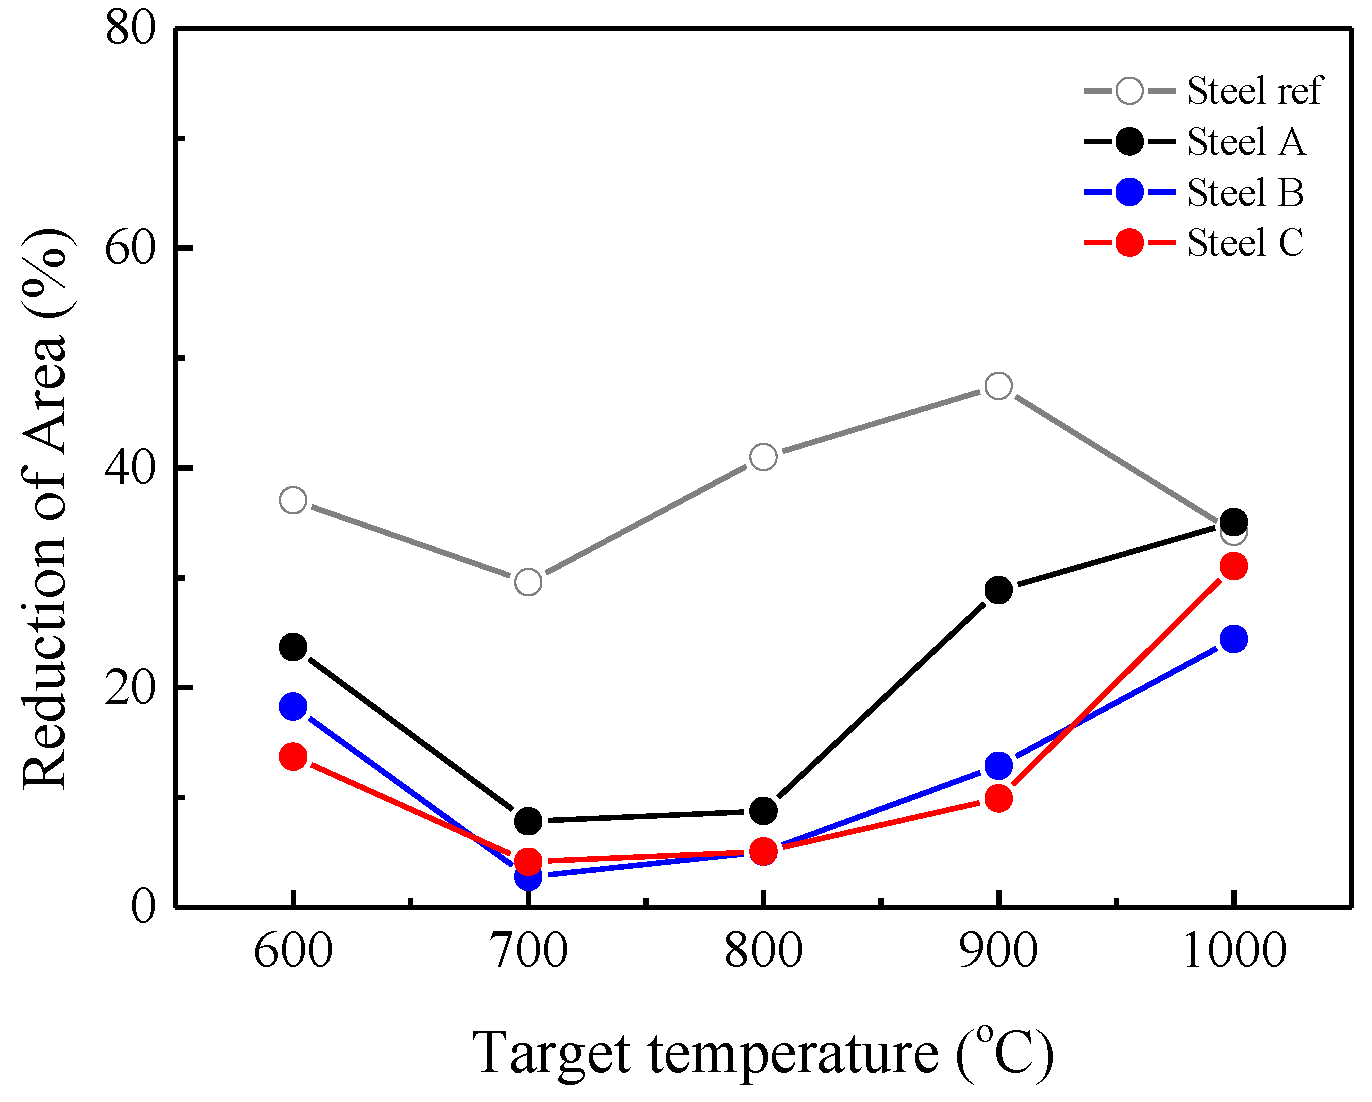
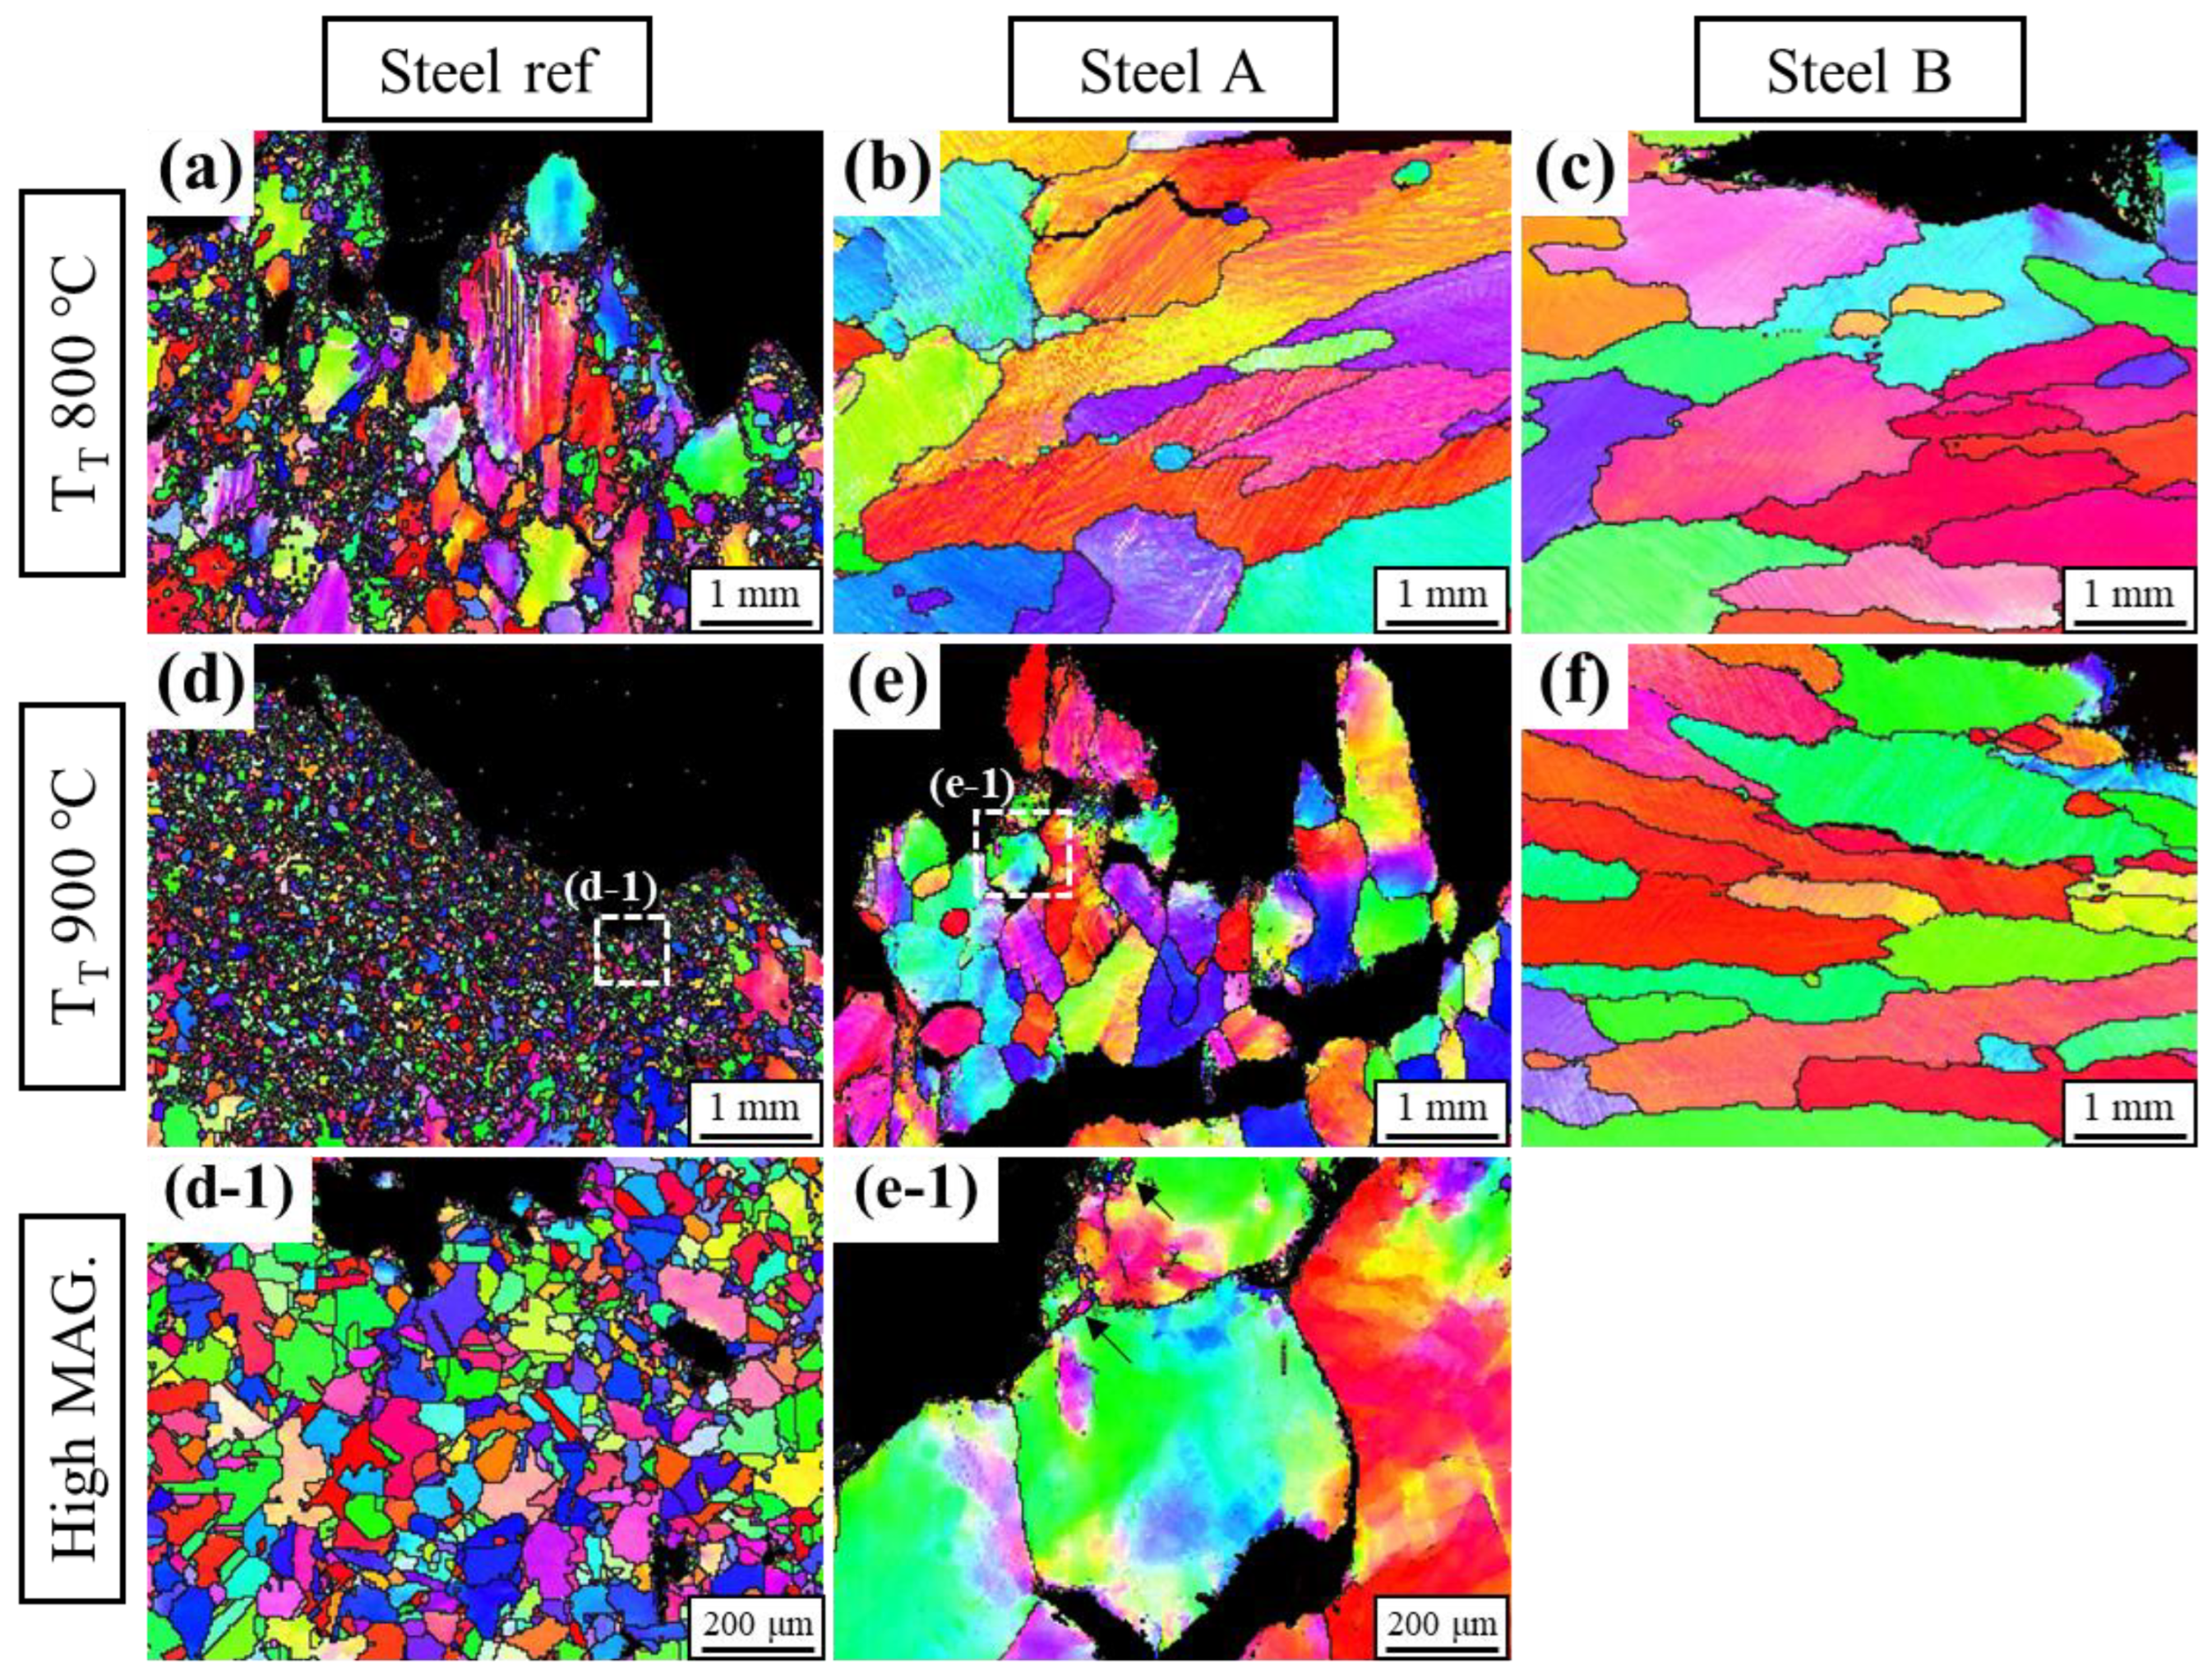
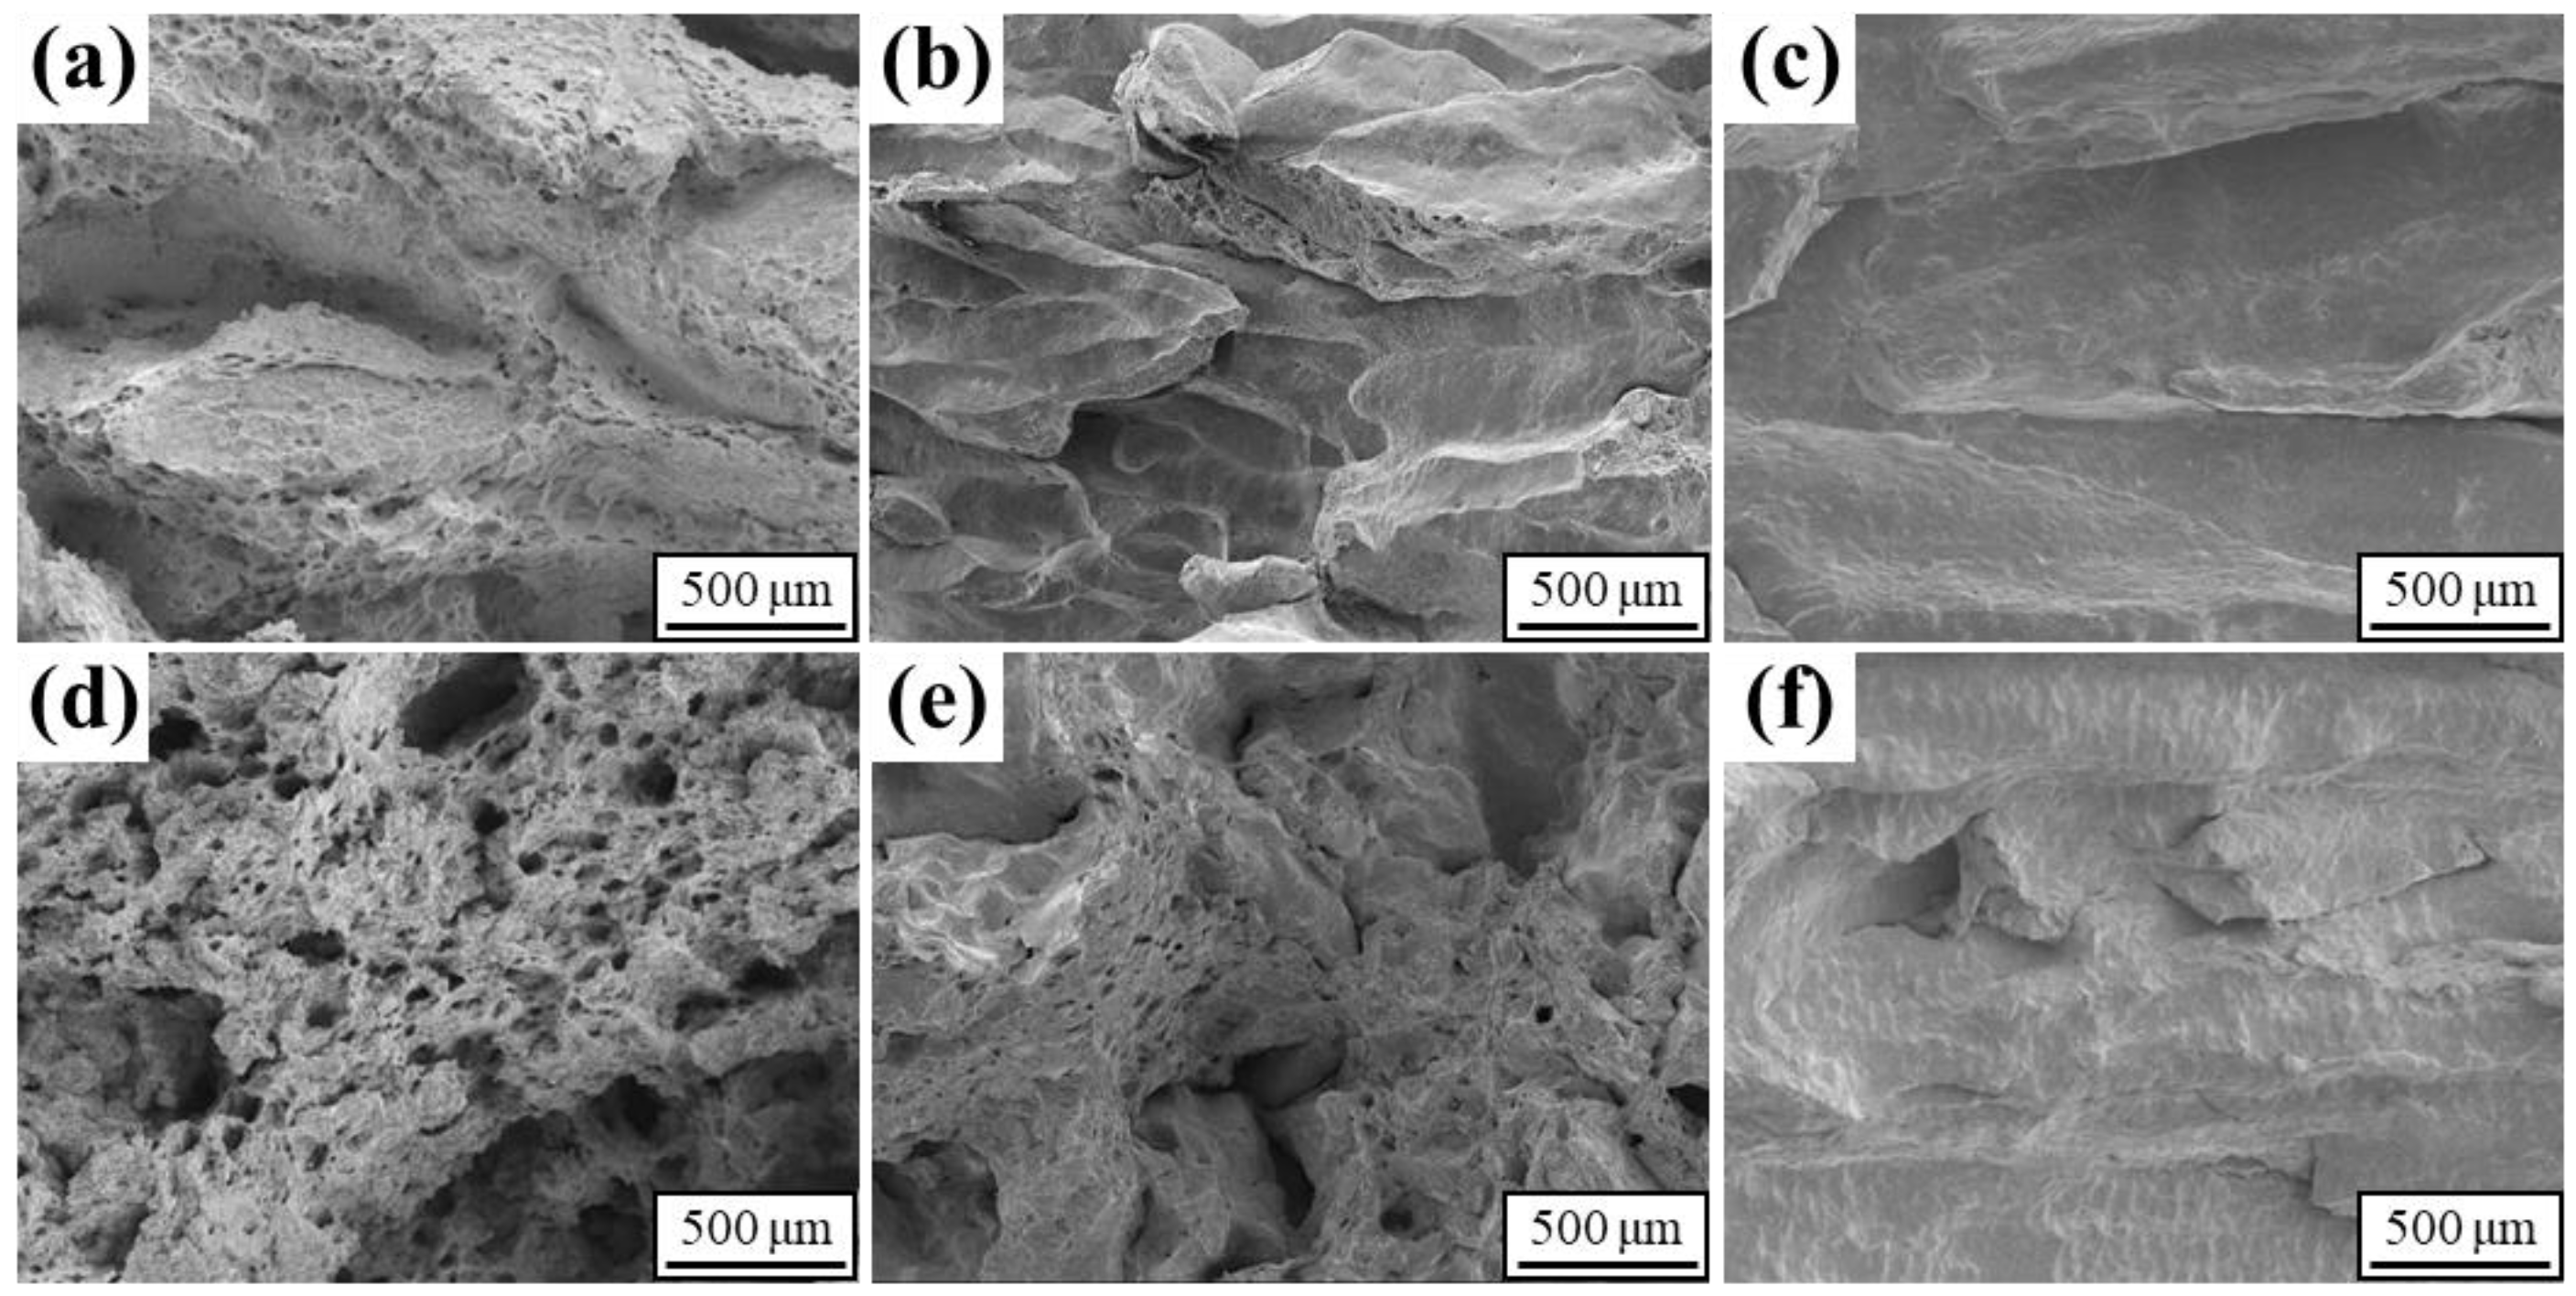
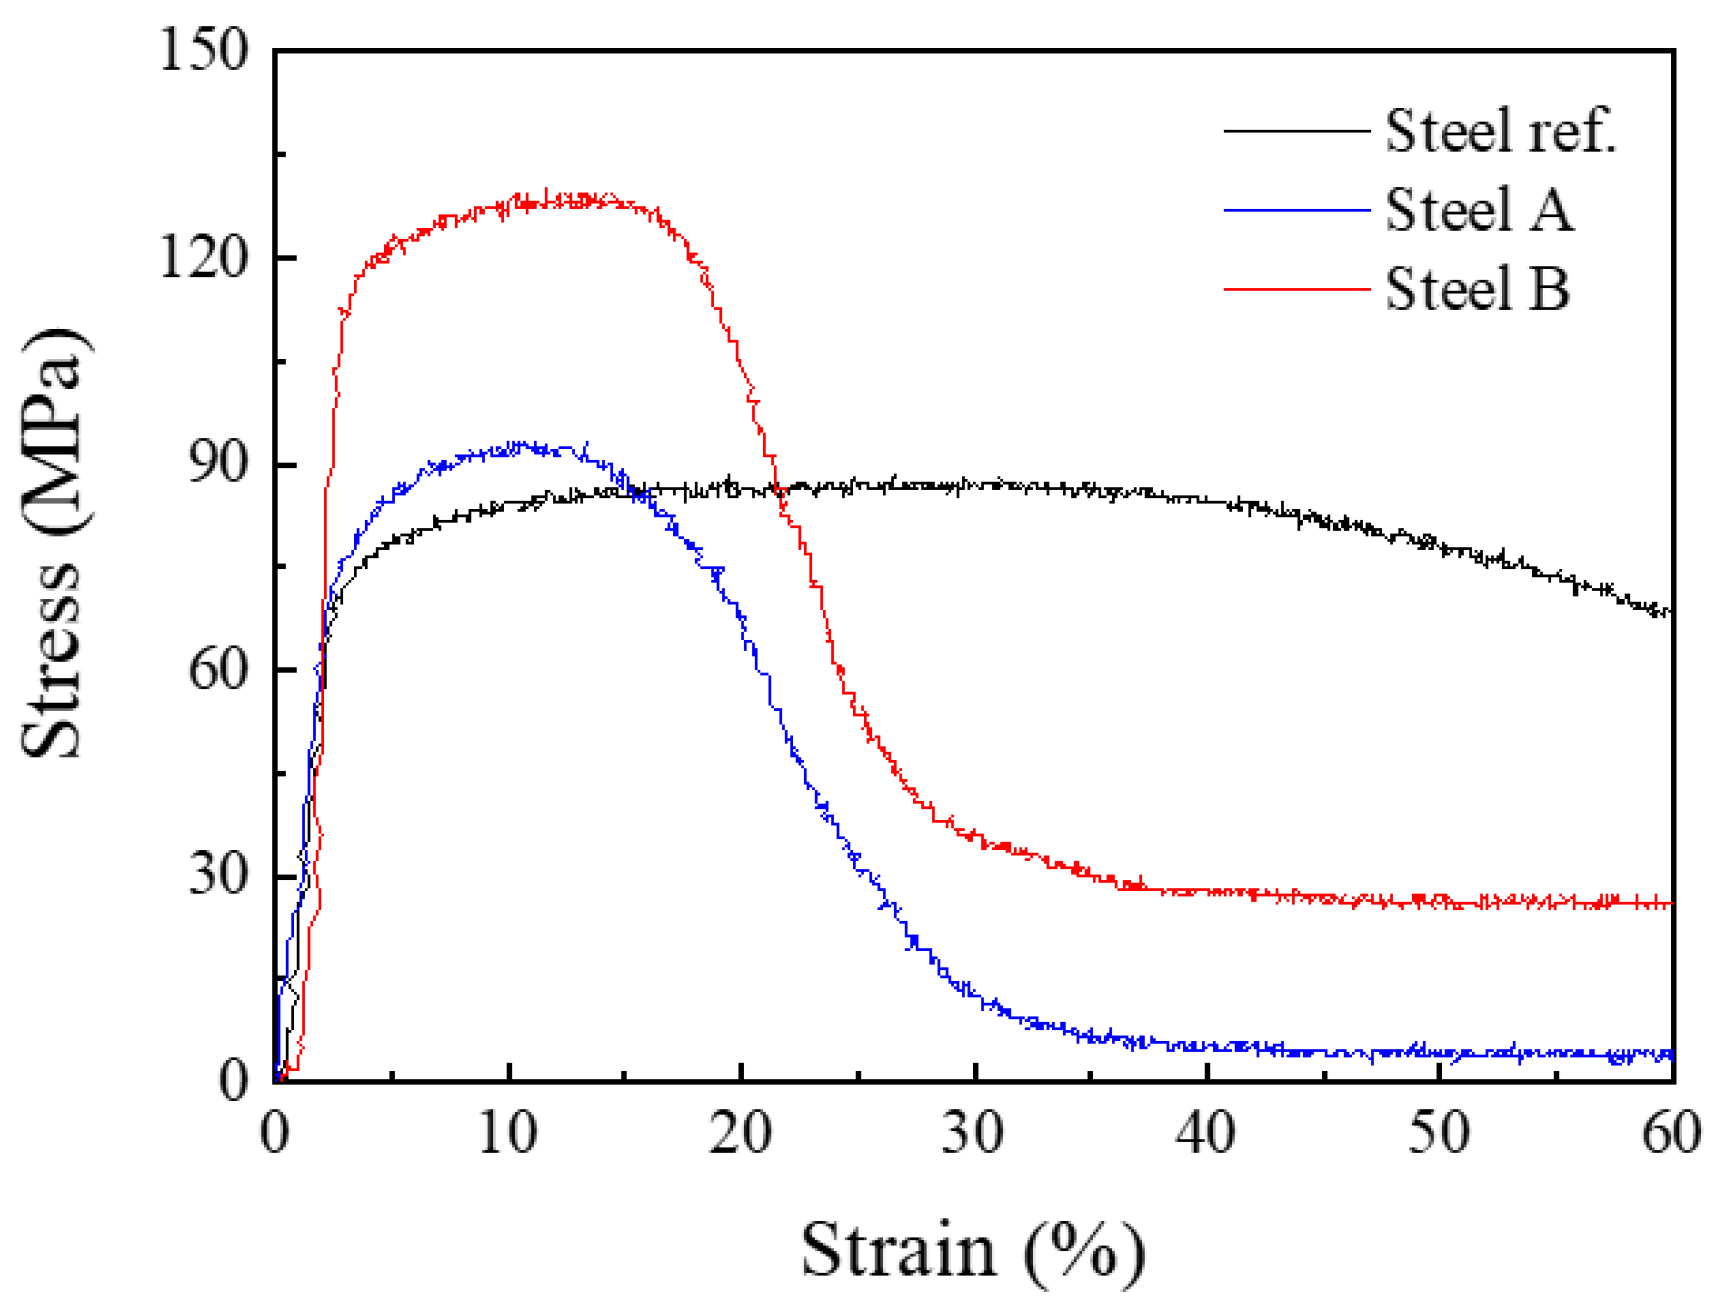
3.1. Hot Ductility Behavior of V-Mo Added High-Mn Steel

To investigate the high-temperature ductility behavior according to the addition of V and Mo, the RA graphs (Figure 2) were obtained for the four steel grades. All had a low RA < 50% over the entire TT range, but the addition of V or V-Mo significantly affected the RA behavior. The hot ductility was lower in Steels A, B, and C, including precipitating elements, than in the reference steel (Steel ref) at all TT; this difference is related to the precipitation hardening and the retardation of dynamic recrystallization behavior due to the precipitation and solute effect [20,21,22].
The EBSD results (Figure 3) of Steel ref show increase in the fraction of dynamic recrystallized grains as TT increased from 800 to 900 °C. In contrast to Steel ref, no recrystallized grains were observed in Steels A and B at TT = 800 °C. When the TT increases to 900 °C, a few recrystallized grains were found in the vicinity of fracture surface in steel A (black arrow in Figure 3e-1), but still no recrystallization clearly in steel B. This indicates that recrystallization was suppressed due to the addition of V or V-Mo. This trend can also be seen in the fracture surface (Figure 4). Steel ref has dimples distributed throughout the fracture surface, whereas Steel A and B exhibit brittle intergranular fracture behavior at TT = 800 °C. At TT = 900 °C, the amount of dimple increased in Steel ref compared to TT = 800 °C, and some of dimples were found in Steel A. In the case of Steel B, it shows a brittle fracture surface through complete intergranular fracture as at TT = 800 °C. This recrystallization behavior is consistent with the hot ductility result of Figure 2, and therefore, steels A and B have lower hot ductility than Steel ref at temperatures < TT = 900 °C.
Steels B and C with the same V content had similar RA behavior despite presence of Mo content in steel C, and both had the lowest RA. This result implies that V has a greater degrading effect than Mo on high-temperature ductility. When high-Al and TWIP steels include >0.3 wt.% V, fine precipitates of about 4 to 5 nm form and degrade the hot ductility. Furthermore, if the V content is increased to ≥0.5 wt.%, the hot ductility is further reduced due to precipitation-free zones, because precipitates form along grain boundaries [15]. The behavior of RA in this study has a similar trend to the degradation of hot ductility due to the increase in V content. The average compositions of V at the segregation area in Steel A and B were about 0.57 and 0.93 wt.%, respectively (Figure 5). The density of precipitates and the segregation of V were significantly higher in Steel B than in Steel A. The high level of V content in the segregation region of Steel B not only promotes the formation of precipitates, but also inhibits recrystallization due to the solute effect, leading to lower hot ductility [21,22].

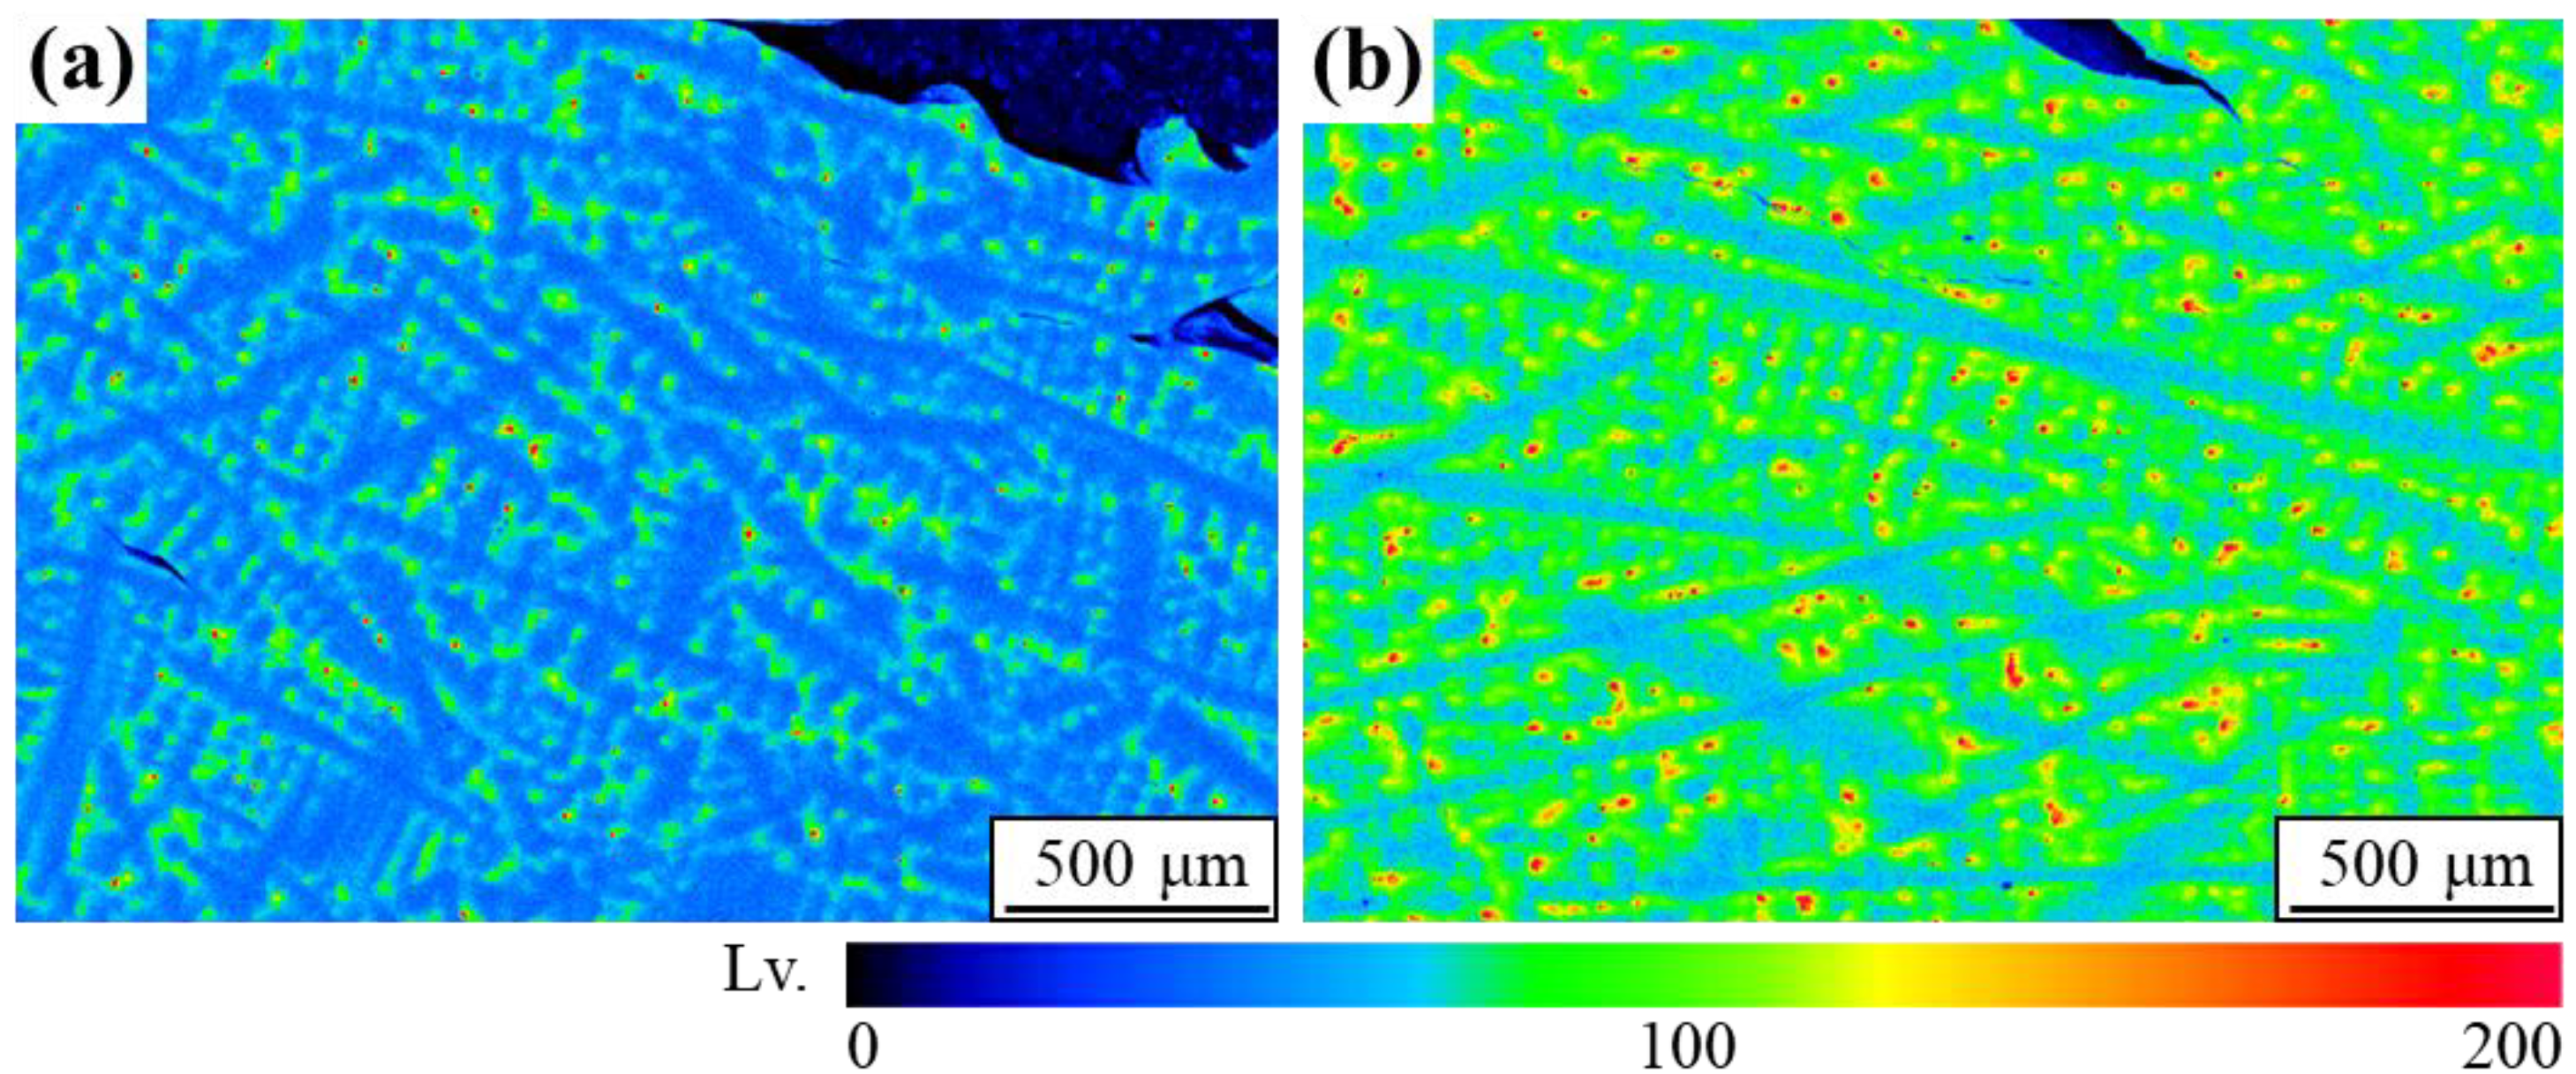
3.2. Precipitation Behavior in V-Mo and V Steels

The difference in RA between Steel A and Steel B at TT = 900 °C can be explained by the variation in precipitation behavior according to the V content, and the calculated TTP diagram and equilibrium fraction diagram were used for this purpose. When the content of V was increased from 0.3 to 0.5 wt.%, the TN of the TTP curve increased from 800 to 850 °C, and the time to the onset of precipitation decreased (Figure 6a). However, the addition of Mo did not affect the change in TN; the precipitate fraction diagram (Figure 6b) has a similar trend. In addition, the precipitation-initiation temperature TPI also increased from ~1050 °C to ~1110 °C by increasing content of V. The addition of Mo only serves to increase the volume fraction of precipitates; it does not affect TPI.
The tendencies of change in the TTP TN and TPI corresponded in the TT range, in which RA rapidly decreases. In Steel A, RA decreased rapidly to <10% from TT = 900 to 800 °C, and the calculated TN was 800 °C. In Steel B, the RA decrease started at a higher temperature than in Steel A, and the TN was 850 °C, which is higher than in Steel B. Increase in TPI and TN due to the increase in the V content is correlated with an increase in the temperature at which the decrease in RA begins.
This phenomenon can also be explained by the strain-stress curve at TT = 900 °C, at which the difference in RA is largest (Figure 7). Steel A with a low TN has similar yield stress (YS) and ultimate tensile stress (UTS) to Steel ref that lacks precipitation-fostering elements, but Steel B with a relatively high TN has higher YS and UTS than Steel A due to the precipitation strengthening at TT = 900 °C. Therefore, the RA decrease starts in the region in which the formation of precipitates is concentrated, and this correlation means that the precipitation phenomenon of high-Mn steel and the change in its RA behavior are closely related.

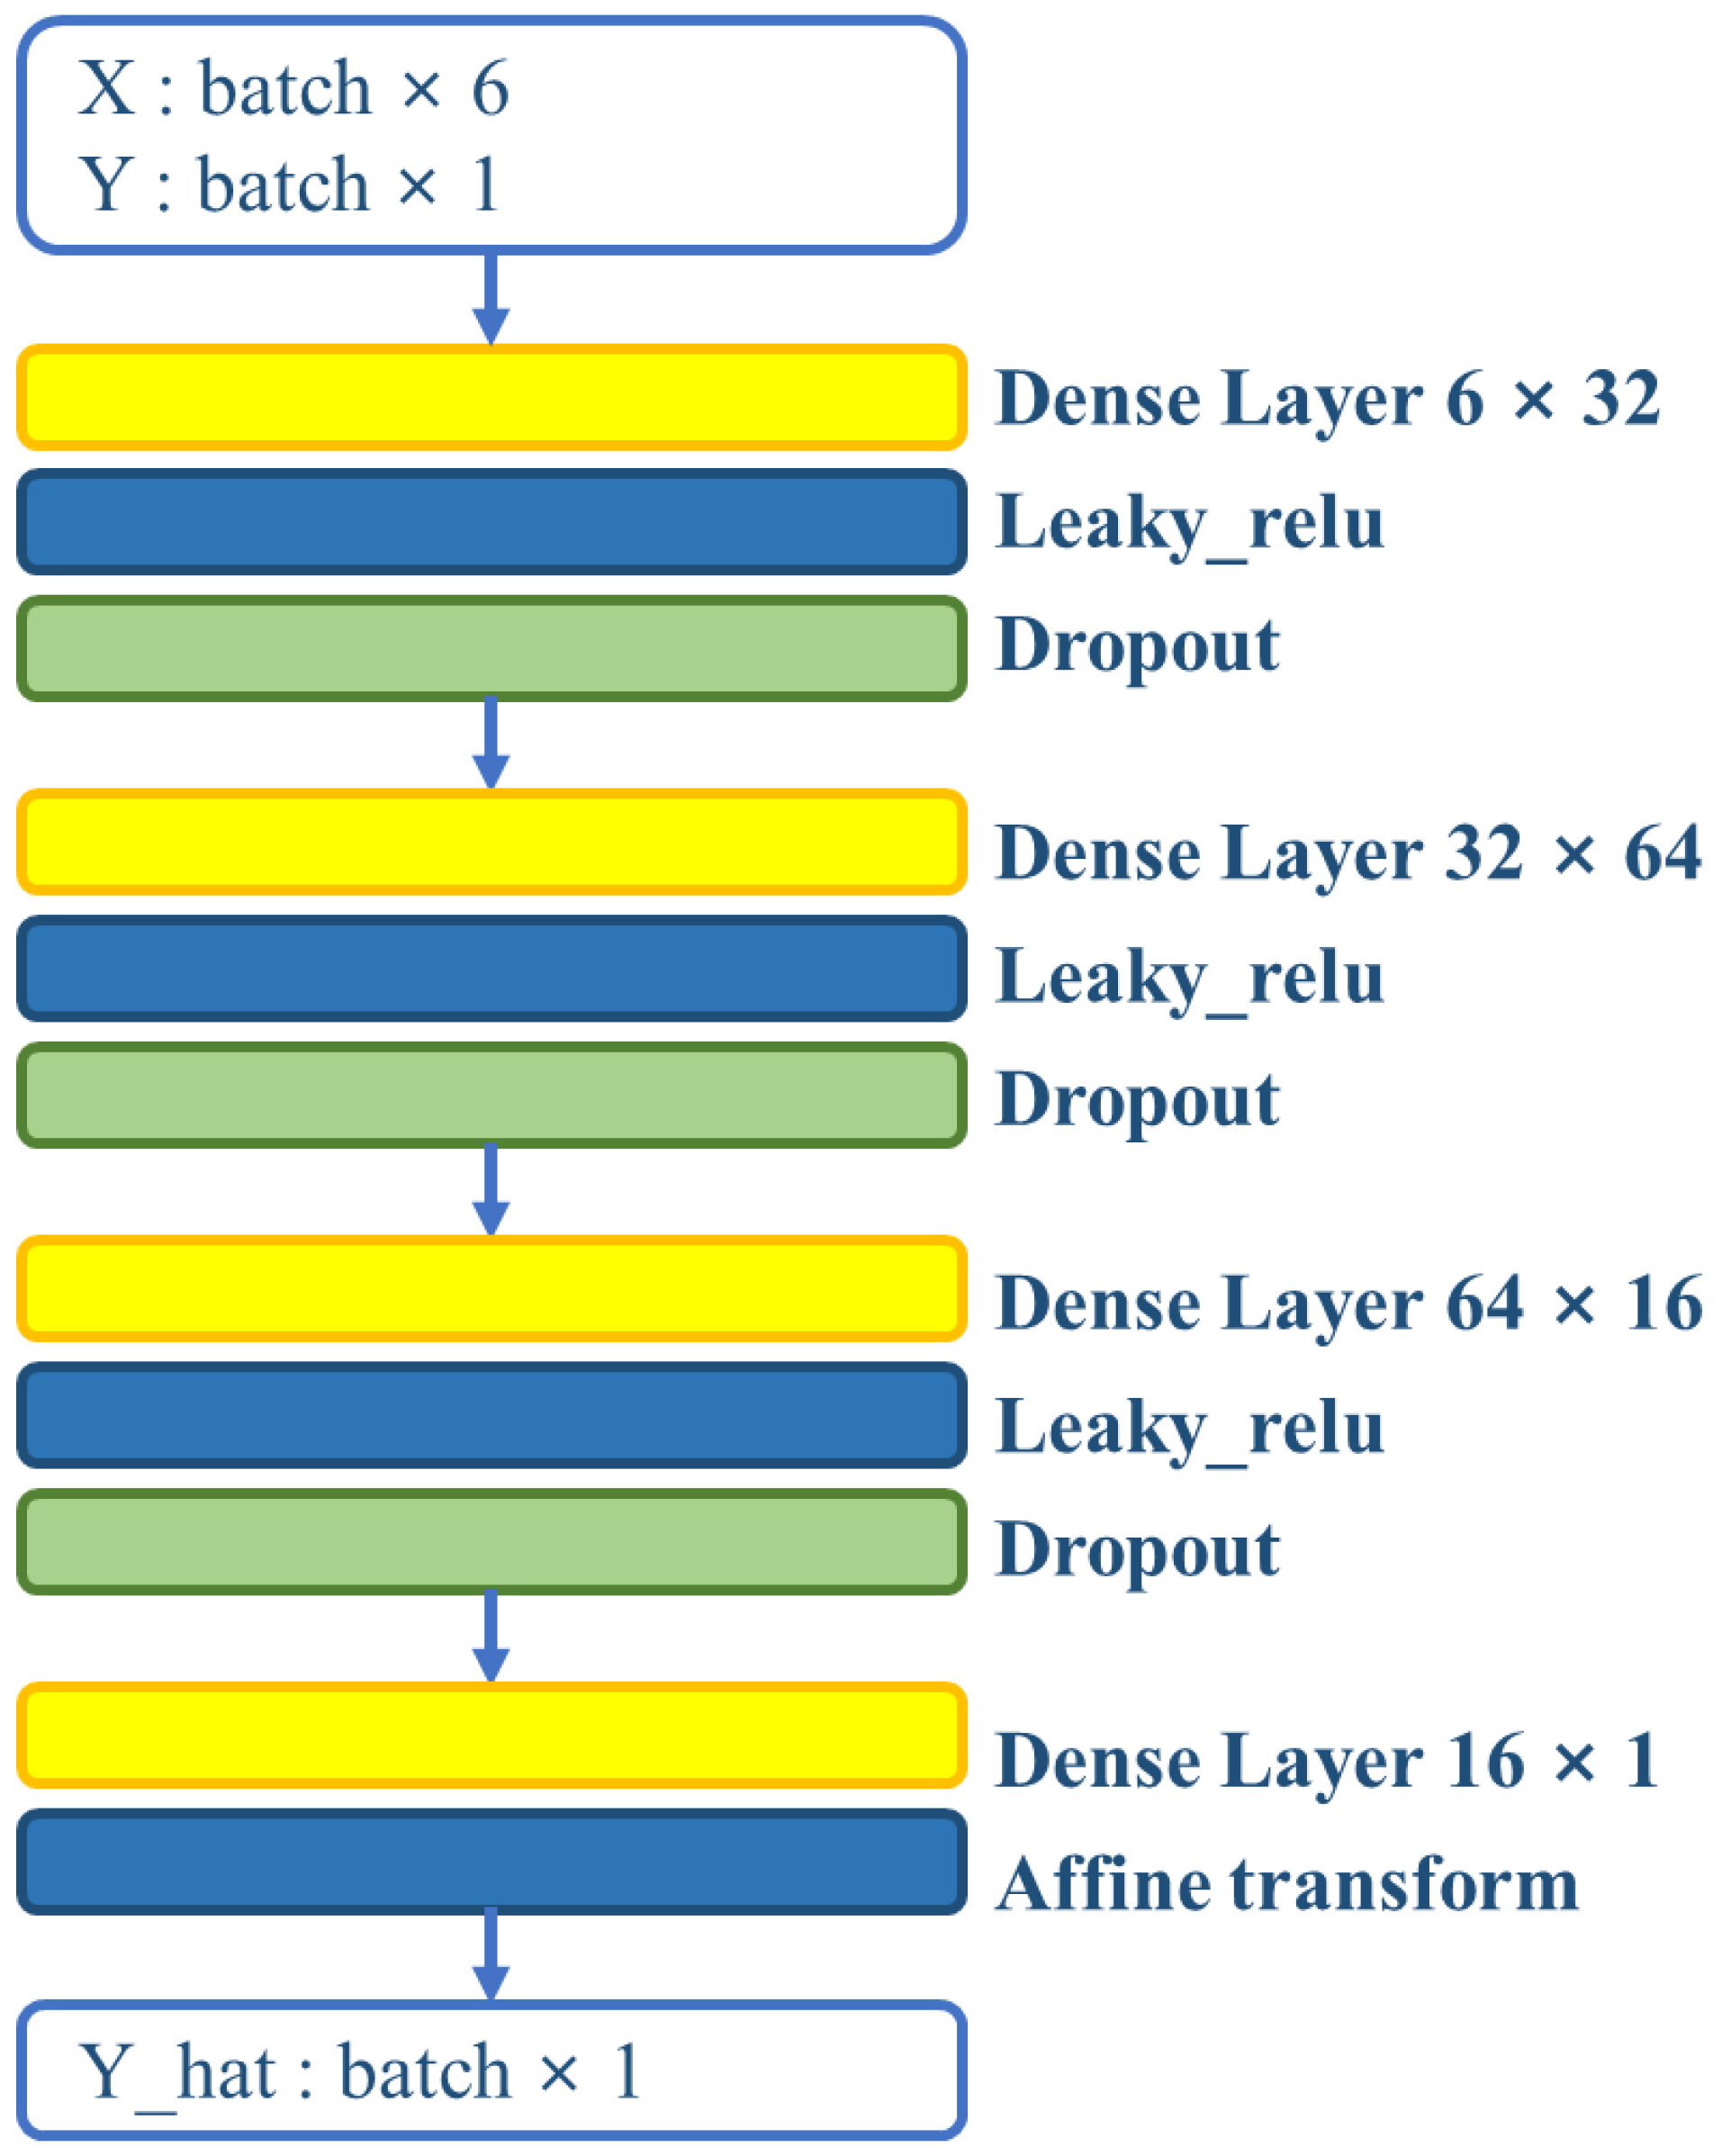
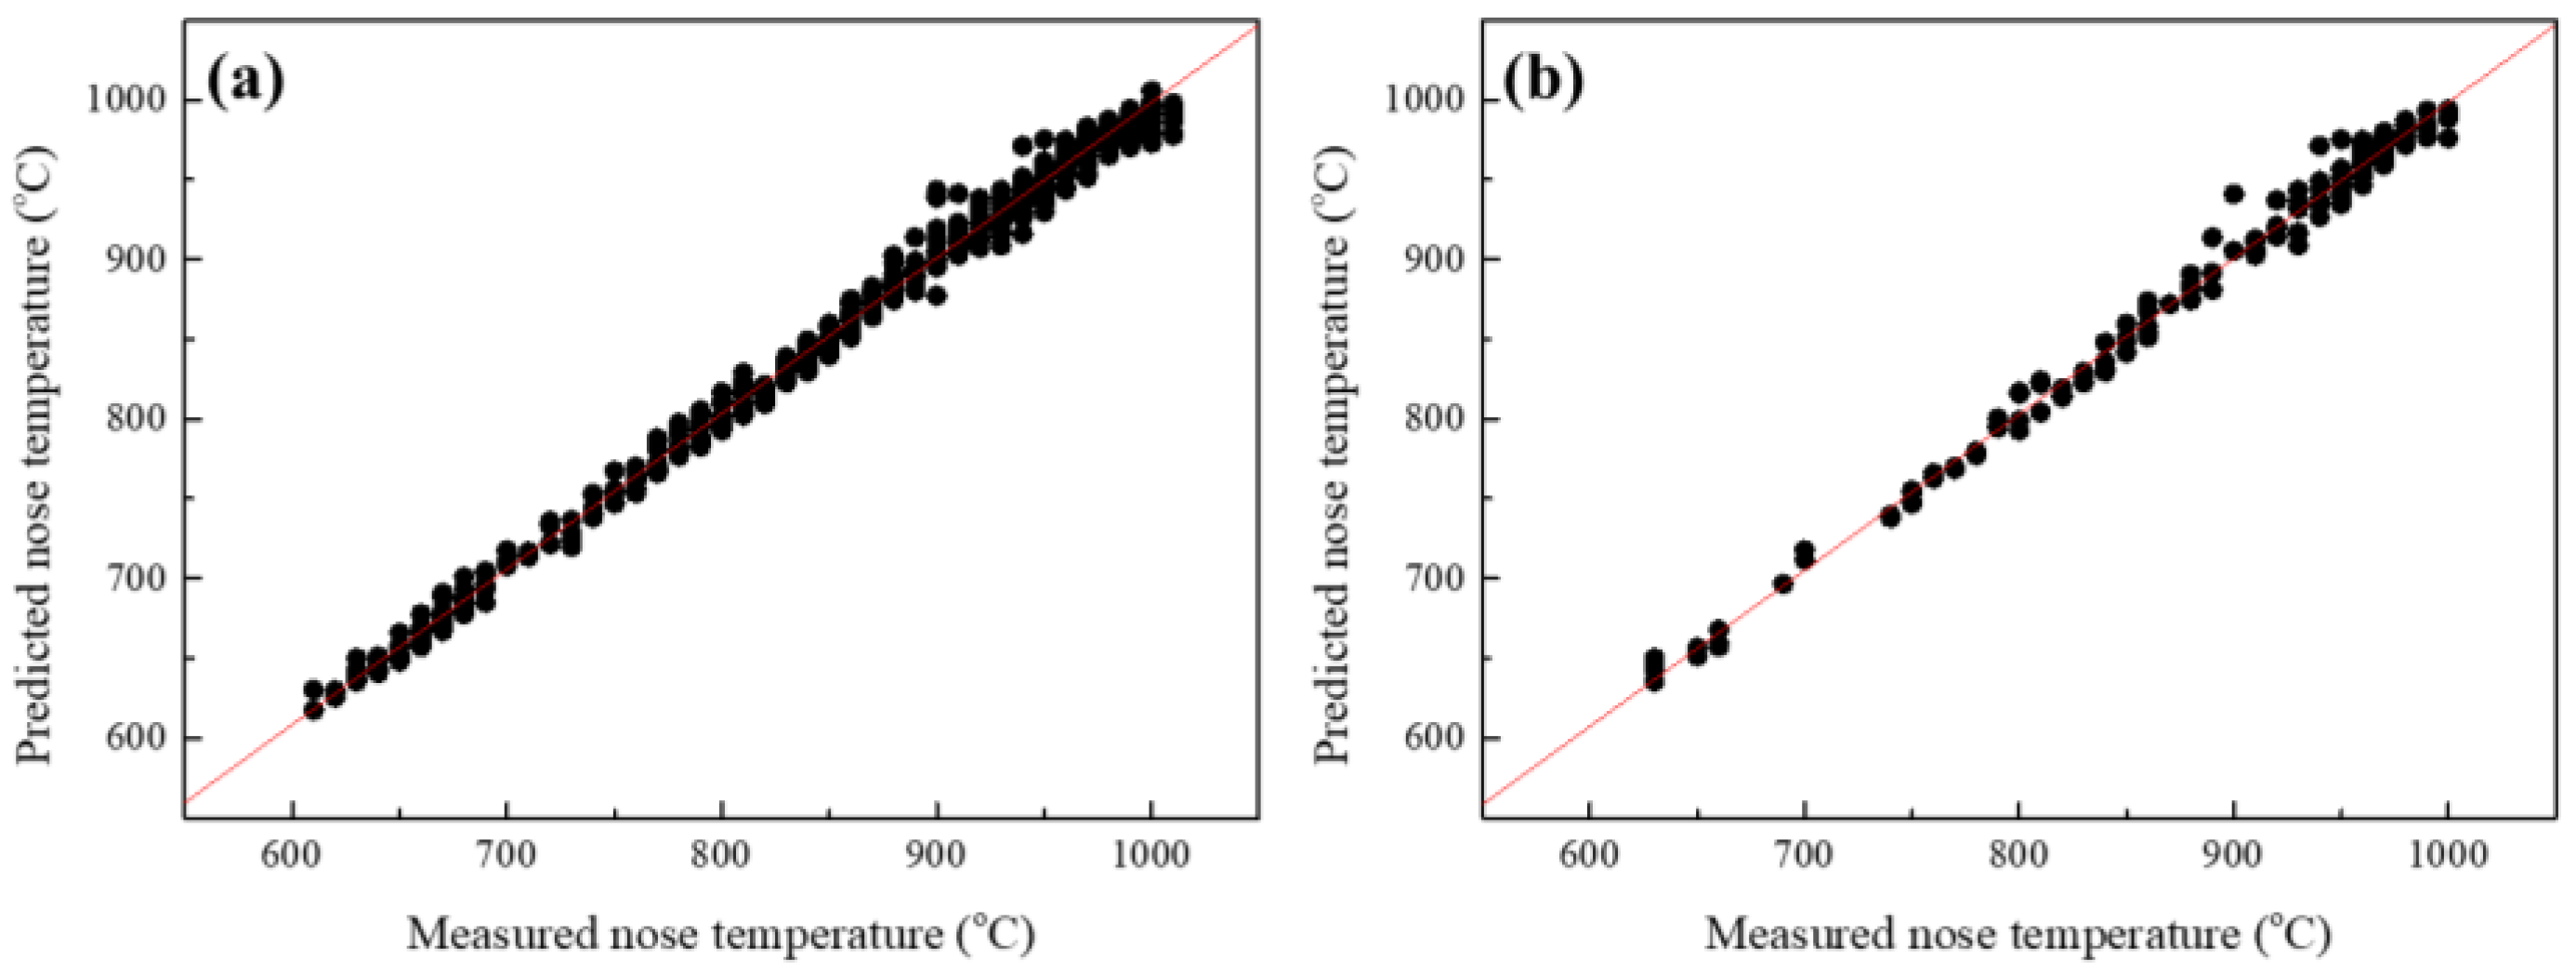
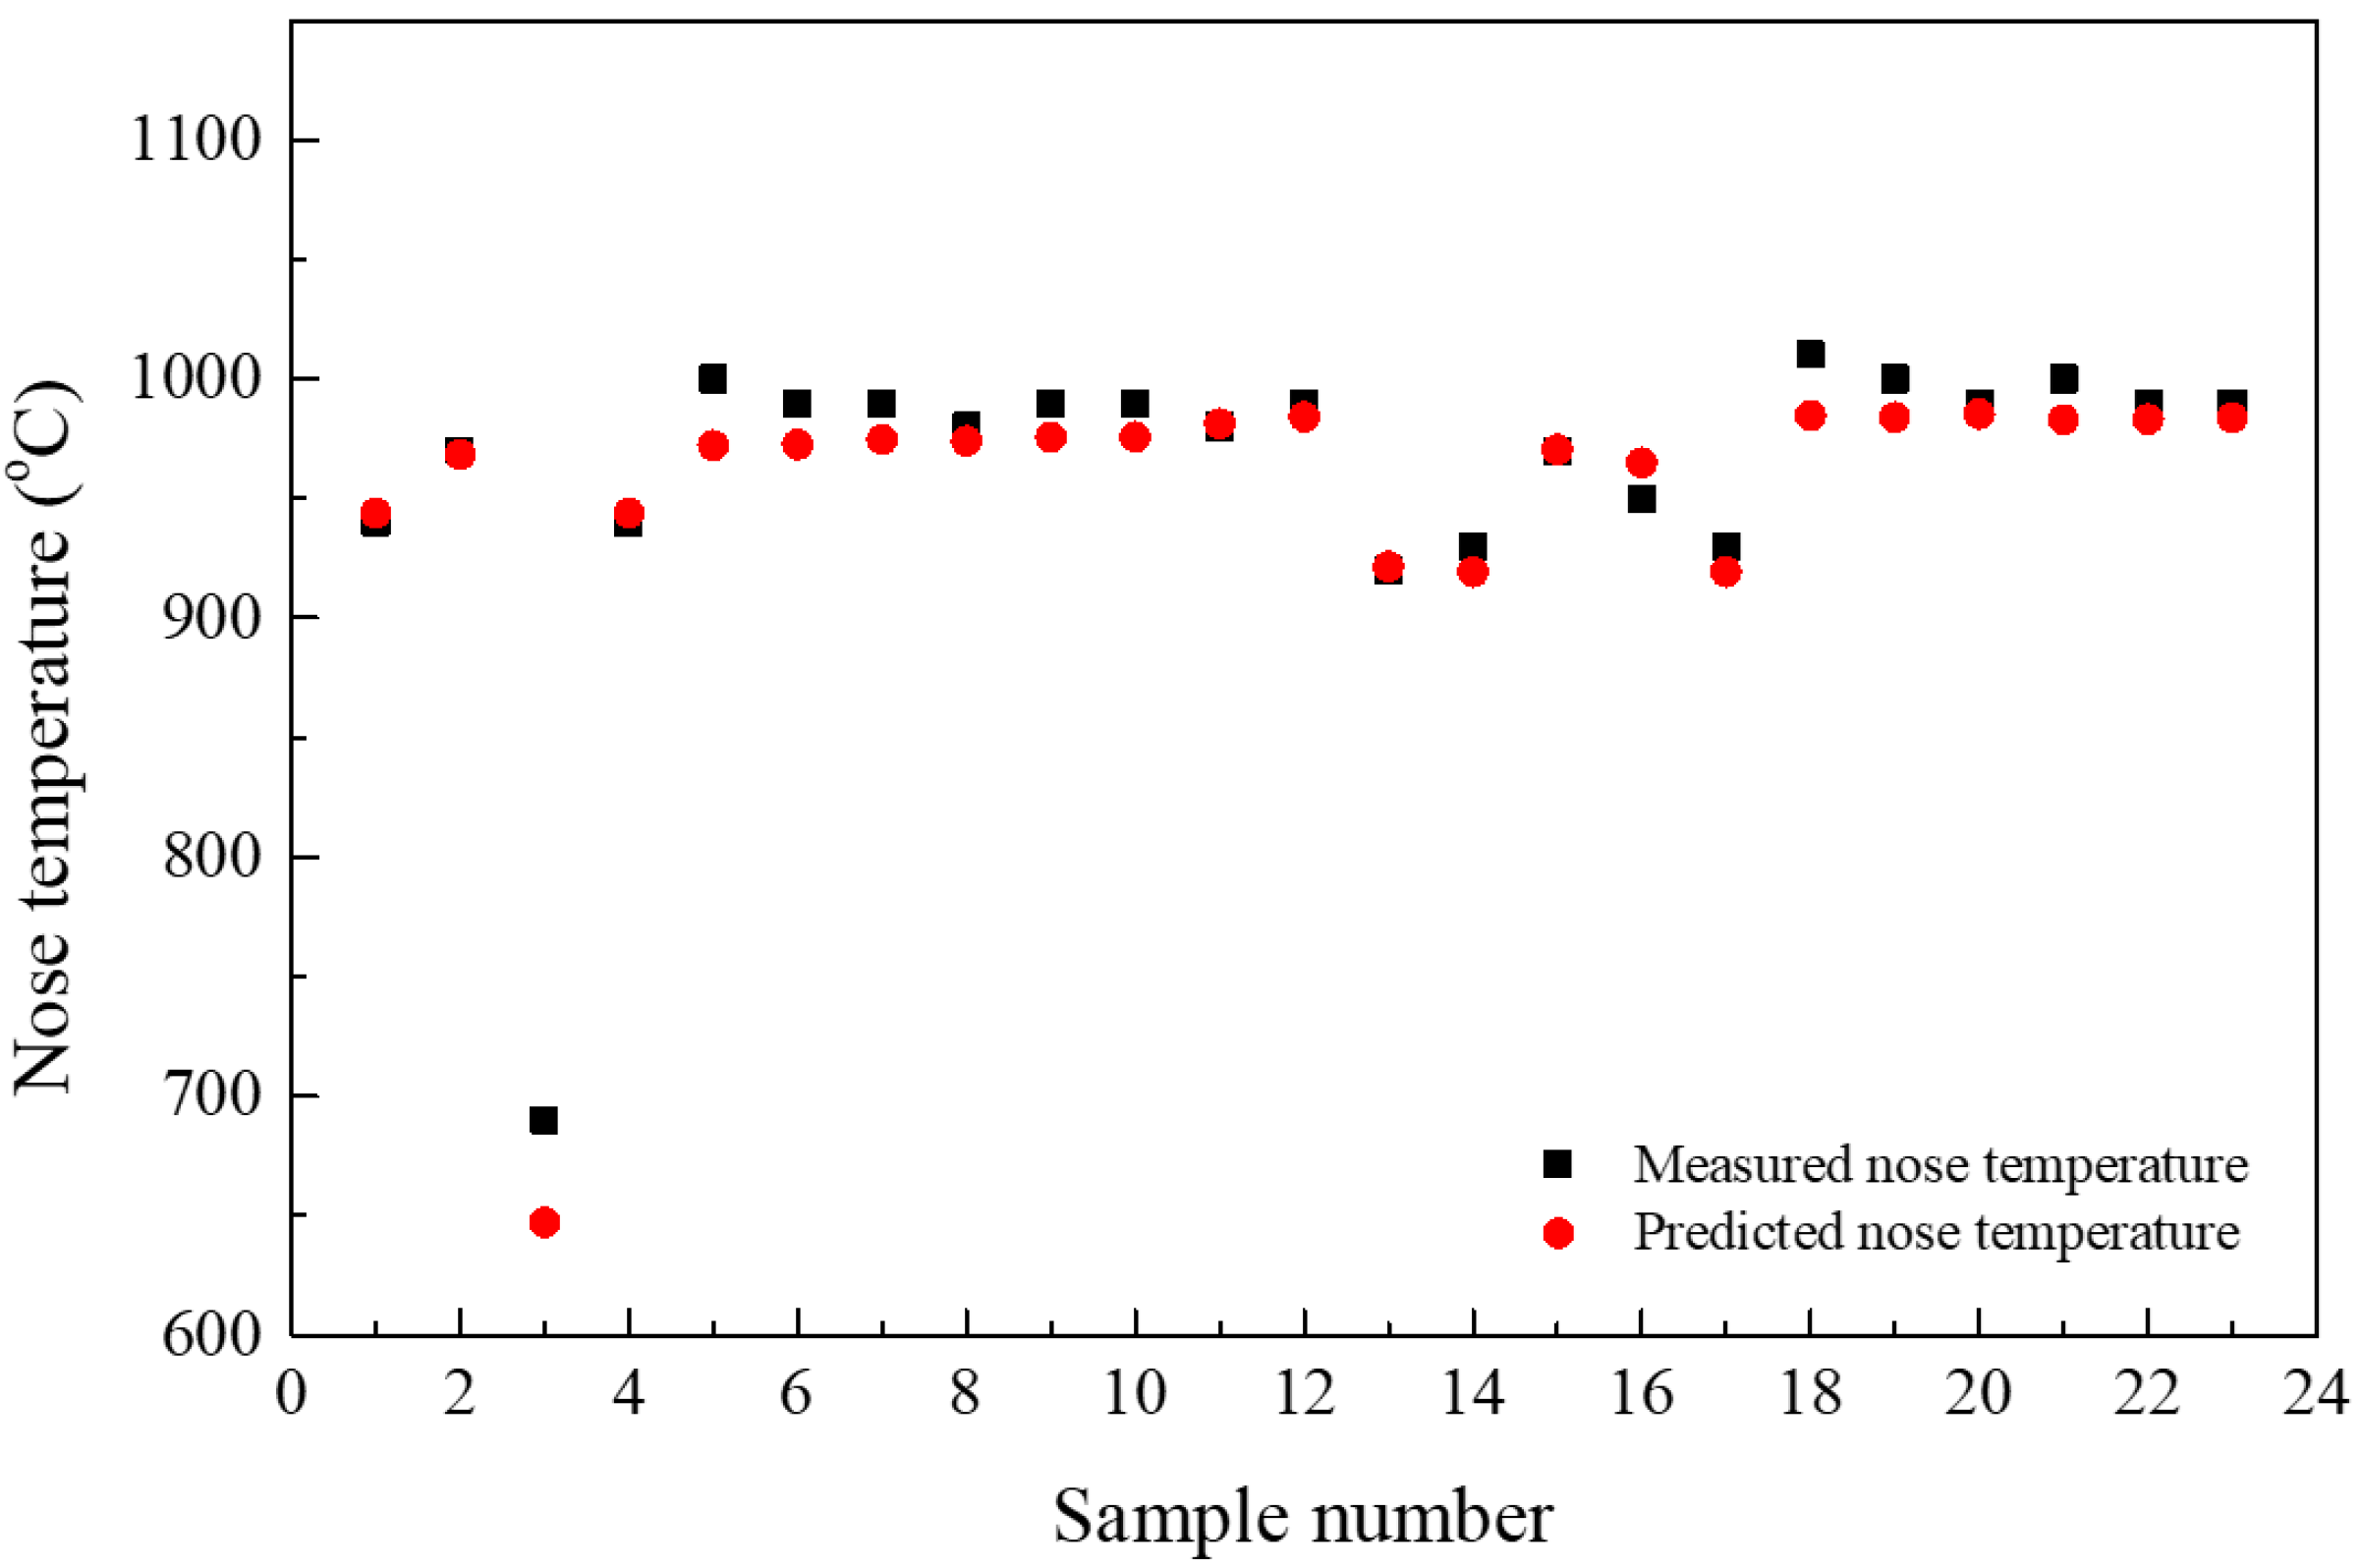
3.3. Prediction Model for Time-Temperature-Precipitation Nose Temperature

The experimental results in Section 3.1 confirmed the correlation between hot ductility and the TTP diagram in high-Mn steels. This relationship indicates that if the TN is known, the RA decrease temperature can be predicted without complicated hot-ductility tests. Therefore, a model that can predict the temperature at which RA decreases was produced by utilizing a TTP diagram database for various high-Mn steel compositions.
To obtain a database of TN, TTP diagrams of ~1500 high-Mn steel compositions were calculated and the composition used in calculation included one or more of precipitating elements V, Mo, Ti, and Nb. TN was extracted from the results. The compositions (denoted (∙), wt.%) of the high-Mn steels used to collect the TN were: 0.1 ≤ (C) ≤ 1.0 by 0.2, 14 ≤ (Mn) ≤ 23 by 3, 0.01 ≤ (Nb) ≤ 0.1 by 0.02, 0.01 ≤ (Ti) ≤ 0.1 by 0.02, and in the case of V, 0.01 ≤ (V) ≤ 0.1 by 0.01 when Nb or Ti were included, and 0.1 ≤ (V) ≤ 1.0 by 0.1 otherwise. Molybdenum content range was 0.1 ≤ (Mo) ≤ 1.0 by 0.2, but it did not significantly affect the TN. Contents of elements that do not significantly affect TN in carbide formation were fixed by referring to the composition of steels used in the experiment: Si = 0.02, P = 0.015, S = 0.003, Al = 0.02, N = 0.005. When the TTP diagram could not be calculated because the content of the elements required for precipitation was too low, that composition was excluded. When the alloy included only Mo, which forms a precipitate by combining with other elements (mainly V), the TTP diagram could not be calculated, so this composition was also excluded. To consider the precipitation effect due to deformation, the deformation conditions mentioned in Section 2.2 were used. These calculations yielded 610 ≤ TN ≤ 1030 °C.
Variables cannot be directly compared in the analyzed results when variables have different ranges. To overcome this problem, each variable was normalized and standardized using MinMaxScaler to scale all data into the range 0 to 1. To predict the TN corresponds to supervised learning with both input and output values, and it uses the regression approach because prediction of real numbers or vectors is required. In this study, a DNN model [23,24] (Figure 8) was used to predict the TN for various compositions of high-Mn steels. The input layer consisted of six compositional variables: C, Mn, Nb, Ti, V, and Mo. The hidden layer consisted of four dense layers and transformed the nonlinear hidden characteristics of the input data to linear characteristics. The output layer was composed of one layer and was designed to predict TN.
The program in this experiment was implemented using the Keras library using Python (version 3.5.2, Python Software Foundation, Wilmington, DE, USA) and TensorFlow (version 2.0, Google Inc., Mountain View, CA, USA) as backends, and the experiment was conducted in a Windows 10 64-bit environment with an Intel i7-6700K processor (Intel Corporation, Santa Clara, CA, USA) and two GeForce GTX 1080 Ti graphics cards (NVIDA Corporation, Wilmington, DE, USA). First, hyper-parameter values that represent optimal prediction accuracy were found by applying various environments while training the proposed model. Of the 1468 sets of data used in the experiment, 80% were used for training and 20% for testing. The accuracy of the TN prediction was measured from composition and temperature-related datasets of high-Mn steels with the DNN model. Root mean square error (RMSE) was used to evaluate the accuracy of the prediction.
In the proposed DNN model, RMSE and leaky ReLU were used as the cost function and the activation function, respectively. The batch size of the most accurate DNN model was 64, and Adam Optimizer [25] and a learning rate of 0.0001 were used for training. An optimal model to avoid overfitting was obtained by using drop out and early stopping [26] techniques with keep probability = 0.85. While the proposed model was being trained, the input and output values were randomly shuffled every epoch. In machine learning, one epoch refers to the period in which all data values included in the training dataset enter the prediction model once, then the weight value is updated. Finally, the RMSE of the proposed DNN model on the training and test data were 7.030 °C and 7.082 °C, respectively. Prediction results were applied to the training and evaluation data generated by the proposed model (Figure 9). The error of the predicted value compared to TN was ±7 °C, so the reliability of the predicted values is very high.
The predicted TN values in the proposed model were compared with the RA data of three high-Mn steels, as obtained in a hot ductility test (Figure 10). The values in the proposed model were almost identical to the TN obtained from the software calculation, and this value corresponds to the temperature at which the RA value decreases. This result indicates that the proposed model gives reasonable predictions of the RA degradation temperature.

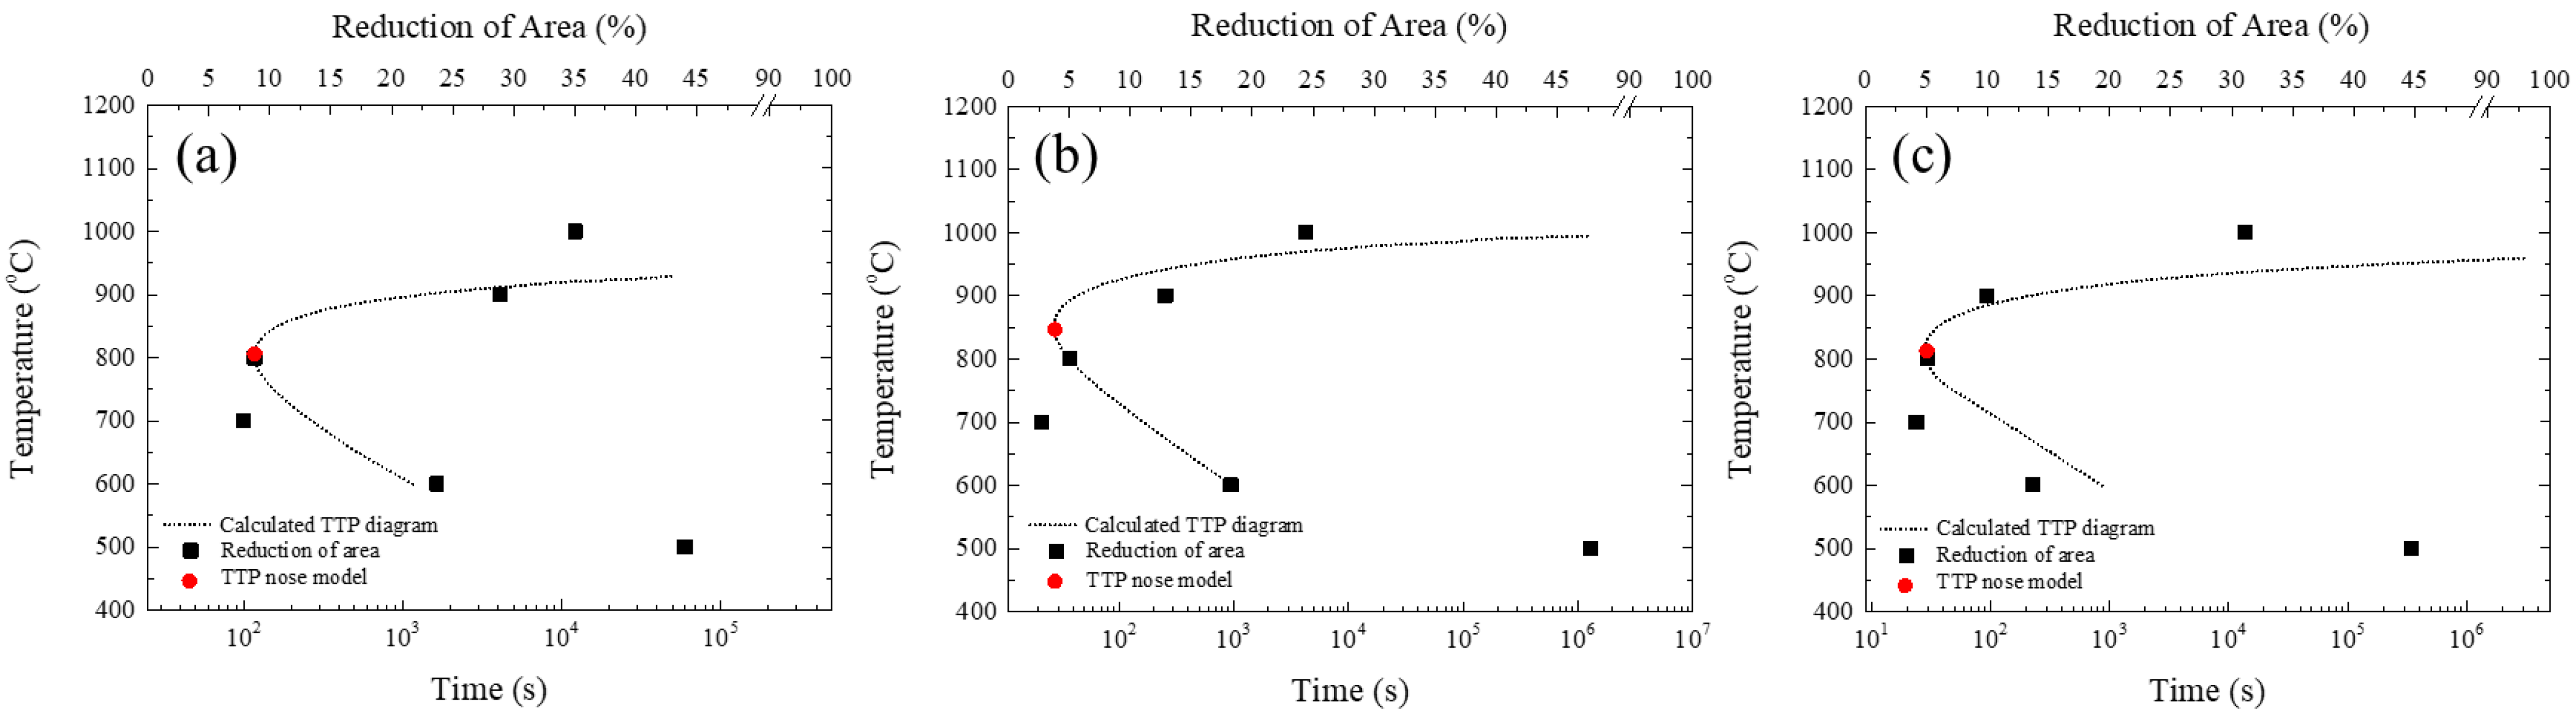
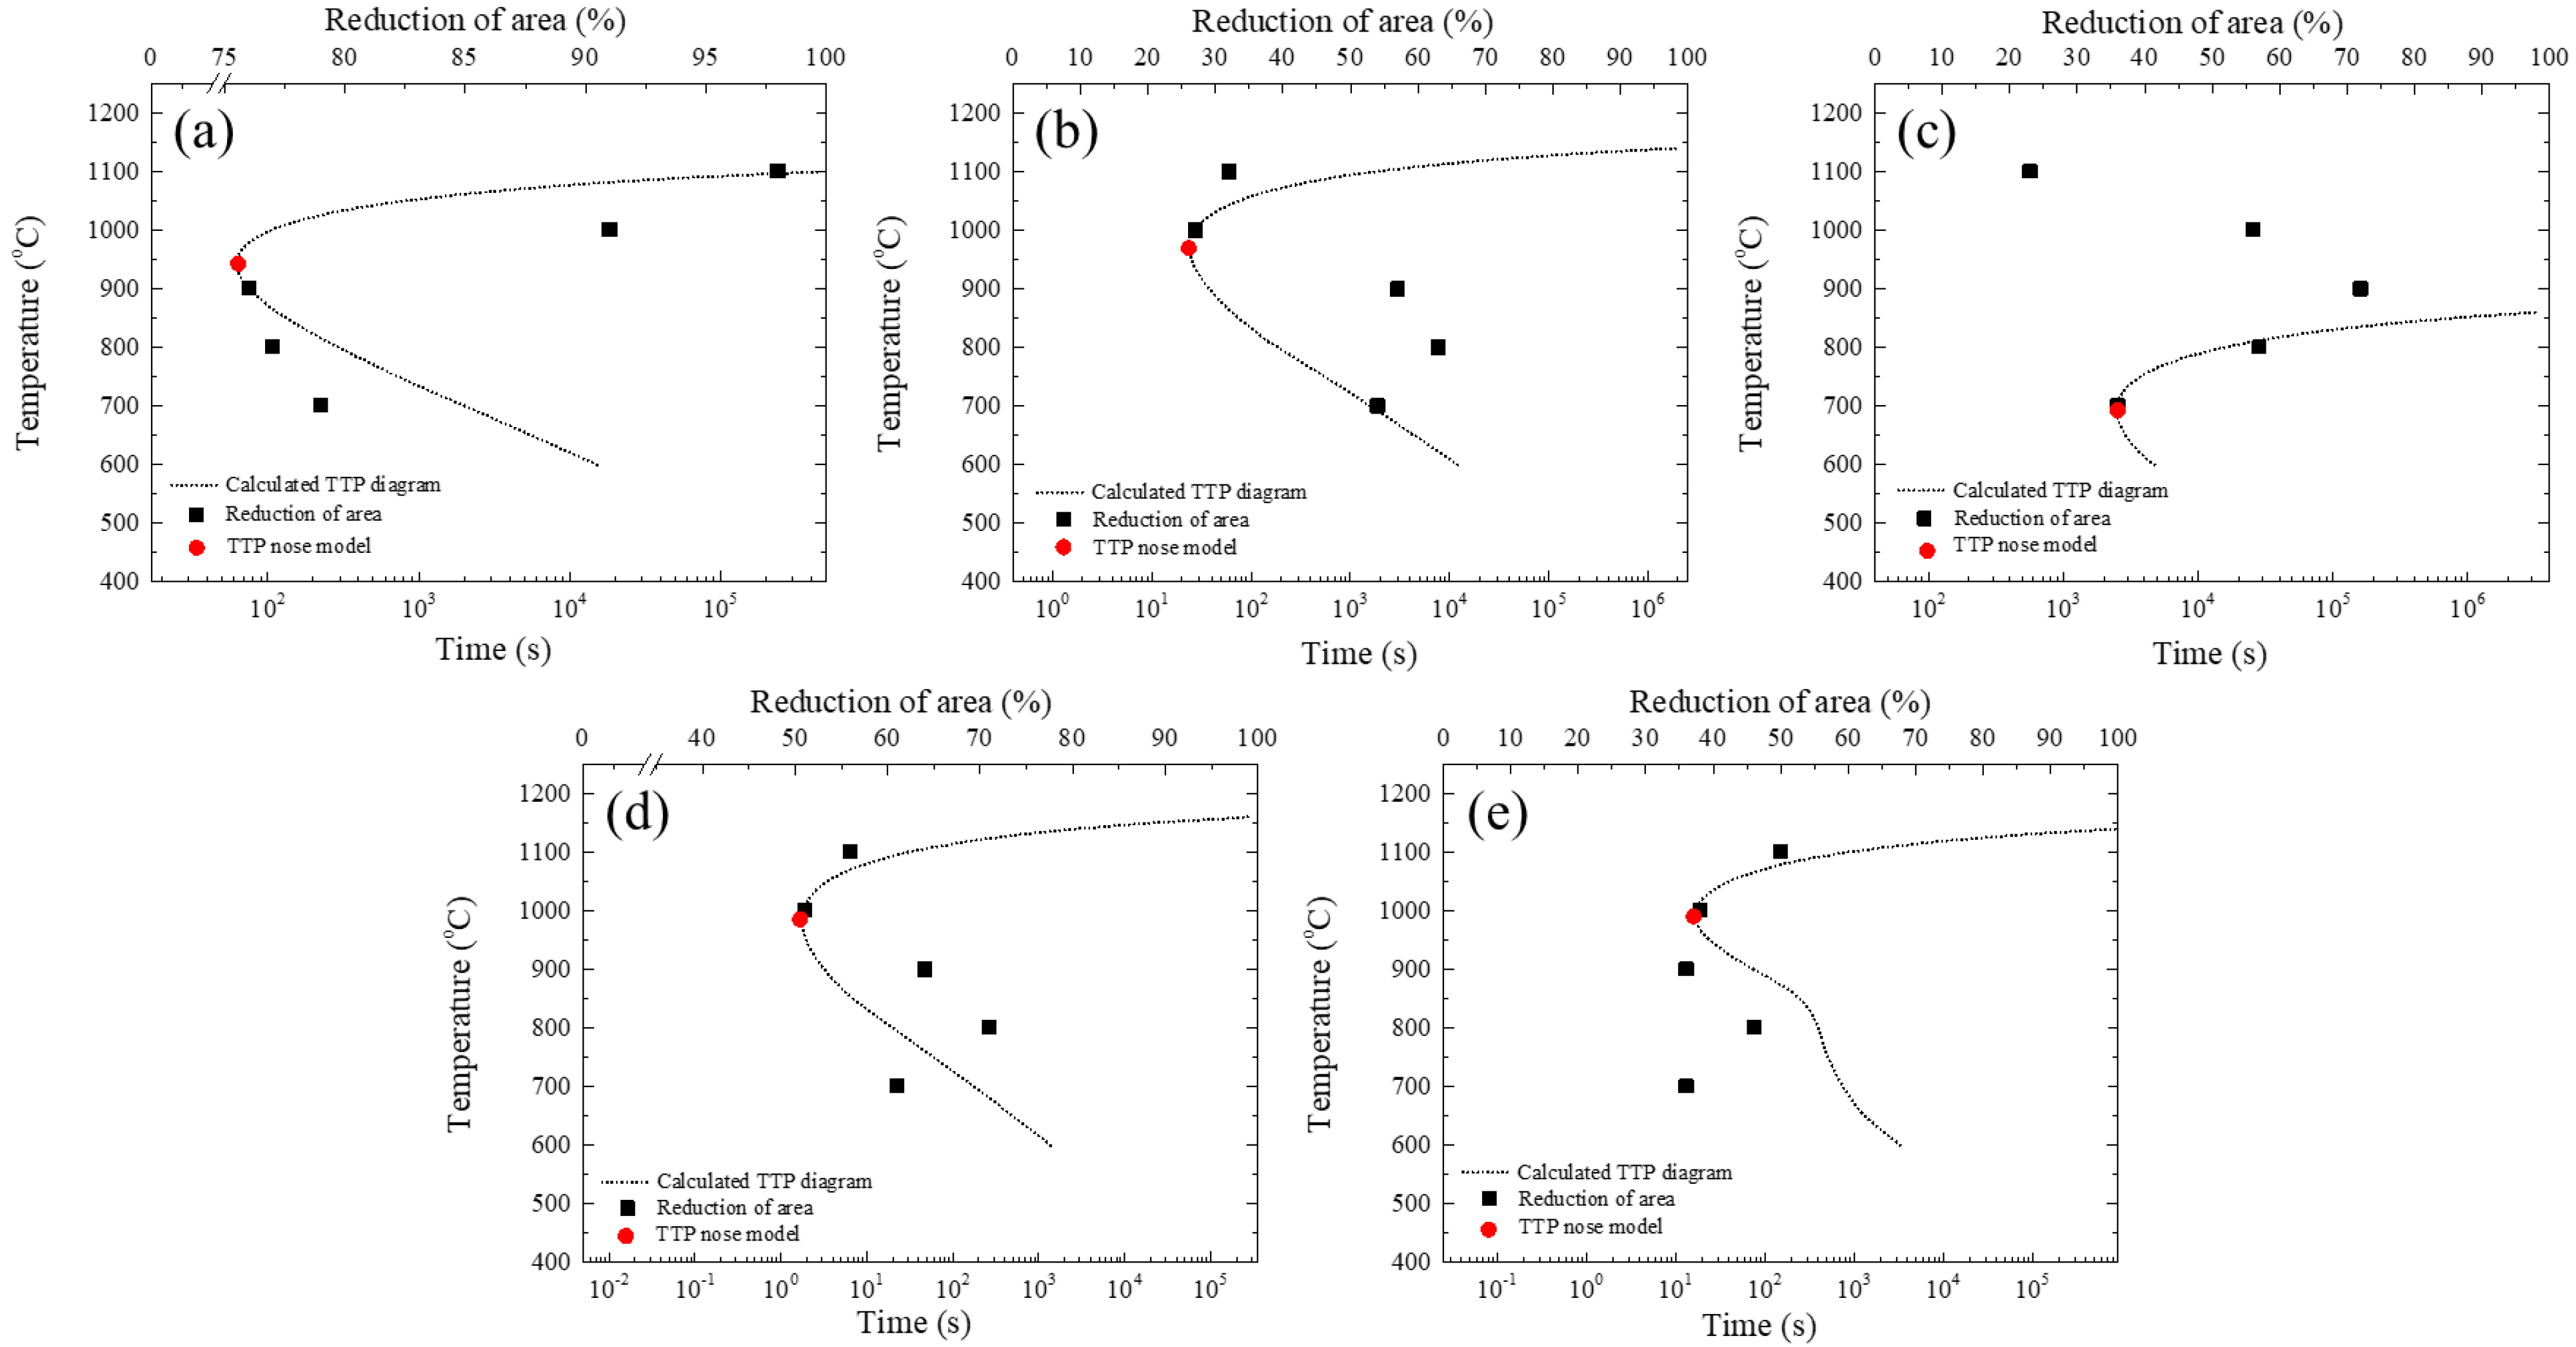
3.4. Case Study for Prediction Model

To test the validity of the prediction model, data from 21 high-Mn steels that contained at least one of Nb, Ti, V, and Mo were collected from the literature [14,27,28,29,30,31,32,33,34,35], and applied to the prediction model. The TN in the TTP diagram calculated from J-matpro software were compared with the result in the prediction model, and the values matched well (Figure 11). To compare the RA behavior with the results from the prediction model, five high-Mn steels representing the composition of each precipitating element contained were selected from reference data [14,27,28,29,30,31,32]. Few references present data that show RA behavior in experiments on high-Mn steel, so data were not available for all compositions. The composition of the five selected high-Mn steels were low Nb, high Nb, V, Nb-Ti, and Nb-V containing steels (Table 2).
The temperature at which RA decreases and the value predicted by the DNN model matched well for all steels (Figure 12). The high-Mn steel that includes both Nb and V (Figure 12e) has a TTP diagram that is divided into two sections, in contrast to other steels, which all had one nose. The predicted value in the DNN model corresponds to the TN with a sharper bend, but RA deteriorated in both sections.

4. Discussion

4.1. TTP Nose Temperature Prediction Model Using Linear Regression

Before the DNN model was applied, the relationship between TN and RA for 1500 high-Mn steel compositions was expressed as a linear equation by using simple multiple regression. The composition ranges (wt.%) used in the calculation of the TTP diagram were: 0.1 ≤ (C) ≤ 1.0, 14 ≤ (Mn) ≤ 23, 0.01 ≤ (Nb) ≤ 0.1, 0.01 ≤ (Ti) ≤ 0.1, 0.1 ≤ (V) ≤ 1.0, 0.1 ≤ (Mo) ≤ 1, and TN in the range of 610 to 1030 °C were extracted. The obtained model to predict TN was:
T N ( ° C ) = 844 + 62.0 ( C ) 1.05 ( Mn ) 50.0 ( V ) 152 ( Mo ) + 1150 ( Nb ) 503 ( Ti ) .
However, this regression equation had low reliability of R2 = 0.58, and it cannot obtain an accurate TN for comparison with observed RA behavior. Therefore, a TN prediction model that uses a nonlinear predictive analysis method is required; for this purpose, a DNN model was developed.

4.2. Limitations of Predictive Models

4.2.1. Relationship between TTP Nose and RA in General Carbon Steel

Results confirmed that in high-Mn steels, the TN and the RA-lowering temperature coincide, so this study investigated whether this relationship can be applied to carbon steels that had various compositions. The RA data for about 87 carbon steel compositions were collected from literature data [2,5,23,24,25,26,33,34,35,36,37,38,39,40,41,42,43,44,45,46,47,48,49,50,51,52,53,54,55,56,57], and a TTP diagram drawn from J-matpro software was calculated from the collected composition data. Then, TN information was extracted from the calculated TTP diagram and compared with the RA data. The deformation condition did not affect TN, therefore it was set to the same value as that of the high-Mn steel. To determine the correlation between the calculated TTP diagram—TN and the RA behavior, the RA behavior of five representative compositions among the collected 87 data were compared with the TTP diagram (Table 3, Figure 13) [24,35,36,41,42].
In contrast to high-Mn steels, which consist of a single austenite phase, carbon steel undergoes austenite-ferrite phase transformation during cooling. Therefore, the TTP curve is divided into two parts around the A3 temperature and has a discontinuous shape. In particular, the formation of proeutectoid ferrite has a greater effect than precipitation on the deterioration of hot ductility in carbon steel. The RA degradation temperature is closer to A3 than to the TTP nose (Figure 13).

4.2.2. Others

RA prediction is necessary to minimize cracks in the slab by avoiding the low-ductility temperature in the bending and unbending step during continuous casting. Previous RA prediction studies were performed on steels with RA behavior of U/V type [11,12] and N/W type [13]. However, in this study, a method to predict the RA of high-Mn steels with excellent high strength, high toughness, and formability was proposed. Studies to evaluate high-temperature properties were insufficient to guide actual production of high-Mn steels. Additional data collection and related studies must be conducted to generalize the RA prediction model developed here.
Even with the same composition in the collected RA data, the RA behavior and precipitation behavior are different depending on the experimental conditions such as solution TT and cooling rate. For example, the cooling rate affects the size of precipitates, and this size has a great influence on RA. However, these factors are not included in the current prediction model, which was derived from the precipitation behavior during isothermal holding, i.e., in the equilibrium state, so the model may not be applicable to a case that considers all experimental variables. Therefore, the model might or can be modified to include continuous cooling precipitation (CCT) in the non-equilibrium state.
The TTP diagram data used in this study are calculation-based, and it is necessary to investigate the accuracy of the TTP data through experiments. The current study applied the equilibrium state calculation, verification of the reliability is required by comparing the experimental result with the calculated data reflecting the conditions in the non-equilibrium state.
Four precipitation elements (Nb, Ti, V, Mo) were considered in the current model. However, in practice, the precipitate composition that affects RA in high-Mn steel is much more varied than the conditions considered here. In particular, the current model mainly considered the effect on carbide, with the nitrogen composition fixed, but nitrides such as AlN and TiN also affect the hot ductility of high-Mn steel. Therefore, changes in nitrogen composition should also be considered in future studies.
Finally, the current model can only extract the temperature at a point where the RA decreases. However, to be useful for the actual continuous-casting process, the model must use a range of temperatures to avoid during unbending, so data to predict the RA degradation range must be collected.

5. Conclusions

In this study, a DNN was used to develop a model that can predict the RA deterioration temperature by exploiting the relationship between the RA behavior and the TN at which precipitation rate is highest. The model is intended for use as a substitute for complex hot-ductility experiments.
The relationship between RA behavior and TN could be confirmed by comparing the hot ductility test for high-Mn steel that includes the precipitating elements V and Mo to the TTP diagram calculation results from J-matpro software (version 12). This relationship was used to propose a model that can predict the TN for various compositions of high-Mn steel using a DNN by extracting the TN for 1500 compositions of high-Mn steel in which the precipitation elements were expanded to include V, Mo, Nb, and Ti. The proposed DNN model had RMSE = 7.030 °C on the training data and 7.082 °C on the test data; i.e., error of the predicted value relative to the magnitude of TN (~850 °C) is ±7 °C, which indicates that the reliability of the prediction is very high. To verify the validity of the predictive model, measured RA of five high-Mn steels that represented each precipitation-element composition was compared with the RA degradation temperature obtained from the proposed prediction model. For all five steel grades, the temperature at which the RA deteriorates was consistent with the values predicted by the model.
The DNN model proposed in this study is currently applicable only to high-Mn steels, and the RA behavior should be predicted separately using other models for steel types with phase transformation such as carbon steel. Moreover, the model was developed from data obtained in the equilibrium state, so it must be extended to consider the non-equilibrium state. In addition, the model should be modified to consider additional precipitating elements that affect RA behavior.
To verify the accuracy of the TTP data obtained from calculation, investigation through experiments on high Mn steel is being designed, and related contents will be introduced in the next study.

Author Contributions

Conceptualization, D.-G.H. and C.-H.Y.; methodology, D.-G.H. and C.-H.Y.; software, D.-G.H.; validation, J.-Y.J.; formal analysis, D.-G.H. and J.-Y.J.; investigation, D.-G.H.; resources, J.-Y.J.; data curation, D.-G.H. and J.-Y.J.; writing—original draft preparation, J.-Y.J. and D.-G.H.; writing—review and editing, C.-H.Y.; visualization, J.-Y.J.; supervision, C.-H.Y.; project administration, C.-H.Y. All authors have read and agreed to the published version of the manuscript.

Funding

This research received no external funding.

Institutional Review Board Statement

Not applicable.

Informed Consent Statement

Not applicable.

Data Availability Statement

The datasets generated and/or analyzed during the current study are available from the corresponding author on reasonable request.

Conflicts of Interest

The authors declare no conflict of interest.

References

  1. Nachtrab, W.T.; Chou, Y.T. High temperature ductility loss in carbon-manganese and niobium-treated steels. Metall. Mater. Trans. A 1986, 17, 1995–2006. [Google Scholar] [CrossRef]
  2. Mintz, B.; Arrowsmith, J.M. Hot-ductility behaviour of C–Mn–Nb–Al steels and its relationship to crack propagation during the straightening of continuously cast strand. Metals Technol. 1979, 6, 24–32. [Google Scholar] [CrossRef]
  3. Thomas, B.G.; Brimacombe, J.K.; Samarasekera, I.V. The formation of panel cracks in steel ingots: A state-of-the-art review. ISS Trans. 1986, 7, 7–20. [Google Scholar]
  4. Mintz, B.; Yue, S.; Jonas, J.J. Hot ductility of steels and its relationship to the problem of transverse cracking during continuous casting. Int. Mater. Reviews 1991, 36, 187–220. [Google Scholar] [CrossRef]
  5. Spradbery, C.; Mintz, B. Influence of undercooling thermal cycle on hot ductility of C–Mn–Al–Ti and C–Mn–Al–Nb–Ti steels. Ironmak. Steelmak. 2005, 32, 319–324. [Google Scholar] [CrossRef]
  6. Liu, Q.; Zhang, X.; Wang, B.; Wang, B. Control technology of solidification and cooling in the process of continuous casting of steel. In Science Technology Casting Processes; InTech: London, UK, 2012; pp. 169–203. [Google Scholar]
  7. Sterjovski, Z.; Nolan, D.; Carpenter, K.R. Artificial neural networks for modelling the mechanical properties of steels in various applications. J. Mater. Process. Technol. 2005, 170, 536–544. [Google Scholar] [CrossRef]
  8. Choi, W.; Won, S.; Kim, G.S.; Kang, N. Artificial Neural Network Modelling of the Effect of Vanadium Addition on the Tensile Properties and Microstructure of High-Strength Tempcore Rebars. Materials 2022, 15, 3781. [Google Scholar] [CrossRef]
  9. Honysz, R. Modeling the chemical composition of ferritic stainless steels with the use of artificial neural networks. Metals 2021, 11, 724. [Google Scholar] [CrossRef]
  10. Churyumov, A.; Kazakova, A.; Churyumova, T. Modelling of the steel high-temperature deformation behaviour using artificial neural network. Metals 2022, 12, 447. [Google Scholar] [CrossRef]
  11. Hong, D.G.; Kwon, S.H.; Yim, C.H. Exploration of Machine Learning to Predict Hot Ductility of Cast Steel from Chemical Composition and Thermal Conditions. Met. Mater. Int. 2021, 27, 298–305. [Google Scholar] [CrossRef]
  12. Kwon, S.H.; Hong, D.G.; Yim, C.H. Prediction of hot ductility of steels from elemental composition and thermal history by deep neural networks. Ironmak. Steelmak. 2020, 47, 1176–1187. [Google Scholar] [CrossRef]
  13. Hong, D.G.; Kwon, S.H.; Yim, C.H. Hot Ductility Prediction Model of Cast Steel with Low-Temperature Transformed Structure during Continuous Casting. Materials 2022, 15, 3513. [Google Scholar] [CrossRef]
  14. Hamada, A.S.; Karjalainen, L.P. Hot ductility behaviour of high-Mn TWIP steels. Mater. Sci. Eng. A 2011, 528, 1819–1827. [Google Scholar] [CrossRef]
  15. Kang, S.E.; Kang, M.H.; Mintz, B. Influence of vanadium, boron and titanium on hot ductility of high Al, TWIP steels. Mater. Sci. Technol. 2021, 37, 42–58. [Google Scholar] [CrossRef]
  16. Radis, R.; Schwarz, S.; Zamberger, S.; Kozeschnik, E. AlN precipitation during isothermal annealing of ultra-low carbon steel. Steel Res. Int. 2011, 82, 905–910. [Google Scholar] [CrossRef]
  17. Lee, T.H.; Kim, S.J.; Takaki, S. Time-temperature-precipitation characteristics of high-nitrogen austenitic Fe− 18Cr− 18Mn− 2Mo− 0.9 N steel. Metall. Mater. Trans. A 2006, 37, 3445–3454. [Google Scholar] [CrossRef]
  18. Moon, J.; Lee, T.H.; Shin, J.H.; Lee, J.W. Hot working behavior of a nitrogen-alloyed Fe–18Mn–18Cr–N austenitic stainless steel. Mater. Sci. Eng. A 2014, 594, 302–308. [Google Scholar] [CrossRef]
  19. Crowther, D.N.; Mohamed, Z.; Mintz, B. Influence of micro-alloying additions on the hot ductility of steels heated directly to the test temperature. Trans. ISIJ 1987, 27, 366–375. [Google Scholar] [CrossRef]
  20. Jonas, J.J.; Weiss, I. Effect of precipitation on recrystallization in microalloyed steels. Metal Sci. 1979, 13, 238–245. [Google Scholar] [CrossRef]
  21. Crooks, M.J.; Garratt-Reed, A.J.; Vander Sande, J.B.; Owen, W.S. Precipitation and recrystallization in some vanadium and vanadium-niobium microalloyed steels. Metall. Trans. A. 1981, 12, 1999–2013. [Google Scholar] [CrossRef]
  22. Andrade, H.L.; Akben, M.G.; Jonas, J.J. Effect of molybdenum, niobium, and vanadium on static recovery and recrystallization and on solute strengthening in microalloyed steels. Metall. Trans. A. 1983, 14, 1967–1977. [Google Scholar] [CrossRef]
  23. Mintz, B.; Abushosha, R. Influence of vanadium on hot ductility of steel. Ironmak. Steelmak. 1993, 20, 445–452. [Google Scholar]
  24. Maehara, Y.; Ohmori, Y. The precipitation of A1N and NbC and the hot ductility of low carbon steels. Mater. Sci. Eng. 1984, 62, 109–119. [Google Scholar] [CrossRef]
  25. Cho, K. Study on the hot ductility of the B bearing steel and B precipitation behavior. Ph.D. Thesis, Pohang University of Science and Technology, Pohang, Korea, 2011. [Google Scholar]
  26. Hurtado-Delgado, E.; Morales, R.D. Hot ductility and fracture mechanisms of a C-Mn-Nb-Al steel. Metall. Mater. Trans. B 2001, 32, 919–927. [Google Scholar] [CrossRef]
  27. Mejía, I.; Salas-Reyes, A.E.; Bedolla-Jacuinde, A.; Calvo, J.; Cabrera, J.M. Effect of Nb and Mo on the hot ductility behavior of a high-manganese austenitic Fe–21Mn–1.3 Al–1.5 Si–0.5 C TWIP steel. Mater. Sci. Eng. A 2014, 616, 229–239. [Google Scholar] [CrossRef]
  28. Salas-Reyes, A.E.; Mejía, I.; Bedolla-Jacuinde, A.; Boulaajaj, A.; Calvo, J.; Cabrera, J.M. Hot ductility behavior of high-Mn austenitic Fe–22Mn–1.5 Al–1.5 Si–0.45 C TWIP steels microalloyed with Ti and V. Mater. Sci. Eng. A 2014, 611, 77–89. [Google Scholar] [CrossRef]
  29. Qaban, A.; Mintz, B.; Kang, S.E.; Naher, S. Hot ductility of high Al TWIP steels containing Nb and Nb-V. Mater. Sci. Technol. 2017, 33, 1645–1656. [Google Scholar] [CrossRef]
  30. Kang, S.E.; Banerjee, J.R.; Maina, E.M.; Mintz, B. Influence of B and Ti on hot ductility of high Al and high Al, Nb containing TWIP steels. Mater. Sci. Technol. 2013, 29, 1225–1232. [Google Scholar] [CrossRef]
  31. Kang, S.E.; Banerjee, J.R.; Tuling, A.S.; Mintz, B. Influence of B on hot ductility of high Al, TWIP steels. Mater. Sci. Technol. 2014, 30, 486–494. [Google Scholar] [CrossRef]
  32. Kang, S.E.; Tuling, A.; Lau, I.; Banerjee, J.R.; Mintz, B. The hot ductility of Nb/V containing high Al, TWIP steels. Mater. Sci. Technol. 2011, 27, 909–915. [Google Scholar] [CrossRef]
  33. Qian, G.; Cheng, G.; Hou, Z. Effect of the induced ferrite and precipitates of Nb–Ti bearing steel on the ductility of continuous casting slab. ISIJ Int. 2014, 54, 1611–1620. [Google Scholar] [CrossRef] [Green Version]
  34. Mohamed, Z. Hot ductility behavior of vanadium containing steels. Mater. Sci. Eng. A 2002, 326, 255–260. [Google Scholar] [CrossRef]
  35. Ouchi, C.; Matsumoto, K. Hot ductility in Nb-bearing high-strength low-alloy steels. Trans. ISIJ 1982, 22, 181–189. [Google Scholar] [CrossRef]
  36. Revaux, T.; Deprez, P.; Bricout, J.P.; Oudin, J. In situ solidified hot tensile test and hot ductility of some plain carbon steels and microalloyed steels. ISIJ Int. 1994, 34, 528–535. [Google Scholar] [CrossRef] [Green Version]
  37. Comineli, O.; Luo, H.; Liimatainen, H.M.; Karjalainen, L.P. Influence of Cu alloying on hot ductility of C-Mn-Al and Ti-Nb microalloyed steels. Rev. Metal. 2005, 41, 407. [Google Scholar] [CrossRef] [Green Version]
  38. AM, E.W.; Hassani, F.; Yue, S.; Es-Sadiqi, E.; LE, C.; Iqbal, K. The effect of thermal history on the hot ductility of microalloyed steels. ISIJ Int. 1999, 39, 253–262. [Google Scholar]
  39. Crowther, D.N.; Mohamed, Z.; Mintz, B. The relative influence of dynamic and static precipitation on the hot ductility of microalloyed steels. Metall. Trans. A 1987, 18, 1929–1939. [Google Scholar] [CrossRef]
  40. Hannerz, N.E. Critical hot plasticity and transverse cracking in continuous slab casting with particular reference to composition. Trans. ISIJ 1985, 25, 149–158. [Google Scholar] [CrossRef]
  41. Banks, K.M.; Tuling, A.S.; Mintz, B. Improved Simulation of Continuous Casting to Predict Transverse Corner Cracking in Microalloyed Steels. Int. J. Metall. Eng. 2013, 2, 188–197. [Google Scholar]
  42. Banks, K.M.; Tuling, A.; Mintz, B. Influence of thermal history on hot ductility of steel and its relationship to the problem of cracking in continuous casting. Mater. Sci. Technol. 2012, 28, 536–542. [Google Scholar] [CrossRef]
  43. Mohamed, Z. Hot Ductility of Steels. Ph.D. Thesis, City University London, London, UK, 1989. [Google Scholar]
  44. Lee, C. Effect of Boron and Alloying Elements on Hot Ductility of Nb-Ti Steel. Ph.D. Thesis, Hanyang University, Seoul, Korea, 2011. [Google Scholar]
  45. Abushosha, R.; Comineli, O.; Mintz, B. Influence of Ti on hot ductility of C–Mn–Al steels. Mater. Sci. Technol. 1999, 15, 278–286. [Google Scholar] [CrossRef]
  46. Cowley, A.; Abushosha, R.; Mintz, B. Influence of Ar3 and Ae3 temperatures on hot ductility of steels. Mater. Sci. Technol. 1998, 14, 1145–1153. [Google Scholar] [CrossRef]
  47. Abushosha, R.; Ayyad, S.; Mintz, B. Influence of cooling rate on hot ductility of C-Mn-AI and C-Mn-Nb-AL steels. Mater. Sci. Technol. 1998, 14, 346–351. [Google Scholar] [CrossRef]
  48. Cardoso, G.L.; Mintz, B.; Yue, S. Hot ductility of aluminium and titanium containing steels with and without cyclic temperature oscillations. Ironmak. Steelmak. 1995, 22, 365–377. [Google Scholar]
  49. Mintz, B.; Abushosha, R.; Crowther, D.N. Influence of small additions of copper and niekel on hot ductility of steels. Mater. Sci. Technol. 1995, 11, 474–481. [Google Scholar] [CrossRef]
  50. Mintz, B.; Abushosha, R. Effectiveness of hot tensile test in simulating straightening in continuous casting. Mater. Sci. Technol. 1992, 8, 171–178. [Google Scholar] [CrossRef]
  51. Abushosha, R.; Vipond, R.; Mintz, B. Influence of titanium on hot ductility of as cast steels. Mater. Sci. Technol. 1991, 7, 613–621. [Google Scholar] [CrossRef]
  52. Zhen, L.; Hongtao, Z.; Baorong, W. Effect of niobium on hot ductility of low C-Mn-steel under continuous casting simulation conditions. Steel Res. Int. 1990, 61, 620–623. [Google Scholar] [CrossRef]
  53. Sricharoenchai, P.; Nagasaki, C.; Kihara, J. Hot ductility of high purity steels containing niobium. ISIJ Int. 1992, 32, 1102–1109. [Google Scholar] [CrossRef] [Green Version]
  54. Cowley, A. Hot ductility and its relationship to transverse cracking in steels. Ph.D. Thesis, City University London, London, UK, 2004. [Google Scholar]
  55. Mintz, B.; Mohamed, Z. Intergranular failure in micro-alloyed steels and its relationship to carbon content. ICF 7. Adv. Fract. Res. 1989, 4, 2545–2553. [Google Scholar]
  56. Mintz, B.; Tuling, A.; Delgado, A. Influence of silicon, aluminium, phosphorus and boron on hot ductility of Transformation Induced Plasticity assisted steels. Mater. Sci. Technol. 2003, 19, 1721–1726. [Google Scholar] [CrossRef]
  57. Zhao, X.; Gan, B.; Zhang, M.; Zhong, Y.; Hou, M.; Li, L. Hot Ductility of Ti/Nb-added 800MPa Grade Weathering Steel. In International Conference on Advanced Engineering Materials and Technology; Atlantis Press: Amsterdam, The Netherlands, 2015. [Google Scholar]
Figure 1. Schematic illustration of thermal history for hot ductility test.
Metals 12 01689 g001
Figure 2. Hot ductility curve with various V and Mo composition.
Metals 12 01689 g002
Figure 3. EBSD inverse pole figure (IPF) image of image of the specimen after hot ductility test; (a,d) Steel ref, (b,e) Steel A, and (c,f) Steel B at (ac) TT = 800 °C and (df) TT = 900 °C. (d-1) and (e-1) are high magnification images of (d) and (e), respectively.
Metals 12 01689 g003
Figure 4. FE-SEM images of fracture surfaces; (a,d) Steel ref, (b,e) Steel A, and (c,f) Steel B at (ac) at TT = 800 °C and (df) TT = 900 °C.
Metals 12 01689 g004
Figure 5. EPMA vanadium maps of the cross-section of the fractured specimen at TT = 800 °C; (a) Steel A, (b) Steel B.
Metals 12 01689 g005
Figure 6. (a) Time-temperature-precipitation (TTP) and (b) precipitate fraction diagram of different V and Mo composition, as calculated using J-MatPro software.
Metals 12 01689 g006
Figure 7. Engineering stress-strain curves at TT = 900 °C of Steel ref, A, and B Steel.
Metals 12 01689 g007
Figure 8. Neural network architecture for predicting nose temperature.
Metals 12 01689 g008
Figure 9. A prediction result of nose temperature with two datasets. (a) training, (b) evaluation.
Metals 12 01689 g009
Figure 10. The comparison of prediction model results and reduction of area curves; (a) Steel A, (b) Steel B, (c) Steel C; (dashed line: calculated TTP diagram from J-matpro, square point: reduction of area and red dot: TTP nose from prediction model).
Metals 12 01689 g010
Figure 11. Comparison of nose temperatures with reference compositions.
Metals 12 01689 g011
Figure 12. Comparison of model predictions and reduction-of-area results; (a) low Nb, (b) high Nb, (c) V, (d) Nb-Ti, (e) Nb-V; (dashed line: calculated TTP diagram from J-matpro, square point: reduction of area and red dot: TTP TN from prediction model).
Metals 12 01689 g012
Figure 13. Comparison of model prediction and reduction-of-area results; (a) Nb, (b) Nb-Ti, (c) Nb-V, (d) Nb-V-Ti, (e) Nb-Ti-Mo; (dashed line: calculated TTP diagram from J-matpro, square point: reduction of area and red dot: TTP nose from prediction model).
Metals 12 01689 g013
Table 1. Chemical composition (wt.%) of high-Mn steels for hot ductility test.
CodeElement
CSiMnPSAlVMoNFe
Steel ref.0.90.01913.80.0130.0010.03--0.007bal.
Steel A0.90.01714.00.0140.0020.010.30.30.006bal.
Steel B0.90.01914.00.0140.0010.020.5-0.006bal.
Steel C0.80.01023.00.0150.0030.010.50.10.005bal.
Table 2. Chemical composition (wt.%) of high-Mn steels from reference data.
GradeCMnNbVTiReference Number
Low-Nb0.617.80.02--14
High-Nb0.520.90.083--27
V0.5621.2-0.11-31
28
Nb-Ti0.618.00.032-0.07529
Nb-V0.6117.740.0320.1-32
Table 3. Chemical composition (wt.%) of carbon steels from reference data.
GradeCMnNbVTiMoReference Number
Nb 0.211.570.055---24
Nb-Ti0.031.60.031-0.013-41
Nb-V0.111.3670.0340.003--36
Nb-V-Ti0.1261.490.0380.0280.038-42
Nb-Ti-Mo0.121.380.037-0.0180.1335
Publisher’s Note: MDPI stays neutral with regard to jurisdictional claims in published maps and institutional affiliations.

