A New Experimental Study and SPH Comparison for the Sequential Dam-Break Problem


Department of Civil Engineering, Iskenderun Technical University, 31200 Iskenderun, Turkey
*
Author to whom correspondence should be addressed.
J. Mar. Sci. Eng. 2020, 8(11), 905; https://doi.org/10.3390/jmse8110905
Submission received: 8 October 2020
/
Revised: 3 November 2020
/
Accepted: 5 November 2020
/
Published: 11 November 2020
(This article belongs to the Special Issue Experiments and Numerical Analysis of Flow)
Abstract
:The floods following the event of a dam collapse can have a significant impact on the downstream environment and ecology. Due to the limited number of real-case data for dam-break floods, laboratory experiments and numerical models are used to understand the complex flow behavior and to analyze the impact of the dam-break wave for different scenarios. In this study, a newly designed experimental campaign was conducted for the sequential dam-break problem in a rectangular channel with a steep slope, and the obtained results were compared against those of a particle-based numerical model. The laboratory tests permitted a better understanding of the physical process, highlighting five successive stages observed in the downstream reservoirs: dam-break wave propagation, overtopping, reflection wave, run-up, and oscillations. Experimental data were acquired using a virtual wave probe based on an image processing technique. A professional camera and a smartphone camera were used to obtain the footage of the experiment to examine the effect of the resolution and frame rate on image processing. The numerical results were obtained through the Smoothed Particle Hydrodynamics (SPH) method using free DualSPHysics software. The experimental and numerical results were in good agreement generally. Hence, the presented data can be used as a benchmark in future studies to validate the SPH and other Computational Fluid Dynamics (CFD) methods.
1. Introduction
A large volume of water is stored in the dam reservoirs. Therefore, the reservoirs pose risks for the settlements located downstream. The flood caused by a dam-break is a great disaster and causes losses of lives and properties. Also, as in Brazil in 2019, an environmental disaster may occur in case of a dam-break in the tailings dam. It is important to hydraulically investigate the dam-break problem to determine the flooded areas downstream as well as the the flood times, and to develop early warning systems, in order to minimize life loss and property damage.
Dam-break phenomena were investigated analytically earlier for dry and wet bed cases [1,2]. Then, Shallow Water Equations (SWEs) models based on the assumptions of neglectable vertical accelerations and assuming a hydrostatic pressure distribution were widely used to simulate the dam-break flow [3,4,5,6]. SWEs are probably still the most common approach in practical dam-break flood analysis, especially as large-scale problems can be solved more quickly [7,8]. However, with the advances in computer technology, numerical analysis can be performed using Computational Fluid Dynamics (CFD) models, solving Reynolds Averaged Navier Stokes (RANS) equations with turbulence models as well [9,10,11,12,13]. When details are requested in large-scale problems, solving the problem with RANS is quite time-consuming. Also, the Smoothed Particle Hydrodynamics (SPH) method has become popular and is one of the numerical methods most often referred to in the subjects of hydraulics research, such as sediment flow [14,15] and coastal engineering [16,17], sloshing [18], propagation of water waves [19], and wave impact [20].
The SPH method was developed to examine astrophysics in the 1970s [21] and it is still being improved. The method is popular at present for free-surface problems [22,23]. The dam-break problem too was investigated employing SPH in many studies [24,25].
Dams are sometimes built along the river sequentially. As an example, four and five dams were built along the Dicle and Fırat Rivers, respectively, located in the southeast of Turkey. Hence, in case the dam-break occurs, the dams located downstream and their reservoirs are possibly affected. For example, thousands of people lost their lives in the Banqiao dam-break disaster in China in 1975. Especially in the event of a dam-break on mountainous rivers, large flow velocities and large impact force occur due to steep bed slopes. This situation increases the risk of collapse of dams that are built successively in these regions and might cause catastrophic disasters. There are few studies, both experimental and numerical, on sequential dam-break flow [26,27,28,29,30]. Small-scale experimental studies related to the dam-break problem are always significant to understand the flood wave behaviors for different conditions, due to the absence of real-case cases. Thus, dam-break flows can be investigated through small-scale laboratory experiments [31,32].
Experimental research on the dam-break problem can also help to understand the behavior of tsunami wave propagation in the oceans and the impact of the tsunami wave on the coastal region. A dam-break wave can be considered as an imitation of a tsunami hydraulic bore, and experimentally it was usually simulated by the abrupt removal of a plate. Analogies between a dam-break induced wave and a tsunami-induced bore were previously investigated by various researchers [33,34,35]. Wave formation and propagation behavior for a sequential dam-break will have some similarities with landslide-induced tsunami waves. Therefore, these experimental studies on dam-breaks and tsunamis are also crucial to validate numerical models for free surface flows due to extremely rapid changes in flow depth and velocity.
In this study, experimental and numerical results were analyzed comparatively for a sequential dam-break problem with a steep bed slope. The analysis was made using water level-time curves. The numerical results were obtained through the SPH method, while the experimental ones wee obtained via a virtual wave probe based on an image processing technique. In addition, two different cameras with different resolutions and frame rates were used to test the measurement capabilities of the cameras and to examine the dam break, which is one of the most complex free surface problems in the hydraulic field. A newly designed and idealized experimental setup having consecutive twin reservoirs with no space in between was considered. Therefore, this paper can represent a case study, the sequential dam-break flow, for future researchers that investigate the SPH and CFD, providing data useful to validate numerical models for unsteady free surface flows based on SPH, VOF, level set methods, etc.
2. Materials and Methods
2.1. Experimental Set-Up
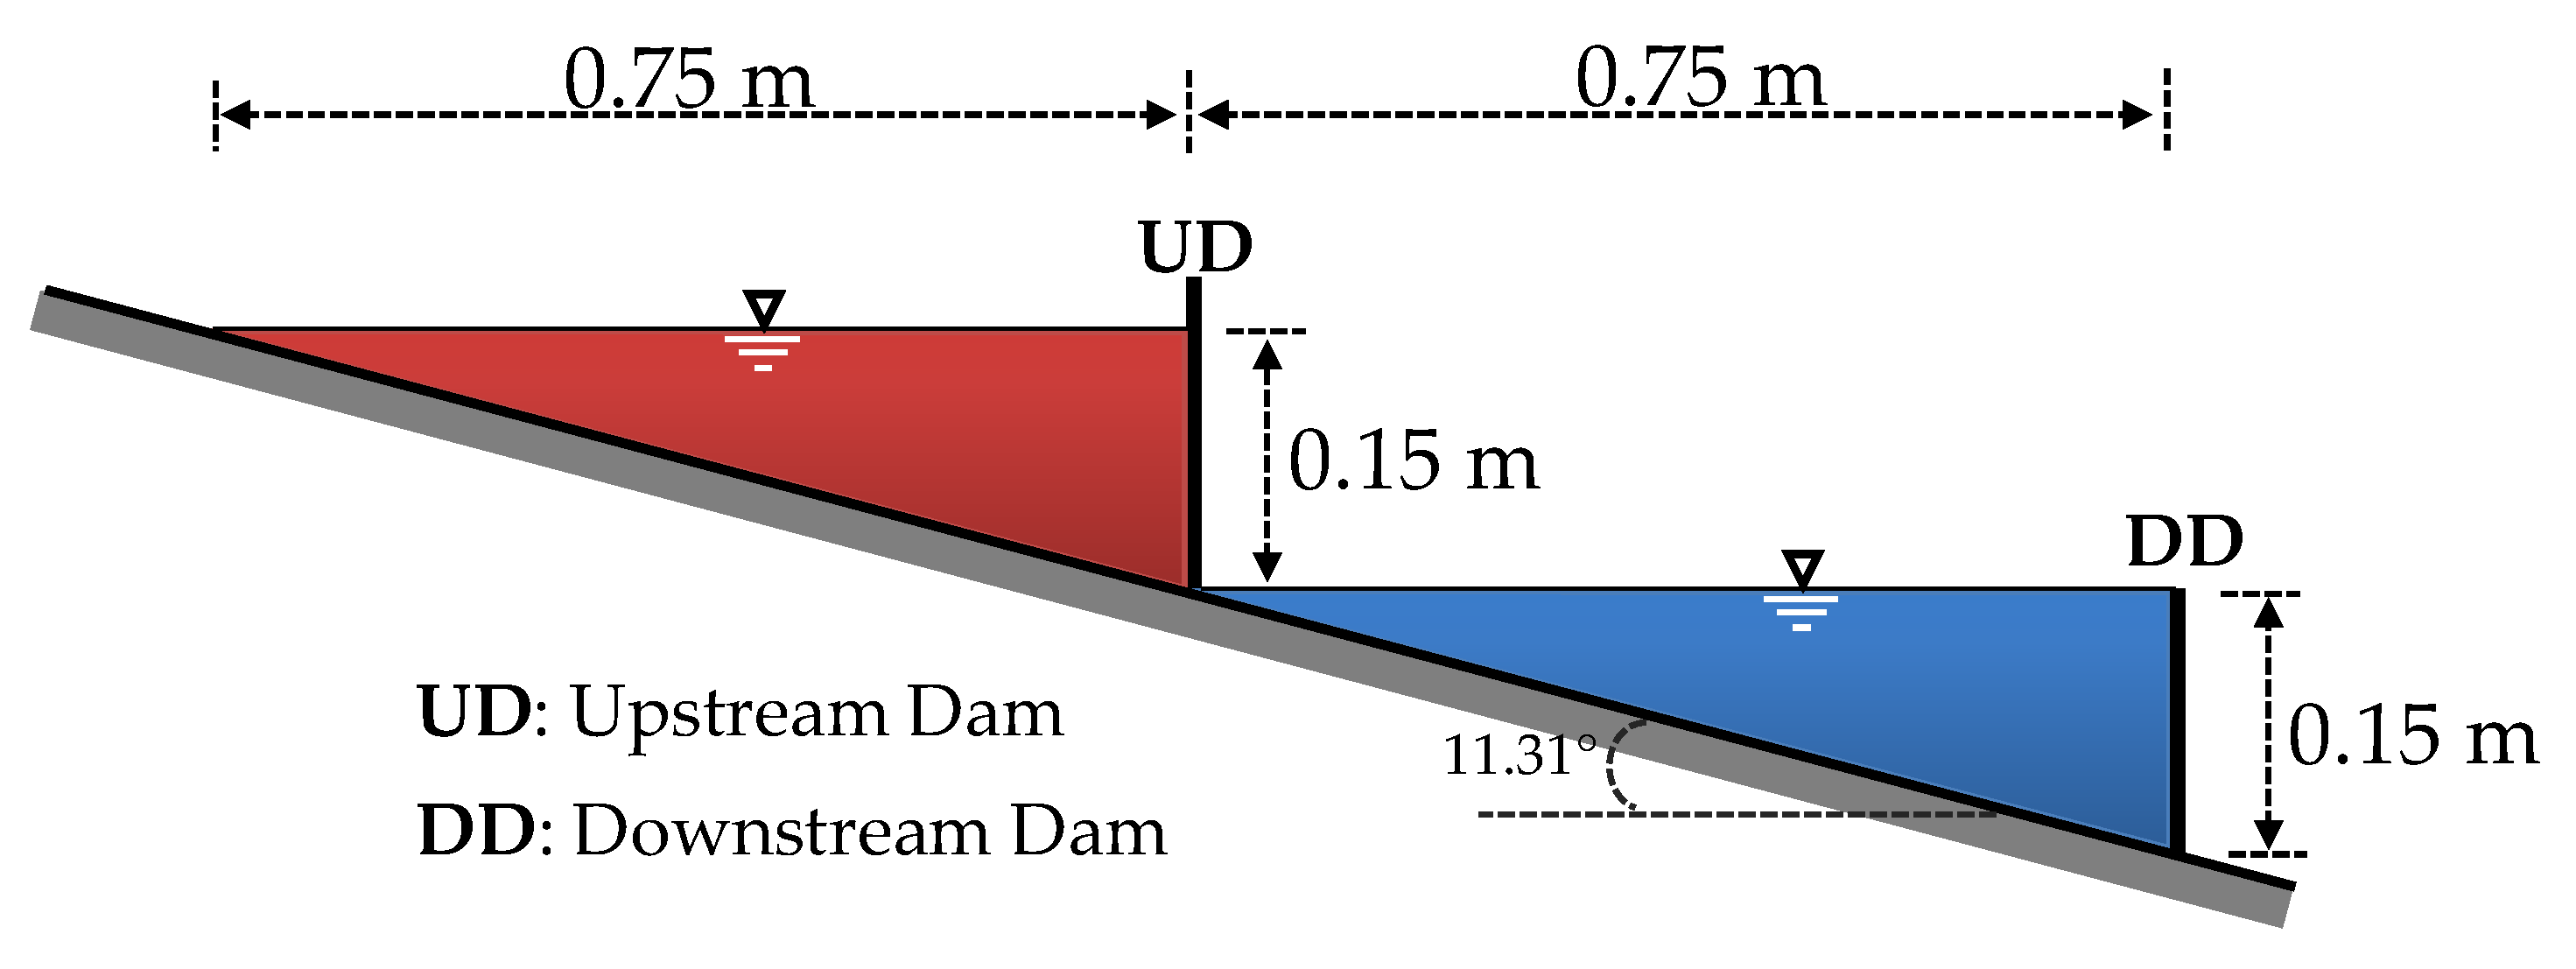
The experimental study was conducted in the Civil Engineering Hydraulics Laboratory of the Iskenderun Technical University. The setup was designed and manufactured by the authors. Dimensions of the channel are 2.50 m, 0.15 m, and 0.25 m (length, height and width, respectively). The bottom slope of the channel was adjusted as 1/5 (11.31°). The bottom and lateral surfaces of the channel were made of glass. The test setup is shown in Figure 1 [30].
Two twin reservoirs of equal size without a gap in between were considered. In this study, this idealized sequential dam-break set-up can be considered as a representation of dams built on mountainous rivers with a steep bed slope. The upstream dam was a rigid moving plate with a thickness of 0.4 cm. A steel rope was tied to the plate while a weight of approximately 10 kg was tied to the other end. The plate was removed instantaneously owing to free-falling weight from 1.50 m above the floor. Grease oil was used between the plate and the glass walls to prevent leakage. The downstream dam is a plate fixed to the channel. The plate is made of plexiglass and is 0.5 cm thick. Red and blue food dyes were added to the water to observe the pattern and behavior of the dam-break flow.
Experimental results were achieved using an image processing technique. The flow behavior was recorded by using two different cameras. Due to the sudden changes in the water level and high propagation velocity of the dam-break wave, experiments should be carried out using the high definition and high shutter speed cameras in order to provide detailed and accurate data. In this study, instead of industrial cameras, two easily accessible cameras with different resolutions and frame rates were used for the frame acquisition during the tests. Some specifications of the cameras are given in Table 1. The experiments were recorded by Camera-1 and Camera-2 simultaneously. In this way, the effect of the change of the camera properties, such as resolution and frame rate, on the experimental results was investigated and experimental data were verified using two different cameras.
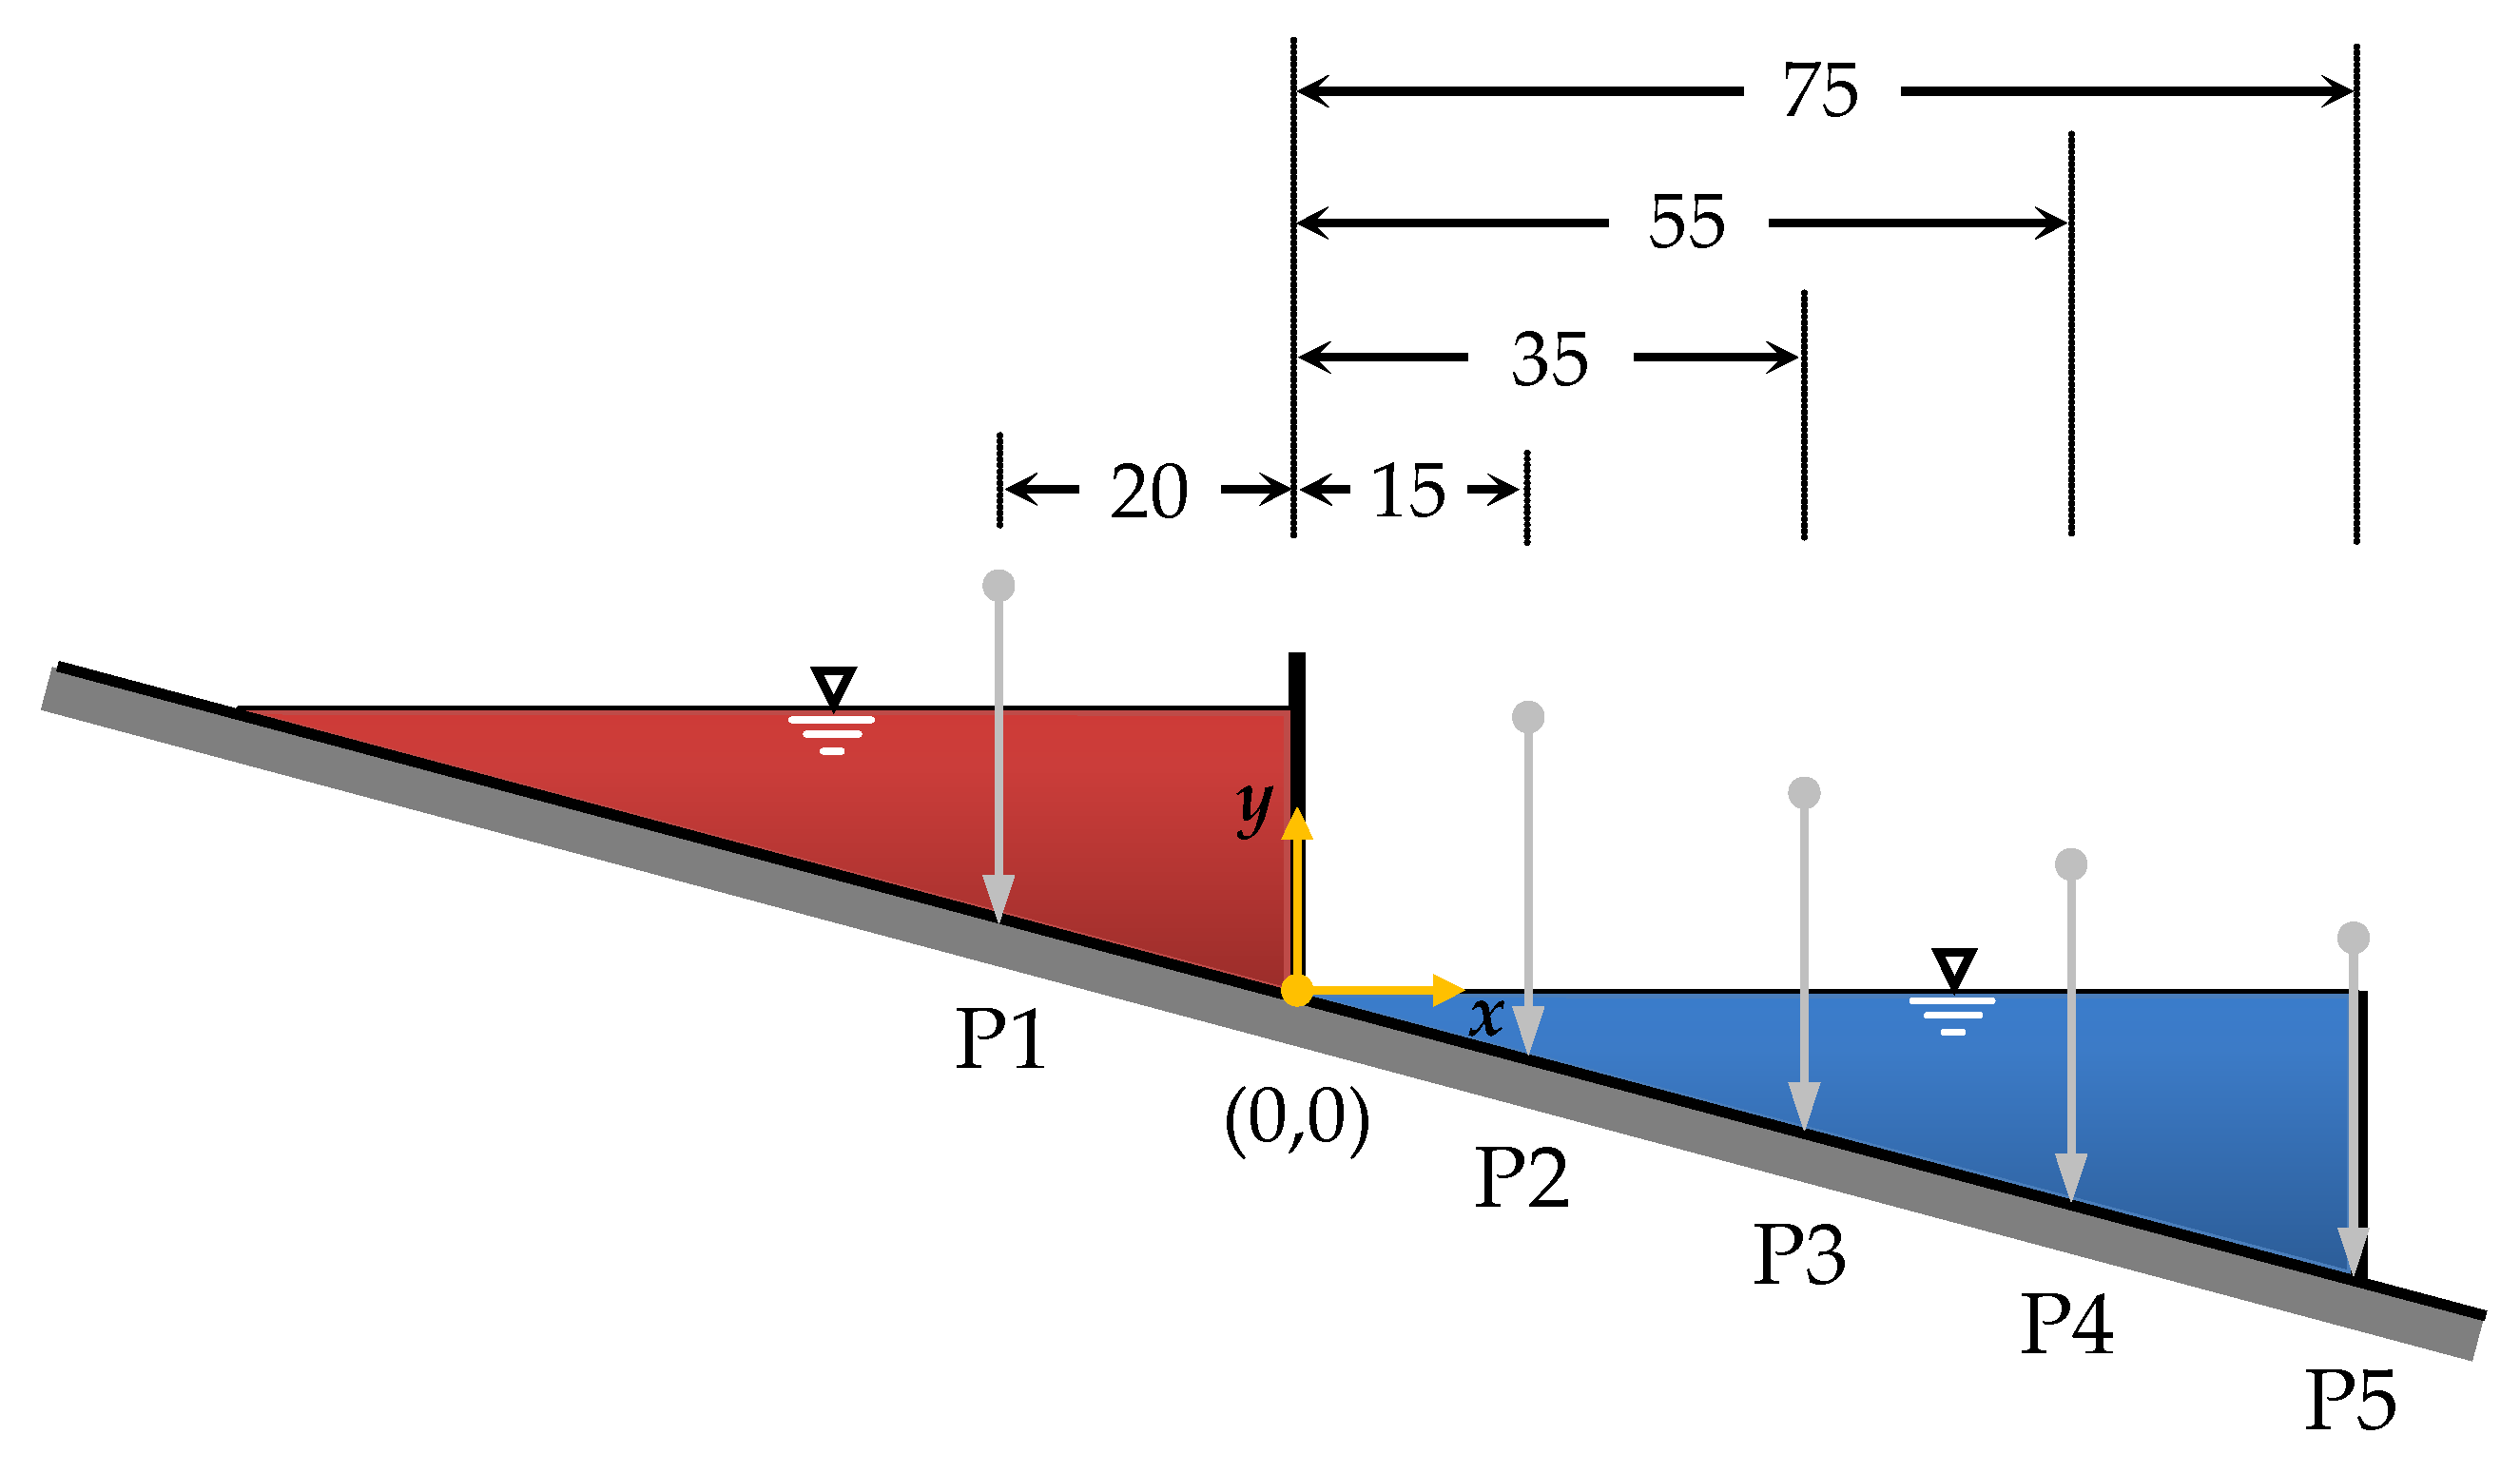
Camera-1 records with an acquisition rate of 120 frames per second (fps) and resolution of 1280 × 720 pixels (also known as HD: High Definition), whereas Camera-2 records at 50 fps and 1920 × 1080 pixels (also known as Full HD). The lighting system also plays a crucial role in image processing to create a good enough image for inspection and measurement. Prior to experiments, lighting conditions were tested and good quality records were obtained in daylight without additional lighting equipment. Therefore, the experiments were performed in daylight conditions. The records were transferred to the computer from cameras. Then image processing was applied using a software that was developed by Kocaman [36]. This method has been successfully applied in different experimental studies on dam breaks to determine the time-dependent variations of the water level at a fixed point. [10,13,37,38,39]. Five measurement points were selected to obtain water level-time variations using the virtual wave probe in the study. Locations of the points are shown in Figure 2.
2.2. Calibration Process
Measuring from an image requires attention and many factors affect the results, such as resolution, color values, radial and tangent distortions, etc. The distortions can be removed by calibration, i.e., optimizing those factors to obtain the best results. There are a few calibration types that should be considered before the measurements, such as angular calibration, perspective calibration, calibration due to camera position, and metric calibration. Before the experiment, in the preliminary phase, records were reviewed and no significant angular and perspective distortions were observed owing to advanced camera lens technology. Therefore, angular and perspective calibrations were not applied in the present study unlike some previous studies [37,40].
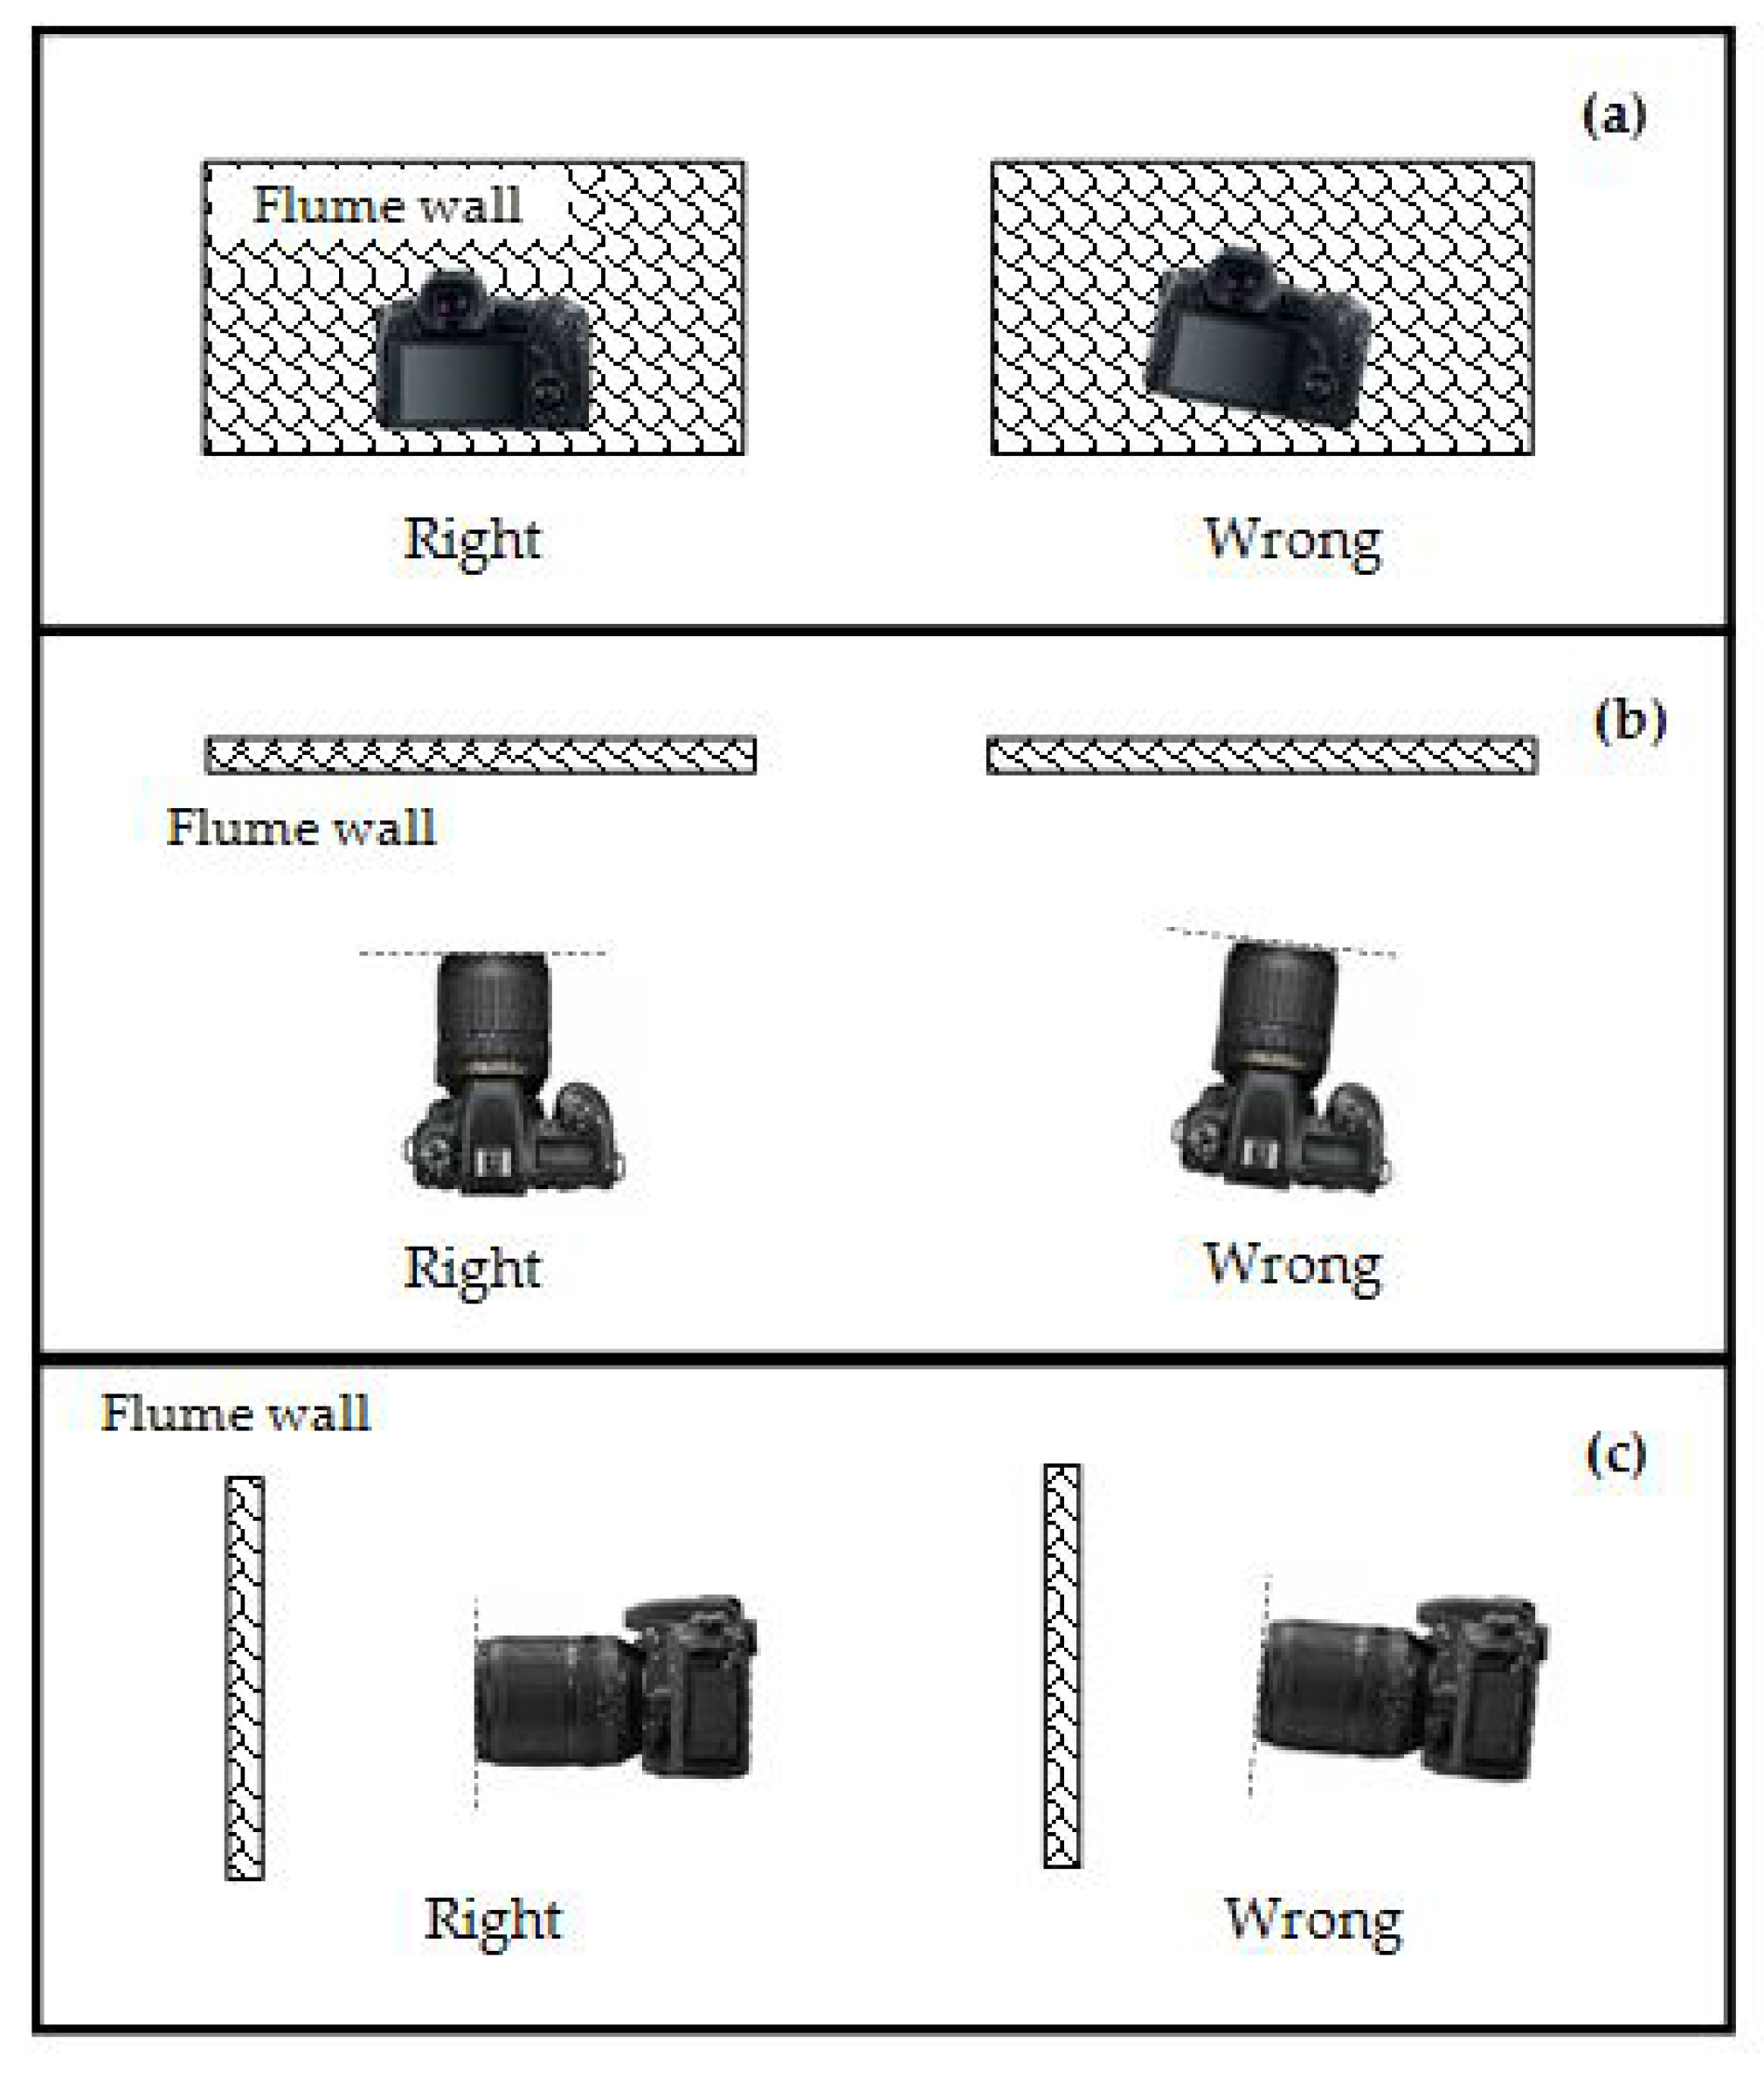
The calibration due to camera position was achieved using a spirit level available on the tripods. Also, cameras were placed parallel to the test setup in both vertical and horizontal planes to provide the calibration. It is necessary to ensure that the plane of the camera sensor and the plane of the channel wall are completely parallel from all angles to obtain an accurate measurement from the video images. Shooting errors due to camera positions are represented in Figure 3. If the camera is placed incorrectly as in Figure 3a, a rotated image will be obtained. However, misplacement of the camera as in Figure 3b,c will result in a perspective view, and although it is actually the same, one side of the channel appears long and the other side short in the image from right to left or top to bottom, vice versa. Although these shooting errors that cause distortions in the image can be resolved later in the computer environment using image processing techniques, they are very time-consuming. Therefore, the correct placement of the cameras is very important at the beginning of the experiment. These problems in the front and side view shown in Figure 3a,c were easily solved by correct positioning of the cameras using a spirit level. The proper placement of the camera as in Figure 3b was achieved with the help of the gridlines on the camera. Most cameras now have the ability to overlay lines on the screen before capturing images. These are called grids or gridlines and do not appear in recorded images. This camera positioning can be done easily by matching the gridlines on the camera with the reference points or lines on the channel such as the channel frame.
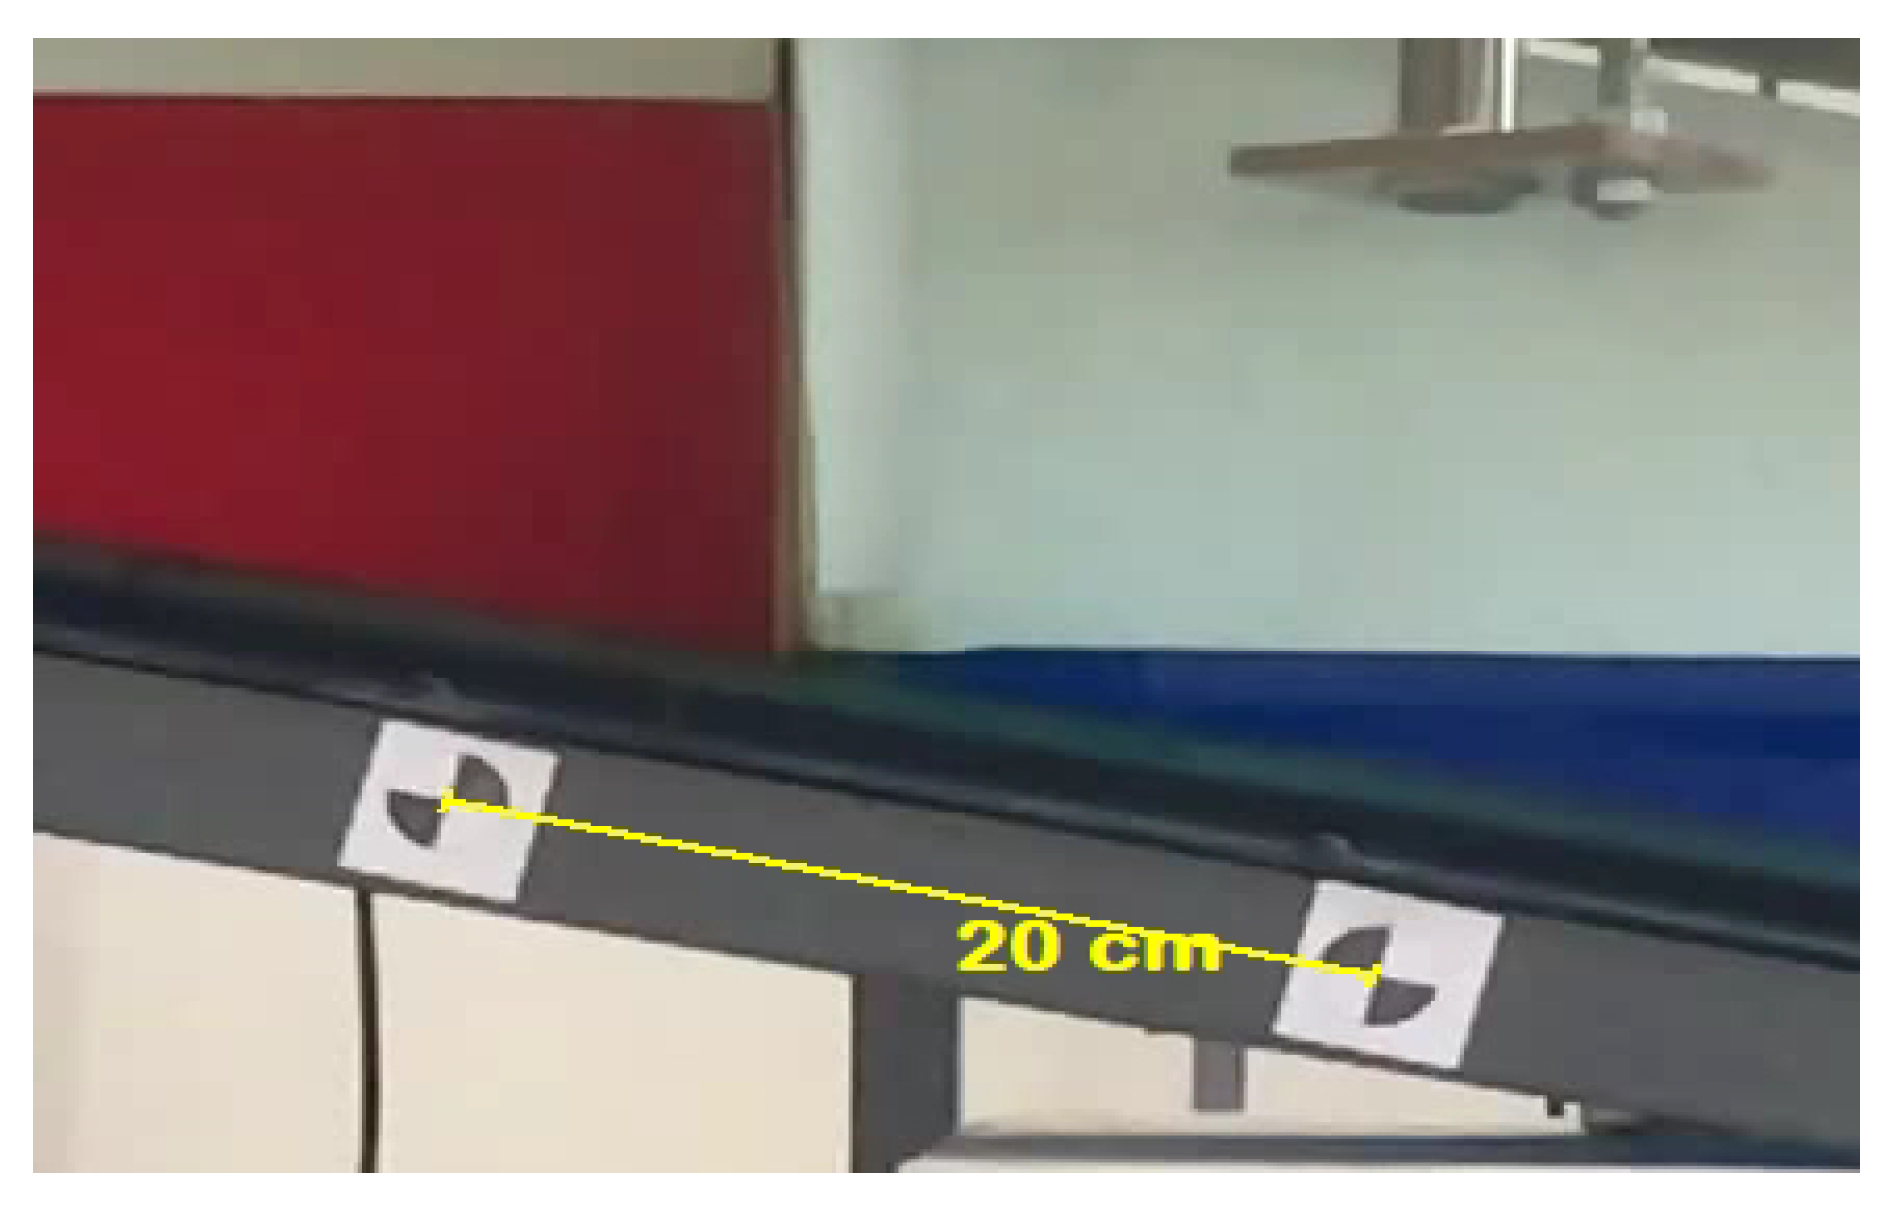
An image is made by pixels. Pixels are the smallest unit of the image. The actual length of an object can be determined after metric calibration in case pixel dimensions are known. To measure the dimensions of an object, the image should include a reference length, which is measured as the pixel unit and then the measurement is converted to the metric unit proportionally. White and black quarter-circle markers were used as the reference length in this study (Figure 4). A contrast was created using white and black colors to define the center of the circles easily for image processing. Also, a 20 cm gap was left between the centers of each circle as the reference length.
2.3. Obtaining the Water Level-Time Curves
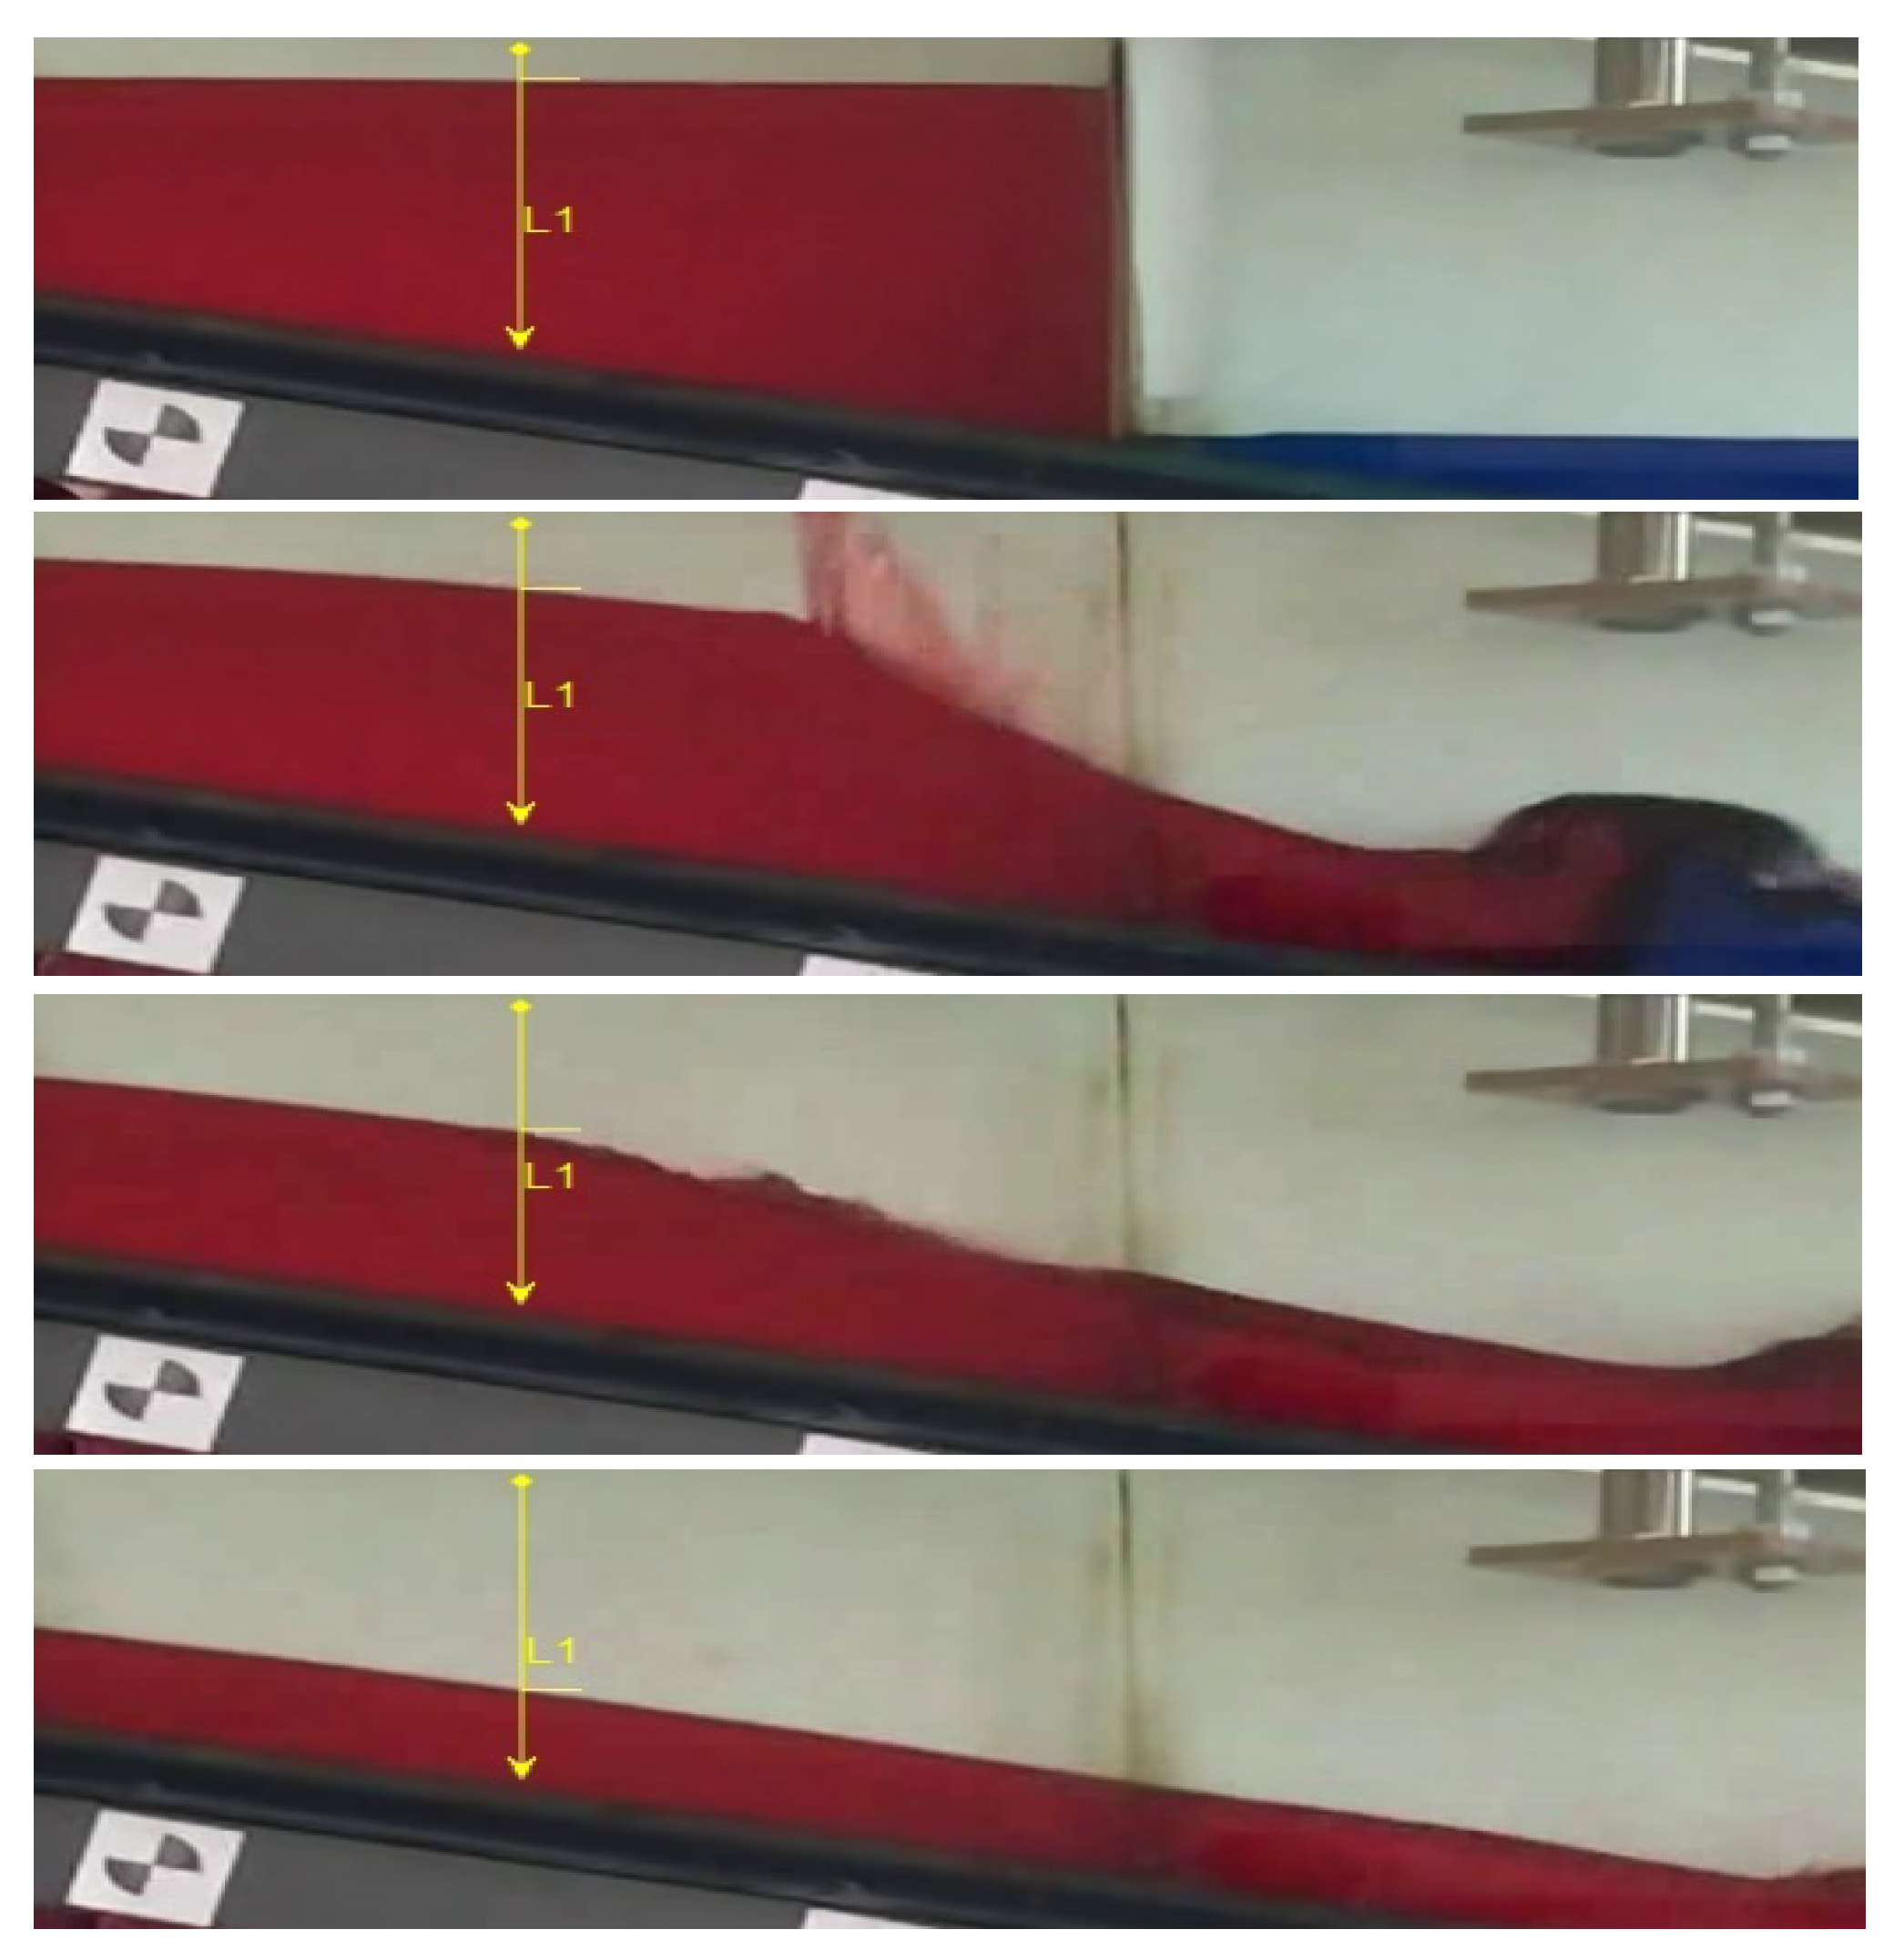
Water level-time curves were obtained using a virtual wave probe method, developed by Kocaman [36], a code utilizing the edge recognition and filter functions in the image processing software. In general, the software determines the water level considering the surface of the water (water–air interface) that contrasts with the background color. The software creates a virtual probe as shown in Figure 5 that defines the interface for each frame of the video record consecutively and so the time evolution of the water level at a certain probe is easily obtained.
2.4. Numerical Solution
In this study, the open-source software DualSPHysics was used for the numerical analysis based on the SPH method. The software is able to analyze the hydraulic problems for free-surface flows such as dam break and tsunami by employing graphical processing units (GPU) to accelerate the solution [41]. Components of the system such as fluids and solid bodies are defined using particles. Neighboring particles interact with each other depending on a smoothing length (h). The communication between the neighboring particles is calculated through a kernel function (W) which is related to the smoothing length. The interaction occurs in a circular area and the size of the area associates with the smoothing length. Also, the interaction cannot form out of the area. Depending on the smoothing length, physical quantities such as location, pressure, density, etc., are determined via interpolation.
3. Results and Discussion
3.1. General Overview of the Initial and Development Stages of the Experiment
This study was aimed at investigating the flow behaviors for the sequential dam-break problem, and at testing the SPH-based numerical methods and measurement techniques under these challenging conditions. The results of using steep slope were interpreted in this section in terms of the flow and wave characteristics.
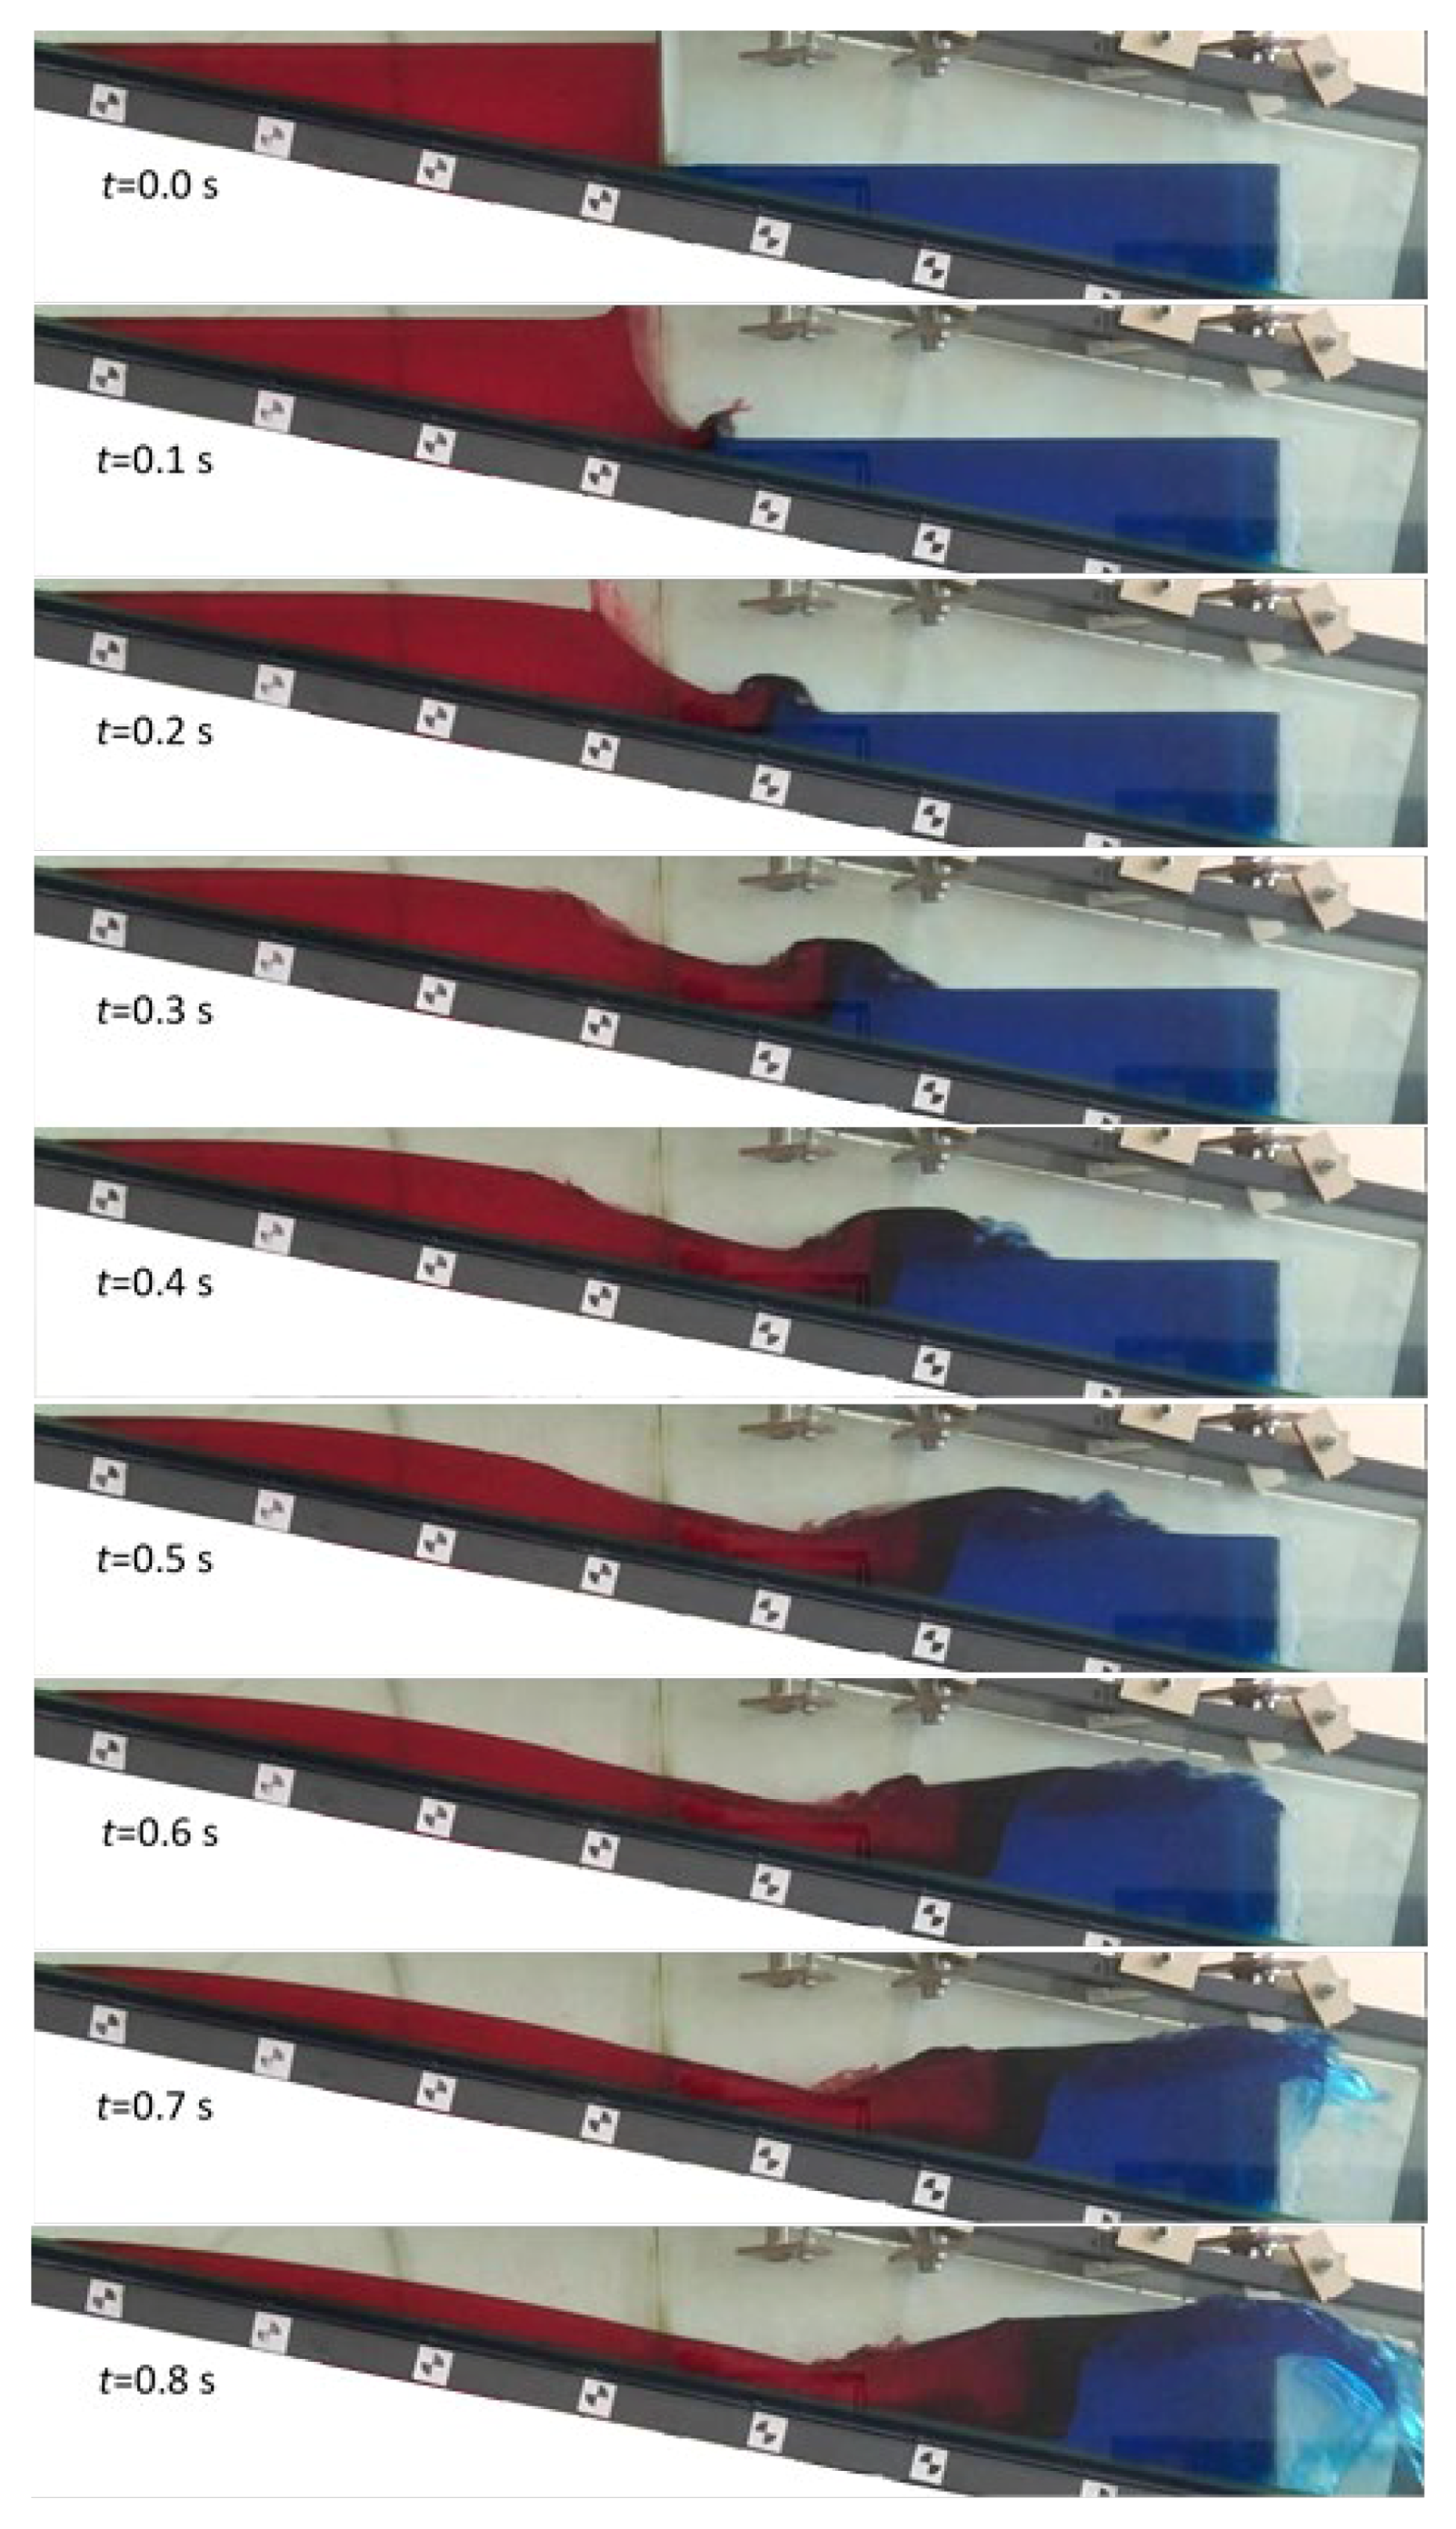
A dam-break flood wave was created by the sudden removal of the vertical plate representing the upstream dam. In the experiments, five successive stages were observed for the sequential dam-break: (I) propagation of the flood wave in the downstream reservoir, (II) overflow of the flood wave over the fixed downstream dam, (III) formation of a reflected wave due to a downstream dam, (IV) formation of run-up at the upstream end, (V) small oscillations in the downstream reservoir until it reaches a steady-state condition. These experimental results of the sequential dam-break in the inclined channel are shown in Figure 6 and Figure 7. In Figure 6, the fluid in the upstream dam moves downward with the instantaneous removal of the gate (t = 0.1–0.3 s). The dam-break flood wave flows rapidly into the downstream reservoir. Due to the steep bed slope, the upstream reservoir empties very quickly. The water in the downstream reservoir resists the incoming flood wave. However, as the flood wave hits the downstream water, it drives the water volume downstream. Propagation of the upstream fluid, confluent area, and overflowing on the downstream reservoir are seen easily owing to different colors (t = 0.4–0.8 s). Also, a plunging wave breaking (t = 0.1–0.2 s) and overflowing on the downstream dam with sharp-crested weir behavior is observed (t = 0.8 s).
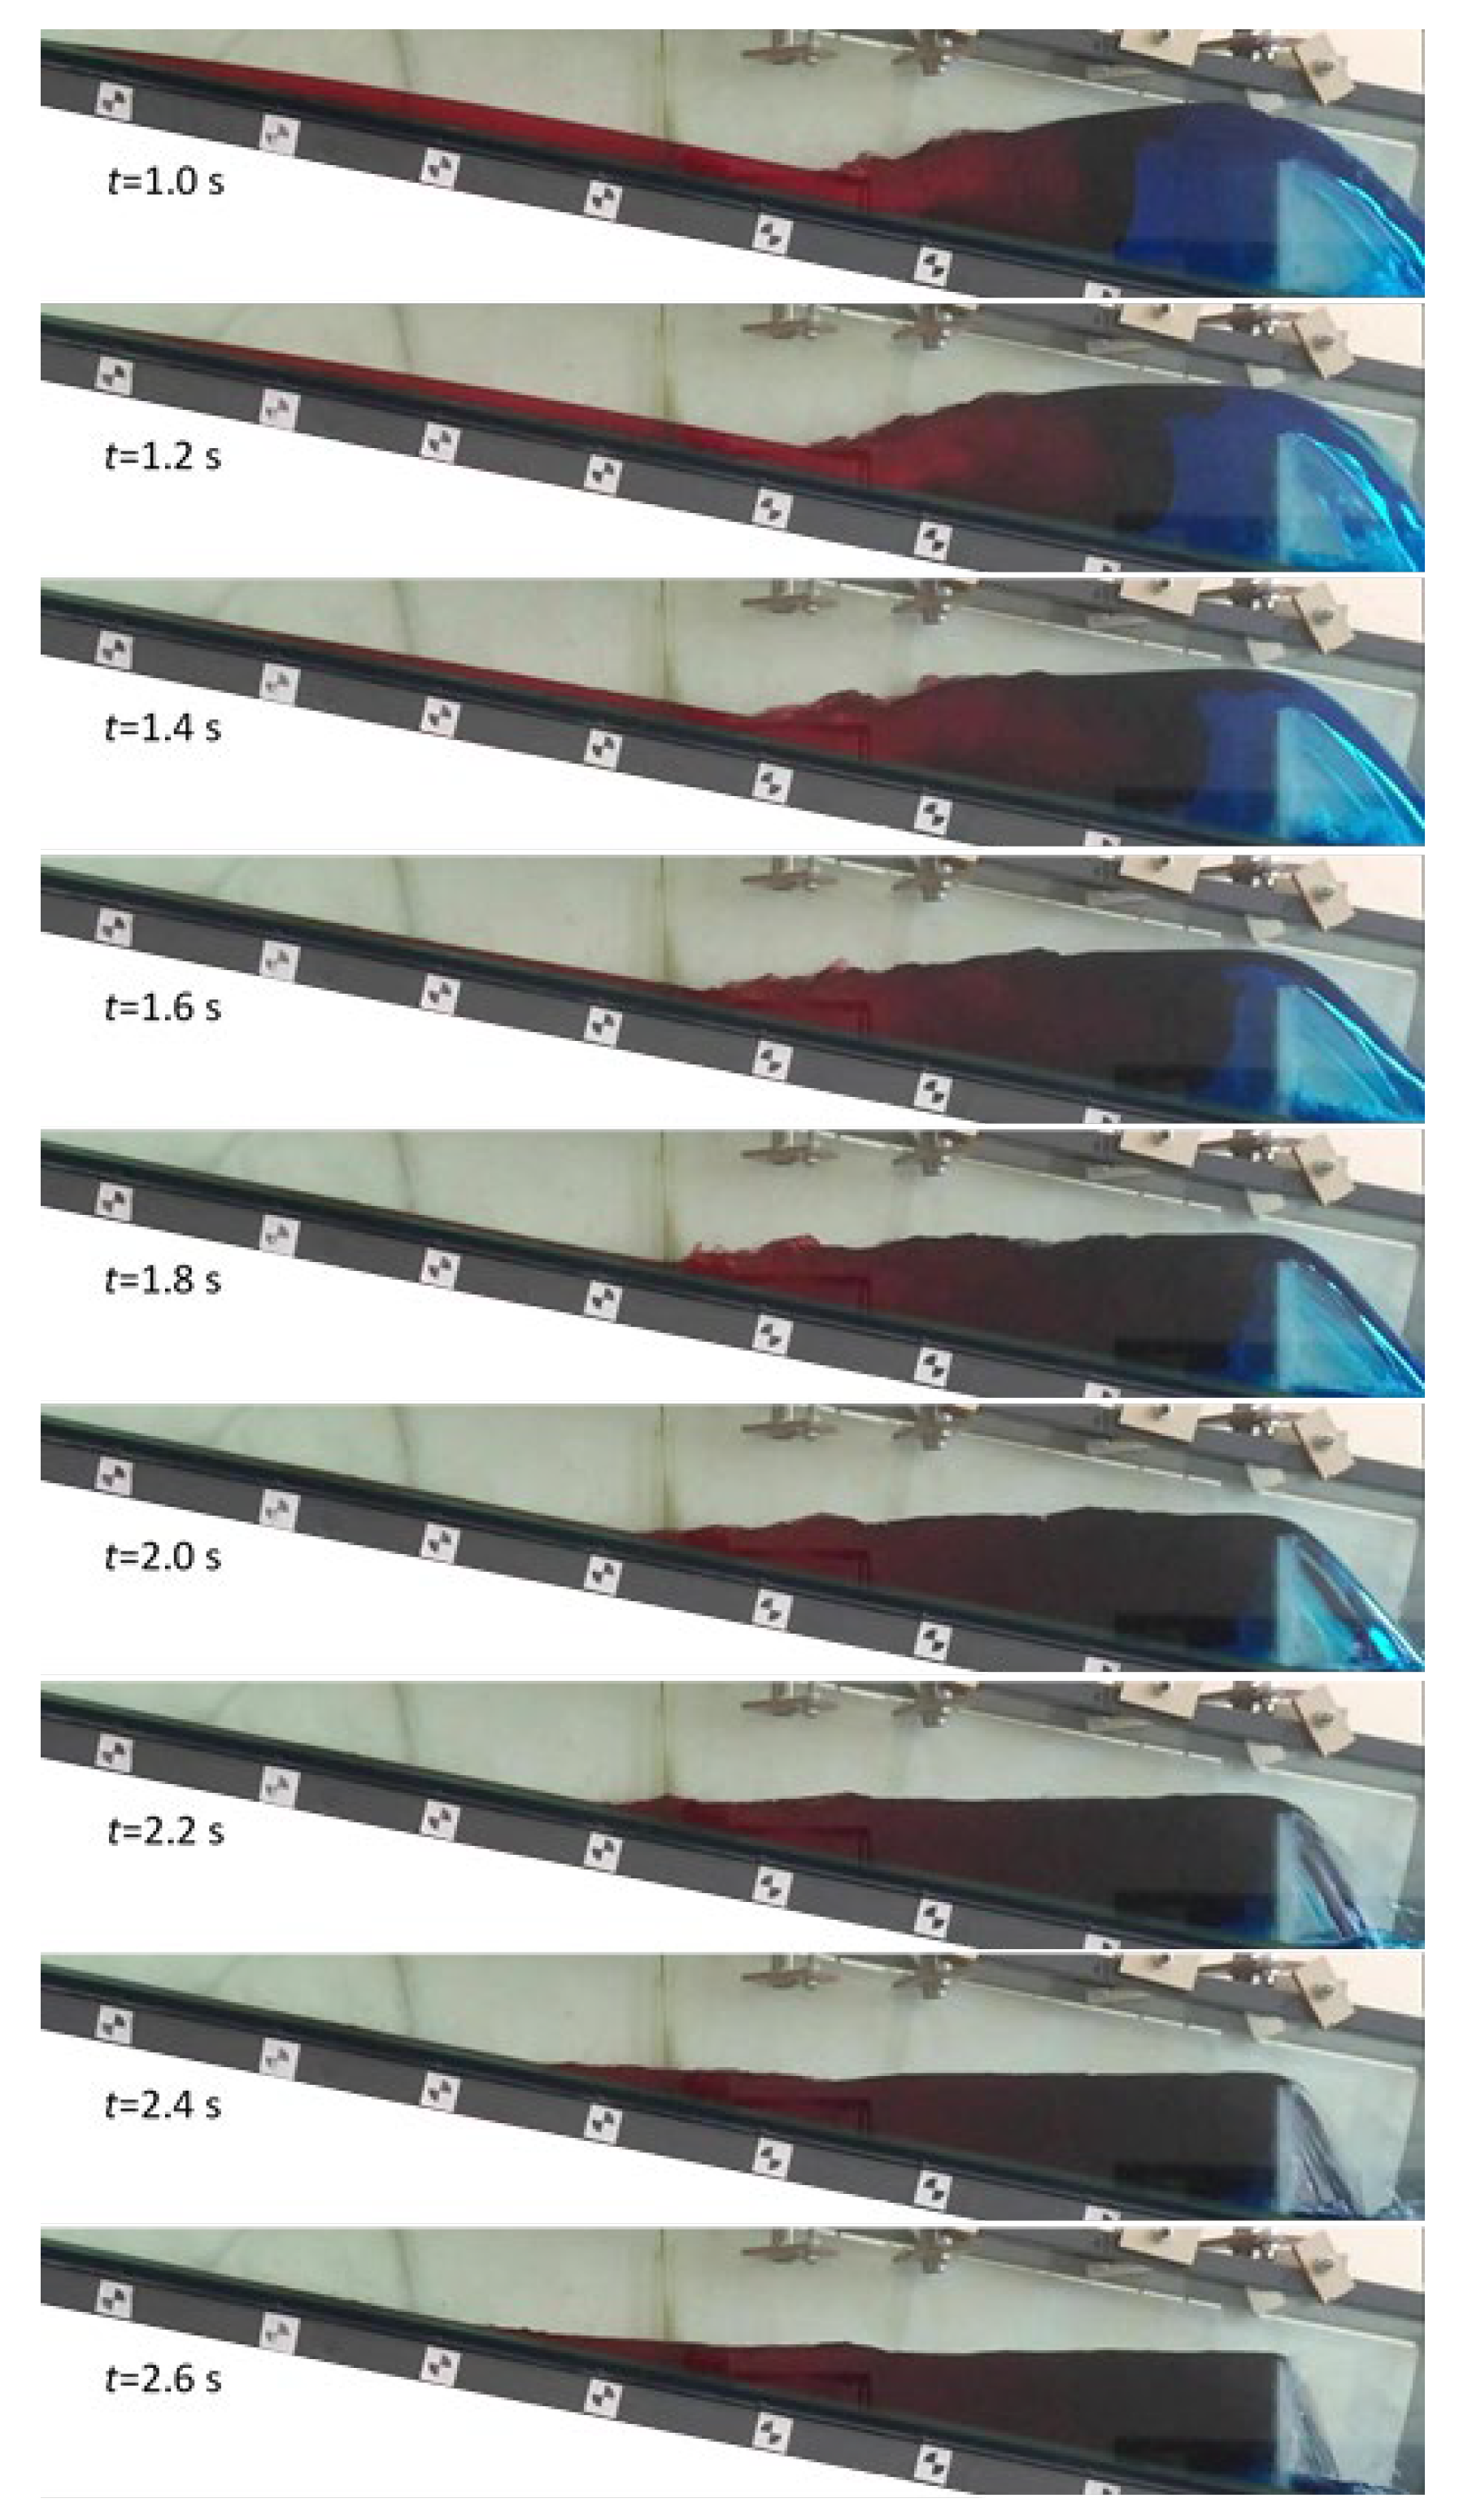
The formation of the reflected wave and run-up at the upstream end can be seen in Figure 7. The upstream reservoir drains quickly and the flow rate of the water decreases. As a result, a significant water surface slope is observed in the downstream reservoir as some water passes over the fixed dam (t = 1.0s). A negative wave forms and moves upwards due to the pressure difference caused by the inclination of the water surface. It was observed that the reflected wave runs-up on the bottom of the upstream channel end; however, with the steep slope, the running up ends in a short time and causes small waves called oscillations on the water surface while the running wave returns back downward (t = 1.2–2.6 s). Oscillations in the downstream reservoir begin to disappear over time due to viscosity and eventually steady-state occurs.
It was observed that the flow generally showed similar behavior also in previous studies [26,27,28,29]. However, two typical patterns as a leap pattern and an overflow pattern were defined depending on various dam heights and water depths in the reservoir. Also, when the dam-break wave hits the downstream reservoir located at a certain distance from the upstream reservoir, fluctuations with violent turbulence and significant air entrainment were observed [27]. In this study, some different flow properties were observed, such as less fluctuation in the water surface, no obvious turbulence and no significant air interference. Here, contrary to the mentioned study in which a gravity dam model was used, a thin plate with negligible thickness was used as a downstream dam. However, these differences in flow characteristics are due to the distance between reservoirs. Unlike other similar studies, in the present newly designed and idealized study, two dams with consecutive twin reservoirs without a gap in between were considered and the dams are filled with water up to crest levels. When there is a certain distance between the two reservoirs, the flow accelerates with the distance due to the steep slope. As a result, strong fluctuations, severe turbulence, and air entrainment occur when the wave encounters water in the downstream reservoir. The adjacent reservoirs in the present study cause less inertia effect, fewer fluctuations, and no significant air entrainment. It can be said that dam heights, initial water levels in the reservoirs, the gap distance between the reservoirs, and the bed slope of the channel are all factors that have a significant effect on the flow behavior.
3.2. Repeatability Test
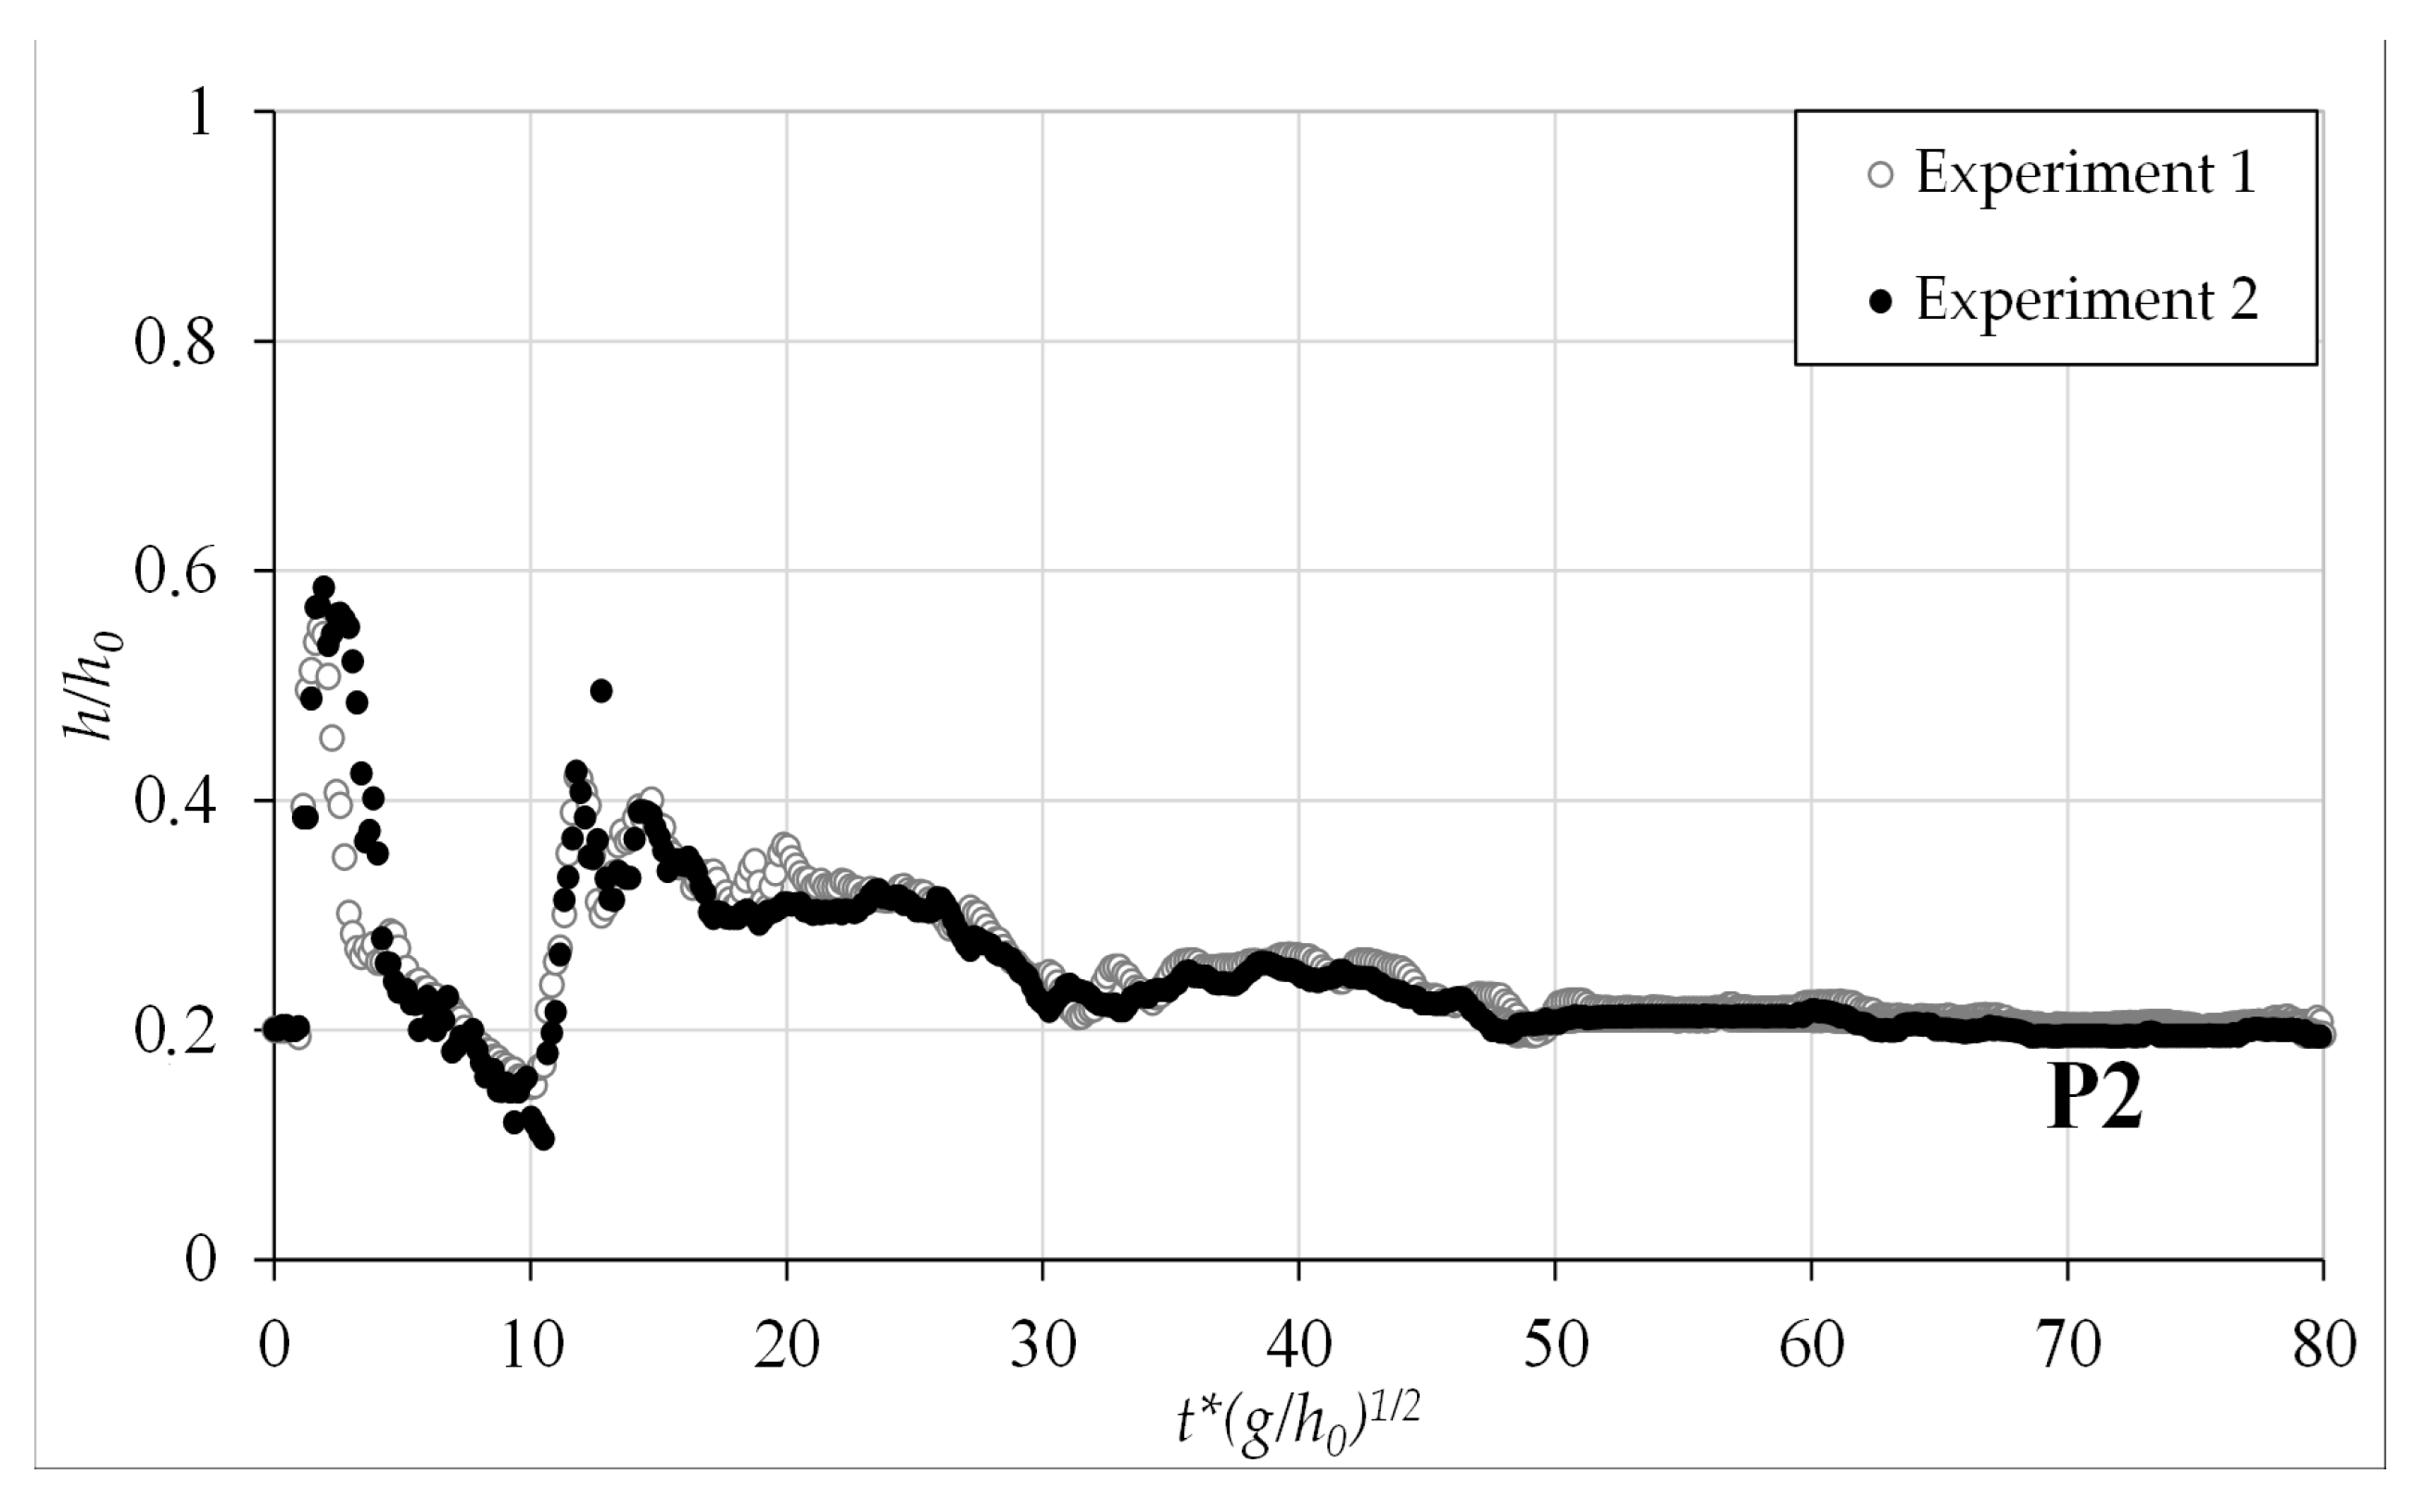
The reliability of the experimental data was determined by comparing two different experimental measurements performed under the same conditions. The repeatability analysis was made using the data obtained from the P2 probe, since this is the most challenging probe of the setup. The results obtained from Camera-2 are shown in Figure 8. In the dimensionless plot, ho indicates the initial water level in the upstream dam, h is the water height at time t, and g is the gravitational acceleration, equal to 9.81.
Since the results of the two experiments are in good agreement, it can be said that experimental conditions and data acquisition methods can be considered repeatable.
3.3. Comparison of Different Camera Results
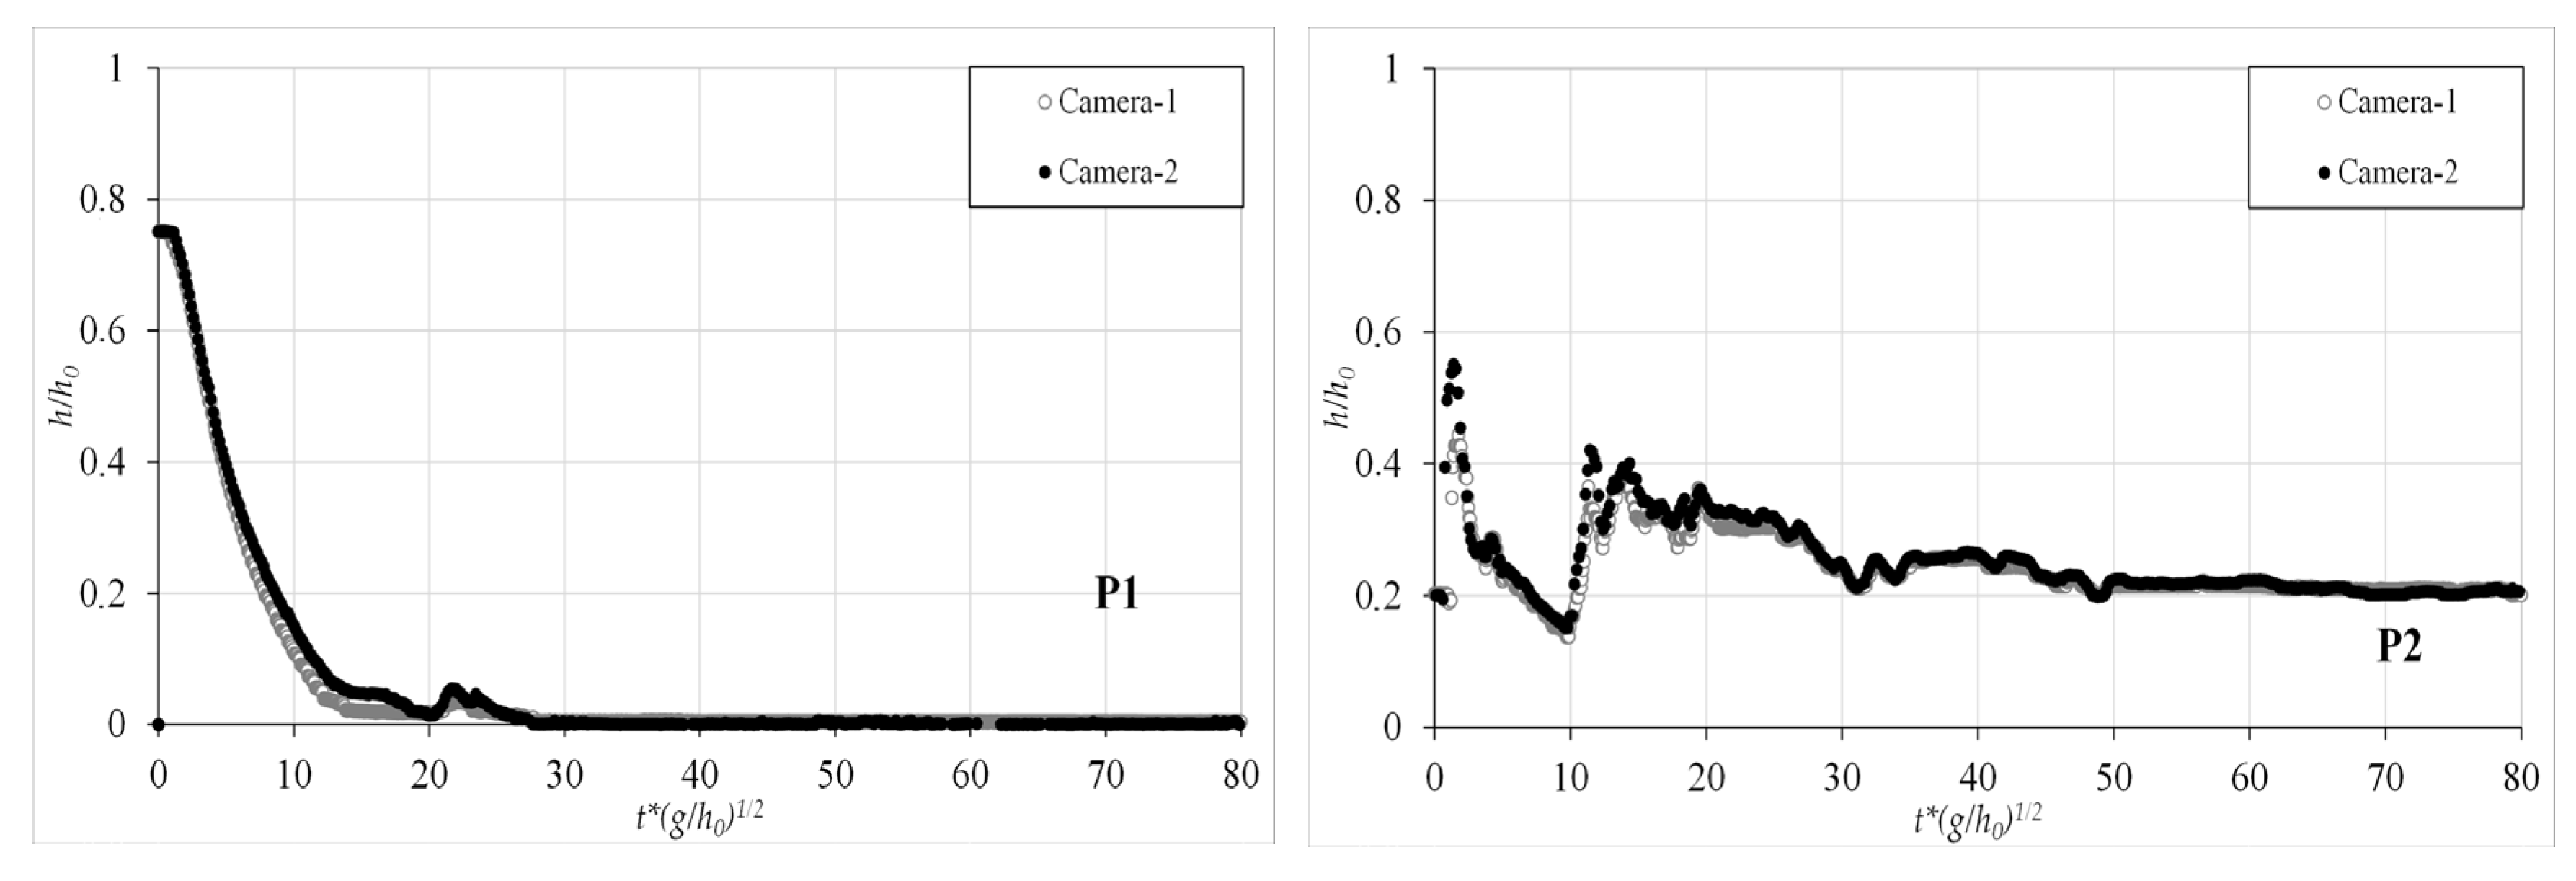
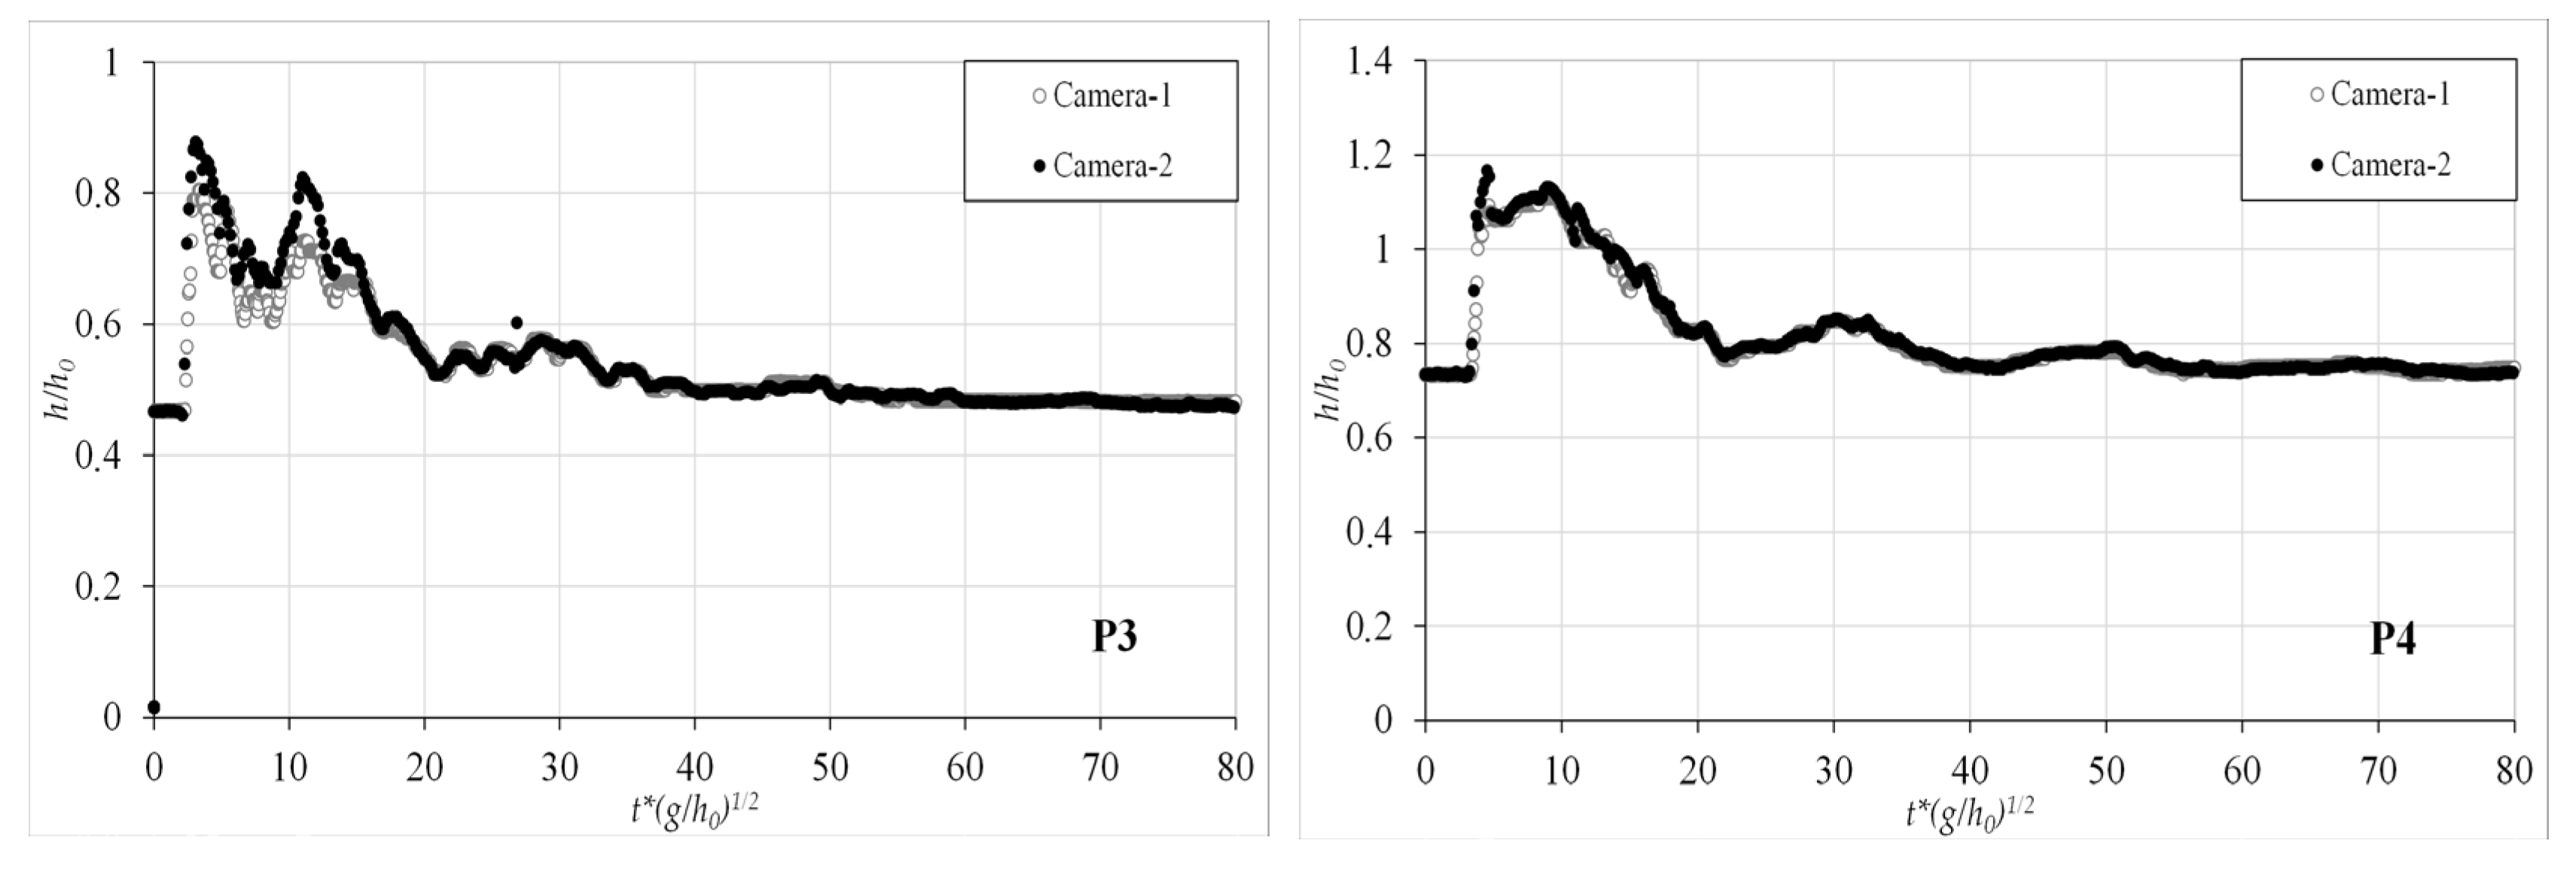
Experimental results can be used to validate the numerical models for free-surface flows based on SPH, VOF (Volume of Fluid), or level set methods, etc. Validation includes the comparison between experimental and numerical results. The capability of the software is interpreted according to the agreement degree with the test results. Thus, experimental data must be reliable and accurate. However, laboratory data are obtained using a single camera in many studies. In case a single camera is used, the accuracy of the data can be tested with repeatability analysis; on the contrary in this study, results of the same experiment were obtained using two cameras with different resolutions and frame rates in addition to the repeatability test. In this way, each experiment was investigated using two different cameras to validate each other. Experimental results, obtained from video images of the two cameras by using the virtual wave probe, are shown in Figure 9.
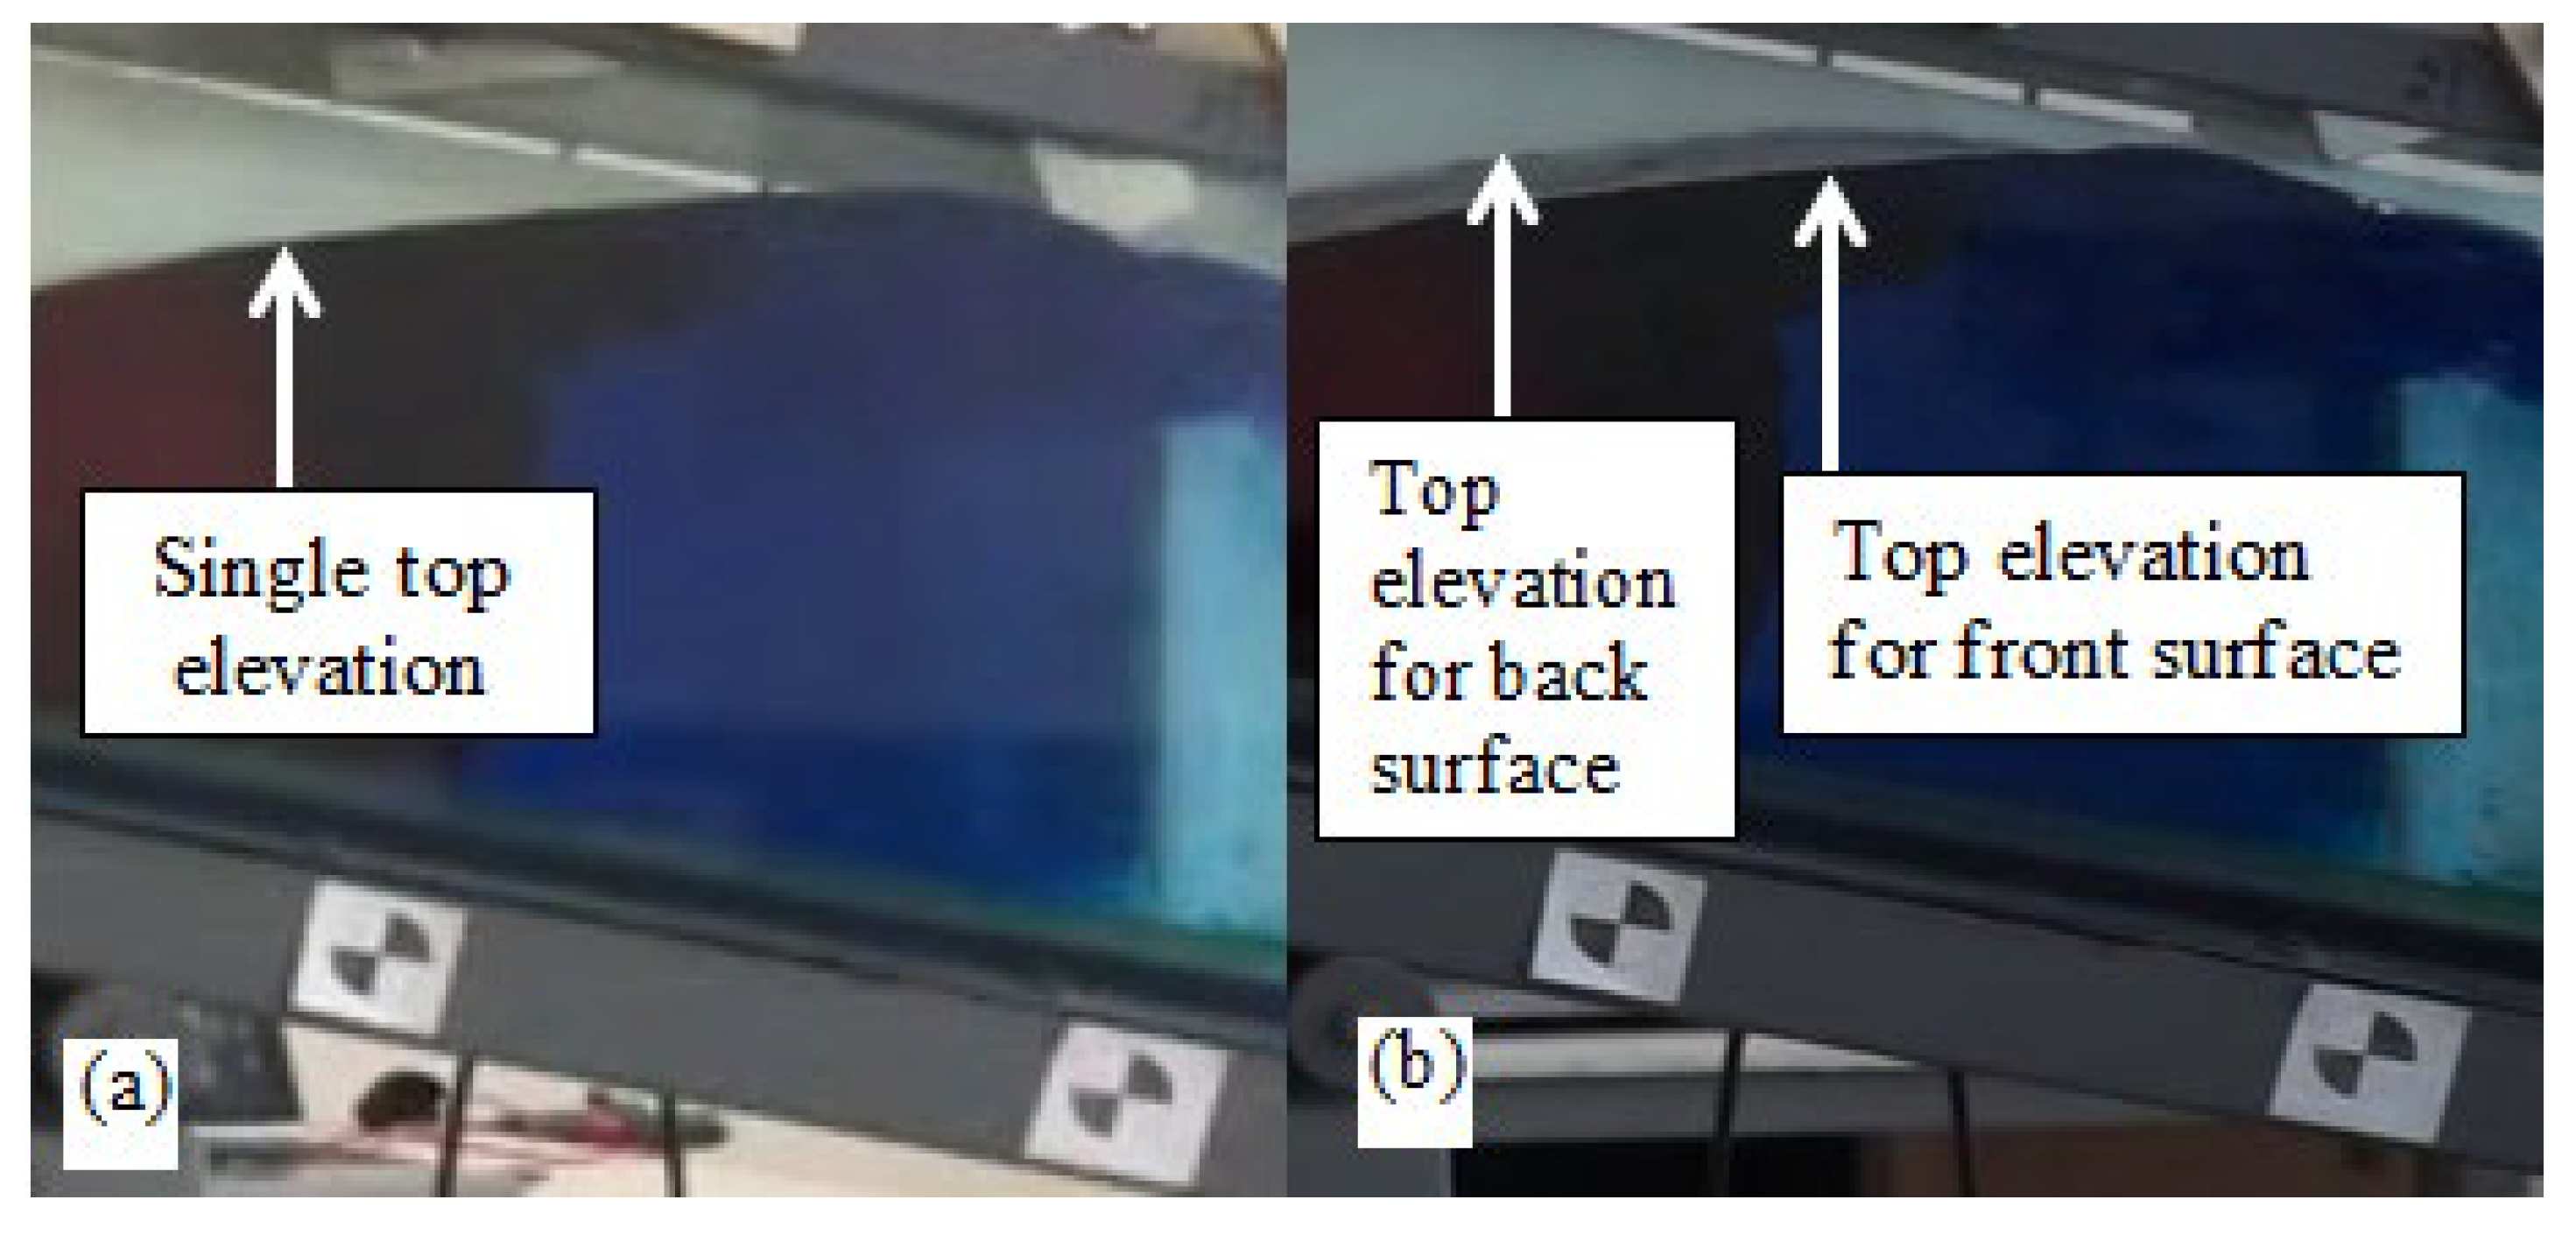
Despite some differences for the P2 and P3 results, a quite good agreement is observed for all the other points in Figure 9. The disagreement is due to the cameras being placed at different heights and the irregularities in the water level due to the waves breaking at these points. In the present study, the cameras were placed perpendicular to the channel and the flow behavior observed on the front wall surface was recorded. However, Camera-1 and Camera-2 were placed at different levels to examine the effect of the camera elevation as well. The level of Camera-1 was adjusted to the minimum water elevation, while Camera-2 was a little higher. Images obtained from the two cameras at the same time are shown in Figure 10. There is a single top level of the water in Figure 10a; however, two top levels can be seen in Figure 10b. The water–air interface with a distinct color change is defined as an edge in the edge recognition function. The virtual wave probe detects an edge in the first image and two edges in the second image. This is a challenging condition for the code used to determine the top level of the water for each frame. Since the code decides according to the threshold color change in the line representing the probe at the selected point for each frame, it cannot distinguish the front or rear water surface in the image and determines the top water level as the main edge although there are two edges. It can be supposed that this is the main reason of the differences in Figure 8, especially for P3.
Time-dependent changes in the water level in rectangular cross-section channels for 1D free surface flows such as dam-break, tsunami, ocean waves can be easily identified on well-acquired video images by using a virtual wave probe. In this method, the edge recognition function defines the water–air interface as an edge due to the sharp color change, and the coordinates of this point are determined to calculate the water depth. Water levels can be determined with the help of recorded images on the front wall surface. Specifically, when there are obstacles such as a contraction or bridge pier in the channel, the flow in these regions will be 3D and the water depths will be different along the width of the channel. For this reason, it is not clear whether the measured water level is on the front, the middle, or the rear surface of the channel. These effects can be reduced or eliminated by applying image processing techniques such as filtering, contrast enhancement, and thresholding. However, these processes require extra effort and there is still the potential for errors in the water level measurement if the necessary precision is not taken. This problem may also occur due to the camera being placed at the wrong height, even if the flow is one dimensional in a rectangular channel as in this study. Two water levels that are actually the same on the front and rear surface of the flume can be seen as different depths on the same image due to the high placement of the camera. Therefore, it is very important to determine the camera height correctly before the experiments in order to obtain precise measurement results and avoid difficulties later on.
It was concluded that data obtained from image processing through Camera-1 is reliable and usable to validate the numerical solution. The camera of a smartphone which is available to everyone at any time can be used for measurement by using image processing, instead of a professional or industrial camera. Also, both resolutions and frame rates are satisfactory for the present test case; however, better resolution and higher frame rate may be required if more detailed investigations are desired, especially for rapidly varying unsteady flows such as dam break, tsunami, wave impact, etc. Recently, video cameras with 8K (7680 × 4320 pixels) resolution and high frame rates (60 fps) are becoming more widespread. Although more detailed images can be obtained and more precise measurements can be made on these images by using these cameras, it should be noted that the analysis of these video images by using image processing techniques will take longer and more computing power will be required. The results can be considered independent from the brand of the smartphone. A camera of any smartphone available on today’s market can obtain accurate and successful results for image processing owing to the development of smartphone camera technologies based on highly competitive market conditions.
Researchers need reliable, precise, easily accessible, and applicable measurement methods to determine the experimental data. The method used in this study requires only a software and a cell-phone with a camera. Accurate results can be obtained in a short time after the experiment. Also, the method is non-intrusive; therefore, flow is not affected by a physical measurement tool intrusion such as wave gauges. However, the measurement technique is suitable for 1D flows in a flume. In addition, the method makes possible the investigation of the intersection of the immiscible fluids.
3.4. Determination of the Parameters in the SPH Method
The determination of the value of a parameter in the SPH method is significant. The minor differences in any parameter can change the results dramatically. Also, the optimum value of a parameter can be different in various cases. Therefore, many parametric analyses were made to obtain the best results in the numerical method. The distance of the particles (dp) and artificial viscosity (α) were found to be the most effective parameters influencing the water depth variation according to parametric analyses. Prior to the laboratory experiment, preliminary numerical analyses were carried out to obtain optimum dp and α values. The range of values used in the analysis was between 0.001–0.005 for dp and between 0.1–0.01 for α, respectively. Following the preliminary tests, the selected optimum dp and α values can be seen in Table 2.
3.5. Comparison of the Experimental and Numerical Results
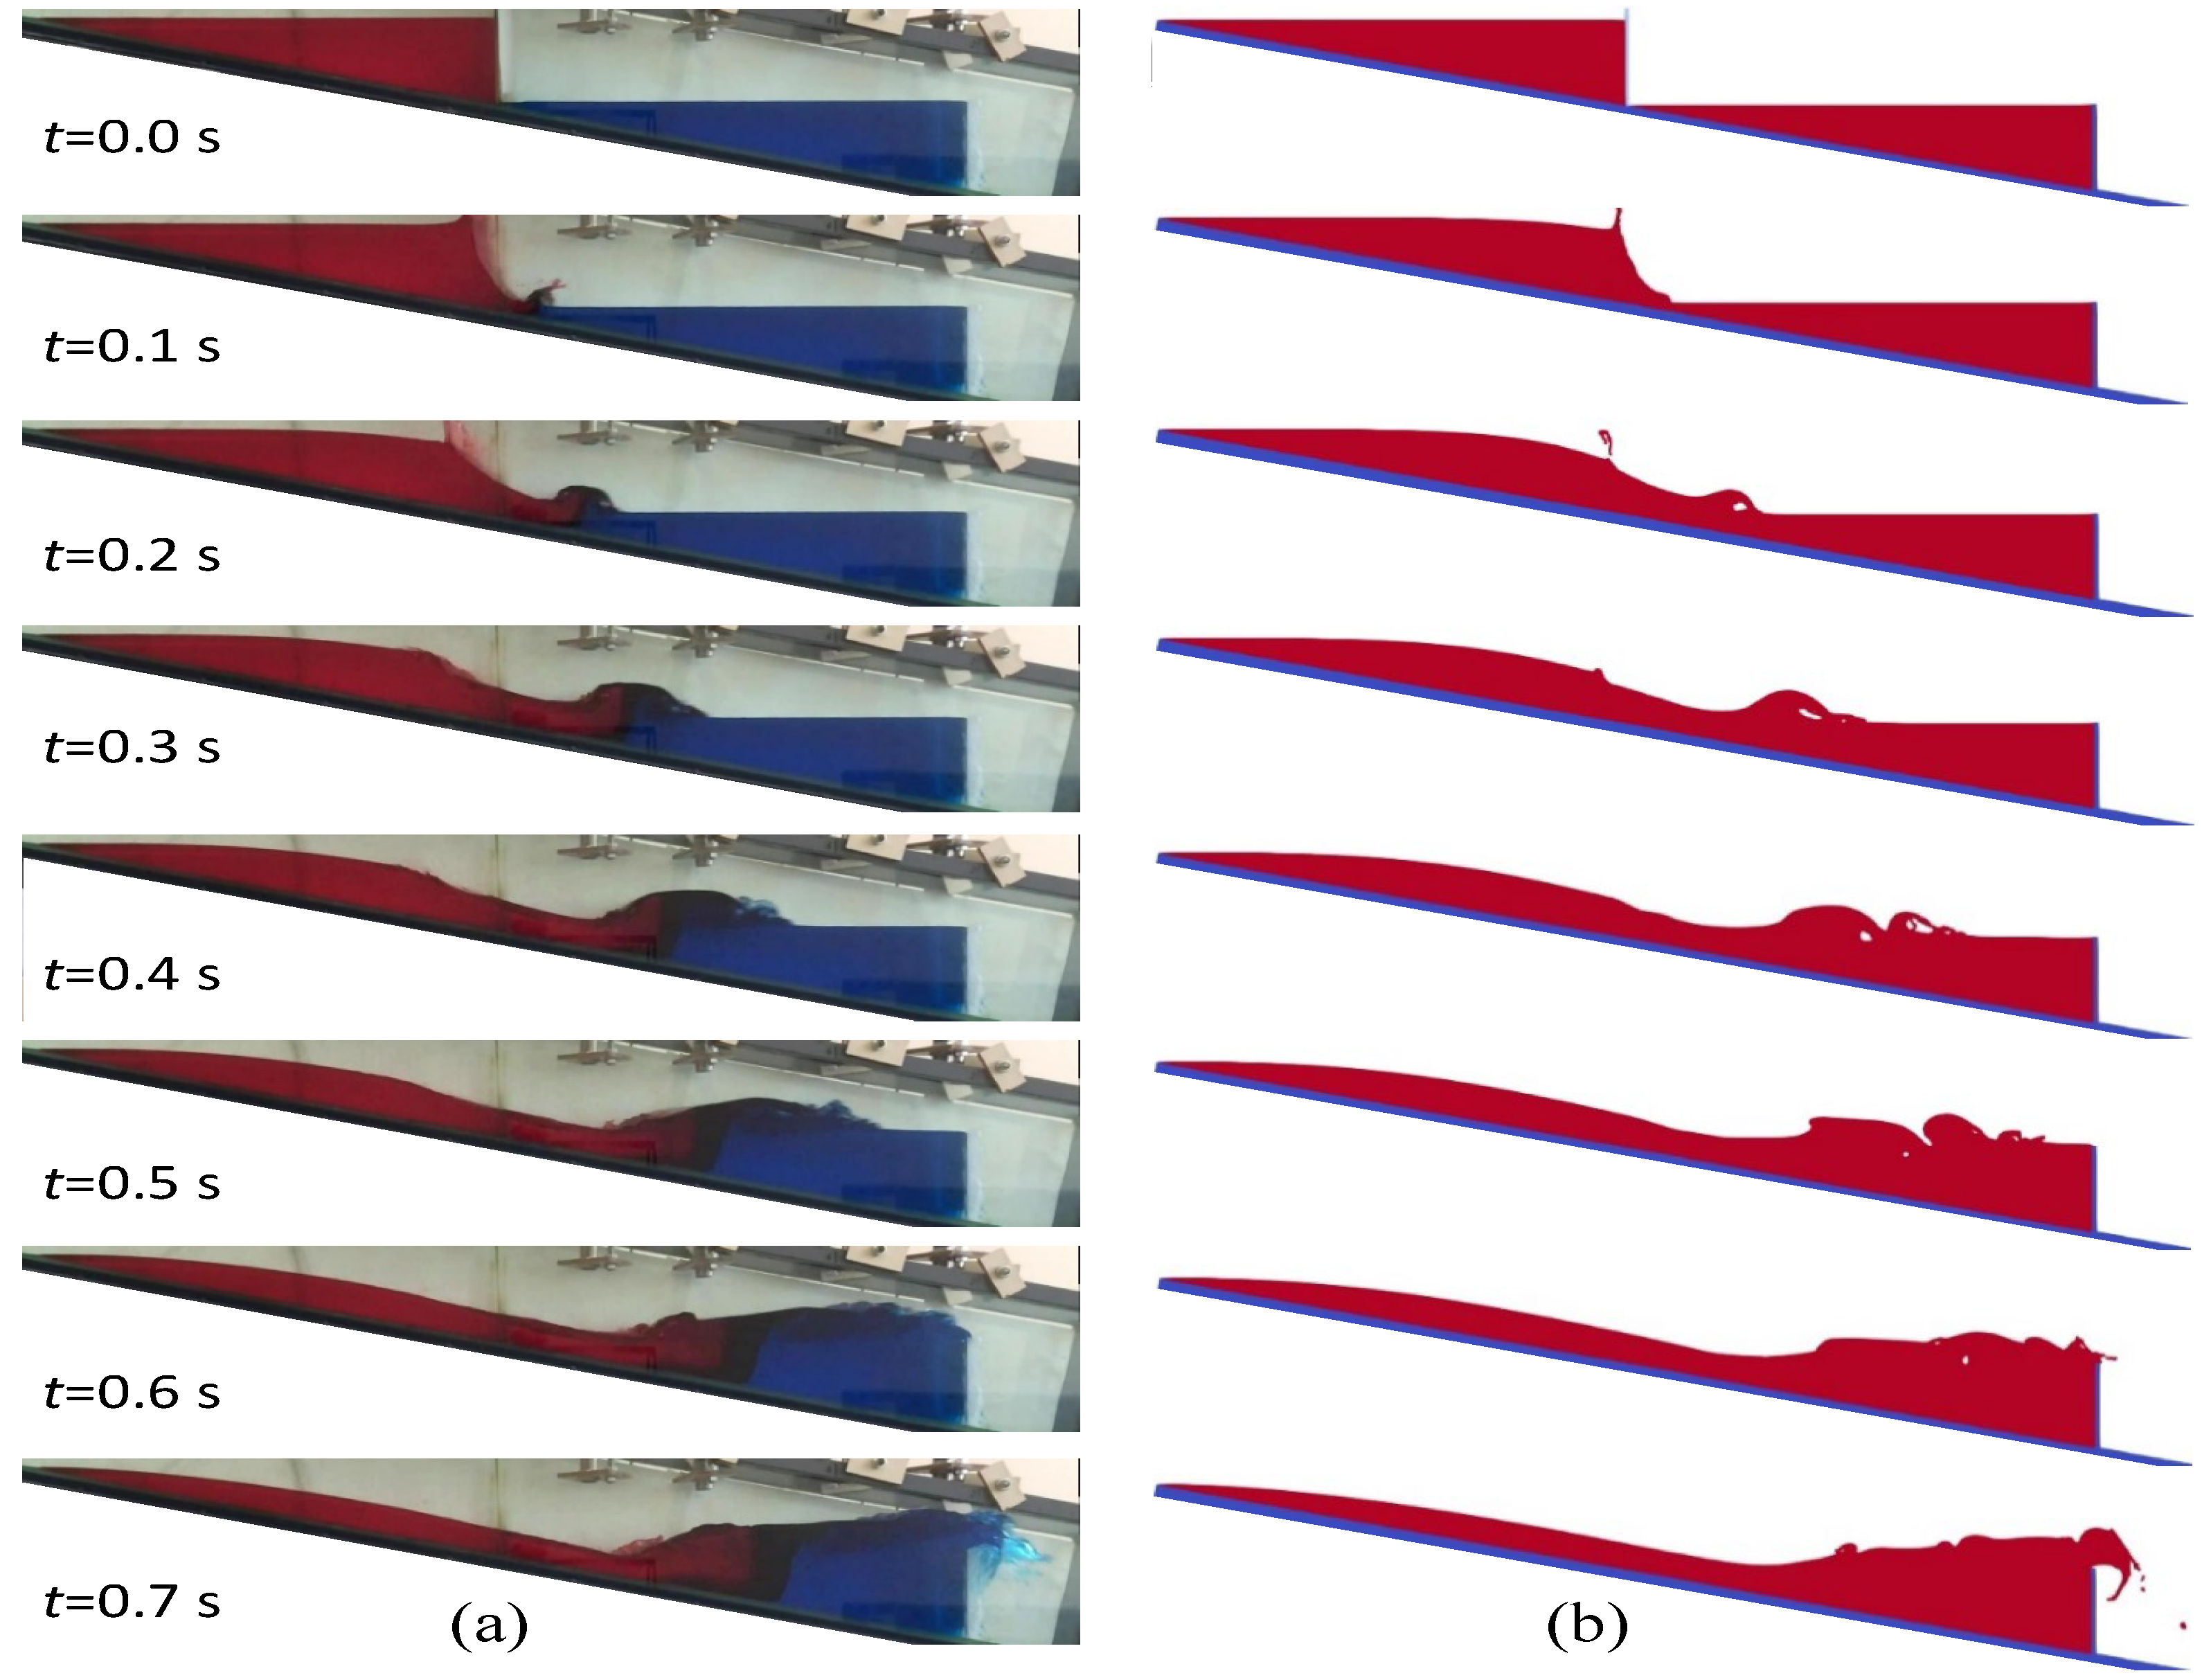
Prior to the comparison of experimental and numerical data through water level-time curves, a visual comparison of the experiment and SPH results corresponding to the same time was made. It was aimed to investigate the dam-break flow experimentally and numerically not only with stage hydrographs but also visually. Figure 11 and Figure 12 show the development of the dam-break flow and the reflected waves from the fixed downstream dam, respectively.
Experimental and SPH visuals are generally in agreement (t = 0.1–4 s). Wave fronts propagate simultaneously at the beginning in Figure 11. However, the agreement decreases as time progresses and the wave front for the SPH moves faster than the experiment (t = 0.5–0.6 s).
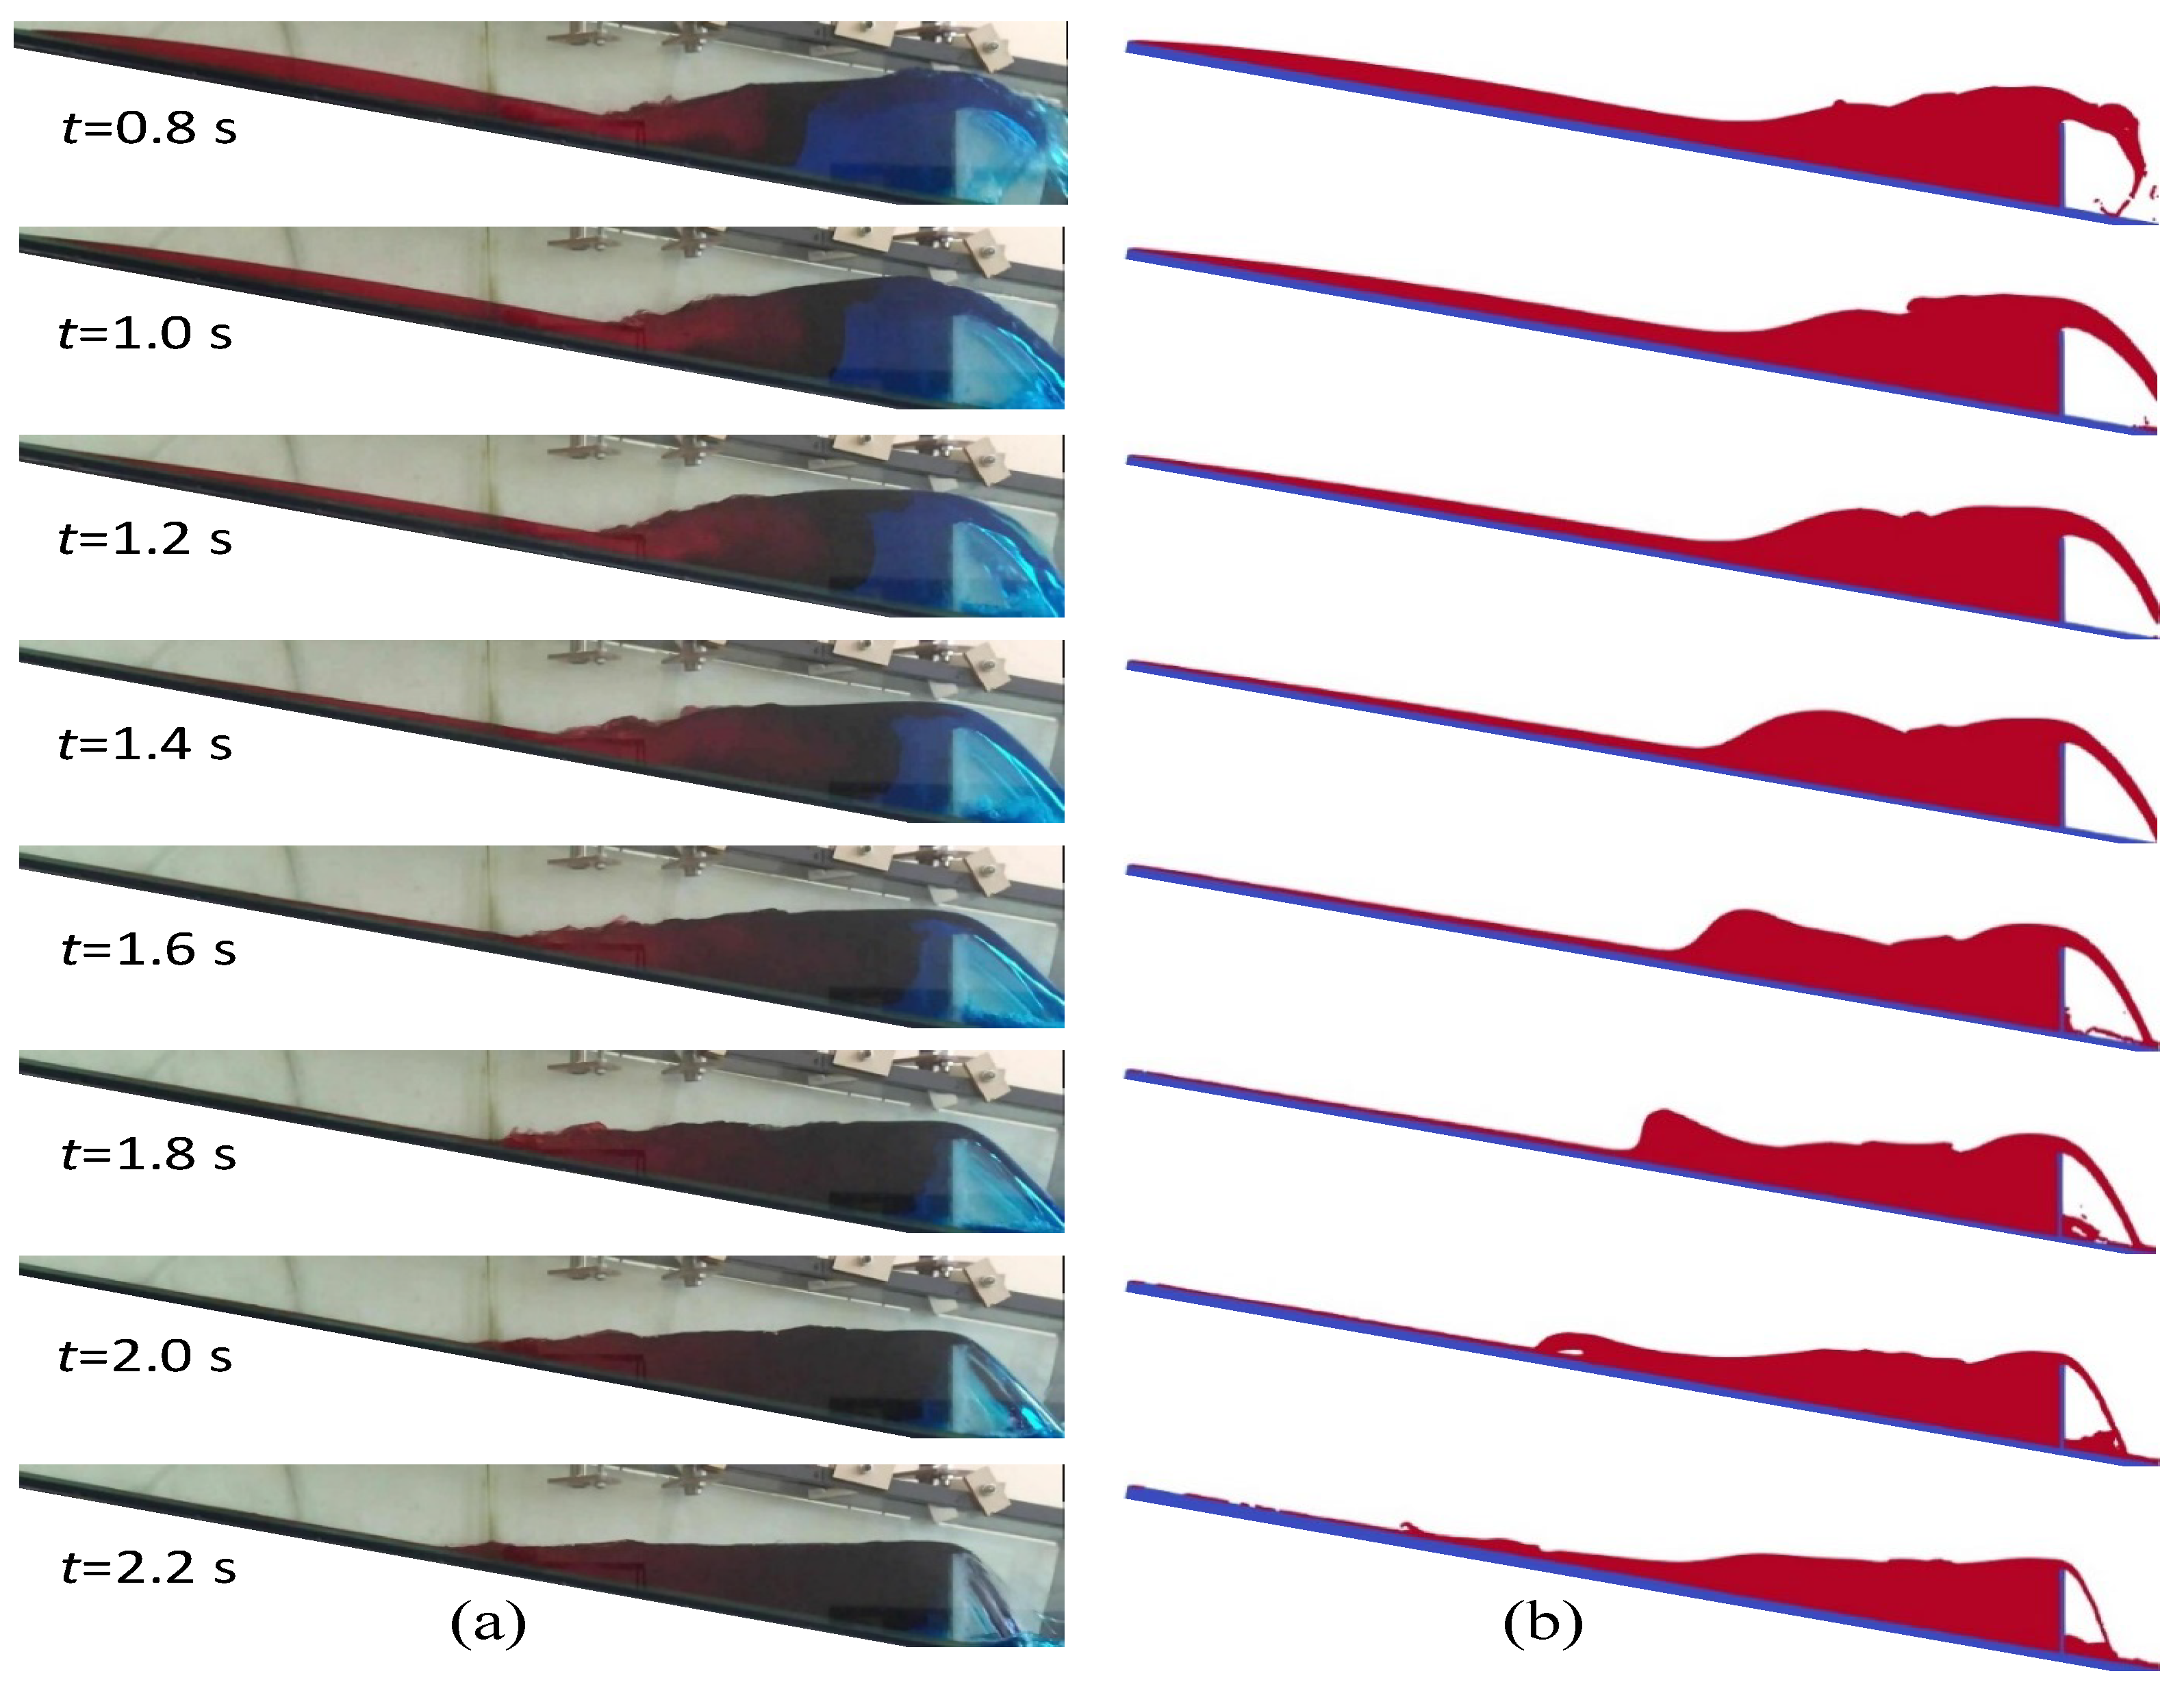
The reflected wave from the downstream dam and run-up are displayed in Figure 12. It can be seen that the reflected wave is higher and more obvious than the experiment (t = 1.4–1.8 s). Also, the wave propagates further than the experiment in the SPH and plunging wave breaking is observed in the run-up (t = 1.6–2.2 s).
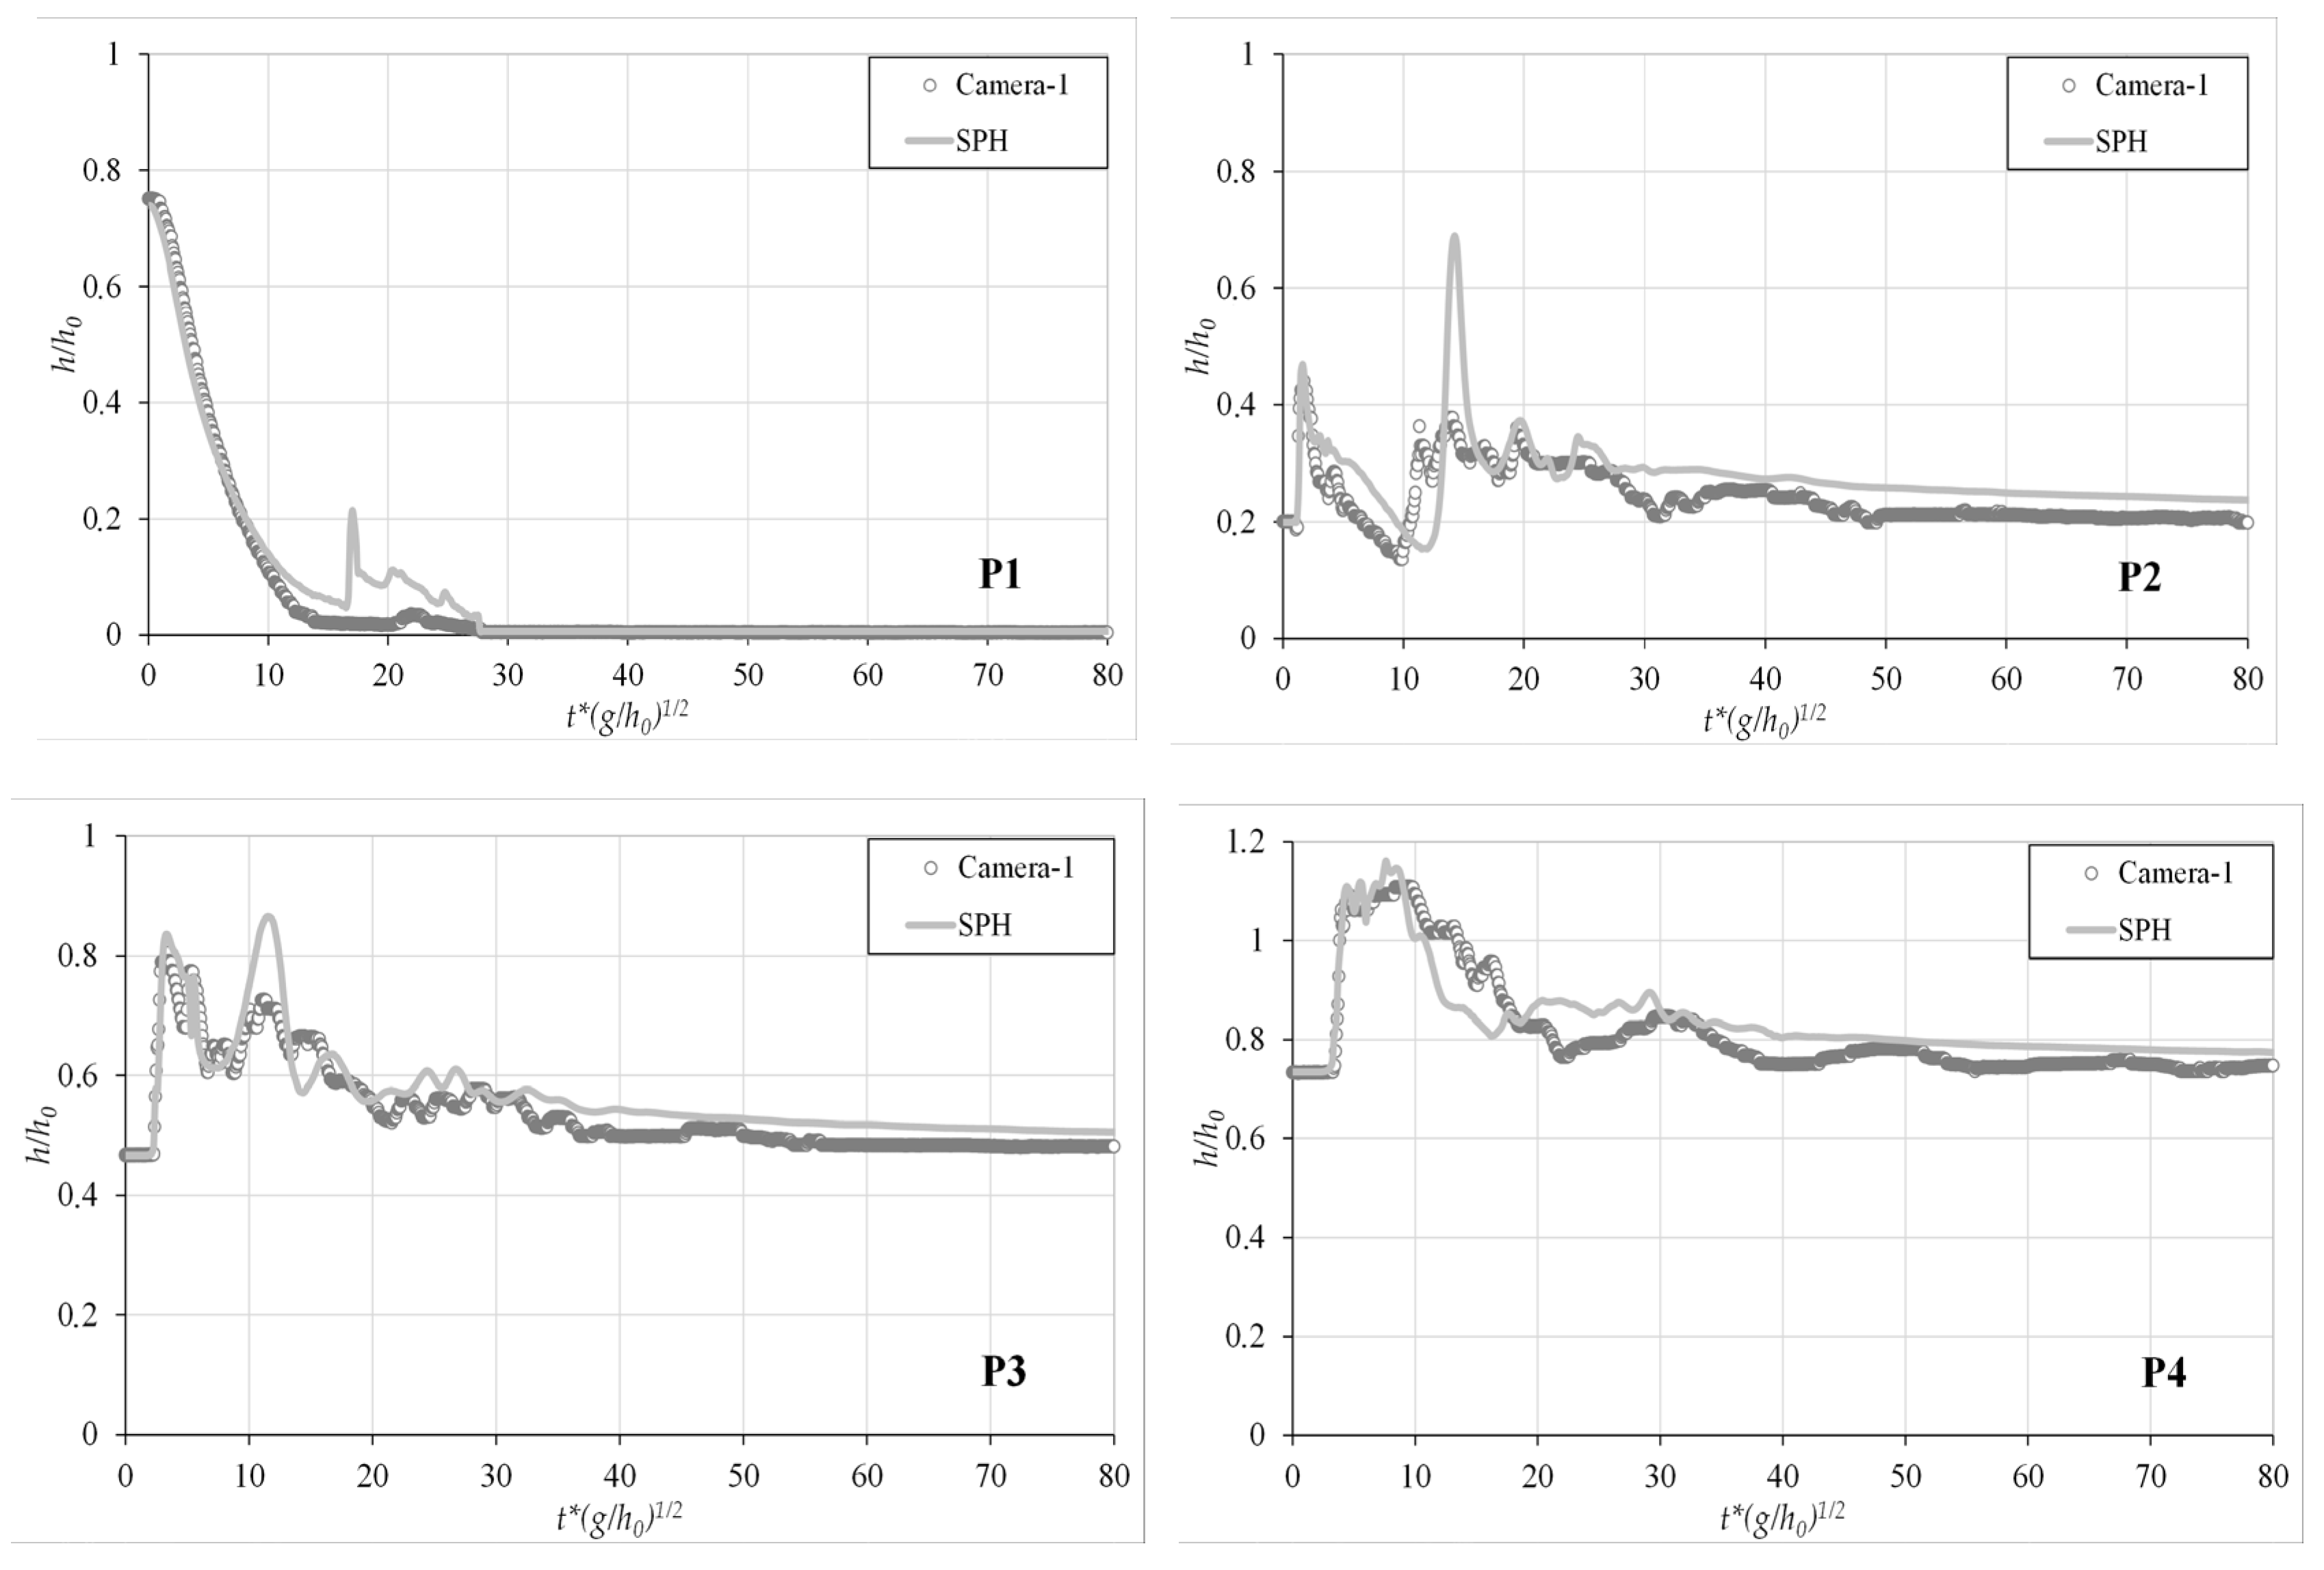
The stage hydrographs of the experimental and numerical results are given in Figure 13. Experimental data obtained from Camera-1 were used for numerical comparison.
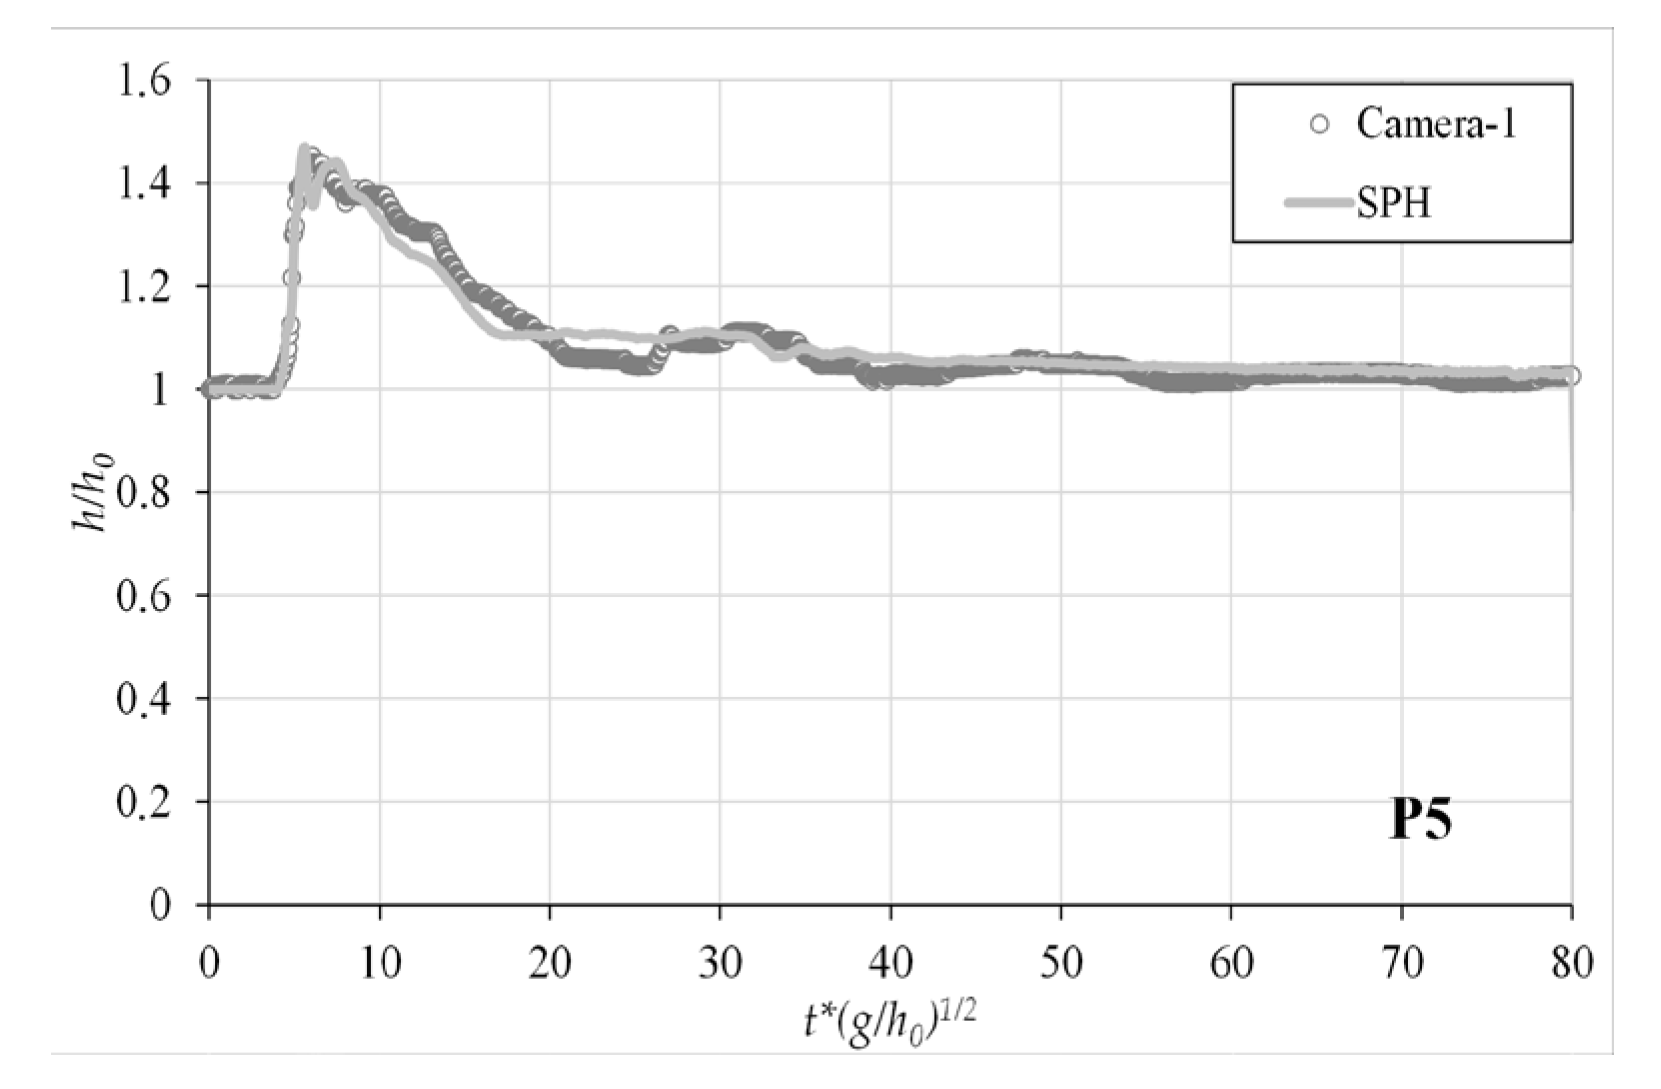
As shown in Figure 13, it can be said that the results show satisfactory agreement generally. In case of a sudden dam-break, the water in the upstream dam reservoir moves rapidly to the downstream reservoir. While the water level decreases with the sudden discharge resulting from the dam break as expected, flattening is observed when the water in the upstream dam reservoir is completely discharged at the stage hydrograph of the P1 probe. The speed of the wave front is similar for both methods. Since the plunging wave breaking occurred in the run-up, differences between experimental and numerical results can be seen at P1 (dimensionless time T = 15–25). The same behavior is observed at P2 (T = 10–20) as well. P2 and P3 probes are the most critical due to their location. With the arrival of the reflected wave at P2 (T = 15) and P3 (T = 13) points, respectively, there is a distinct difference between the numerical and experimental results. This difference, as can also be seen for t = 1.4–2.0 s in Figure 3, is due to a plunging type wave breaking during the movement of the reflected wave towards the upstream end in the numerical model. The agreement decreases with the unsteady conditions at the initial stages of the experiment (T = 0–20), while it increases with the steady-state conditions. However, instabilities were observed in the water surface profile while the incoming wave passes over the fixed dam and the formation of the reflected wave in the SPH model. Therefore, the water level of the numerical solution is lower than the experimental results for T = 10–30 at P4. This situation can be seen clearly in Figure 12 for t = 1.0–1.8 s. Also, the SPH model results are a little higher in the steady phase (T = 30–80) for P2, P3, and P4. Although the SPH model of a previous study [26] contains a lower fluid particle ratio (fluid particle number per unit fluid volume) than this study, similar observations can be made for both studies regarding the flow characteristics. It was evaluated that this result can be useful to decrease the solution time of the analyses using fewer ratios and considering other parameters. The fluctuations can be clearly observed in the results of the image processing unlike numerical results between T = 25–80 except P1. Also, the water level curves appear as a straight line and are not distinctive in the numerical solution at those phases. The mean absolute percentage error (MAPE) was calculated for all measurement points. The lowest error occurred at P5 as 13.62%, while the maximum error occurred at P2 as 4.37%. In the numerical model, overtopping over the fixed downstream (P5) was simulated quite well. However, the coherence was less due to the plunging type wave breaking, which occurs during the passage of the advancing and reflected wave through point P2.
The highest level of the water during the experiment was observed at the P5 which is the measurement point at the downstream dam. This is a similar behavior with a previous study with similar slope and cascaded dam reservoirs [28]. In that study, a distance was left between upstream and downstream reservoirs unlike the present study; however, the highest water level was observed before the downstream dam in both studies. The peaks were reported as saw-toothed in the mentioned study, while they were observed as smooth in this study. It was evaluated that the smoothness means less fluctuation on the water surface.
Although time step data agree well, the tendency is incompatible between numerical and experimental results in some phases such as complex flow conditions P2–P4 (T = 10–20), especially due to wave breaking. In that phase, the water levels have contrary behavior due to the particulate inherent of the SPH method. This type of result can be seen in the previous studies [42,43]. In the mentioned studies, some disagreements between experimental and numerical results were observed as well, especially where the complex flow conditions occur. It was considered that the SPH method is a good alternative to examine the dam-break flow, however, to reach the more accurate results dp value should be decreased (i.e., particle number should be increased).
It can be observed that the code is capable of detecting sudden changes in the level, and the image processing method determines the water level successfully. Although there was no necessity for the filtration and additional lighting equipment for the image processing application in the present study, those improvements must be performed to obtain more sensitive and accurate data under unavoidable circumstances [37]. Also, since the method is non-intrusive, it is highly applicable and useful in the laboratory conditions.
4. Conclusions
In the present study, the sequential dam-break problem was investigated experimentally and numerically in a steeply inclined rectangular channel with consecutive twin reservoirs and no gap in between. While the image processing technique was used to obtain the experimental data, SPH method was used for the numerical solutions. The agreement of experimental and numerical results is satisfactory. Furthermore, five successive stages of the flow behavior were observed in the experimental results: propagation of the dam-break wave in the downstream reservoir, overtopping flow over the fixed downstream dam, formation of a reflection wave moving upstream due to the downstream dam, run-up and run-down of the wave at the upstream end, and oscillations at the water surface of the downstream reservoir.
Also, the effects of camera resolutions and frame rates on measurement results were investigated using two different cameras for the dam-break flow, which is one of the most challenging free-surface problems in the hydraulic field. The experiments were recorded using a professional video camera and a smartphone camera, thus examining also whether this complex hydraulic problem requires a high-tech camera to perform image processing analysis. No significant difference was observed between the results of the two cameras, and it was concluded that accurate measurements can be made using a smartphone camera instead of a professional camera. Therefore, it can be said that widely used and easily accessible smartphone cameras can be used as an effective measuring tool for especially 1D experimental studies of hydraulic problems in a flume such as dam-break, tsunami, coastal waves. However, in order to make precise measurements on the video images, it is also very important to determine the camera positions correctly, to find the reference lengths on the image, to make calibrations to reduce the lens distortion, and to have good ambient lighting before performing the experiments.
Flow behavior for the sequential dam-break problem can differ remarkably depending on the water levels in the upstream and downstream reservoirs, downstream dam height and the distance between the two reservoirs and bed slope of the channel. Therefore, considering these effects as a separate study in the future will contribute significantly to understanding the subject.
The disagreements are seen between SPH and the image processing results in some phases of the experiment. It was concluded that the particulate nature of the SPH and the absence of turbulence effects are the main reason of those disagreements. In the SPH model, irregularities were also observed on the water surface due to plunging type wave breaking. Nonetheless, it was observed that the agreement increased with the increasing steadiness of the flow and concluded that the SPH method can be a good alternative to investigate the unsteady free surface flows. The change of parameters such as artificial viscosity, smoothing length, and particle number of the method have a great effect on the results. The agreement can be increased by making more sensitive analyses in future studies. However, it should be evaluated that detailed numerical analyses require more computing power for CPU and GPU.
The data obtained from the newly designed experimental setup for the sequential dam break problem can be used as a case study for future studies. Therefore, the authors declare to share all experimental data with the scientific community for validation purposes.
Author Contributions
Conceptualization—S.K., methodology—S.K., K.D.; software—S.K., validation—S.K., K.D.; formal analysis—S.K., K.D.; investigation—S.K., K.D.; resources—S.K., K.D.; data curation—S.K.; writing—original draft preparation—S.K., K.D.; writing—review and editing—S.K., K.D.; visualization—S.K., K.D.; supervision—S.K.; project administration, S.K. All authors have read and agreed to the published version of the manuscript.
Funding
This research received no external funding.
Conflicts of Interest
The authors declare no conflict of interest.
References
- Ritter, A. The propagation of water waves. Ver Dtsch. Ing. Zeitschr 1892, 36, 947–954. [Google Scholar]
- Stoker, J.J. Water Waves: The Mathematical Theory with Applications; Interscience Publishers Inc.: New York, NY, USA, 1957. [Google Scholar]
- Fraccarollo, L.; Toro, E.F. Experimental and numerical assessment of the shallow water model for two-dimensional dam-break type problems. J. Hydraul. Res. 1995, 33, 843–864. [Google Scholar] [CrossRef]
- Toro, E.F. Shock-Capturing Methods for Free-Surface Shallow Flows; John Wiley: New York, NY, USA, 2001. [Google Scholar]
- Aureli, F.; Maranzoni, A.; Mignosa, P.; Ziveri, C. Dam-break flows: Acquisition of experimental data through an imaging technique and 2D numerical modelling. J. Hydraul. Eng. 2008, 134, 1089–1101. [Google Scholar] [CrossRef]
- Song, L.; Zhou, J.; Guo, J.; Zou, Q.; Liu, Y. A robust well-balanced finite volume model for shallow water flows with wetting and drying over irregular terrain. Adv. Water Resour. 2001, 34, 915–932. [Google Scholar] [CrossRef]
- Alvarez, M.; Puertas, J.; Pena, E.; Bermudez, M. Two-dimensional dam-break flood analysis in data-scarce regions: The case study of chipembe dam, Mozambique. Water 2017, 9, 432. [Google Scholar] [CrossRef] [Green Version]
- Wang, Y.; Liang, Q.; Kesserwani, G.; Hall, J.W. A 2D shallow flow model for practical dam-break simulations. J. Hydraul. Res. 2011, 49, 307–316. [Google Scholar] [CrossRef]
- Ozmen-Cagatay, H.; Kocaman, S. Dam-break flow in the presence of obstacle: Experiment and CFD simulation. Eng. Appl. Comput. Fluid Mech. 2011, 5, 541–552. [Google Scholar] [CrossRef] [Green Version]
- Ozmen-Cagatay, H.; Kocaman, S. Investigation of dam-break flow over abruptly contracting channel with trapezoidal-shaped lateral obstacles. J. Fluids Eng. 2012, 134, 081204. [Google Scholar] [CrossRef]
- Shigematsu, T.; Liu, P.L.F.; Oda, K. Numerical modeling of the initial stages of dam-break waves. J. Hydraul. Res. 2004, 42, 183–195. [Google Scholar] [CrossRef]
- Marsooli, R.; Wu, W. 3-D finite volume model of dam-break flow over uneven beds based on VOF method. Adv. Water Resour. 2014, 70, 104–117. [Google Scholar] [CrossRef]
- Ozmen-Cagatay, H.; Kocaman, S.; Guzel, H. Investigation of dam-break flood waves in a dry channel with a hump. J. Hydro Environ. Res. 2014, 8, 304–315. [Google Scholar] [CrossRef]
- Zubeldia, E.H.; Fourtakas, G.; Rogers, B.D.; Farias, M.M. Multi-phase SPH model for simulation of erosion and scouring by means of the shields and Drucker-Prager criteria. Adv. Water Resour. 2018, 117, 98–114. [Google Scholar] [CrossRef]
- Manenti, S.; Wang, D.; Domínguez, J.M.; Li, S.; Amicarelli, A.; Albano, R. SPH modeling of water-related natural hazards. Water 2019, 11, 1875. [Google Scholar] [CrossRef] [Green Version]
- Subramaniam, S.P.; Scheres, B.; Schilling, M.; Liebisch, S.; Kerpen, N.B.; Schlurmann, T.; Schüttrumpf, H. Influence of convex and concave curvatures in a coastal dike line on wave run-up. Water 2019, 11, 1333. [Google Scholar] [CrossRef] [Green Version]
- Domínguez, J.M.; Crespo, A.J.; Hall, M.; Altomare, C.; Wu, M.; Stratigaki, V.; Gómez-Gesteira, M. SPH simulation of floating structures with moorings. Coastal Eng. 2019, 153, 103560. [Google Scholar] [CrossRef]
- Trimulyono, A.; Hirotada, H.; Akihiko, M. Experimental validation of single-and two-phase smoothed particle hydrodynamics on sloshing in a prismatic tank. J. Mar. Sci. Eng. 2019, 7, 247. [Google Scholar] [CrossRef] [Green Version]
- Trimulyono, A.; Hashimoto, H. Experimental validation of smoothed particle hydrodynamics on generation and propagation of water waves. J. Mar. Sci. Eng. 2019, 7, 17. [Google Scholar] [CrossRef] [Green Version]
- Altomare, C.; Tafuni, A.; Domínguez, J.M.; Crespo, A.J.C.; Gironella, X.; Sospedra, J. SPH simulations of real sea waves impacting a large-scale structure. J. Mar. Sci. Eng. 2020, 8, 826. [Google Scholar] [CrossRef]
- Gingold, R.A.; Monaghan, J.J. Smoothed particle hydrodynamics-theory and application to non-spherical stars. Mon. Not. R. Astron. Soc. 1977, 181, 375–389. [Google Scholar] [CrossRef]
- Altomare, C.; Tagliafierro, B.; Dominguez, J.M.; Suzuki, T.; Viccione, G. Improved relaxation zone method in SPH-based model for coastal engineering applications. Appl. Ocean Res. 2018, 81, 15–33. [Google Scholar] [CrossRef]
- Novak, G.; Tafuni, A.; Domínguez, J.M.; Četina, M.; Žagar, D. A numerical study of fluid flow in a vertical slot fishway with the smoothed particle hydrodynamics method. Water 2019, 11, 1928. [Google Scholar] [CrossRef] [Green Version]
- Hui Pu, J.; Shao, S.; Huang, Y.; Hussain, K. Evaluations of SWEs and SPH numerical modelling techniques for dam break flows. Eng. Appl. Comput. Fluid Mech. 2013, 7, 544–563. [Google Scholar] [CrossRef]
- Aureli, F.; Dazzi, S.; Maranzoni, A.; Mignosa, P.; Vacondio, R. Experimental and numerical evaluation of the force due to the impact of a dam-break wave on a structure. Adv. Water Resour. 2015, 76, 29–42. [Google Scholar] [CrossRef]
- Luo, J.; Xu, W.; Tian, Z.; Chen, H. Numerical simulation of cascaded dam-break flow in downstream reservoir. Water Management 2017, 172, 55–67. [Google Scholar] [CrossRef]
- Zhang, Y.; Xu, W. Retarding effects of an intermediate intact dam on the dam-break flow in cascade reservoirs. J. Hydraul. Res. 2017, 55, 438–444. [Google Scholar] [CrossRef] [Green Version]
- Yang, X.U.E.; Xu, W.L.; Luo, S.J.; Chen, H.Y.; Li, N.W.; Xu, L.J. Experimental study of dam-break flow in cascade reservoirs with steep bottom slope. J. Hydrodyn. Ser. B 2011, 23, 491–497. [Google Scholar]
- Dai, S.; He, Y.; Yang, J.; Ma, Y.; Jin, S.; Liang, C. Numerical study of cascading dam-break characteristics using SWEs and RANS. Water Supply 2020, 20, 348–360. [Google Scholar] [CrossRef]
- Dal, K.; Kocaman, S. Comparison of the experimental results with SPH method for sequential dam-break problem. In Proceedings of the 5th IAHR Europe Congress, Trento, Italy, 12–14 June 2018. [Google Scholar]
- Evangelista, S.; Altinakar, M.; Di Cristo, C.; Leopardi, A. Simulation of dam-break waves on movable beds using a multi-stage centered scheme. Int. J. Sediment Res. 2013, 28, 269–284. [Google Scholar] [CrossRef]
- Evangelista, S. Experiments and numerical simulations of dike erosion due to a wave impact. Water 2015, 7, 5831–5848. [Google Scholar] [CrossRef] [Green Version]
- Chanson, H. Tsunami surges on dry coastal plains: Application of dam break wave equations. Coast. Eng. J. 2006, 48, 355–370. [Google Scholar] [CrossRef] [Green Version]
- Li, Y.L.; Ma, Y.; Deng, R.; Jiang, D.P.; Hu, Z. Research on dam-break induced tsunami bore acting on the triangular breakwater based on high order 3D CLSVOF-THINC/WLIC-IBM approaching. Ocean Eng. 2019, 182, 645–659. [Google Scholar] [CrossRef]
- Cheng, D.; Zhao, X.Z.; Zhang, D.K.; Chen, Y. Numerical study of dam-break induced tsunami-like bore with a hump of different slopes. China Ocean Eng. 2017, 31, 683–692. [Google Scholar] [CrossRef]
- Kocaman, S. Experimental and Theoretical Investigation of Dam-Break Problem. Ph.D. Thesis, Cukurova University, Adana, Turkey, 2007. [Google Scholar]
- Kocaman, S.; Ozmen-Cagatay, H. Investigation of dam-break induced shock waves impact on a vertical wall. J. Hydrol. 2015, 525, 1–12. [Google Scholar] [CrossRef]
- Kocaman, S.; Güzel, H.; Evangelista, S.; Ozmen-Cagatay, H.; Viccione, G. Experimental and numerical analysis of a dam-break flow through different contraction geometries of the channel. Water 2020, 12, 1124. [Google Scholar] [CrossRef] [Green Version]
- Liu, W.; Wang, B.; Chen, Y.; Wu, C.; Liu, X. Assessing the analytical solution of one-dimensional gravity wave model equations using dam-break experimental measurements. Water 2018, 10, 1261. [Google Scholar] [CrossRef] [Green Version]
- Soares-Frazao, S.; Zech, Y. Experimental study of dam-break flow against an isolated obstacle. J. Hydraul. Res. 2007, 45, 27–36. [Google Scholar] [CrossRef]
- Crespo, A.J.C.; Dominguez, J.M.; Rogers, B.D.; Gesteira, M.G.; Longshaw, S.; Canelas, R.; Vacondio, R.; Barreiro, A.; Feal, O.G. DualSPHysics: Open-source parallel CFD solver based on smoothed particle hydrodynamics (SPH). Comput. Phys. Commun. 2015, 187, 204–216. [Google Scholar] [CrossRef]
- Turhan, E.; Ozmen-Cagatay, H.; Kocaman, S. Experimental and numerical investigation of shock wave propagation due to dam-break over a wet channel. Pol. J. Environ. Stud. 2019, 28, 2877–2898. [Google Scholar] [CrossRef]
- Han, Z.; Su, B.; Li, Y.; Dou, J.; Wang, W.; Zhao, L. Modeling the progressive entrainment of bed sediment by viscous debris flows using the three-dimensional SC-HBP-SPH method. Water Res. 2020, 182, 116031. [Google Scholar] [CrossRef]
Figure 1.
Test set-up.

Figure 2.
Locations of the five measurement points (dimensions in cm).

Figure 3.
Shooting errors due to camera position (a) front view (b) top view (c) side view.

Figure 4.
Reference markers for the image processing.

Figure 5.
Water level measurement using virtual wave probe.

Figure 6.
Initial and development stages of the dam-break flow.

Figure 7.
The reflected waves from the downstream dam.

Figure 8.
Repeatability test results.

Figure 9.
Comparison of the Camera Result.


Figure 10.
Top elevations for the cameras (a) Camera-1 (b) Camera-2.

Figure 11.
The visual comparison of the dam-break wave development (a) experiment (b) Smoothed Particle Hydrodynamics (SPH).
Figure 11.
The visual comparison of the dam-break wave development (a) experiment (b) Smoothed Particle Hydrodynamics (SPH).

Figure 12.
Visual comparison of the overtopping and the reflected wave due to the downstream dam (a) experiment (b) SPH.
Figure 12.
Visual comparison of the overtopping and the reflected wave due to the downstream dam (a) experiment (b) SPH.

Figure 13.
The comparison of the experimental and numerical results through stage hydrographs.


Table 1.
Specifications of the cameras.
| # | Brand | Properties |
|---|---|---|
| Camera-1 | Apple® iPhone 6 s | 720 p/120 fps |
| Camera-2 | Sony® Nex 7 | 1080 p/50 fps |
Table 2.
Parameters of the numeric model.
| Parameter | Value |
|---|---|
| Artificial Viscosity | 0.05 |
| Courant coefficient | 0.2 |
| Coefficient of sound | 20 |
| Distance of the particles | 0.001 m |
| DeltaSPH value | 0.1 |
| Step Algorithm | Symplectic |
| Kernel | Wendland |
Publisher’s Note: MDPI stays neutral with regard to jurisdictional claims in published maps and institutional affiliations. |
© 2020 by the authors. Licensee MDPI, Basel, Switzerland. This article is an open access article distributed under the terms and conditions of the Creative Commons Attribution (CC BY) license (http://creativecommons.org/licenses/by/4.0/).
Share and Cite
MDPI and ACS Style
Kocaman, S.; Dal, K. A New Experimental Study and SPH Comparison for the Sequential Dam-Break Problem. J. Mar. Sci. Eng. 2020, 8, 905. https://doi.org/10.3390/jmse8110905
AMA Style
Kocaman S, Dal K. A New Experimental Study and SPH Comparison for the Sequential Dam-Break Problem. Journal of Marine Science and Engineering. 2020; 8(11):905. https://doi.org/10.3390/jmse8110905
Chicago/Turabian StyleKocaman, Selahattin, and Kaan Dal. 2020. "A New Experimental Study and SPH Comparison for the Sequential Dam-Break Problem" Journal of Marine Science and Engineering 8, no. 11: 905. https://doi.org/10.3390/jmse8110905
Note that from the first issue of 2016, this journal uses article numbers instead of page numbers. See further details here.