Article

Age-Associated mRNA and miRNA Expression Changes in the Blood-Brain Barrier

1
Sheffield Institute for Translational Neuroscience, 385a Glossop Road, University of Sheffield, Sheffield S10 2HQ, UK
2
School of Life Science, Health and Chemical Sciences, Faculty of Science, Technology Engineering and Mathematics, The Open University, Walton Hall, Milton Keynes MK7 6AA, UK
*
Author to whom correspondence should be addressed.
Joint first authors.
Joint senior authors.
Int. J. Mol. Sci. 2019, 20(12), 3097; https://doi.org/10.3390/ijms20123097
Submission received: 6 June 2019 / Revised: 21 June 2019 / Accepted: 22 June 2019 / Published: 25 June 2019

Abstract

:
Functional and structural age-associated changes in the blood-brain barrier (BBB) may affect the neurovascular unit and contribute to the onset and progression of age-associated neurodegenerative pathologies, including Alzheimer’s disease. The current study interrogated the RNA profile of the BBB in an ageing human autopsy brain cohort and an ageing mouse model using combined laser capture microdissection and expression profiling. Only 12 overlapping genes were altered in the same direction in the BBB of both ageing human and mouse cohorts. These included genes with roles in regulating vascular tone, tight junction protein expression and cell adhesion, all processes prone to dysregulation with advancing age. Integrated mRNA and miRNA network and pathway enrichment analysis of the datasets identified 15 overlapping miRNAs that showed altered expression. In addition to targeting genes related to DNA binding and/or autophagy, many of the miRNAs identified play a role in age-relevant processes, including BBB dysfunction and regulating the neuroinflammatory response. Future studies have the potential to develop targeted therapeutic approaches against these candidates to prevent vascular dysfunction in the ageing brain.

1. Introduction

The blood-brain barrier (BBB), formed by capillary endothelial cells, the basement membrane and surrounding pericytes and astrocyte endfeet, is a highly specialised structure that maintains homeostasis within the central nervous system (CNS) by regulating the bidirectional flow of molecules between the circulation and the brain parenchyma [1]. Functional and structural age-associated BBB changes may affect the neurovascular unit (NVU), impacting vascular integrity and resulting in alterations in the perivascular environment, neuronal function and the neuroinflammatory response, as demonstrated in both human and mouse studies [2,3,4].
BBB dysfunction, a reduction in cerebral blood flow and impaired haemodynamic responses are prominent features of a range of neurodegenerative diseases, including Alzheimer’s disease (AD) [5,6]. In addition to the findings of several post-mortem tissue studies [7,8,9], neuroimaging approaches have demonstrated that dysfunction of the BBB is a feature of ageing [10], mild cognitive impairment and early AD [11,12]. Moreover, increased permeability of the BBB precedes the formation of senile plaque formation in an animal model of AD [13]. Together, these data support the vascular hypothesis of AD [14,15,16], and suggest that BBB dysfunction, which can occur before the clinical manifestation of dementia, is a prospective therapeutic target.
The continued advancement of transcriptomic profiling techniques, including microarray analysis, has enabled the identification of specific gene expression changes and biological processes associated with ageing [17,18,19,20,21]. Laser capture microdissection (LCM) enables the isolation of regions or enrichment of specific cell types from post-mortem material and has been used in conjunction with transcriptomic analysis in both human and animal model ageing studies to identify differentially expressed genes in the hippocampus [22], and in enriched populations of LCM-isolated neurones [23,24,25] and astrocytes [26]. While LCM has been used to selectively study the transcriptomic profile of LCM-isolated vessels in neurocysticercosis [27,28], glioblastoma [29,30], multiple sclerosis [31] and schizophrenia [32], to date no studies have employed this approach to identify gene expression changes associated with normal ageing.
MicroRNAs (miRNAs) are small, non-coding RNA molecules (containing approximately 22 nucleotides) that target genes in a sequence-specific manner to modulate gene expression, mainly by degradation of mRNA or repression of expression [33,34]. They have recently been shown to target genes which regulate BBB permeability in animal models of ischaemic stroke [35] and human brain microvascular endothelial cells in vitro [36], indicating a role for miRNAs in modifying the integrity of the BBB.
Our previous histological characterisation of ageing human and mouse cohorts provides evidence of BBB dysfunction, loss of pericyte coverage and astrogliosis in normal human and murine brain ageing [37]. The current study extends these findings and investigates age-associated changes in the transcriptomic and miRNA profile of the NVU in ageing human and mouse cohorts, with the aim of defining age-associated gene expression changes and identifying potential targets to improve healthy brain ageing.

2. Results

2.1. Age-Associated Gene Expression Changes in the BBB

Gene expression analyses are sensitive to the presence of sample outliers, therefore rigorous quality control procedures were used to ensure the highest possible level of quality for both the human and mouse microarray datasets. Three human and two mouse arrays failed the quality control protocols due to a low number of present calls and were excluded from the analysis. The data was re-analysed after these cases were removed. All significant age-associated mRNA expression changes in the BBB of humans and mice are freely available at Gene Expression Omnibus (human array data accession number GSE127710 and mouse array data accession number GSE127709).
The number of significantly down-regulated genes in the BBB was higher than significantly up-regulated genes in human old age samples when compared to the young (299 up, 516 down, p < 0.01) and middle age groups (232 up, 604 down, p < 0.01). In contrast, the number of significantly up-regulated genes in the BBB was higher than down-regulated genes in the mouse 24-month age group when compared to either the 3 month (355 up, 37 down, p < 0.01) or 12 month time points (471 up, 98 down, p < 0.01) (Figure 1a). Analysis of significantly, differentially expressed genes that were altered in the same direction in both mouse and humans with ageing revealed little overlap, with 12 overlapping genes (Rho GTPase-activating protein 42 (ARHGAP42), Down syndrome cell adhesion molecule (DSCAM), endoplasmic reticulum lectin 1 (ERLEC1), glutamate ionotropic receptor NMDA type subunit 2C (GRIN2C), huntingtin (HTT), myocardial infarction associated transcript (MIAT), PHD finger protein 20 like 1 (PHF20L1), Snail family transcriptional repressor 2 (SNAI2), spectrin β, non-erythrocytic 1 (SPTBN1), protoporphyrinogen oxidase (PPOX), R3H domain containing 1 (R3HDM1) and histone-binding protein RBBP4 (RBBP4))(Figure 1b).

2.2. Pathway Enrichment Reveals Age-Related Changes in Genes Associated with DNA Binding and Apoptosis/Autophagy

Analysis of genes grouped by molecular function optimises false negative and false positive rates [38]; therefore we employed EnrichR and DAVID to interrogate the top 1000 genes from each comparison in both the human and mouse datasets either by fold change or by p-value in order to identify common pathways/functional groups affected by ageing. In the human dataset, analysis of the genes sorted by fold change identified 447 significantly, differentially expressed genes common to all three age group comparisons (Figure 2a), and by p-value identified 353 genes (Figure 2b). In the mouse dataset, analysis of the genes sorted by fold change identified 52 significantly, differentially expressed genes common to all three comparisons (Figure 2c), and by p-value identified 150 genes (Figure 2d).
The overlapping gene lists from each analysis were inputted into DAVID, with the aim of identifying gene networks and clusters of functionally similar genes. In the human dataset, analysis of the overlapping genes common to all three comparisons in the genes sorted by fold change identified three clusters with an enrichment score greater than 1.3 (DNA binding, kelch-like, tRNA modification), and in the genes sorted by p-value identified two clusters (DNA binding, apoptosis)(Table 1). In the mouse dataset, analysis of the overlapping genes common to all three comparisons in the genes sorted by p-value identified three clusters with an enrichment score greater than 1.3 (GTP binding, Armadillo-like, ion channel binding)(Table 1), but did not identify any clusters in the genes sorted by fold change using a high stringency filter.
To further analyse the data, the 353 human genes and 150 mouse genes from the overlapping genes common to all three comparisons in the genes sorted by p-value were assessed using EnrichR. Both the Reactome 2016 database and GO biological process indicated that both lists were significantly enriched for BH3-only proteins, which play an important role in initiating apoptosis and autophagy. Analysis of the human dataset identified: BCL2-like 11 (BCL2L11), BCL2 associated agonist of cell death (BAD) and tumor protein p53 (TP53), p = 0.0069 (Reactome 2016) and p = 0.0036 (GO biological process). Analysis of the mouse dataset identified: protein phosphatase 3 catalytic subunit gamma (PPP3CC), catenin beta 1 (CTNNB1), BH3 interacting domain death agonist (BID) and karyopherin subunit alpha 1 (KPNA1), p = 0.0073 (Reactome 2016).

2.3. Age-Associated miRNA Expression Changes in the Ageing BBB

In the human miRNA data analysis, 256 miRNAs were differentially altered in the same direction when the oldest group was compared to the younger cohort, and in the mouse analysis, 244 miRNAs were altered in the same direction. All significant age-associated miRNA expression changes in the BBB of human and mice are freely available at Gene Expression Omnibus. From these results, 15 miRNAs were identified that overlapped and showed altered expression in the ageing NVU of both species (miR-653-5p, miR-302a-5p, miR-206, miR-183-5p, miR-182-5p, miR-100-3p, miR-96-5p, miR-3065-3p, miR-1298-5p, miR-615-3p, miR-511-5p, miR-499-5p, miR-345-5p, miR-155-5p, miR-27a-5p), as shown in Figure 3.
The Targetscan software was used to specifically identify miRNAs with target genes relating to DNA binding and autophagy (identified in the human mRNA analysis). The miRNAs targeting genes related to autophagy were miR-181c-3p and 505-5p which target TP53 and miR-505-5p which targets arylsulfatase A (ARSA), while those targeting genes related to DNA binding are shown in Table 2.

2.4. qPCR and Immunohistochemistry Validation of Age-Associated Candidate Gene Expression Changes

Validation candidates were selected from the initial microarray analysis based upon species overlap (GRIN2C and SNAI2), and functional overlap with large fold changes (CDC42 binding protein kinase-β (CDC42BPB): fold change (FC) = 5.41). Additional validation candidates were selected from the DNA binding (Activating Transcription Factor 6 (ATF6) and zinc finger protein 90 (ZNF90)) and apoptosis/autophagy (beclin 1 (BECN1), RB1-inducible coiled-coil 1 (RB1CC1), tumor protein p53 (TP53) clusters identified by the DAVID and EnrichR analyses. Consistent with microarray results, qPCR analysis revealed a similar but non-significant directional change in expression of GRIN2c (p = 0.078), CDC42BPB (p = 0.142), ATF6 (p = 0.056) and ZNF90 (p = 0.611) in the ageing human BBB (Figure 4).
Immunohistochemistry confirmed expression of the protein encoded by the candidate genes was associated with the BBB. Immunostaining for SNAIL, encoded by SNAI2, Figure 5a and p53, encoded by TP53, Figure 5b revealed a predominantly nuclear specific signal that was present in a proportion of all cell types, including the BBB where immunoreactive endothelial cell nuclei were identified by their location and typical elongated shape. Immunoreactivity for RB1CC1 was predominantly associated with capillaries as shown in Figure 5c. In addition to endothelial immunoreactivity, beclin-1 cytoplasmic staining of pyramidal neurones was present throughout the cortex, Figure 5d.
qPCR demonstrated the same directional change of expression for miR-155-5p (Figure 6a,b), miR-1298-5p (Figure 6c,d) and miR-182-5p (Figure 6e,f) in both the human and mouse ageing groups, consistent with the directional change observed in the miRNA analysis. Only the age change in miR-182-5p in human samples achieved statistical significance in the oldest group (p = 0.032).

3. Discussion

Vascular pathology and dysfunction of the NVU may contribute to the onset and progression of AD [39], however the molecular mechanisms underpinning these changes in the ageing brain are poorly defined. Using a combined LCM and expression profiling approach, the current study characterised age-associated changes in the RNA profile of the NVU in an ageing mouse model and an ageing human cohort, identifying mRNA and miRNA expression changes at the NVU which suggest a role for the dysregulation of autophagy and DNA binding in age-associated vascular pathology.
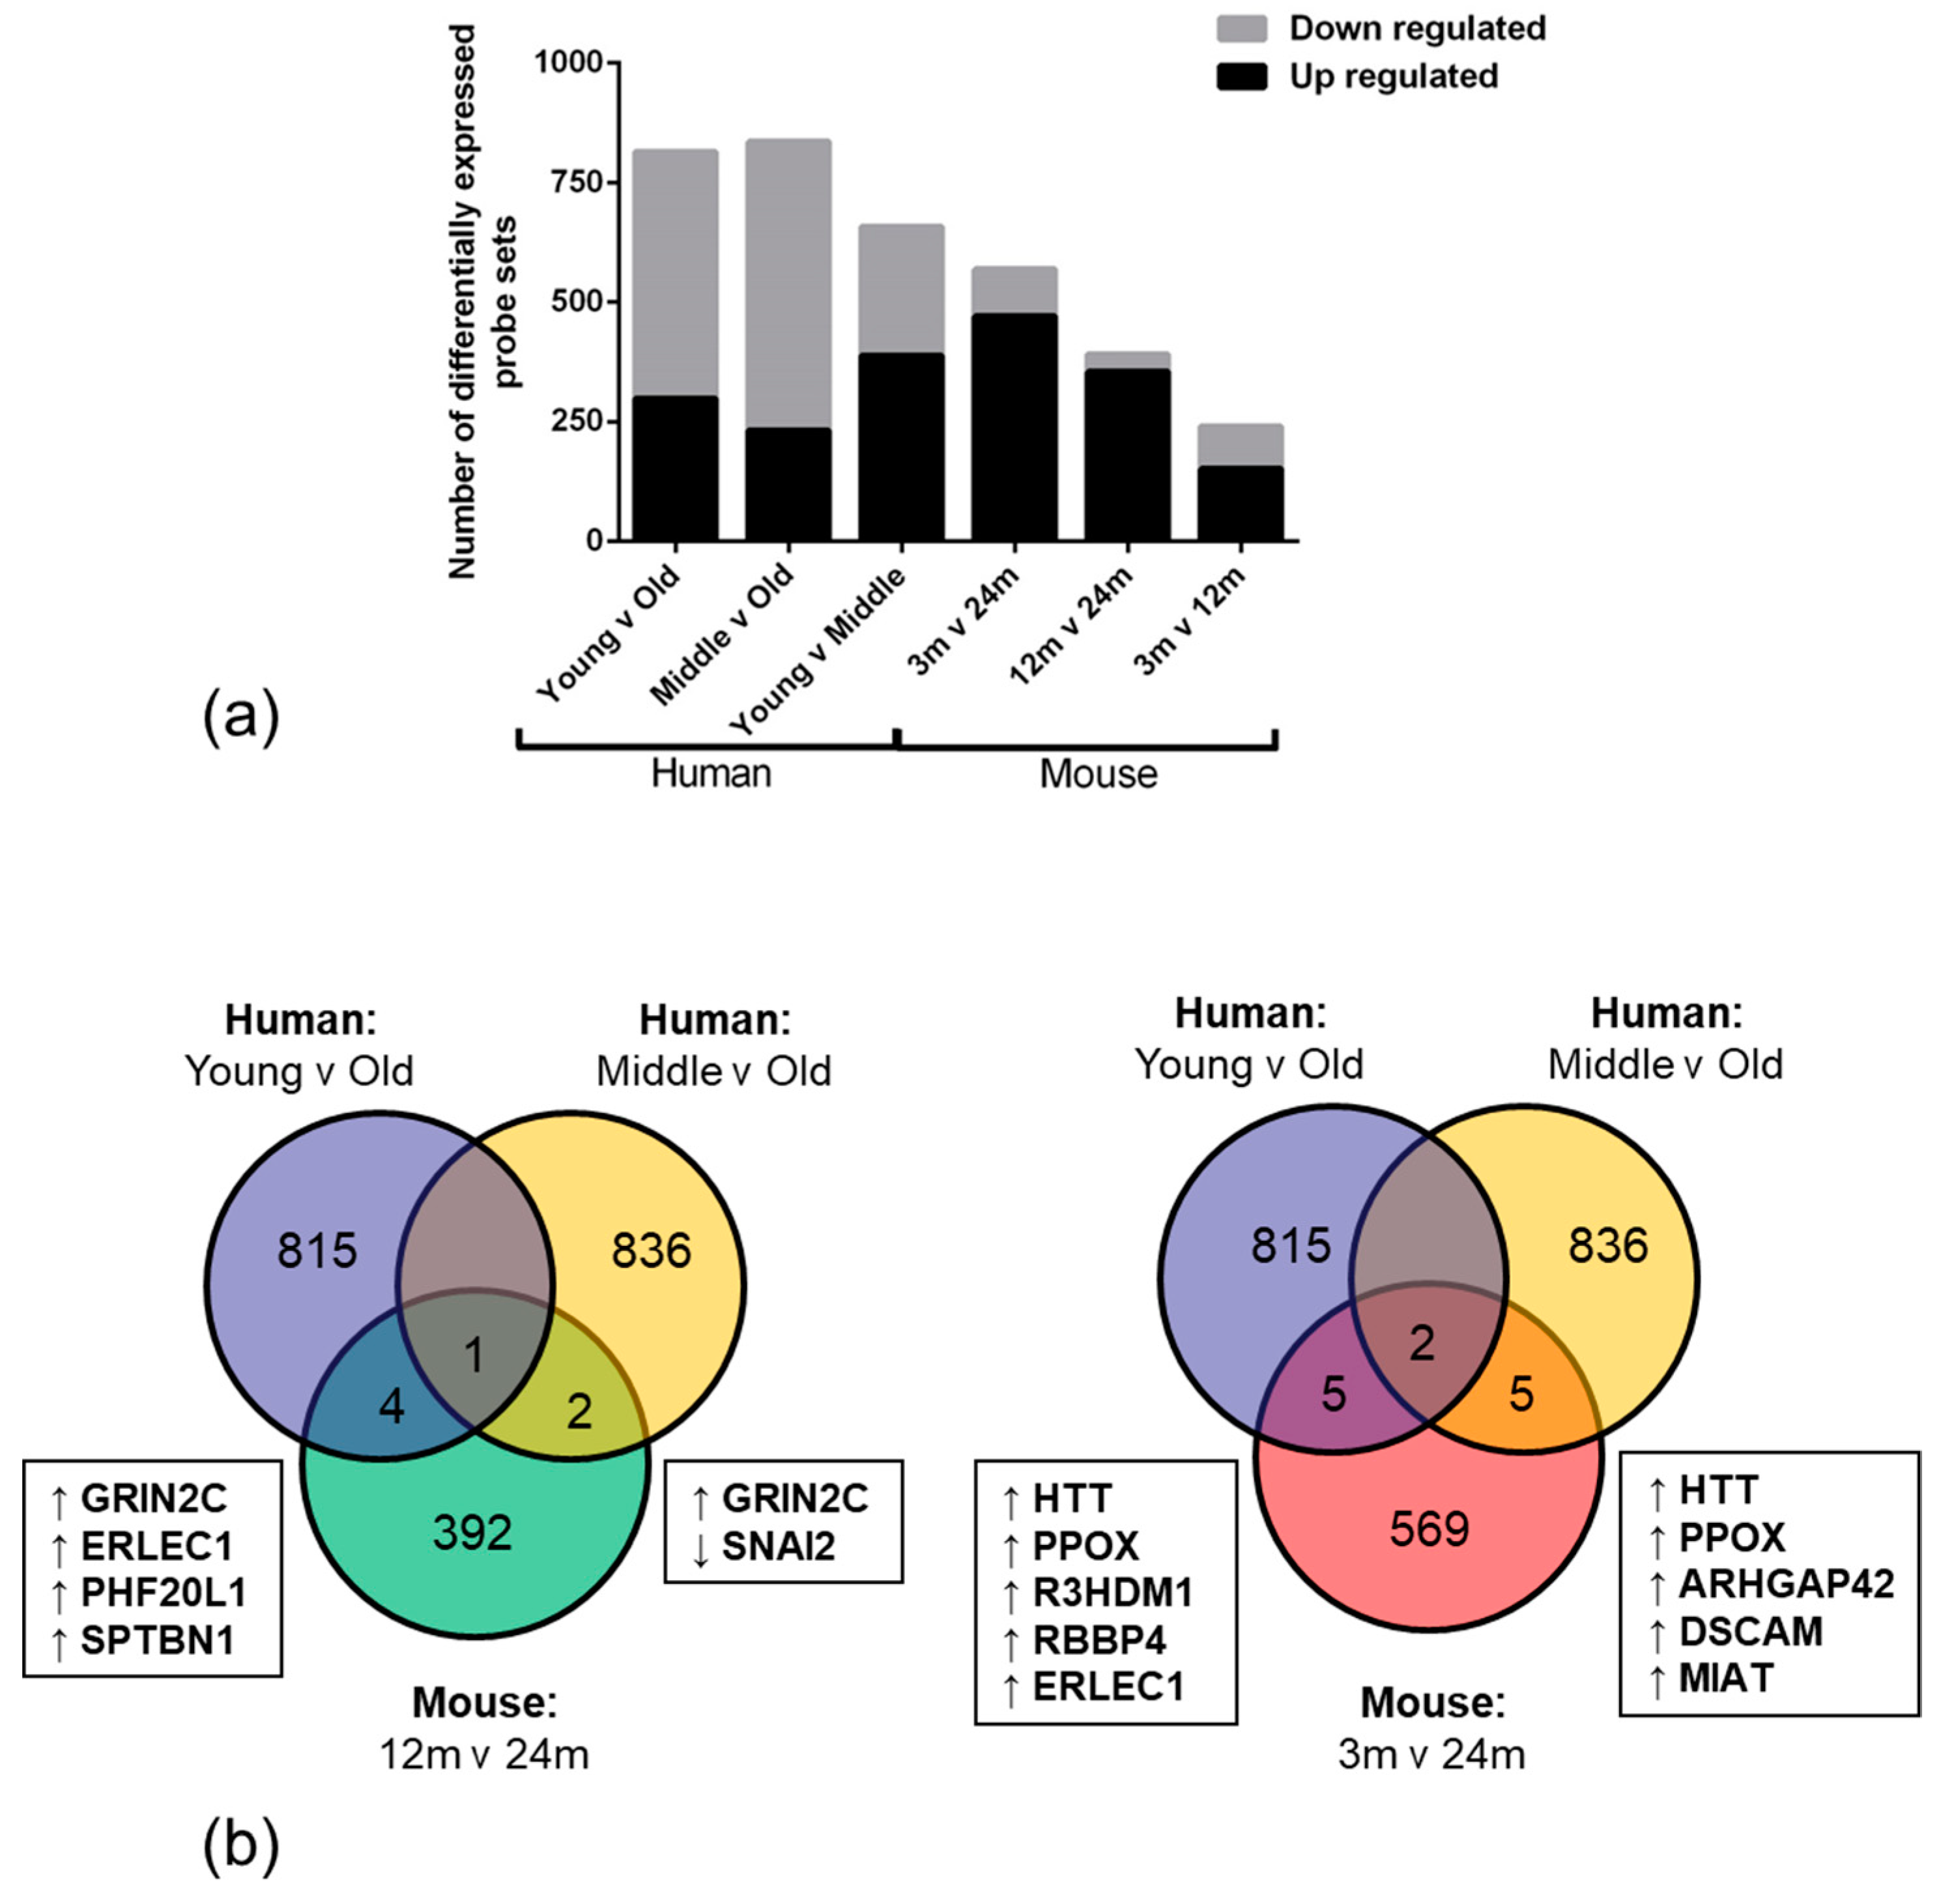
High throughput RNA expression technology enables the use of genome-wide approaches to explore and identify differences in biological conditions, such as ageing. We report that the overall number of significantly down-regulated genes was higher in human old age samples when compared to the young samples. This observation suggests that ageing negatively impacts the transcriptome and may result in an overall age-associated decline in function in the NVU. The high number of upregulated genes in the mouse ageing cohort however, may reflect a developmental expression profile or species difference [40].
Only 12 overlapping genes were altered in the same direction in the NVU of both ageing human and mouse cohorts, including genes which play an important role in regulating vascular tone (ARHGAP42) [41]; cell adhesion, neurite outgrowth and axon guidance (DSCAM) [42]; repression of tight junction protein expression (SNAI2) [43,44]; cellular stress-response (ERLEC1) [45]; learning, memory and synaptic development (GRIN2C) [46], all processes prone to dysregulation with advancing age.
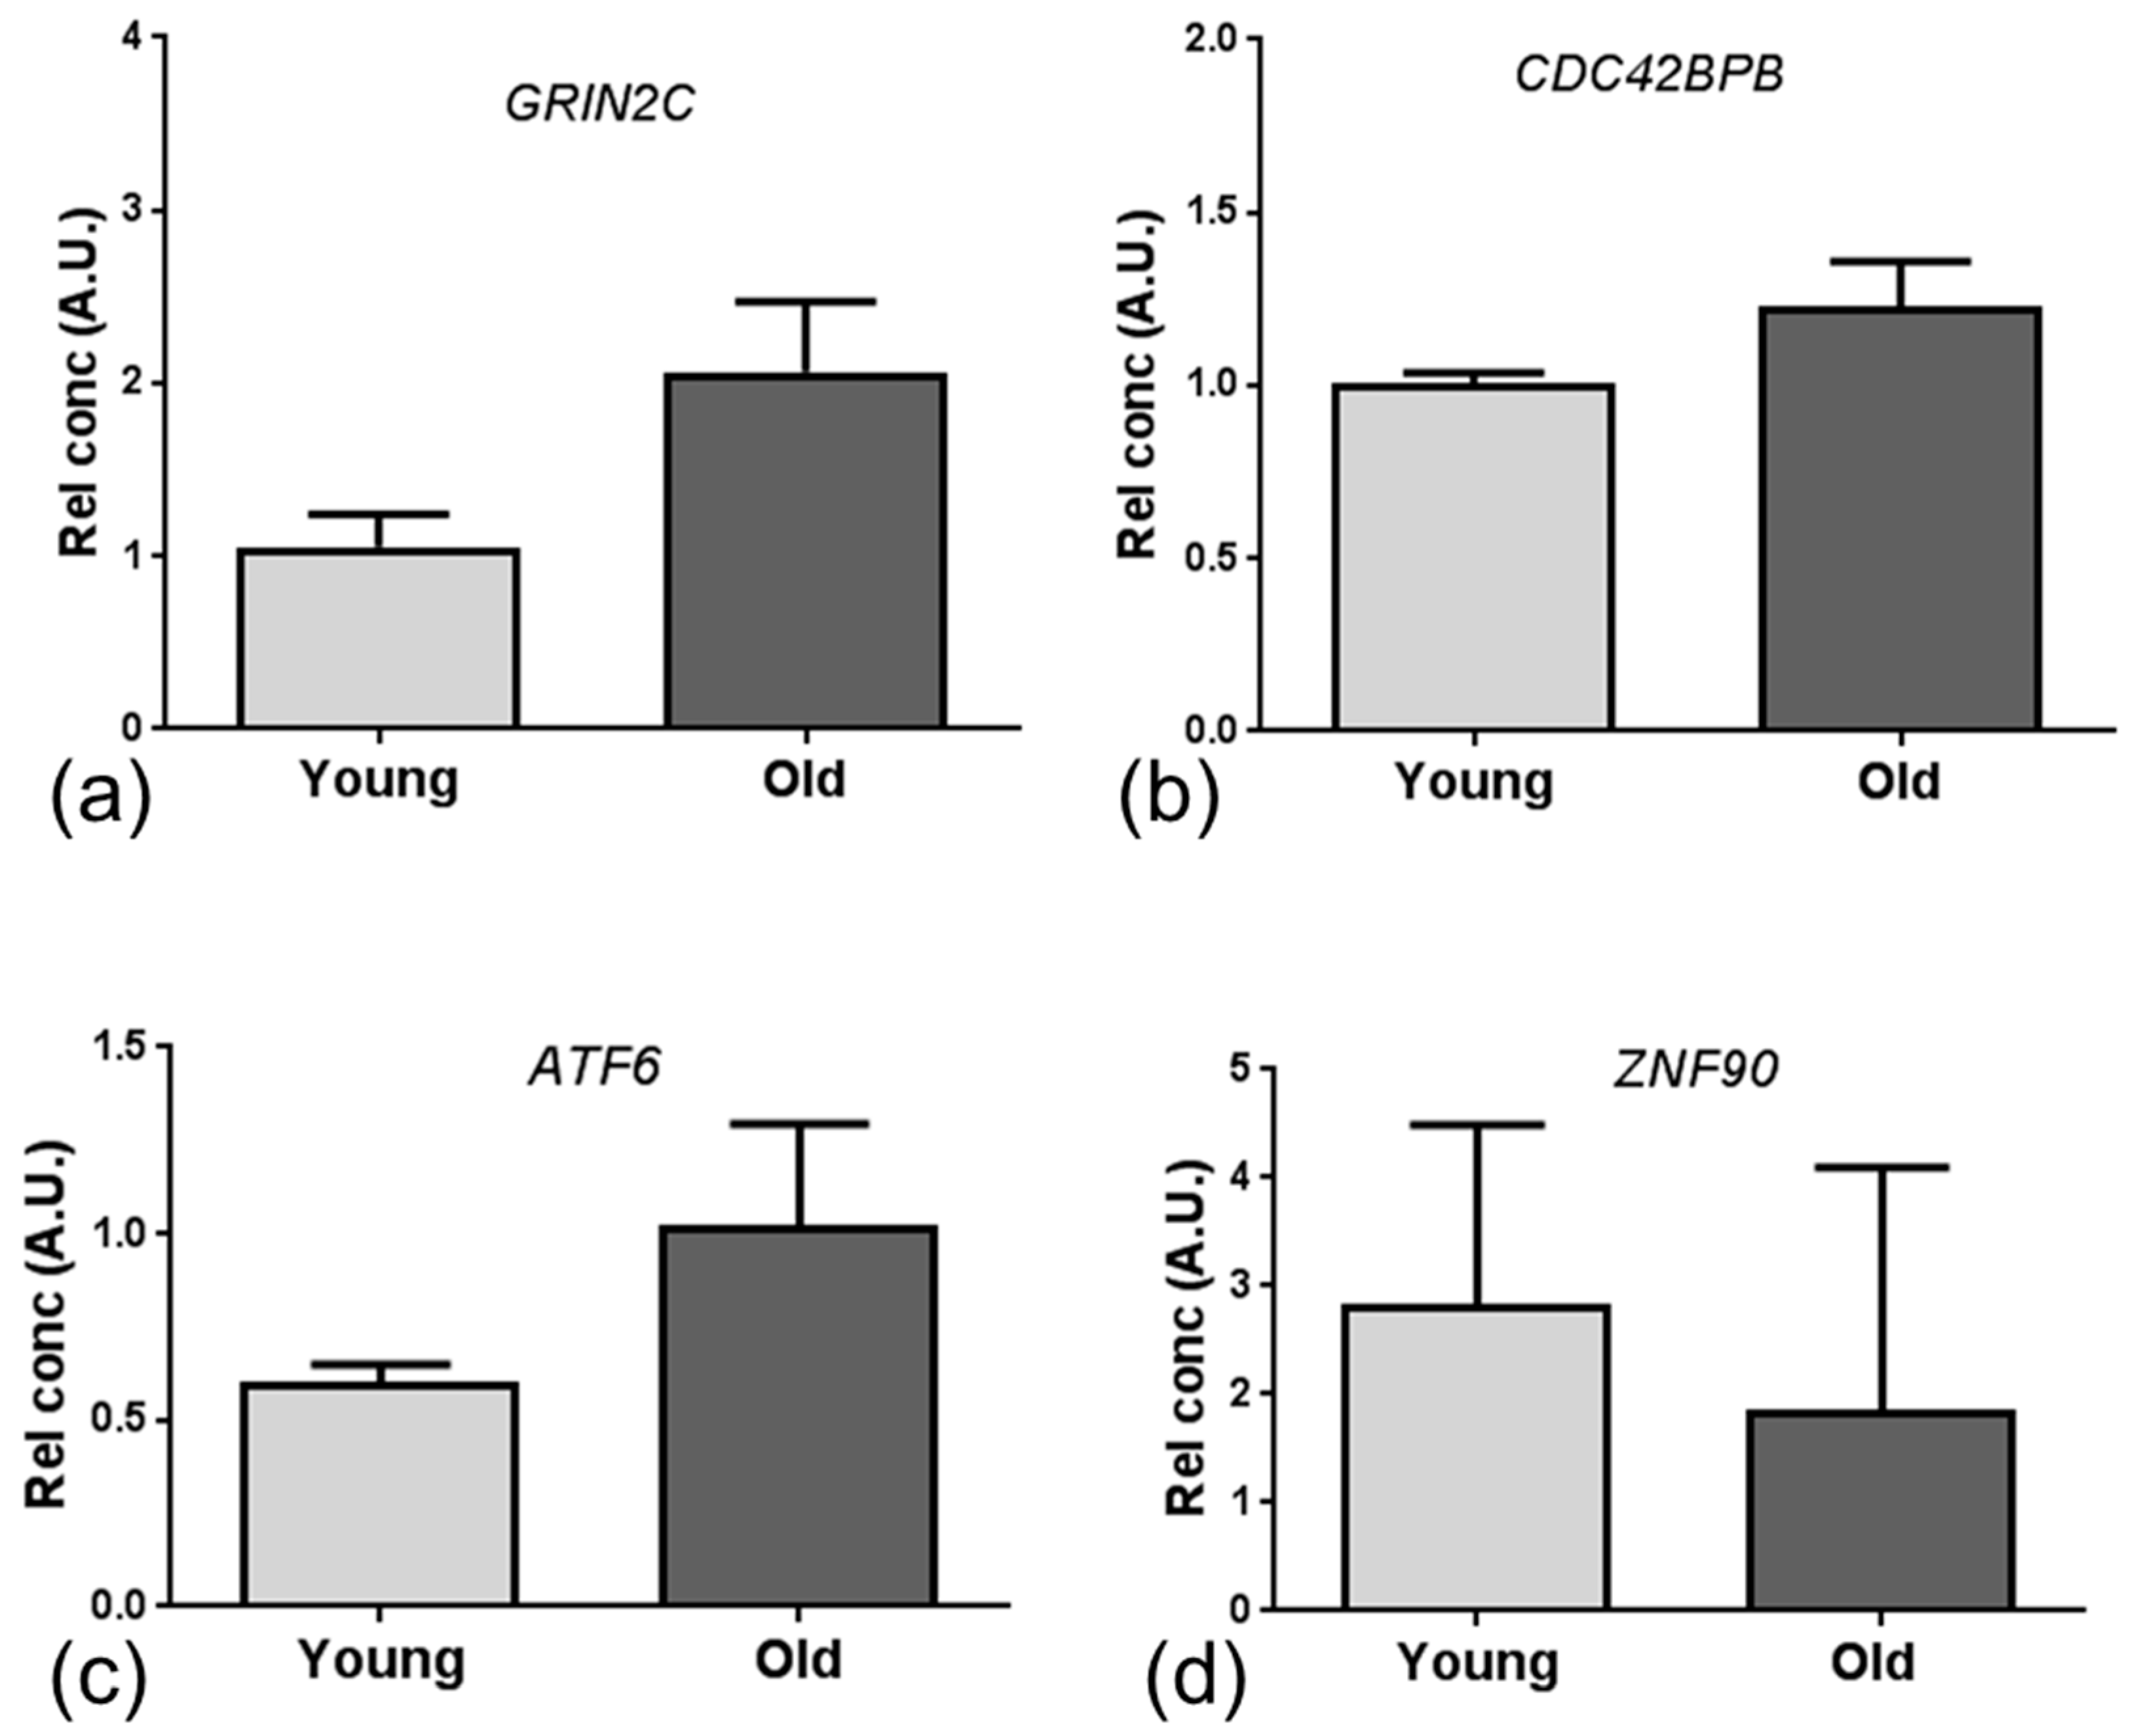
Given the low number of overlapping specific candidate genes, we employed integrated mRNA and miRNA network and pathway enrichment analysis of the ageing mouse and human NVU datasets, and identified transcriptomic changes associated with DNA binding and apoptosis/autophagy pathways. The major miRNA-targeted genes associated with DNA binding included zinc finger proteins (ZNF), activating transcription factor (ATF) and the Forkhead family of transcription factors (FOX). ZNF have a wide range of functions including interacting with DNA to regulate transcription, as reviewed in [47]. In the current study we identified dysregulated expression of several members of the ZNF family, including ZNF704, which is a suggested potential candidate gene for healthy ageing [48], and ATF6, a member of the leucine zipper family of transcription factors which plays a major role in regulating tissue homeostasis in response to stress [49], and is expressed at high levels in a range of neurodegenerative diseases including amyotrophic lateral sclerosis [50]. We also report dysregulated expression of several members of the FOX transcription factors, including FOXA1 which plays a role in the response to stress and is associated with the AD-gene signature [51] and FOXP1 which regulates expression of immune genes [52]. Together these findings suggest that dysregulation of DNA binding genes which regulate transcription of stress response and immune response-related genes may be an early event in age-associated changes at the NVU.
Several studies indicate dysregulation of autophagy, a lysosome-dependent process in which organelles and proteins are degraded, as a contributing factor to the pathogenesis of AD, as recently reviewed [53], with autophagy-associated markers detected in vessels in AD [54] and impaired autophagic protein degradation associated with apoptosis of endothelial cells [55]. In addition to identifying dysregulation of autophagy-associated BECN1 and the apoptosis-related gene TP53, we also confirmed endothelial expression of beclin-1 and p53 by endothelial cells, supporting the findings of previous studies [56,57], and suggesting that dysregulation of the apoptosis/autophagy pathway may contribute to dysfunction of the NVU in the ageing brain.
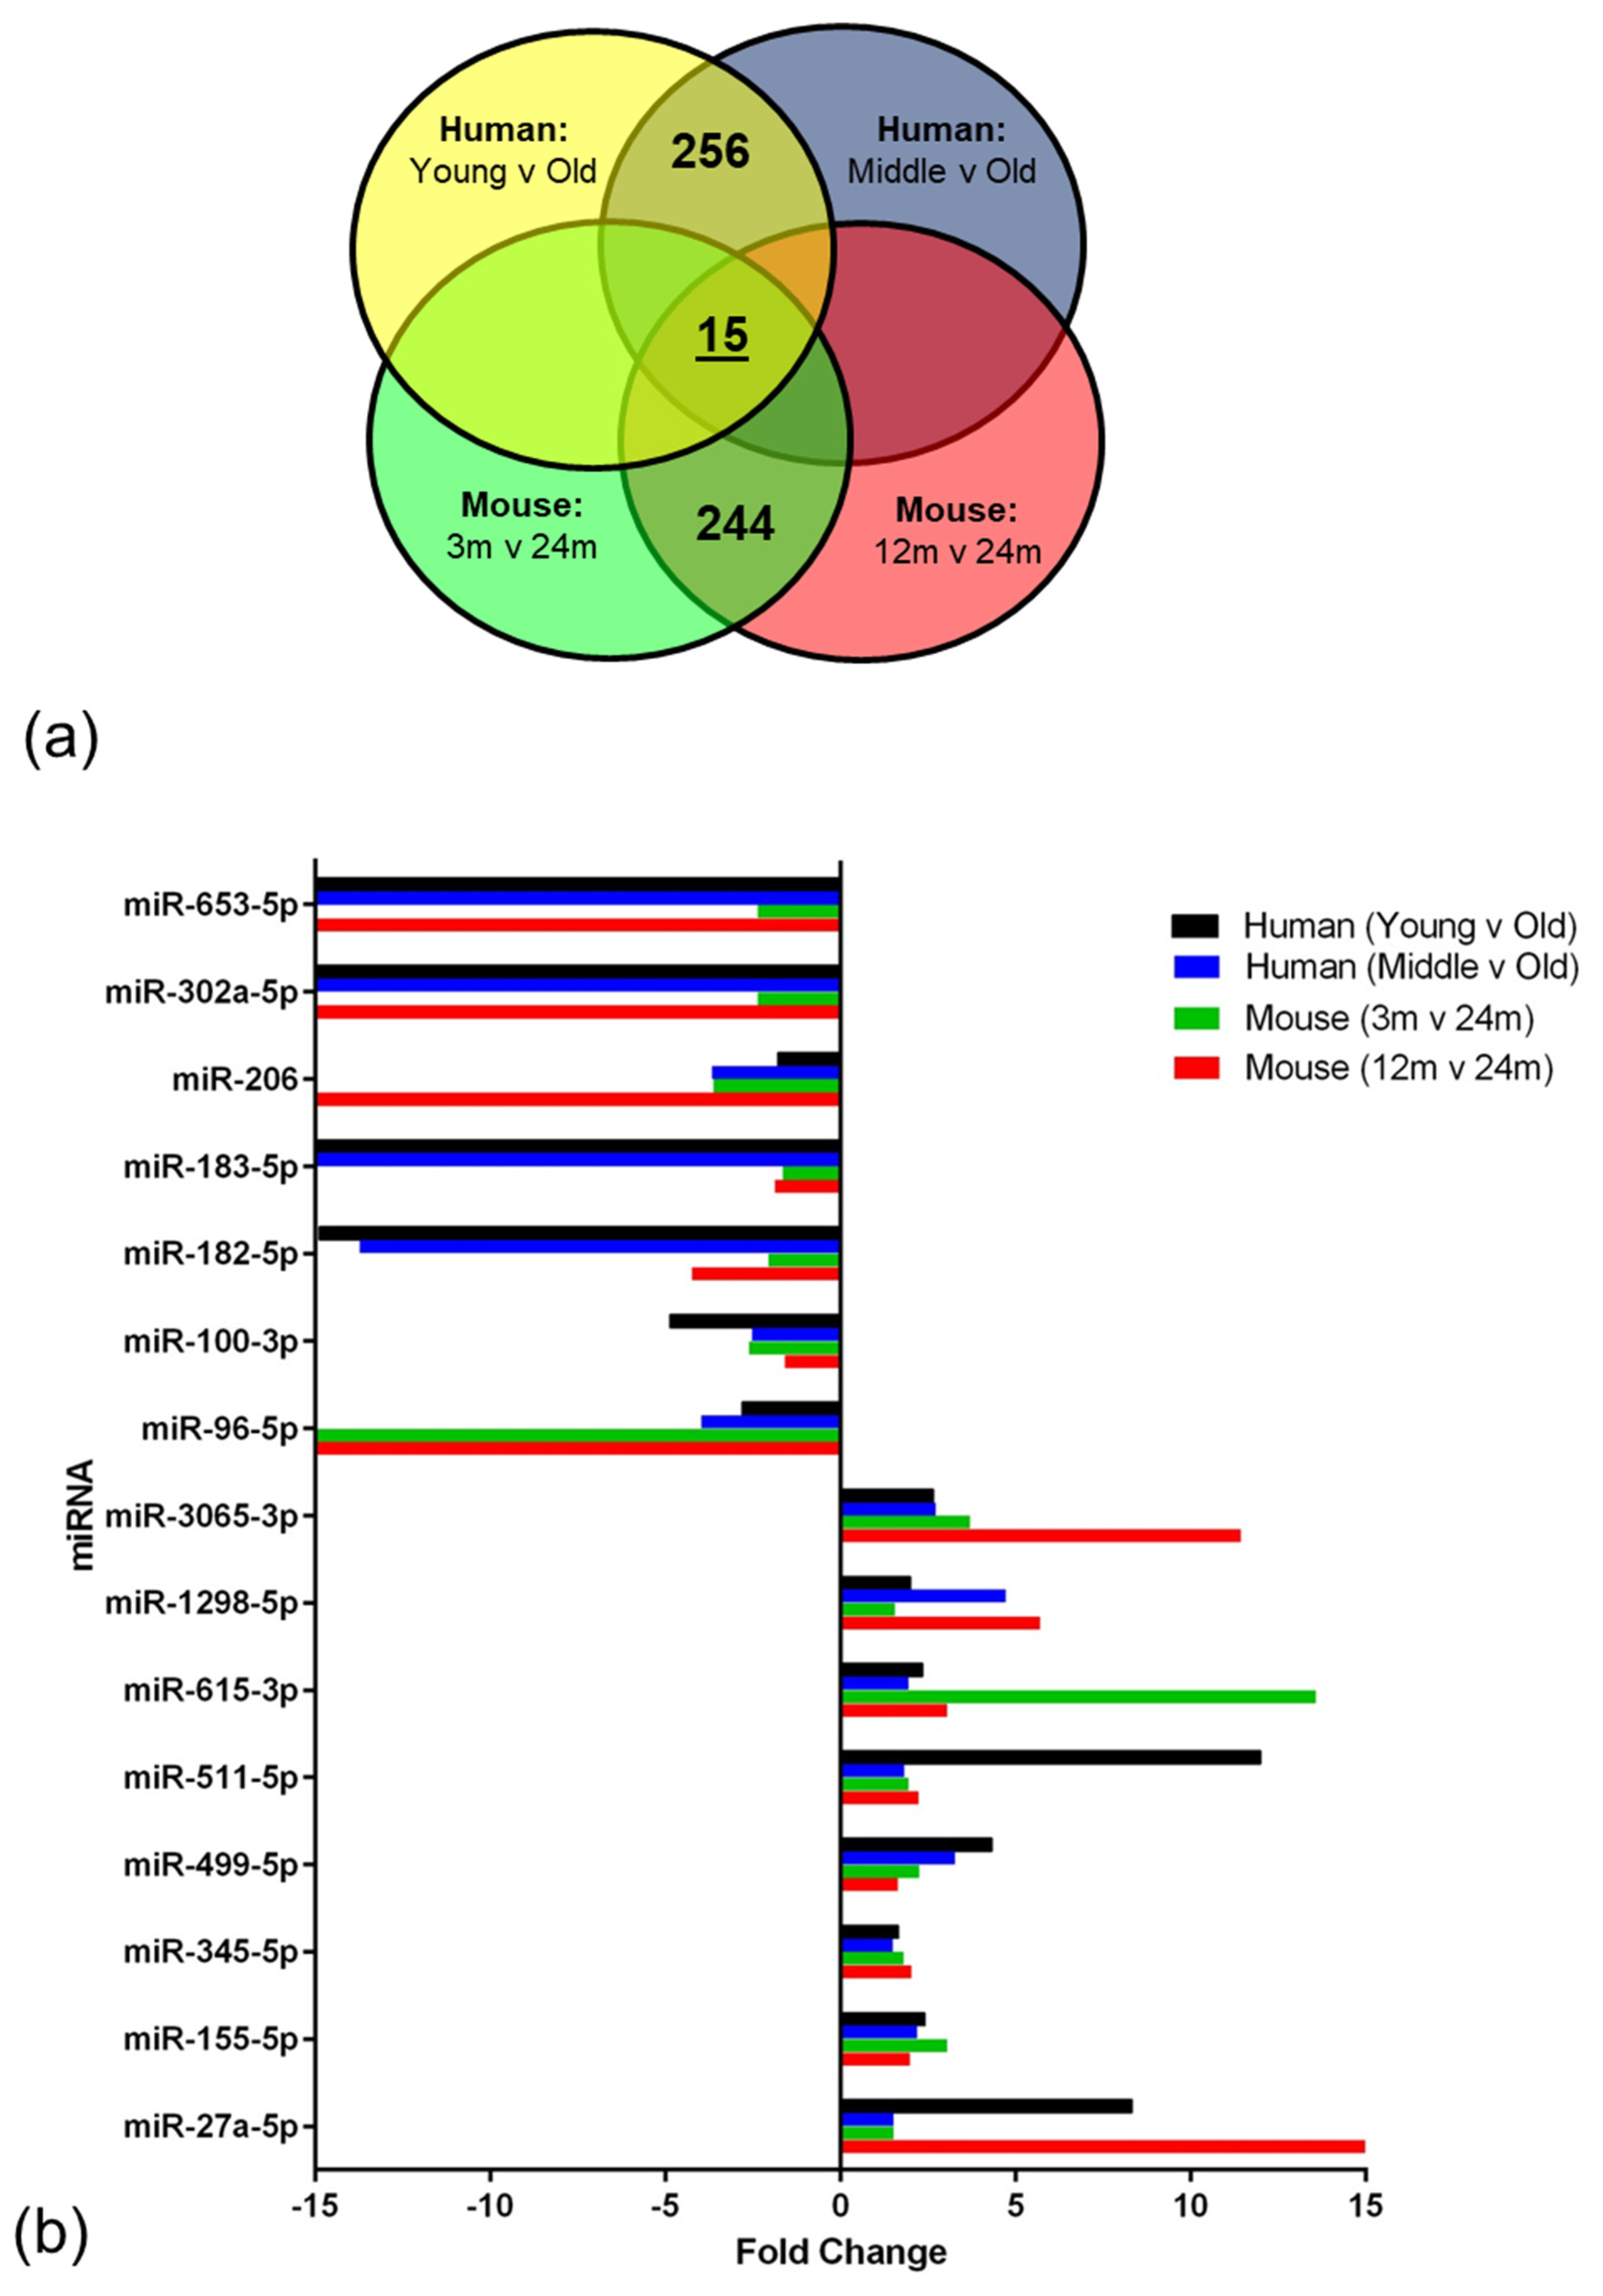
miRNAs regulate a diverse range of biological processes by interacting with their target mRNA, usually to repress translation [
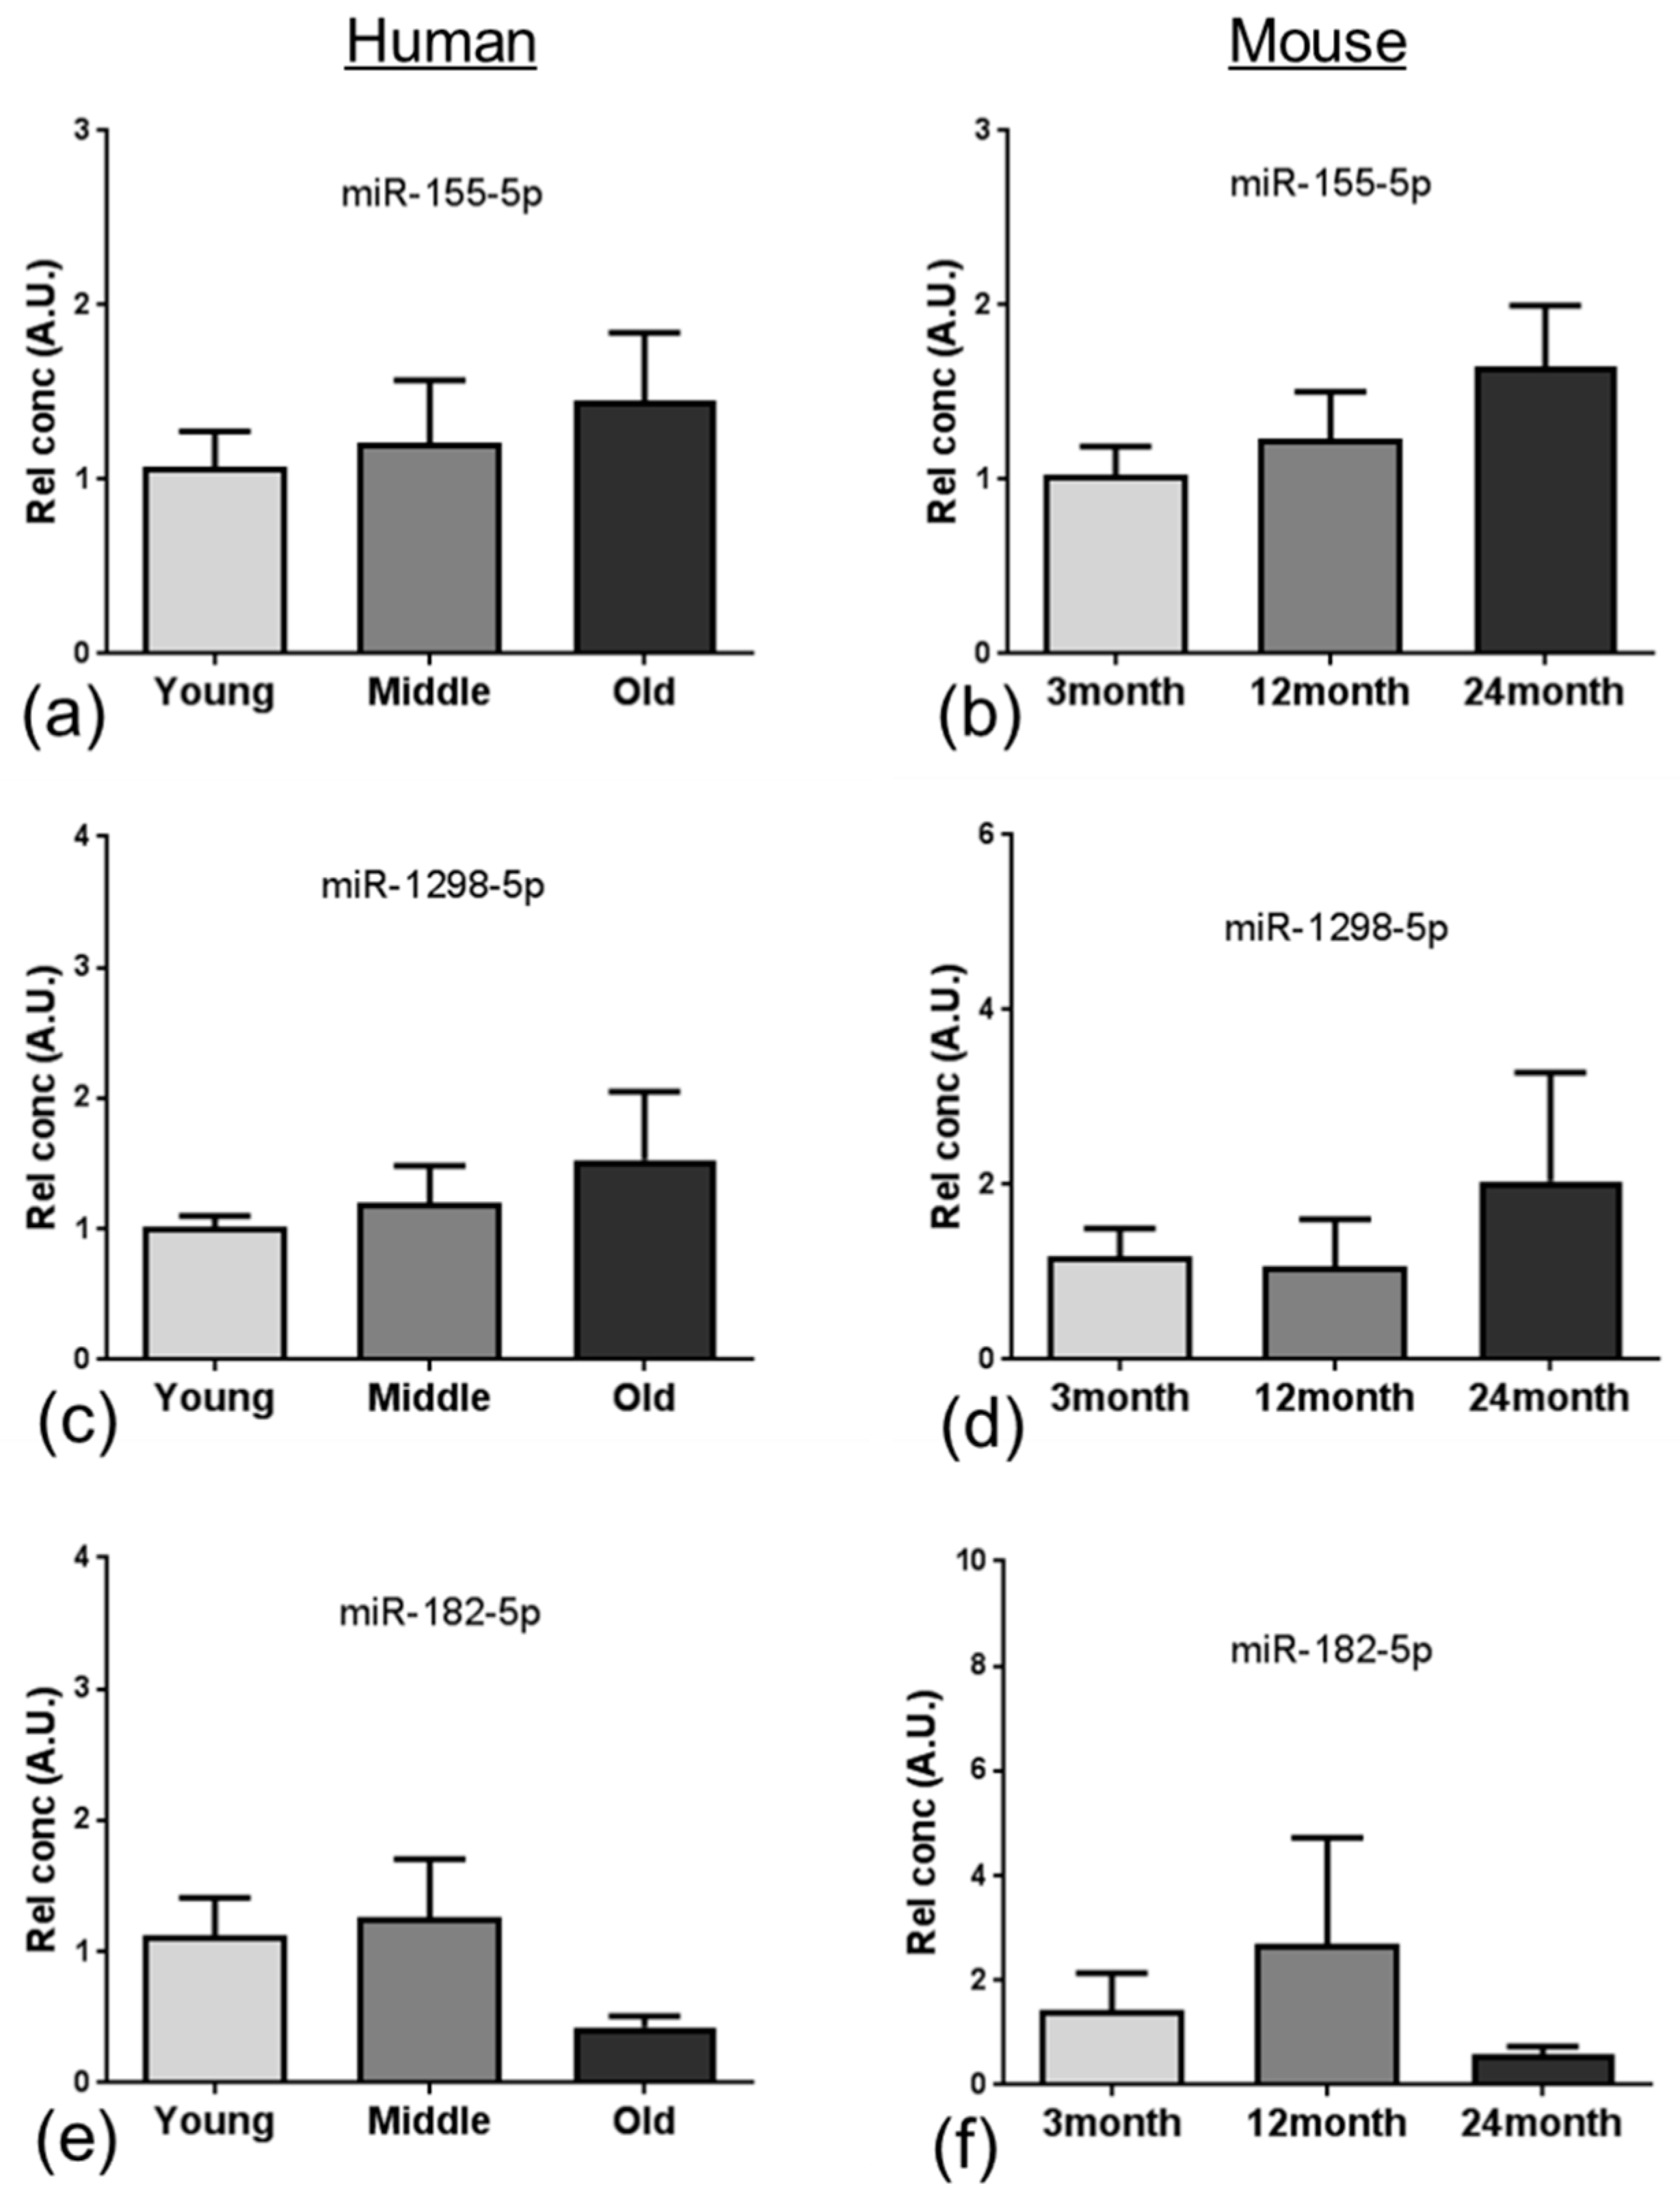
58]. In the current study, integrated analysis of miRNA and mRNA expression profiling identified 15 miRNAs that overlapped and showed altered expression in the ageing NVU of both species. In addition to targeting genes related to DNA binding and/or autophagy, many of these well characterised miRNAs play a role in several age-relevant processes. We report increased expression of miR-155, one of the most well characterised miRNAs, which has also been detected in patients and animal models of AD [59] and Down syndrome dementia [60,61], and has been shown to play a role in regulating the neuroinflammatory response in AD [62] and contributing to BBB dysfunction in multiple sclerosis [63] and cerebral malaria [64]. While the majority of miR-345 studies to date have focussed on the role in the induction of apoptosis in cancer [65,66], miR-345-5p has been identified as a potential blood biomarker in multiple sclerosis patients [67], indicating that this miRNA plays a role in neurological disease. Interestingly miR-27a has recently been shown to protect against BBB dysfunction in a mouse model of intracerebral haemorrhage [68] and to protect against traumatic brain injury by suppressing autophagy [69], suggesting that the significant increased expression of miR-27a in the ageing NVU may play a neuroprotective role.
Several of the miRNAs identified in the analysis presented a significant reduction in expression, including miR-96, which is associated with an increased neuroinflammatory response [70]; miR-100 which regulates expression of major components of the mechanistic target of rapamycin (mTOR), transforming growth factor-β and insulin signalling pathways in brain endothelial cells [71]; miR-182 and miR-183 which regulate SUMOylation and act to preserve homeostasis under stress [72]; and miR-206, which is differentially expressed in patients with mild cognitive impairment, as recently reviewed [73].
While our study discusses our findings with respect to ageing, it should be acknowledged that other factors may have influenced BBB dysfunction in the human cohort. For example, raised venous pressure peri-mortem may have impacted the BBB in the youngest age group cases that died by suspension ligature [74], and ischemic heart disease may have impacted the BBB in the older cohort [75]. Such co-morbidities are an inevitable limitation with human autopsy cohorts.
Animal models of ageing and age-associated disease are crucial to research and offer the opportunity to identify novel molecular mechanisms underlying age-associated neuropathology, however, the findings of the current study suggest that the data generated in these models should be interpreted with caution as not all the candidates identified are relevant to human disease and cannot be directly translated. Overall our integrated mRNA and miRNA network analysis of the NVU transcriptome in ageing human and mouse cohorts identified dysregulation of apoptosis/autophagy and DNA binding networks, in addition to biologically relevant RNA changes which impact BBB function and CNS homeostasis. Future studies to interrogate these candidate changes in more detail have the potential to develop targeted therapeutic approaches to prevent vascular dysfunction in the ageing brain.

4. Materials and Methods

4.1. Study Cohort

Frozen samples of post mortem human prefrontal association cortex (Brodmann areas 8/9) from cases without a history of neurological disease were obtained from the Edinburgh Medical Research Council Sudden Death Brain Bank, who granted approval for the use of tissue in this study (Edinburgh Brain Bank REC reference 11/ES/0022). The cohort represented young adult (20–30 years [y], n = 5), middle aged (44–57 y, n = 5) and old aged individuals (71–79 y, n = 5). Haematoxylin and eosin stained sections were examined from each case by a neuropathologist (S.B.W.), and immunohistochemistry was carried out with antibodies phospho-tau (AT8) and β-amyloid, to document age-associated pathological changes (Table 3).
C67BL/6 male mice were purchased from Charles River at 3, 12 and 24 months old (n = 5 per group). Animals were sacrificed, perfused with phosphate buffered saline (PBS) and the brain dissected and snap frozen in liquid nitrogen. All animal experiments were conducted following ethical review processes in accordance with the Animals (Scientific Procedures) Act 1986 of the UK government (Home Office Project Licence Number 8002612, approval date 30th April 2013) and the ARRIVE guidelines (Animal Research: Reporting of In Vivo Experiments: https://www.nc3rs.org.uk/arrive-guidelines).

4.2. Laser Capture Microdissection

Laser capture microdissection (LCM) of microvascular cells was performed using a standard protocol [76]. Frozen sections (7 μm) were stained for Collagen IV (1:200, AbCam, UK ab6586) using a rapid avidin-biotinylated complex-horse radish peroxidase complex (ABC-HRP) immunostaining protocol to visualise vessels. Subsequently, sections were dehydrated in a graded series of ethanol, extensively cleared in xylene and air dried for 1 h. Microvascular cells were microdissected using an Arcturus Veritas Laser Capture Microdissection System (Arcturus Bioscience Inc., Mountainview, CA, USA), and collected onto two thermoplastic-coated CapSure caps (ThermoFisher, Altrincham UK) per sample. Following microdissection, caps were secured in 0.5 mL tubes, incubated with RNA PicoPure® extraction buffer (Life Technologies, Paisley, UK) at 42 °C for 30 min. A work flow of the study design is outlined in Figure 7.

4.3. Total RNA Extraction

The cell/extraction buffer solution from two caps per sample was combined, then divided equally. For mRNA extraction, 50 μL of sample was taken through the PicoPure® RNA isolation protocol according to the manufacturer’s instructions, with mRNA eluted in 10 μL of PicoPure® elution buffer. For miRNA extraction, the remaining 50 μL of sample was passed through a Centri Spin™-10 purification column (Princeton Separations Inc, Adelphia, NJ, USA) according to manufacturer’s instructions. All RNA samples were stored at −80 °C prior to expression profiling.

4.4. mRNA Expression Profiling

Transcriptional profiling of the BBB isolated from an ageing mouse cohort was performed using Affymetrix Mouse Genome 430 2.0 Arrays (Affymetrix, Santa Clara, CA, USA). In the human cohort we profiled samples using Human Genome U133 PLUS 2.0 Arrays (Affymetrix). Total RNA was annealed to an oligo-d(T) primer with a T7 polymerase binding site. After generation of double-stranded cDNA, copy RNA (cRNA) was transcribed which then formed the RNA template for a second round of amplification. At the end of this round, after synthesis of double-stranded cDNA, biotin-labelled cRNA was prepared using the Affymetrix Gene Chip (Affymetrix) in vitro transcription labelling kit. Following clean-up of the biotin-labelled cRNA the material was assayed (Agilent Bioanalyser 2100, Stockport, UK) to ensure sufficient RNA of appropriate quality had been prepared. Labelled cRNA (12.5 µg) was fragmented, applied to the gene chips and hybridised over 16 h at 45 °C in a rotating oven at 60 rpm. Post hybridisation washing and sample staining was carried out using the Fluidics Station 400 and the Gene Chip Operating System (GCOS). Gene chips were scanned using the GC3000 7G scanner and data processed for quality control using Expression Console software (Affymetrix) and analysis carried out using Qlucore Omics Explorer (Qlucore, Lund, Sweden). Further analysis was carried out using R statistical language as detailed below.

4.5. miRNA Expression Profiling

Extracted miRNA samples from each age group (3, 12 and 24 months in the mice and young, middle, old in humans) were pooled. miRNA profiling was performed with miRNome miScript miRNA PCR arrays (Qiagen, Hilden, Germany) in accord with the manufacturer’s recommendations, using a CFX Real-Time PCR System instrument (Bio-Rad, Hercules, CA, USA). All miRNome qPCR experiments were performed in 384 well plates, with a set of normalisation and technical controls repeated on each plate.

4.6. Data Analysis: mRNA

Analysis of microarray output was conducted using the R statistical language with statistical packages available from Bioconductor (LIMMA and PUMA) (www.bioconductor.org). Multi-chip modified gamma model for oligonucleotide signal (MMGMOS) normalization, using median global scaling, followed by present/absent MAS5 filtering, was applied to process the data. Subsequently, the improved probability of positive log ratio (IPPLR) in PUMA was used to identify differentially expressed genes between the age groups in each species, minimum 1.2 fold change (FC). In the human data, the middle aged group comprised of exclusively male samples, to eliminate potential influence of gender bias in the data a PUMA comparison of male versus female genes was completed within the old age group, and significantly differentiated genes removed from further age group comparisons. The gene lists were analysed by EnrichR and the Database for Annotation Visualisation and Integrated Discovery bioinformatics programme (DAVID) was used to group genes according to their function [77,78].
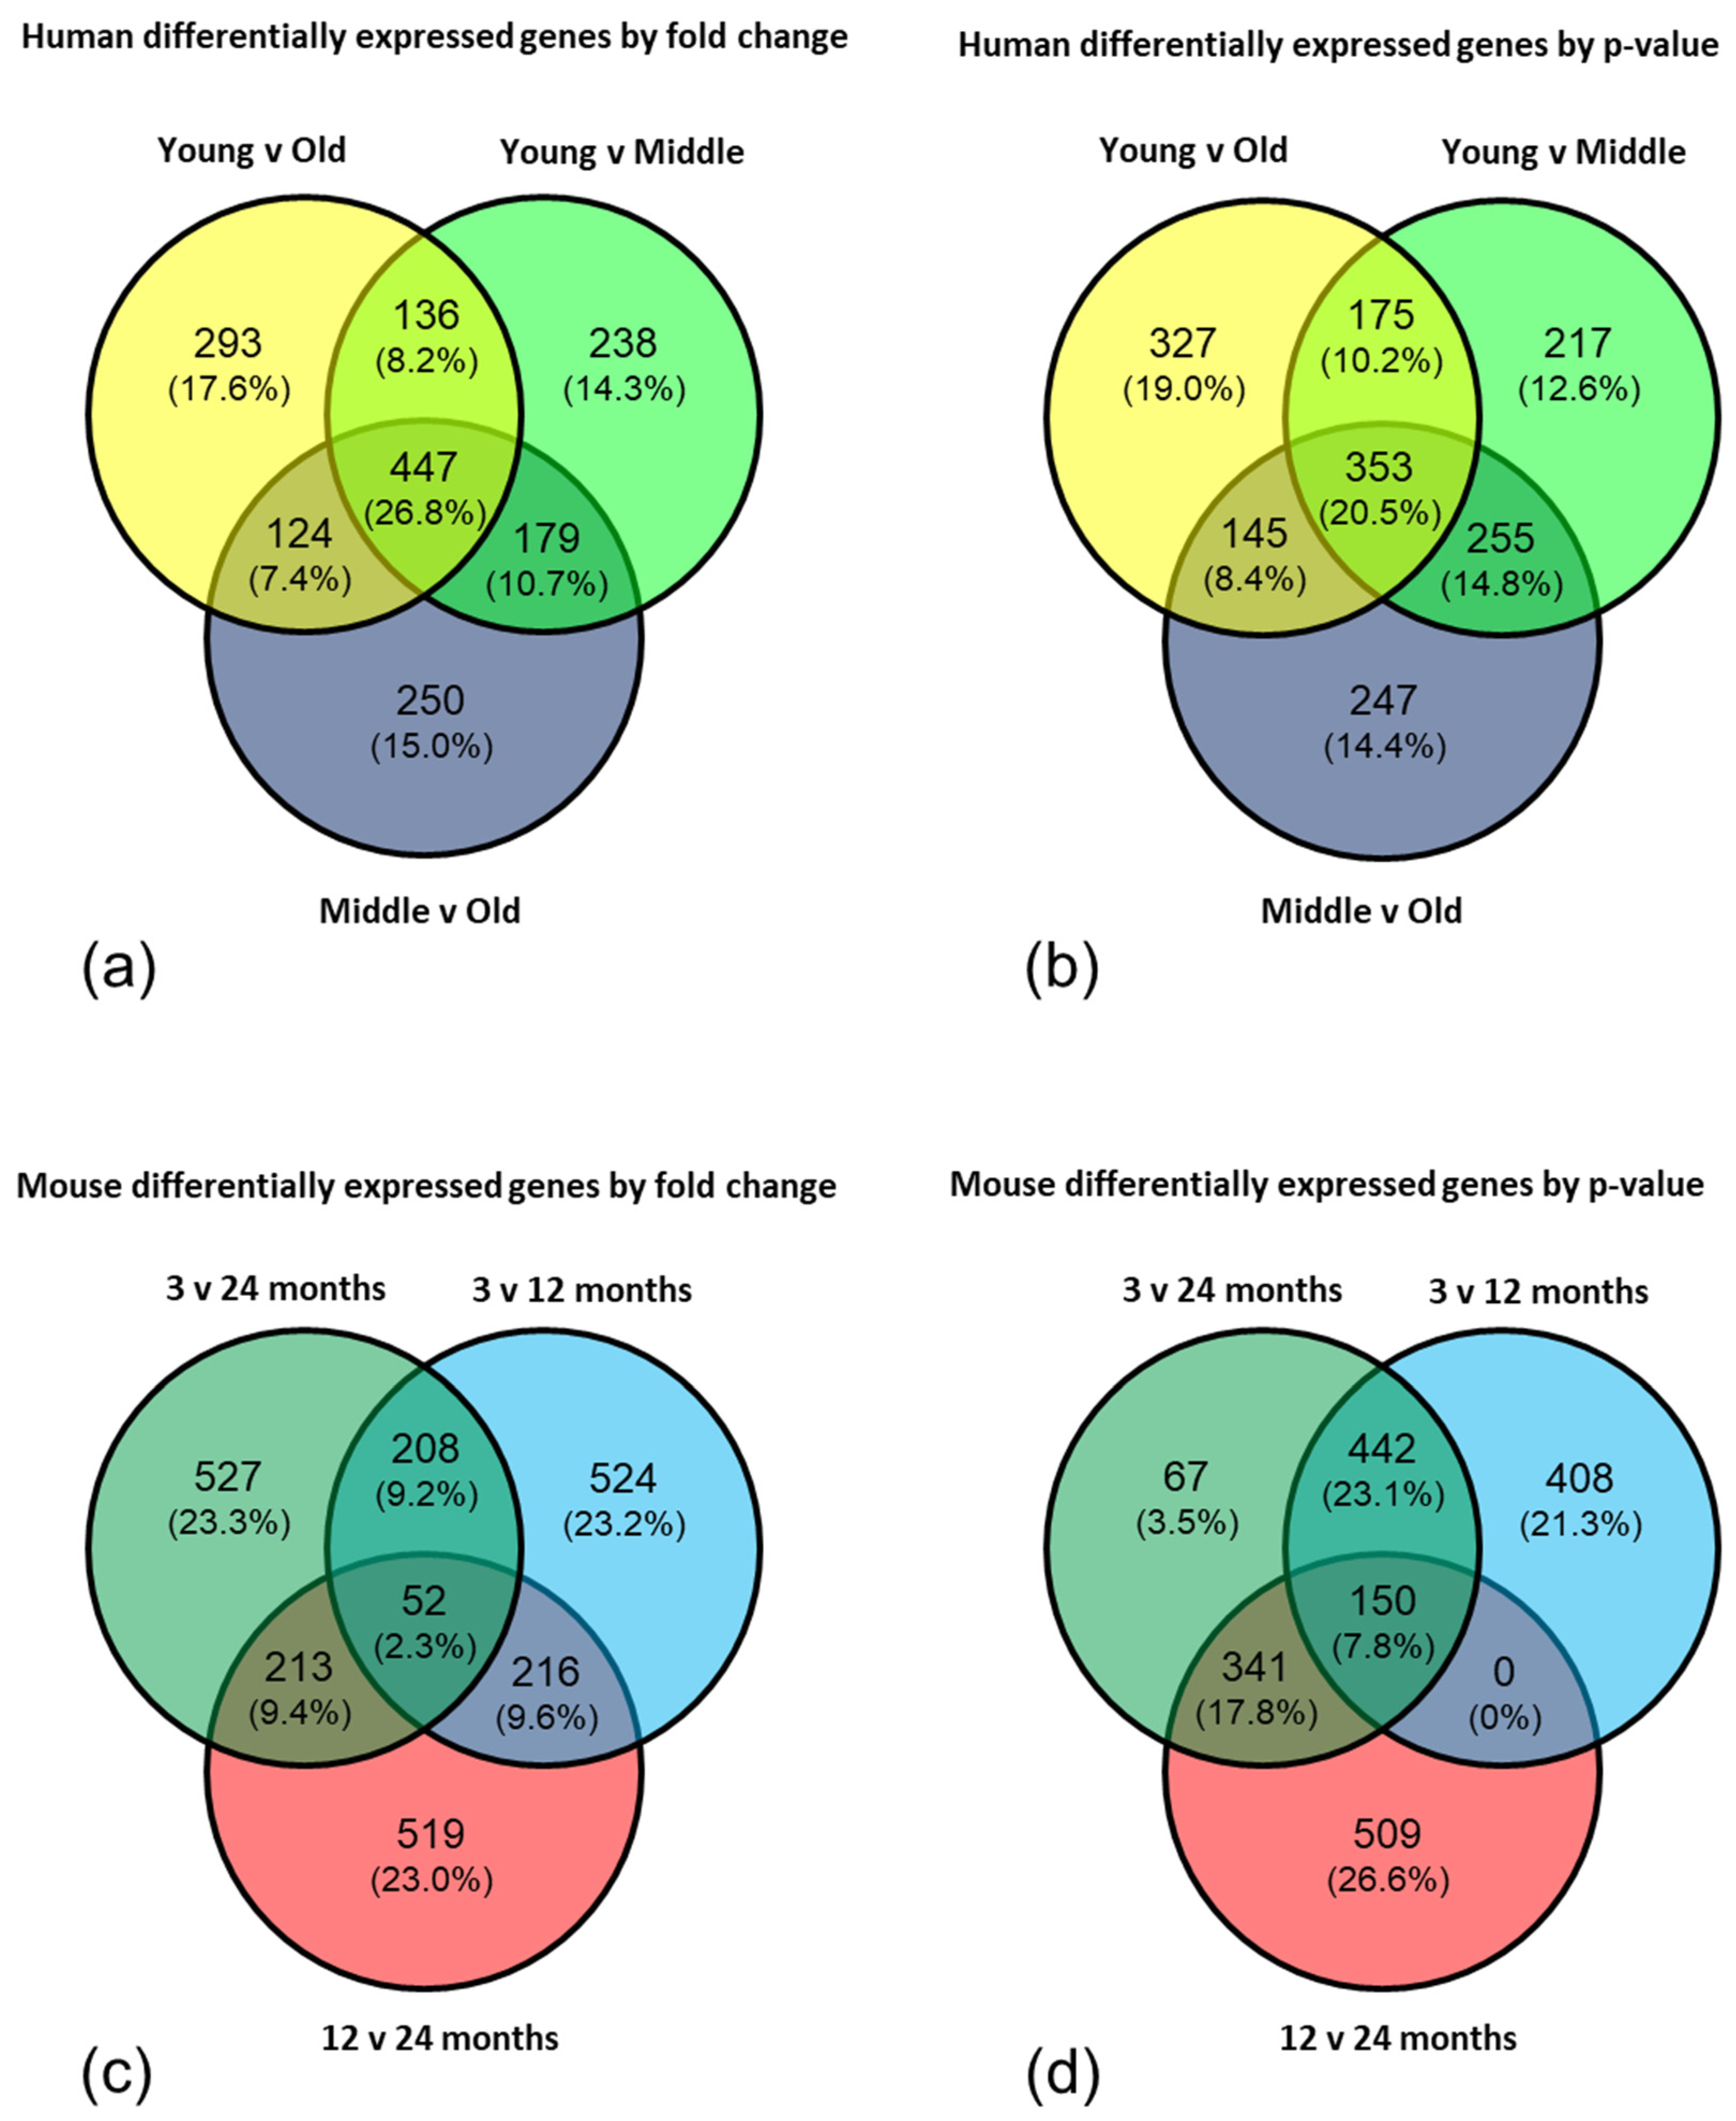
To further interrogate the data, the top 1000 genes from each comparison (young versus old; young versus middle aged; middle aged versus old) in both the human and mouse datasets were selected by fold change and by p-value and Venn diagrams created to highlight the significantly, differentially expressed genes which appeared in all three comparisons. The gene lists from the centre of each Venn diagram were analysed by EnrichR and DAVID using a high stringency filter to reduce the rate of false positives, and an enrichment score >1.3 (corresponding to a p-value <0.05) considered significant.

4.7. Data Analysis: miRNA

Expression data for 1008 human miRNAs and 940 mouse miRNAs obtained from the Qiagen miRNome PCR arrays was analysed using the HTqPCR package from Bioconductor [79]. Data was filtered to remove miRNAs with a Ct value >37 in all samples. Geometric mean normalisation was applied to each individual 384 well plate, followed by global normalisation using the quantile method after data was combined to constitute each miRNome dataset. NormFinder analysis of internal controls was used to identify the most stable genes (Human: SNORD61 and SNORD68, mouse: SNORD68 and SNORD96A) for ΔCt and fold change calculations using the ΔΔCt method of relative quantification. Subsequently, miRNAs were ranked according to fold change in age group comparisons and considered differentially expression based on ≥1.5 fold change. Enrichment analysis using Diana mir-Path software allowed identification of molecular pathways potentially altered by the expression of multiple miRNAs. Target genes of these miRNAs were downloaded from Targetscan and compared to the mRNA array datasets.

4.8. Quantitative PCR

RNA was extracted from laser captured microvessels using PicoPure RNA isolation kit as described above and cDNA synthesized with the qScript cDNA supermix kit (Quanta Biosciences, Gaithersberg, MD, USA) in a G-Storm thermocycler (G-Storm, Somerton, UK). In contrast to the miRNA array profiling which was conducted on pooled samples from each age group, for qPCR individual samples in each age group were analysed. qPCR was performed using IDT PrimeTime qPCR assays (Integrated DNA Technologies, Glasgow, UK) and Brilliant qPCR mix (Agilent) in a reaction volume of 5 μL using a CFX Real-Time PCR System instrument (Bio-Rad) (Table 4). β-actin was amplified on each plate to normalize expression levels of target genes using the ΔΔCt method, and differences in mRNA or miRNA expression assessed by student’s t-test or ANOVA, respectively.

4.9. Immunohistochemistry

To confirm BBB expression of proteins encoded by the candidate genes, immunostaining was performed using a standard avidin biotinylated enzyme complex (ABC) method, and the signal visualised with diaminobenzidine (Vector Laboratories, Peterborough, UK). A summary of the primary antibodies used is shown in Table 5.

Author Contributions

Conceptualization, S.B.W., I.A.R., P.R.H. and J.E.S.; methodology, E.F.G., D.B., D.R.D., V.L. and J.E.S.; formal analysis, E.F.G., V.L., P.R.H., J.C-K., S.B.W., I.A.R. and J.E.S.; writing—original draft preparation, J.E.S.; writing—review and editing, E.F.G., C.W., J.E.S., P.R.H., M.J.S., I.A.R. and S.B.W.

Funding

This research was funded by the BBSRC (BB/K006711/1 to S.B.W. and P.R.H. and BB/K009184/1 to I.A.R. and M.J.S.), the British Neuropathological Society and an Alzheimer’s Research UK network grant. The Open University is incorporated by Royal Charter (RC 000391), an exempt charity in England and Wales and a charity registered in Scotland (SC 038302). The Open University is authorised and regulated by the Financial Conduct Authority.

Acknowledgments

Tissue for the ageing autopsy cohort was provided by the MRC Edinburgh Brain and Tissue Bank. We would like to express our gratitude to the donors and their relatives for their generous donations. We would also like to thank C.A. McKenzie of the Edinburgh Brain and Tissue Bank for facilitating tissue provision.

Conflicts of Interest

The authors declare no conflict of interest.

Abbreviations

ABC-HRPAvidin-biotinylated complex-horse radish peroxidase
ADAlzheimer’s disease
ARHGAP42Rho GTPase-activating protein 42
ARSAarylsufatase A
ATFActivating Transcription Factor
BADBCL2 associated agonist of cell death
BBBblood-brain barrier
BCL2L11BCL2-like 11
BECN1beclin 1
BIDBH3 interacting domain death agonist
CDC42BPBCDC42 binding protein kinase-β
CNScentral nervous system
CSFcerebrospinal fluid
CTNNB1catenin beta 1
DAVIDDatabase for Annotation Visualisation and Integrated Discovery
DSCAMDown syndrome cell adhesion molecule
EBF1early B-Cell Factor 1
ERCC1excision repair cross-complementation group 1
ERLEC1endoplasmic reticulum lectin 1
FCfold change
FLI1friend leukemia integration 1 transcription facto
FOXForkhead family of transcription factors
GEOGene Expression Omnibus
GFAPglial fibrillary acidic protein
GRIN2Cglutamate ionotropic receptor NMDA type subunit 2C
HTThuntingtin
IKZF1Ikaros family zinc finger protein 1
IPPLRimproved probability of positive log ratio
KPNA1karyopherin subunit alpha 1
LCMlaser capture microdissection
MAFFv-maf avian musculoaponeurotic fibrosarcoma oncogene homolog F
MIATmyocardial infarction associated transcript
miRNAmicroRNA
MMGMOSmulti-chip modified gamma model for oligonucleotide signal
mRNAmessenger RNA
mTORmechanistic target of rapamycin
NFIBnuclear factor I B
NFLneurofilament light
NVU neurovascular unit
PBSphosphate buffered saline
PHF20L1PHD finger protein 20 like 1
PPOXprotoporphyrinogen oxidase
PPP3CCprotein phosphatase 3 catalytic subunit gamma
R3HDM1R3H domain containing 1
RBBP4histone-binding protein RBBP4
RB1CC1RB1-inducible coiled-coil 1
RCOR3REST Corepressor 3
SNAI2Snail family transcriptional repressor 2
SPTBN1spectrin β, non-erythrocytic 1
TCF7L1transcription factor 7-like 1
TP53tumor protein p53
vWFvon Willibrand factor
ZFHX4zinc finger homeobox 4
ZKSCAN3zinc finger with KRAB and SCAN domains 3
ZNFzinc finger protein

References

  1. Zlokovic, B.V. The blood-brain barrier in health and chronic neurodegenerative disorders. Neuron 2008, 57, 178–201. [Google Scholar] [CrossRef] [PubMed]
  2. Erdo, F.; Denes, L.; de Lange, E. Age-associated physiological and pathological changes at the blood-brain barrier: A review. J. Cereb. Blood Flow Metab. 2017, 37, 4–24. [Google Scholar] [CrossRef] [PubMed]
  3. Bors, L.; Toth, K.; Toth, E.Z.; Bajza, A.; Csorba, A.; Szigeti, K.; Mathe, D.; Perlaki, G.; Orsi, G.; Toth, G.K.; et al. Age-dependent changes at the blood-brain barrier. A Comparative structural and functional study in young adult and middle aged rats. Brain Res. Bull. 2018, 139, 269–277. [Google Scholar] [CrossRef] [PubMed]
  4. Erdo, F.; Trapp, T.; Mies, G.; Hossmann, K.A. Immunohistochemical analysis of protein expression after middle cerebral artery occlusion in mice. Acta Neuropathol. 2004, 107, 127–136. [Google Scholar] [CrossRef] [PubMed]
  5. Iadecola, C. The Neurovascular Unit Coming of Age: A Journey through Neurovascular Coupling in Health and Disease. Neuron 2017, 96, 17–42. [Google Scholar] [CrossRef] [Green Version]
  6. Kisler, K.; Nelson, A.R.; Montagne, A.; Zlokovic, B.V. Cerebral blood flow regulation and neurovascular dysfunction in Alzheimer disease. Nat. Rev. Neurosci. 2017, 18, 419–434. [Google Scholar] [CrossRef] [PubMed] [Green Version]
  7. Zipser, B.D.; Johanson, C.E.; Gonzalez, L.; Berzin, T.M.; Tavares, R.; Hulette, C.M.; Vitek, M.P.; Hovanesian, V.; Stopa, E.G. Microvascular injury and blood-brain barrier leakage in Alzheimer’s disease. Neurobiol. Aging 2007, 28, 977–986. [Google Scholar] [CrossRef] [PubMed]
  8. Ryu, J.K.; McLarnon, J.G. A leaky blood-brain barrier, fibrinogen infiltration and microglial reactivity in inflamed Alzheimer’s disease brain. J. Cell. Mol. Med. 2009, 13, 2911–2925. [Google Scholar] [CrossRef] [PubMed]
  9. Viggars, A.P.; Wharton, S.B.; Simpson, J.E.; Matthews, F.E.; Brayne, C.; Savva, G.M.; Garwood, C.; Drew, D.; Shaw, P.J.; Ince, P.G. Alterations in the blood brain barrier in ageing cerebral cortex in relationship to Alzheimer-type pathology: A study in the MRC-CFAS population neuropathology cohort. Neurosci. Lett. 2011, 505, 25–30. [Google Scholar] [CrossRef] [PubMed]
  10. Montagne, A.; Barnes, S.R.; Sweeney, M.D.; Halliday, M.R.; Sagare, A.P.; Zhao, Z.; Toga, A.W.; Jacobs, R.E.; Liu, C.Y.; Amezcua, L.; et al. Blood-brain barrier breakdown in the aging human hippocampus. Neuron 2015, 85, 296–302. [Google Scholar] [CrossRef] [PubMed]
  11. van de Haar, H.J.; Burgmans, S.; Jansen, J.F.; van Osch, M.J.; van Buchem, M.A.; Muller, M.; Hofman, P.A.; Verhey, F.R.; Backes, W.H. Blood-Brain Barrier Leakage in Patients with Early Alzheimer Disease. Radiology 2016, 281, 527–535. [Google Scholar] [CrossRef] [PubMed]
  12. Iturria-Medina, Y.; Sotero, R.C.; Toussaint, P.J.; Mateos-Perez, J.M.; Evans, A.C.; Alzheimer’s Disease Neuroimaging, I. Early role of vascular dysregulation on late-onset Alzheimer’s disease based on multifactorial data-driven analysis. Nat. Commun. 2016, 7, 11934. [Google Scholar] [CrossRef] [PubMed]
  13. Ujiie, M.; Dickstein, D.L.; Carlow, D.A.; Jefferies, W.A. Blood-brain barrier permeability precedes senile plaque formation in an Alzheimer disease model. Microcirculation 2003, 10, 463–470. [Google Scholar] [PubMed]
  14. de la Torre, J.C.; Mussivand, T. Can disturbed brain microcirculation cause Alzheimer’s disease? Neurol. Res. 1993, 15, 146–153. [Google Scholar] [CrossRef] [PubMed]
  15. Zhu, X.; Lee, H.G.; Perry, G.; Smith, M.A. Alzheimer disease, the two-hit hypothesis: An update. Biochim. Biophys. Acta 2007, 1772, 494–502. [Google Scholar] [CrossRef] [PubMed] [Green Version]
  16. Zlokovic, B.V. Neurovascular pathways to neurodegeneration in Alzheimer’s disease and other disorders. Nat. Rev. Neurosci. 2011, 12, 723–738. [Google Scholar] [CrossRef]
  17. Lu, T.; Pan, Y.; Kao, S.Y.; Li, C.; Kohane, I.; Chan, J.; Yankner, B.A. Gene regulation and DNA damage in the ageing human brain. Nature 2004, 429, 883–891. [Google Scholar] [CrossRef] [PubMed]
  18. Berchtold, N.C.; Cribbs, D.H.; Coleman, P.D.; Rogers, J.; Head, E.; Kim, R.; Beach, T.; Miller, C.; Troncoso, J.; Trojanowski, J.Q.; et al. Gene expression changes in the course of normal brain aging are sexually dimorphic. Proc. Natl. Acad. Sci. USA 2008, 105, 15605–15610. [Google Scholar] [CrossRef] [Green Version]
  19. Colantuoni, C.; Lipska, B.K.; Ye, T.; Hyde, T.M.; Tao, R.; Leek, J.T.; Colantuoni, E.A.; Elkahloun, A.G.; Herman, M.M.; Weinberger, D.R.; et al. Temporal dynamics and genetic control of transcription in the human prefrontal cortex. Nature 2011, 478, 519–523. [Google Scholar] [CrossRef] [Green Version]
  20. Lu, T.; Aron, L.; Zullo, J.; Pan, Y.; Kim, H.; Chen, Y.; Yang, T.H.; Kim, H.M.; Drake, D.; Liu, X.S.; et al. REST and stress resistance in ageing and Alzheimer’s disease. Nature 2014, 507, 448–454. [Google Scholar] [CrossRef]
  21. Chen, C.Y.; Logan, R.W.; Ma, T.; Lewis, D.A.; Tseng, G.C.; Sibille, E.; McClung, C.A. Effects of aging on circadian patterns of gene expression in the human prefrontal cortex. Proc. Natl. Acad. Sci. USA 2016, 113, 206–211. [Google Scholar] [CrossRef] [PubMed]
  22. McPherson, C.A.; Aoyama, M.; Harry, G.J. Interleukin (IL)-1 and IL-6 regulation of neural progenitor cell proliferation with hippocampal injury: Differential regulatory pathways in the subgranular zone (SGZ) of the adolescent and mature mouse brain. Brain Behav. Immun. 2011, 25, 850–862. [Google Scholar] [CrossRef] [PubMed] [Green Version]
  23. Wang, X.; Zaidi, A.; Pal, R.; Garrett, A.S.; Braceras, R.; Chen, X.W.; Michaelis, M.L.; Michaelis, E.K. Genomic and biochemical approaches in the discovery of mechanisms for selective neuronal vulnerability to oxidative stress. BMC Neurosci. 2009, 10, 12. [Google Scholar] [CrossRef] [PubMed]
  24. Alldred, M.J.; Lee, S.H.; Petkova, E.; Ginsberg, S.D. Expression profile analysis of hippocampal CA1 pyramidal neurons in aged Ts65Dn mice, a model of Down syndrome (DS) and Alzheimer’s disease (AD). Brain Struct. Funct. 2015, 220, 2983–2996. [Google Scholar] [CrossRef] [PubMed]
  25. Simpson, J.E.; Ince, P.G.; Minett, T.; Matthews, F.E.; Heath, P.R.; Shaw, P.J.; Goodall, E.; Garwood, C.J.; Ratcliffe, L.E.; Brayne, C.; et al. Neuronal DNA damage response-associated dysregulation of signalling pathways and cholesterol metabolism at the earliest stages of Alzheimer-type pathology. Neuropathol. Appl. Neurobiol. 2016, 42, 167–179. [Google Scholar] [CrossRef] [PubMed]
  26. Simpson, J.E.; Ince, P.G.; Shaw, P.J.; Heath, P.R.; Raman, R.; Garwood, C.J.; Gelsthorpe, C.; Baxter, L.; Forster, G.; Matthews, F.E.; et al. Microarray analysis of the astrocyte transcriptome in the aging brain: Relationship to Alzheimer’s pathology and APOE genotype. Neurobiol. Aging 2011, 32, 1795–1807. [Google Scholar] [CrossRef] [PubMed]
  27. Mishra, P.K.; Teale, J.M. Transcriptome analysis of the ependymal barrier during murine neurocysticercosis. J. Neuroinflamm. 2012, 9, 141. [Google Scholar] [CrossRef] [PubMed]
  28. Mishra, P.K.; Teale, J.M. Changes in gene expression of pial vessels of the blood brain barrier during murine neurocysticercosis. PLoS Negl. Trop. Dis. 2013, 7, e2099. [Google Scholar] [CrossRef]
  29. Pen, A.; Moreno, M.J.; Martin, J.; Stanimirovic, D.B. Molecular markers of extracellular matrix remodeling in glioblastoma vessels: Microarray study of laser-captured glioblastoma vessels. Glia 2007, 55, 559–572. [Google Scholar] [CrossRef]
  30. Dieterich, L.C.; Mellberg, S.; Langenkamp, E.; Zhang, L.; Zieba, A.; Salomaki, H.; Teichert, M.; Huang, H.; Edqvist, P.H.; Kraus, T.; et al. Transcriptional profiling of human glioblastoma vessels indicates a key role of VEGF-A and TGFbeta2 in vascular abnormalization. J. Pathol. 2012, 228, 378–390. [Google Scholar] [CrossRef]
  31. Cunnea, P.; McMahon, J.; O’Connell, E.; Mashayekhi, K.; Fitzgerald, U.; McQuaid, S. Gene expression analysis of the microvascular compartment in multiple sclerosis using laser microdissected blood vessels. Acta Neuropathol. 2010, 119, 601–615. [Google Scholar] [CrossRef] [PubMed]
  32. Harris, L.W.; Wayland, M.; Lan, M.; Ryan, M.; Giger, T.; Lockstone, H.; Wuethrich, I.; Mimmack, M.; Wang, L.; Kotter, M.; et al. The cerebral microvasculature in schizophrenia: A laser capture microdissection study. PLoS ONE 2008, 3, e3964. [Google Scholar] [CrossRef] [PubMed]
  33. Bartel, D.P. MicroRNAs: Genomics, biogenesis, mechanism, and function. Cell 2004, 116, 281–297. [Google Scholar] [CrossRef]
  34. Harries, L.W. MicroRNAs as Mediators of the Ageing Process. Genes 2014, 5, 656–670. [Google Scholar] [CrossRef] [PubMed] [Green Version]
  35. Zuo, X.; Lu, J.; Manaenko, A.; Qi, X.; Tang, J.; Mei, Q.; Xia, Y.; Hu, Q. MicroRNA-132 attenuates cerebral injury by protecting blood-brain-barrier in MCAO mice. Exp. Neurol. 2019, 316, 12–19. [Google Scholar] [CrossRef]
  36. Burek, M.; Konig, A.; Lang, M.; Fiedler, J.; Oerter, S.; Roewer, N.; Bohnert, M.; Thal, S.C.; Blecharz-Lang, K.G.; Woitzik, J.; et al. Hypoxia-Induced MicroRNA-212/132 Alter Blood-Brain Barrier Integrity Through Inhibition of Tight Junction-Associated Proteins in Human and Mouse Brain Microvascular Endothelial Cells. Transl. Stroke Res. 2019. [Google Scholar] [CrossRef]
  37. Goodall, E.F.; Wang, C.; Simpson, J.E.; Baker, D.J.; Drew, D.R.; Heath, P.R.; Saffrey, M.J.; Romero, I.A.; Wharton, S.B. Age-associated changes in the blood-brain barrier: Comparative studies in human and mouse. Neuropathol. Appl. Neurobiol. 2018, 44, 328–340. [Google Scholar] [CrossRef]
  38. Cooper-Knock, J.; Kirby, J.; Ferraiuolo, L.; Heath, P.R.; Rattray, M.; Shaw, P.J. Gene expression profiling in human neurodegenerative disease. Nat. Rev. Neurol. 2012, 8, 518–530. [Google Scholar] [CrossRef]
  39. Sweeney, M.D.; Kisler, K.; Montagne, A.; Toga, A.W.; Zlokovic, B.V. The role of brain vasculature in neurodegenerative disorders. Nat. Neurosci. 2018, 21, 1318–1331. [Google Scholar] [CrossRef]
  40. Zahn, J.M.; Poosala, S.; Owen, A.B.; Ingram, D.K.; Lustig, A.; Carter, A.; Weeraratna, A.T.; Taub, D.D.; Gorospe, M.; Mazan-Mamczarz, K.; et al. AGEMAP: A gene expression database for aging in mice. PLoS Genet. 2007, 3, e201. [Google Scholar] [CrossRef]
  41. Carney, E.F. Hypertension: Role of ARHGAP42 in hypertension. Nat. Rev. Nephrol. 2017, 13, 134. [Google Scholar] [CrossRef] [PubMed]
  42. Jia, Y.L.; Fu, Z.X.; Zhang, B.H.; Jia, Y.J. Hippocampal overexpression of Down syndrome cell adhesion molecule in amyloid precursor protein transgenic mice. Braz. J. Med. Biol. Res. 2017, 50, e6049. [Google Scholar] [CrossRef] [PubMed]
  43. Wang, Z.; Wade, P.; Mandell, K.J.; Akyildiz, A.; Parkos, C.A.; Mrsny, R.J.; Nusrat, A. Raf 1 represses expression of the tight junction protein occludin via activation of the zinc-finger transcription factor slug. Oncogene 2007, 26, 1222–1230. [Google Scholar] [CrossRef] [PubMed]
  44. Mei, M.; Xiang, R.L.; Cong, X.; Zhang, Y.; Li, J.; Yi, X.; Park, K.; Han, J.Y.; Wu, L.L.; Yu, G.Y. Claudin-3 is required for modulation of paracellular permeability by TNF-alpha through ERK1/2/slug signaling axis in submandibular gland. Cell. Signal. 2015, 27, 1915–1927. [Google Scholar] [CrossRef] [PubMed]
  45. Yanagisawa, K.; Konishi, H.; Arima, C.; Tomida, S.; Takeuchi, T.; Shimada, Y.; Yatabe, Y.; Mitsudomi, T.; Osada, H.; Takahashi, T. Novel metastasis-related gene CIM functions in the regulation of multiple cellular stress-response pathways. Cancer Res. 2010, 70, 9949–9958. [Google Scholar] [CrossRef] [PubMed]
  46. Suryavanshi, P.S.; Ugale, R.R.; Yilmazer-Hanke, D.; Stairs, D.J.; Dravid, S.M. GluN2C/GluN2D subunit-selective NMDA receptor potentiator CIQ reverses MK-801-induced impairment in prepulse inhibition and working memory in Y-maze test in mice. Br. J. Pharmacol. 2014, 171, 799–809. [Google Scholar] [CrossRef] [PubMed]
  47. Cassandri, M.; Smirnov, A.; Novelli, F.; Pitolli, C.; Agostini, M.; Malewicz, M.; Melino, G.; Raschella, G. Zinc-finger proteins in health and disease. Cell Death Discov. 2017, 3, 17071. [Google Scholar] [CrossRef]
  48. Minster, R.L.; Sanders, J.L.; Singh, J.; Kammerer, C.M.; Barmada, M.M.; Matteini, A.M.; Zhang, Q.; Wojczynski, M.K.; Daw, E.W.; Brody, J.A.; et al. Genome-Wide Association Study and Linkage Analysis of the Healthy Aging Index. J. Gerontol. A Biol. Sci. Med. Sci. 2015, 70, 1003–1008. [Google Scholar] [CrossRef] [Green Version]
  49. Hillary, R.F.; FitzGerald, U. A lifetime of stress: ATF6 in development and homeostasis. J. Biomed. Sci. 2018, 25, 48. [Google Scholar] [CrossRef]
  50. Atkin, J.D.; Farg, M.A.; Walker, A.K.; McLean, C.; Tomas, D.; Horne, M.K. Endoplasmic reticulum stress and induction of the unfolded protein response in human sporadic amyotrophic lateral sclerosis. Neurobiol. Dis. 2008, 30, 400–407. [Google Scholar] [CrossRef]
  51. Wruck, W.; Schroter, F.; Adjaye, J. Meta-Analysis of Transcriptome Data Related to Hippocampus Biopsies and iPSC-Derived Neuronal Cells from Alzheimer’s Disease Patients Reveals an Association with FOXA1 and FOXA2 Gene Regulatory Networks. J. Alzheimers Dis. 2016, 50, 1065–1082. [Google Scholar] [CrossRef] [PubMed]
  52. Tang, B.; Becanovic, K.; Desplats, P.A.; Spencer, B.; Hill, A.M.; Connolly, C.; Masliah, E.; Leavitt, B.R.; Thomas, E.A. Forkhead box protein p1 is a transcriptional repressor of immune signaling in the CNS: Implications for transcriptional dysregulation in Huntington disease. Hum. Mol. Genet. 2012, 21, 3097–3111. [Google Scholar] [CrossRef] [PubMed]
  53. Hamano, T.; Hayashi, K.; Shirafuji, N.; Nakamoto, Y. The Implications of Autophagy in Alzheimer’s Disease. Curr. Alzheimer Res. 2018, 15, 1283–1296. [Google Scholar] [CrossRef] [PubMed]
  54. Rohn, T.T.; Wirawan, E.; Brown, R.J.; Harris, J.R.; Masliah, E.; Vandenabeele, P. Depletion of Beclin-1 due to proteolytic cleavage by caspases in the Alzheimer’s disease brain. Neurobiol. Dis. 2011, 43, 68–78. [Google Scholar] [CrossRef] [PubMed]
  55. Fonseca, A.C.; Oliveira, C.R.; Pereira, C.F.; Cardoso, S.M. Loss of proteostasis induced by amyloid beta peptide in brain endothelial cells. Biochim. Biophys. Acta 2014, 1843, 1150–1161. [Google Scholar] [CrossRef] [PubMed] [Green Version]
  56. Ma, J.F.; Huang, Y.; Chen, S.D.; Halliday, G. Immunohistochemical evidence for macroautophagy in neurones and endothelial cells in Alzheimer’s disease. Neuropathol. Appl. Neurobiol. 2010, 36, 312–319. [Google Scholar] [CrossRef]
  57. Garwood, C.J.; Simpson, J.E.; Al Mashhadi, S.; Axe, C.; Wilson, S.; Heath, P.R.; Shaw, P.J.; Matthews, F.E.; Brayne, C.; Ince, P.G.; et al. DNA damage response and senescence in endothelial cells of human cerebral cortex and relation to Alzheimer’s neuropathology progression: A population-based study in the Medical Research Council Cognitive Function and Ageing Study (MRC-CFAS) cohort. Neuropathol. Appl. Neurobiol. 2014, 40, 802–814. [Google Scholar] [CrossRef]
  58. Rajewsky, N. microRNA target predictions in animals. Nat. Genet. 2006, 38, S8–S13. [Google Scholar] [CrossRef]
  59. Sierksma, A.; Lu, A.; Salta, E.; Vanden Eynden, E.; Callaerts-Vegh, Z.; D’Hooge, R.; Blum, D.; Buee, L.; Fiers, M.; De Strooper, B. Deregulation of neuronal miRNAs induced by amyloid-beta or TAU pathology. Mol. Neurodegener. 2018, 13, 54. [Google Scholar] [CrossRef]
  60. Tili, E.; Mezache, L.; Michaille, J.J.; Amann, V.; Williams, J.; Vandiver, P.; Quinonez, M.; Fadda, P.; Mikhail, A.; Nuovo, G. microRNA 155 up regulation in the CNS is strongly correlated to Down’s syndrome dementia. Ann. Diagn. Pathol. 2018, 34, 103–109. [Google Scholar] [CrossRef]
  61. Arena, A.; Iyer, A.M.; Milenkovic, I.; Kovacs, G.G.; Ferrer, I.; Perluigi, M.; Aronica, E. Developmental Expression and Dysregulation of miR-146a and miR-155 in Down’s Syndrome and Mouse Models of Down’s Syndrome and Alzheimer’s Disease. Curr. Alzheimer Res. 2017, 14, 1305–1317. [Google Scholar] [CrossRef] [PubMed]
  62. Guedes, J.R.; Custodia, C.M.; Silva, R.J.; de Almeida, L.P.; Pedroso de Lima, M.C.; Cardoso, A.L. Early miR-155 upregulation contributes to neuroinflammation in Alzheimer’s disease triple transgenic mouse model. Hum. Mol. Genet. 2014, 23, 6286–6301. [Google Scholar] [CrossRef] [PubMed]
  63. Lopez-Ramirez, M.A.; Wu, D.; Pryce, G.; Simpson, J.E.; Reijerkerk, A.; King-Robson, J.; Kay, O.; de Vries, H.E.; Hirst, M.C.; Sharrack, B.; et al. MicroRNA-155 negatively affects blood-brain barrier function during neuroinflammation. FASEB J. 2014, 28, 2551–2565. [Google Scholar] [CrossRef] [PubMed]
  64. Barker, K.R.; Lu, Z.; Kim, H.; Zheng, Y.; Chen, J.; Conroy, A.L.; Hawkes, M.; Cheng, H.S.; Njock, M.S.; Fish, J.E.; et al. miR-155 Modifies Inflammation, Endothelial Activation and Blood-Brain Barrier Dysfunction in Cerebral Malaria. Mol. Med. 2017, 23, 24–33. [Google Scholar] [CrossRef] [PubMed]
  65. Srivastava, S.K.; Bhardwaj, A.; Arora, S.; Tyagi, N.; Singh, S.; Andrews, J.; McClellan, S.; Wang, B.; Singh, A.P. MicroRNA-345 induces apoptosis in pancreatic cancer cells through potentiation of caspase-dependent and -independent pathways. Br. J. Cancer 2015, 113, 660–668. [Google Scholar] [CrossRef] [PubMed] [Green Version]
  66. Shiu, T.Y.; Huang, S.M.; Shih, Y.L.; Chu, H.C.; Chang, W.K.; Hsieh, T.Y. Hepatitis C virus core protein down-regulates p21(Waf1/Cip1) and inhibits curcumin-induced apoptosis through microRNA-345 targeting in human hepatoma cells. PLoS ONE 2013, 8, e61089. [Google Scholar] [CrossRef] [PubMed]
  67. Freiesleben, S.; Hecker, M.; Zettl, U.K.; Fuellen, G.; Taher, L. Analysis of microRNA and Gene Expression Profiles in Multiple Sclerosis: Integrating Interaction Data to Uncover Regulatory Mechanisms. Sci. Rep. 2016, 6, 34512. [Google Scholar] [CrossRef] [PubMed]
  68. Xi, T.; Jin, F.; Zhu, Y.; Wang, J.; Tang, L.; Wang, Y.; Liebeskind, D.S.; Scalzo, F.; He, Z. MiR-27a-3p protects against blood-brain barrier disruption and brain injury after intracerebral hemorrhage by targeting endothelial aquaporin-11. J. Biol. Chem. 2018. [Google Scholar] [CrossRef]
  69. Sun, L.; Zhao, M.; Wang, Y.; Liu, A.; Lv, M.; Li, Y.; Yang, X.; Wu, Z. Neuroprotective effects of miR-27a against traumatic brain injury via suppressing FoxO3a-mediated neuronal autophagy. Biochem. Biophys. Res. Commun. 2017, 482, 1141–1147. [Google Scholar] [CrossRef]
  70. Urena-Peralta, J.R.; Alfonso-Loeches, S.; Cuesta-Diaz, C.M.; Garcia-Garcia, F.; Guerri, C. Deep sequencing and miRNA profiles in alcohol-induced neuroinflammation and the TLR4 response in mice cerebral cortex. Sci. Rep. 2018, 8, 15913. [Google Scholar] [CrossRef] [Green Version]
  71. Roitbak, T.; Bragina, O.; Padilla, J.L.; Pickett, G.G. The role of microRNAs in neural stem cell-supported endothelial morphogenesis. Vasc. Cell 2011, 3, 25. [Google Scholar] [CrossRef] [PubMed]
  72. Bernstock, J.D.; Lee, Y.J.; Peruzzotti-Jametti, L.; Southall, N.; Johnson, K.R.; Maric, D.; Volpe, G.; Kouznetsova, J.; Zheng, W.; Pluchino, S.; et al. A novel quantitative high-throughput screen identifies drugs that both activate SUMO conjugation via the inhibition of microRNAs 182 and 183 and facilitate neuroprotection in a model of oxygen and glucose deprivation. J. Cereb. Blood Flow Metab. 2016, 36, 426–441. [Google Scholar] [CrossRef] [PubMed]
  73. Piscopo, P.; Lacorte, E.; Feligioni, M.; Mayer, F.; Crestini, A.; Piccolo, L.; Bacigalupo, I.; Filareti, M.; Ficulle, E.; Confaloni, A.; et al. MicroRNAs and Mild Cognitive Impairment: A systematic review. Ageing Res. Rev. 2019, 50, 131–141. [Google Scholar] [CrossRef] [PubMed]
  74. Ventorp, F.; Barzilay, R.; Erhardt, S.; Samuelsson, M.; Traskman-Bendz, L.; Janelidze, S.; Weizman, A.; Offen, D.; Brundin, L. The CD44 ligand hyaluronic acid is elevated in the cerebrospinal fluid of suicide attempters and is associated with increased blood-brain barrier permeability. J. Affect. Disord. 2016, 193, 349–354. [Google Scholar] [CrossRef] [PubMed]
  75. Su, E.J.; Cao, C.; Fredriksson, L.; Nilsson, I.; Stefanitsch, C.; Stevenson, T.K.; Zhao, J.; Ragsdale, M.; Sun, Y.Y.; Yepes, M.; et al. Microglial-mediated PDGF-CC activation increases cerebrovascular permeability during ischemic stroke. Acta Neuropathol. 2017, 134, 585–604. [Google Scholar] [CrossRef] [PubMed] [Green Version]
  76. Simpson, J.E.; Wharton, S.B.; Heath, P.R. Immuno-Laser-Capture Microdissection for the Isolation of Enriched Glial Populations from Frozen Post-Mortem Human Brain. Methods Mol. Biol. 2018, 1723, 273–284. [Google Scholar] [PubMed]
  77. Horvath, S.; Dong, J. Geometric interpretation of gene coexpression network analysis. PLoS Comput. Biol. 2008, 4, e1000117. [Google Scholar] [CrossRef]
  78. Wu, X.; Dewey, T.G. From microarray to biological networks: Analysis of gene expression profiles. Methods Mol. Biol. 2006, 316, 35–48. [Google Scholar]
  79. Hu, W.; Park, C.Y. Measuring microRNA expression in mouse hematopoietic stem cells. Methods Mol. Biol. 2014, 1185, 121–140. [Google Scholar]
Figure 1. mRNA gene expression analysis. (a) Total number of significantly differentially expressed probe sets and the ratio of up to down regulated transcripts in an ageing human and mouse cohort. (b) The number of unique and overlapping significantly, differentially expressed genes between the human and mouse datasets. Common genes, dysregulated in the same direction, between species are listed. Up and down regulation compared to oldest age group are represented with directional arrows.
Ijms 20 03097 g001
Figure 2. Analysis of top 1000 genes from each comparison in both the human and mouse datasets. In the human dataset, analysis of the genes sorted (a) by fold change identified 447 significantly, differentially expressed genes common to all three comparisons, and (b) by p-value identified 353 genes. In the mouse dataset, analysis of the genes sorted (c) by fold change identified 52 significantly, differentially expressed genes common to all three comparisons, and (d) by p-value identified 150 genes.
Ijms 20 03097 g002
Figure 3. miRNA expression analysis. (a) miRNA expression in the human and mouse age group comparisons. Numbers of overlapping miRNAs within species and between all four comparisons are indicated in appropriate sections. (b) fold change profiles for the panel of 15 overlapping miRNAs between species.
Ijms 20 03097 g003
Figure 4. qPCR for mRNA validation of gene expression. A non-significant increase in (a) GRIN2C (p = 0.078), (b) CDC42BPB (p = 0.142), (c) ATF6 (p = 0.056) and a non-significant decrease in (d) ZNF90 gene expression was detected in the BBB of the old group, similar to the directional change observed in the microarray analysis. Data presented as mean ± standard error of the mean (SEM).
Ijms 20 03097 g004
Figure 5. Investigation of protein expression by candidate genes identified in array analysis. (a) SLUG (SNAI2) and (b) p53 (TP53) immunolabelled a proportion of endothelial cell nuclei. (c) Immunoreactivity for RB1CC1 (RB1CC1) was predominantly associated with the basement membrane of capillaries. (d) In addition to endothelial immunoreactivity, beclin-1 (BECN1) cytoplasmic staining of pyramidal neurones (examples indicated by the open arrow) was present throughout the cortex (Figure 6d). Immunopositive staining of the BBB is indicated by the black arrow. Scale bar represents 50 μm (a,b,c) or 100 μm (d).
Ijms 20 03097 g005
Figure 6. qPCR validation of miRNA expression. qPCR demonstrated the same directional change of expression for all three candidates (miR-155-5p (a,b); miR-1298-5p (c,d); miR-182-5p (e,f)) in both the human (a,c,e) and mouse (b,d,f) groups, similar to the directional change observed in the microarray analysis. Only miR-182-5p in human samples was significantly altered (ANOVA p = 0.032). Data presented as mean ± SEM.
Ijms 20 03097 g006
Figure 7. Workflow of the study design, including initial mRNA and miRNA expression profiling, bioinformatic analysis and validation. LCM: laser capture microdissection. IHC: immunohistochemistry. qPCR: quantitative polymerase chain reaction.
Ijms 20 03097 g007
Table 1. Gene network and cluster analysis of differentially expressed genes common to all three comparisons (young versus old; young versus middle aged; middle aged versus old) in both the human and mouse datasets, selected by fold change and by p-value.
DatasetClusterNo. GenesEnrichment Score
Human (sorted by FC)DNA binding61.88
Kelch-like51.73
tRNA modification41.46
Human (sorted by p-value)DNA binding51.45
Apoptosis31.32
Mouse (sorted by p-value)GTP binding72.32
Armadillo-like41.81
Ion channel binding31.76
FC, fold change.
Table 2. miRNAs which target genes relating to DNA binding. The shaded box indicates that a gene is present in the list of targets of the miRNA. This comparison has a highly significant p-value of 1 × 10⁻¹². All but two of the genes present in the list are targets of more than one miRNA.
miRNA Gene Target1298-5p653-5p511-3p505-5p345-5p302a-5p224-5p205-5p182-5p181c-3p155-5p100-3p27a-5pTotal
NFIB 9
ZNF704 7
EBF1 6
FOXP1 6
IKZF1 5
ZFHX4 4
FLI1 4
ATF6 4
HNRNPD 4
MAFF 4
RCOR3 3
ZKSCAN3 3
ZNF514 3
FOXA1 2
ZNF268 2
ZNF90 2
TP53 2
RAD51D 2
ERCC1 2
ZNF600 2
FOXR2 1
TCF7L1 1
Table 3. Demographics of human cases used in gene expression analysis: age, gender, post-mortem delay, brain pH, cause of death and neuropathology.
Age GroupAgeGenderPMDpHCause of DeathNeuropathology
Young20F716.5SBLNone
24F476.4SBLSmall vessel disease
25M536.4SBLNone
29M446.5SBLFocal Tau
30M716.4NKNone
Middle aged44M476.3Drug overdoseNone
48M726.3CADNone
50M456.3IHD/CADNone
52M916.4Road traffic collisionNone
57M666.5IHD/CADNone
Old71F416.5IHDMild and focal vascular tau. Mild amyloid tangles and plaques
74M466.3Pulmonary thromboembolismNone
74M666.3IHD/CADMild tau tangles, plaques and threads.
75M786.4IHD/CADMild tau tangles and threads
79F456.3IHD/CADVenous collagenosis and small vessel disease
Abbreviations: PMD: post-mortem delay in hours; M: male; F: female; SBL: suspension by ligature; NK: not known; IHD: ischaemic heart disease; CAD: coronary artery disease.
Table 4. qPCR primer/probe sequence.
Gene Sequence
ATF6Probe5′-FAM/CATTCCTCCACCTCCTTGTCAGCC-3′
Primer 15′-CTTGGTCCTTTCTACTTCATGTCT-3′
Primer 2 5′-CCCTGATGGTGCTAACTGAA-3′
CDC42BPBProbe5′FAM/ACAAAGAGCCTGATTCGGACTCCAC-3′
Primer 15′-GGAGCTATTCGATGGAGTTGAG-3′
Primer 25′-GAACAAGCCCTACATCTCGTG-3′
GRIN2CProbe5′-FAM/ AAGGCATCCAGCTTCCCCATCTT-3′
Primer 15′-TTGAGGA -3′AGCAGCATCATAG-3′
Primer 25′-CGCAGTAACTACCGTGACAT-3′
ZNF90Probe5′-FAM/AGCTGTGGATCTCCCAATACCTGC-3′
Primer 15′-GGCCACATCTCTAAATTCCAATG-3′
Primer 25′-CTTAGCTGCTTCGTGTCTTCT-3′
ACTBProbe 5′-FAM-CCATGTACGTTGCTATCCAGGCTGT-3′
Primer 15′-CCAGTGGTACGGCCAGA-3′
Primer 25′-GCGAGAAGATGACCCAGAT-3′
Table 5. Antibody source and specificity.
AntibodyIsotypeDilutionAntigen RetrievalSupplier
Beclin-1Rabbit IgG1:250 (60 min, RT)PC EDTAAbCam
p53Mouse IgG1:50 (o/n, 4 °C)PC EDTASanta Cruz
RB1CC1Rabbit IgG1:100 (60 min, RT)PC TSCSigma Aldrich
SLUGRabbit IgG1:200 (60 min, RT)MW TSCAbCam
Abbreviations: RT: room temperature; o/n: overnight; PC: pressure cooker (125 °C for 30 s at 20 psi); MW: microwave; EDTA: ethylenediaminetetraacetic acid (pH 8); TSC: trisodium citrate (pH 6.5).

