
Energy Consumption of Electric Vehicles: Analysis of Selected Parameters Based on Created Database


1
Faculty of Mechanical Engineering and Aeronautics, Rzeszow University of Technology, 35-959 Rzeszow, Poland
2
Faculty of Engineering and Architecture, Kore University of Enna, Cittadella Universitaria, 94100 Enna, Italy
*
Authors to whom correspondence should be addressed.
Energies 2023, 16(3), 1437; https://doi.org/10.3390/en16031437
Submission received: 9 January 2023
/
Revised: 22 January 2023
/
Accepted: 30 January 2023
/
Published: 1 February 2023
Abstract
:Electric vehicles in a short time will make up the majority of the fleet of vehicles used in general. This state of affairs will generate huge sets of data, which can be further investigated. The paper presents a methodology for the analysis of electric vehicle data, with particular emphasis on the energy consumption parameter. The prepared database contains data for 123 electric vehicles for analysis. Data analysis was carried out in a Python environment with the use of the dabl API library. Presentation of the results was made on the basis of data classification for continuous and categorical features vs. target parameters. Additionally, a heatmap Pearson correlation coefficient was performed to correlate the energy consumption parameter with the other parameters studied. Through the data classification for the studied dataset, it can be concluded that there is no correlation against energy consumption for the parameter charging speed; in contrast, for the parameters range and maximum velocity, a positive correlation can be observed. The negative correlation with the parameter energy consumption is for the parameter acceleration to 100 km/h. The methodology presented to assess data from electric vehicles can be scalable for another dataset to prepare data for creating machine learning models, for example.
1. Introduction
The world policy on the aspect of environmental care is moving towards climate neutrality and also considering the transport and mobility sector [1]. In the European Union context, the development of transport is currently conditioned by a package of policy initiatives for state governments (i.e., the European Green Deal). Its goals are to achieve full climate neutrality for Europe by 2050 [2]. This scenario includes a number of measures that need to be implemented to reduce greenhouse gas emissions [3,4]. One such measure is the use of electric vehicles (EVs) [5]. They allow the reduction of emissions from road transport, which is one of the main emitters of carbon dioxide in the atmosphere. Road transport accounts for one-fourth of total greenhouse gas emissions from anthropogenic sources [6,7]. Another such measure is investment in the development of charging infrastructure [8]. Equally important is the conversion of public transport propulsion systems from conventional internal combustion engines to fully electric ones [9]. Another goal of the European Union’s transport policy is to reach a level of 60% of electric vehicle sales in the general vehicle sales market by 2030 [10].
The EV market has recently undergone dynamic changes in accordance with the growing demand and technological advancement of the vehicles that are sold [11,12]. Until recently, the availability of electric vehicles was low, and the demand itself was relatively low. However, recently, the market demand for electric vehicles has increased. This may have been helped by government programs that supported and subsidized the purchase of electric vehicles [13,14,15]. As a result, the EV market has become competitive with conventional vehicles. The development of the technology used in EVs has undergone a huge transformation [16]. Today, more and newer vehicles have longer range and faster vehicle charging stages [17,18].
Several articles in the literature have investigated the electric vehicle (EV) market considering whether it has overcome critical mass constraints and can achieve long-term sustainable equilibria without subsidies. Countries such as Norway [19,20], which has a clean energy system with a high share of hydropower and is implementing policies that will reduce the sale of new cars with internal combustion engines to the limit by 2050, highlight the importance of zero emissions vehicles in the future transport system. Other studies have deepened a systematic classification of charging options, considering 27 countries in the European Union together with Great Britain, Norway, and Switzerland [21,22,23]. The results show a wide variation in charging costs between different countries and different charging options, suggesting different policy options to reduce charging costs. The results reveal that the charging costs at these stations are competitive with the fuel costs at typical usage rates [24].
The energy consumption of electric vehicles refers to the amount of energy that is used by the vehicle propulsion system [25]. This parameter depends on a number of vehicle factors, including vehicle size, weight and aerodynamics, vehicle efficiency, driver’s driving style, and driving conditions [26]. Since electric vehicles do not lose energy, for example, due to friction of the internal combustion engine components, their efficiency is relatively high and is about 70–80%, while for internal combustion vehicles it is 15–20% [27,28,29]. The energy consumption of electric vehicles is also very sensitive to weather conditions. Winter conditions and low temperatures can greatly reduce the performance of this parameter [30,31]. The sensitivity of this parameter is also exemplified by driving style, where a driver who drives aggressively over long distances may have higher energy consumption than a driver who drives more efficiently over short distances [32,33]. It is important to consider the energy consumption of an electric vehicle compared to another type of vehicle, which ultimately calculates the total cost of owning such a vehicle and its potential impact on the improvement of the environment.
Several studies have taken into consideration a number of parameters that characterize the benefits and criticalities of the use of electric vehicles. A study conducted by Skuza and Jurecki [34] indicates that one of the most sought-after aspects of an electric vehicle is its energy consumption. This parameter is particularly important for electric vehicle users who drive them in real conditions. Other parameters such as temperature, traffic conditions, or the properties of an electric vehicle are closely related to energy consumption [35]. A headwind component can also produce a criticality; in fact, the greater the wind, the greater the energy required by the vehicle to overcome resistance to movement. In turn, weather conditions are related to other factors such as the use of auxiliary systems. Studies have shown that heating a vehicle is more energy intensive than cooling the interior. Analysis of other factors, such as vehicle load, battery weight, and driver’s driving style, shows variability in energy consumption [36,37]. It is important to emphasize that both increasing load and increasing battery weight increase battery energy consumption. Several studies have identified and evaluated factors that influence energy consumption comparatively, i.e., comparing different factors and calculating which of them has an influence on vehicle energy consumption [38,39,40]. It should be emphasized that route planning is energy efficient for electric vehicles (EVs) according to [41]. In fact, knowing the cost of each link in the road networks plays a key role in the energy-optimal route planning process. This depends not only on the speed of the vehicle but also on the type of road. Another study by Yi and Bauer [42] simultaneously considered the effects of wind speed, rolling resistance, parasitic power, and temperature, highlighting the sensitivity of EV energy consumption to these four environmental variables, which vary greatly with vehicle operating conditions. The problem of the range of EVs was also analyzed by Mediouni et al. [43], who proposed a hybrid approach that takes into account driving behavior, road conditions, the natural environment, and additional weight, with real data collected using a city car.
Several programming languages can be used to study electric vehicle data, one of the most popular and accessible being Python. It contains many ready-made libraries that enable a quick and efficient study of electric vehicles. In the work described, the API library dabl was used to classify data by continuous and categorical features with respect to the target parameter. The target parameter in the work was energy consumption.
Additionally, a heatmap Pearson correlation coefficient was performed to correlate the energy consumption parameter with the other parameters studied. The purpose of the study was to create a comprehensive methodology to process data from electric vehicles, with a particular focus as a target parameter for energy consumption. The developed analysis can be used, for example, to select a set of best predictors to create machine learning models. They also provide some recommendations for further work in the context of datasets for electric vehicles.
2. Methodology
2.1. Overall Description
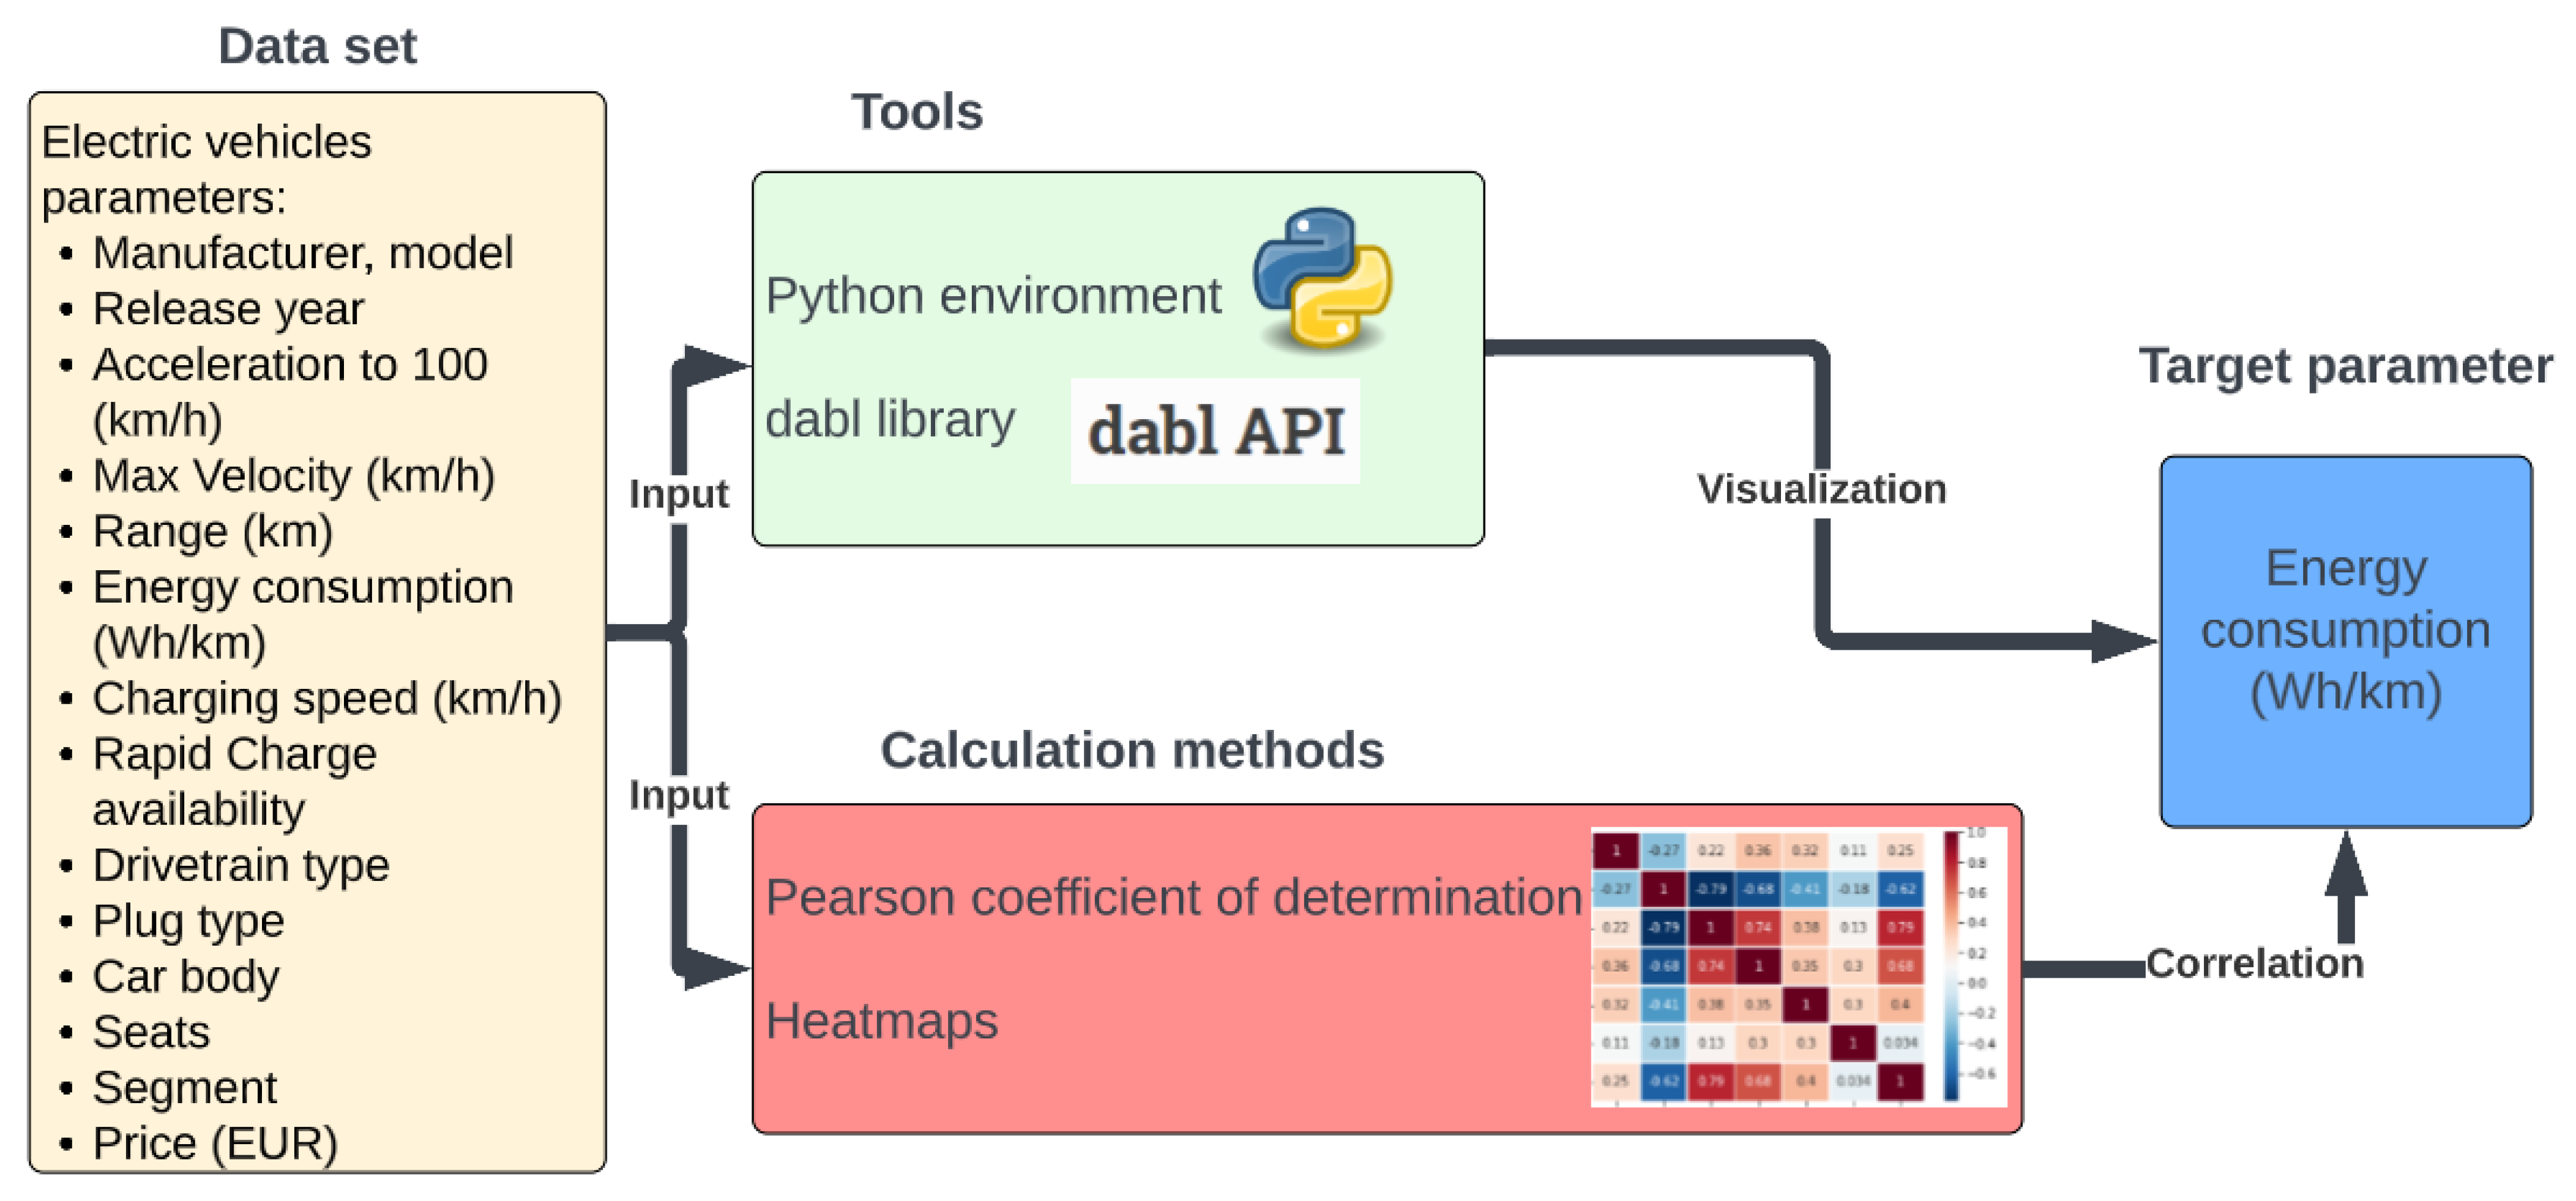
The general scheme of the work is shown in Figure 1. The work assumed the analysis of selected parameters of electric vehicles, which can be accessed from basic vehicle catalog data. The selected research parameters are as follows: release year, acceleration to 100 (km/h), max velocity (km/h), range (km), energy consumption (Wh/km), charging speed (km/h), drivetrain type, plug type, and price (EUR). The work created a set of attributes for 124 electric vehicle models. The Python programming environment was used to process these data. Python is a general programming language and is used in many applications, including data analysis and artificial intelligence [44,45]. Its main characteristics are its simplicity and flexibility of writing code and the fact that it has many libraries that can be used, which reduces the importance of time spent preparing the program code [46,47]. The dabl API Python library was used to perform exploratory data analysis (EDA). The dabl tool was used to create visualizations regarding continuous and categorical features vs. target parameter. The target parameter in the study was the energy consumption parameter (Wh/km). The Pearson correlation coefficient was also used to correlate other parameters with the target parameter.
The study focused on the analysis of the energy consumption parameter as a target and its correlation with the other attributes parameters to see which other studied most affect this parameter and to show the analytical capabilities of the tools used.
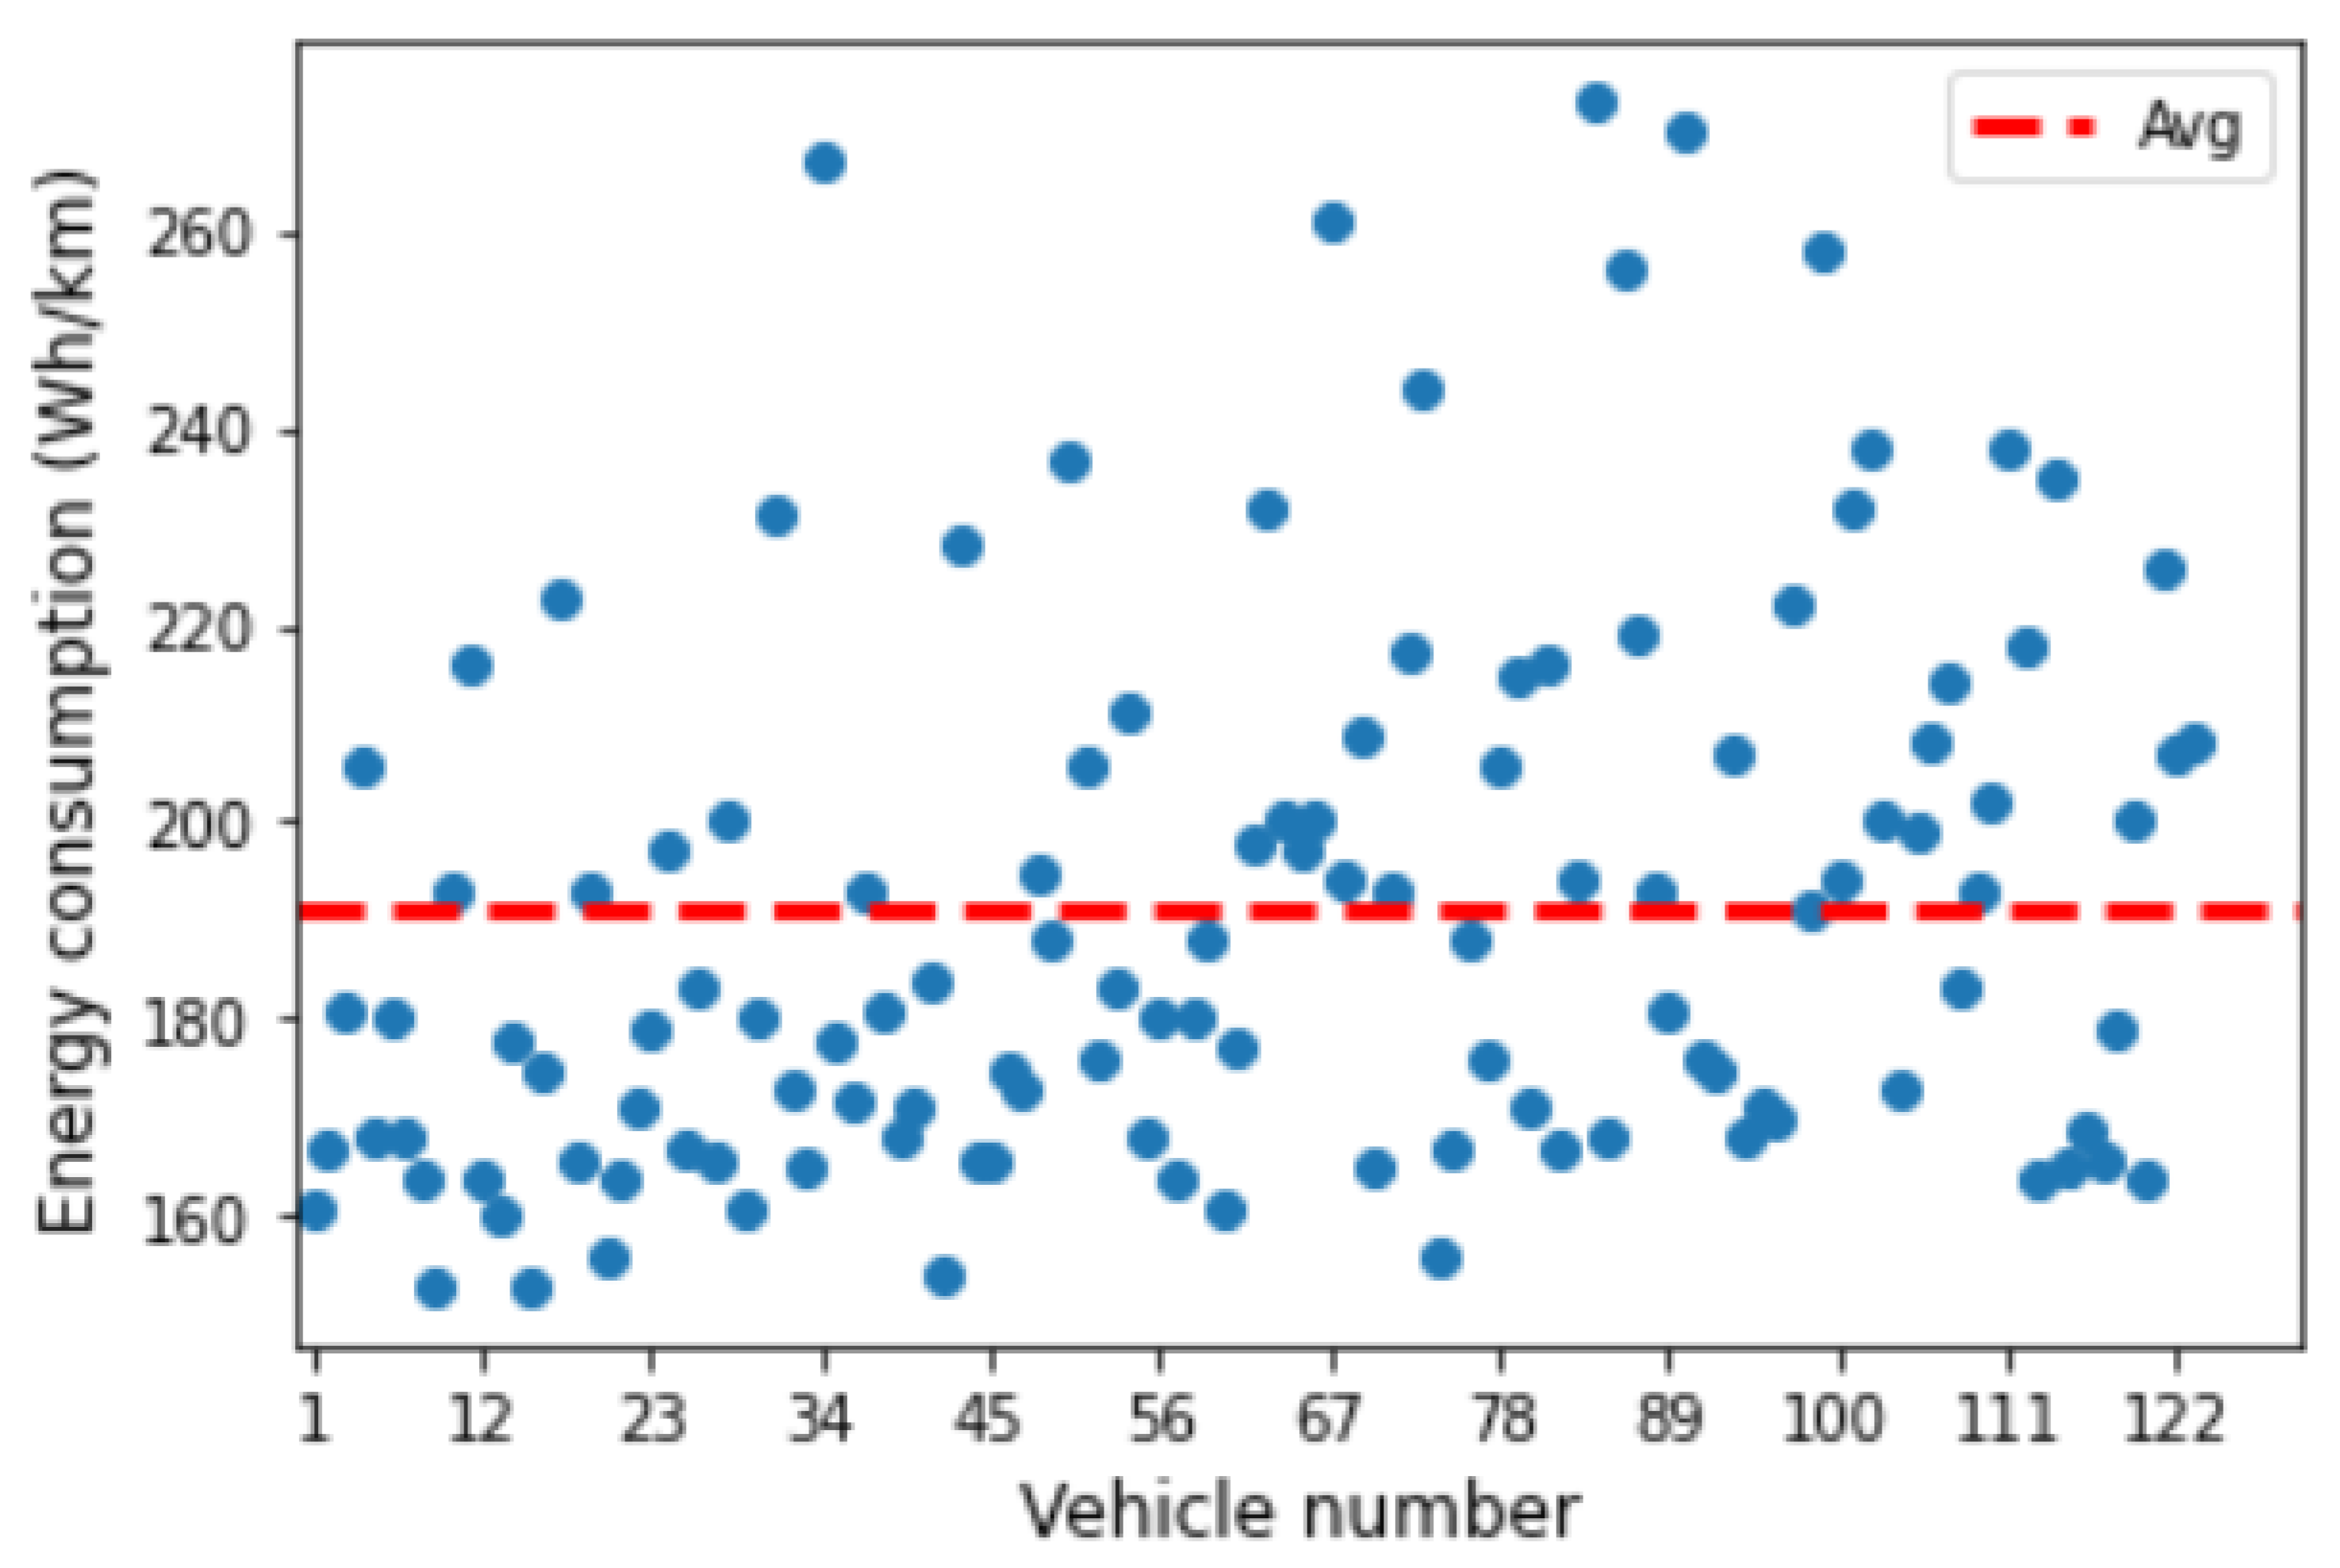
Figure 2 shows a scatter plot for the all attributes studied for energy consumption of the 123 EVs analyzed.
The general assumptions of the work include the following:
- Creation of a database for selected catalog parameters of electric vehicles;
- Using the Python environment to analyze the data for the target parameter energy consumption: uploading the data, validating the records, processing the data, visualization;
- Calculating Pearson’s correlation coefficient and creating a heatmap to better illustrate the results of the impact of selected parameters for target parameter energy consumption;
- Writing out recommendations for data analysis for electric vehicles, which can be used to further develop, for example, computational models using artificial intelligence methods.
2.2. Dataset
The dataset is the most important element that contributes to the accuracy of performing data analysis. In data analysis, the dataset is used to answer assumed hypotheses or to identify trends and clusters in a data series [48,49]. The quality of the dataset is extremely important, and it is necessary to ensure that all data records are properly stored and then processed according to the assumed attributes [50]. When choosing and creating a dataset, the following principles should be taken into account: relevance, quality, representativeness, format, and preprocessing [51,52].
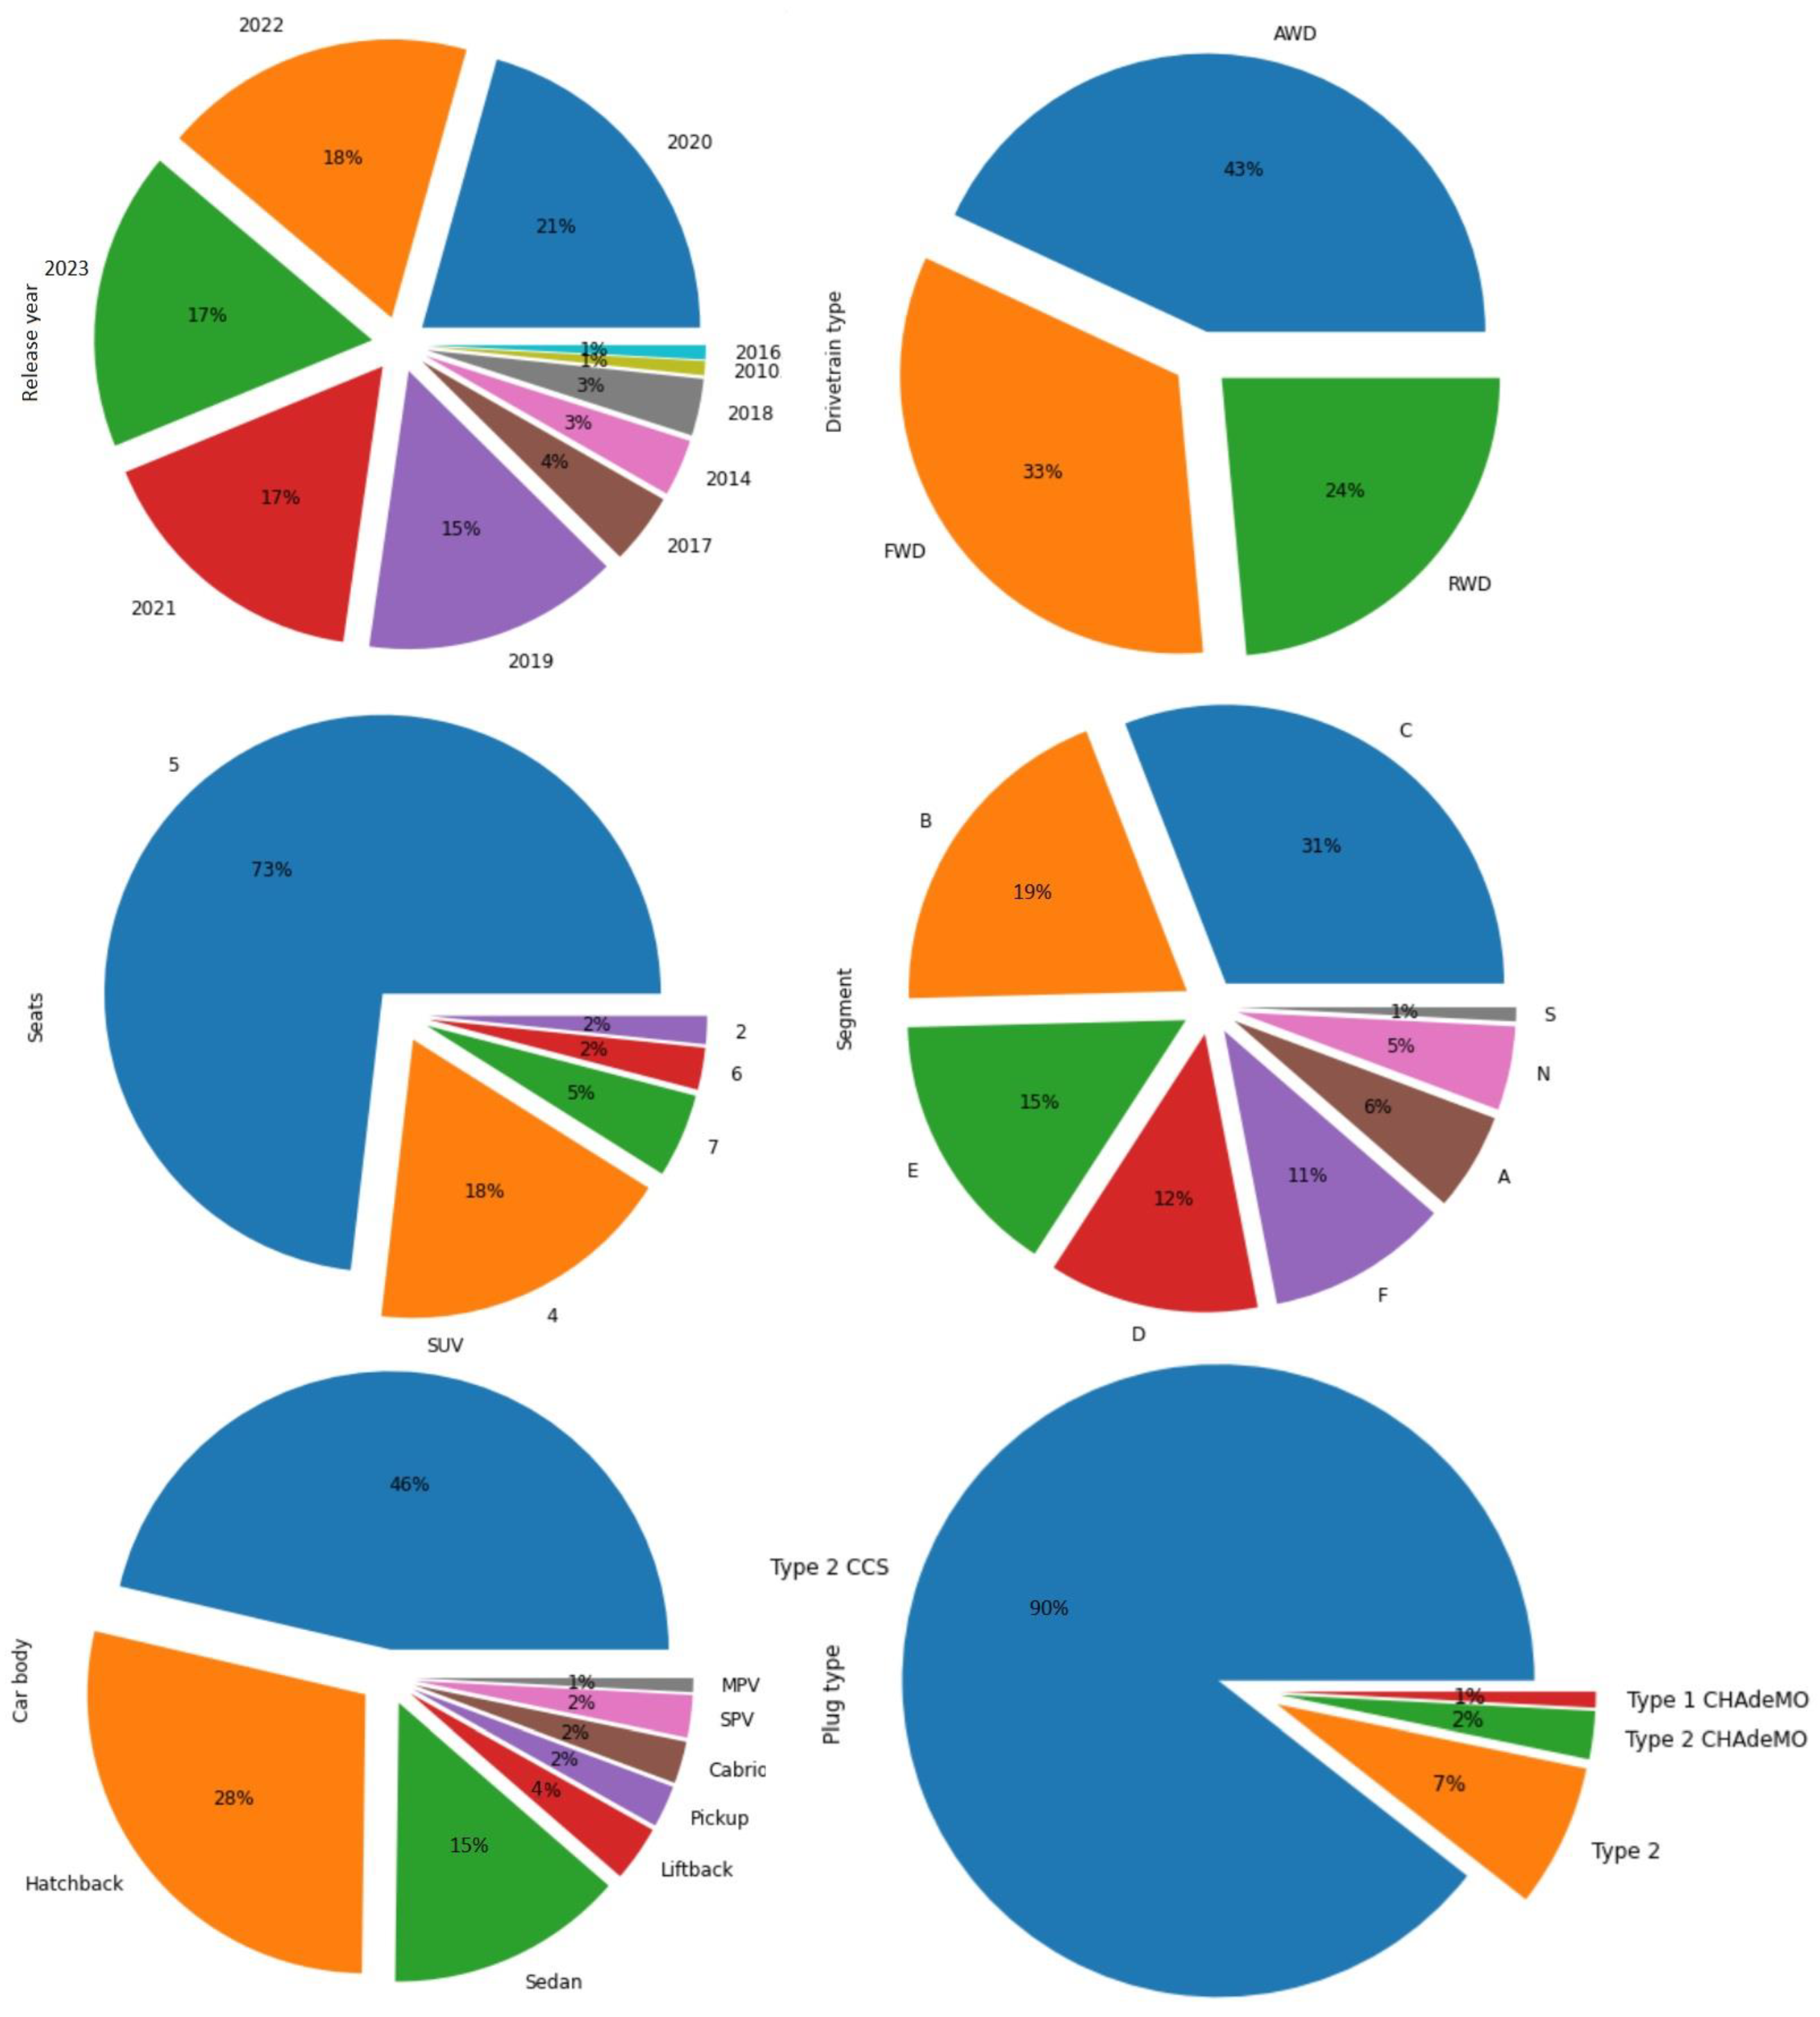
The dataset considered was an EV dataset that contained 1982 records. A total of selected attributes of 123 EV models was analyzed. The research parameters are as follows. manufacturer, model, release year, acceleration to 100 (km/h), max velocity (km/h), range (km), energy consumption (Wh/km), charging speed (km/h), rapid charge availability, drivetrain type, plug type, car body, segment, number of seats, and price (EUR). The selected parameters are shown in percentages in the pie charts in Figure 3.
Figure 3 shows selected parameters of the dataset of the investigated EVs. The first parameter analyzed shown in the graphic is the release year. This parameter refers to the first manufactured electric vehicle made available for sale. The oldest vehicle analyzed was a 2010 vehicle, while it is also possible to observe vehicles produced in the years 2014, 2016, 2017, and 2019. The largest number of vehicles analyzed are in the range of 2019–2023, and the largest number of electric vehicles worldwide were also produced in these years [53]. Additionally, a certain set of vehicles are currently under production and sale, and these vehicles accounted for 17% of the total number of all EVs examined.
Another parameter taken into consideration was the type of drivetrain. The following types of drivetrains are used in electric vehicles: front-wheel drive (FWD), rear-wheel drive (RWD), and all-wheel drive (AWD). FWD is characterized by the fact that the power of the powertrain is transferred to the front wheels of the vehicle [54], while RWD is characterized by the fact that the power is transferred to the rear wheels of the vehicle [55]. AWD is characterized by the fact that the vehicle drives the power transmitted to all wheels [56].
For the dataset studied, the largest number of vehicles had an AWD system, accounting for 44% of the total data.
For the number of seats for vehicle passengers, the largest number of data records for this parameter was 5 seats (73%).
The next parameter is the vehicle segment. In the automotive industry, a segment refers to a category of vehicles that have similar features and characteristics [57]. The largest number of vehicles surveyed were classified in the C segment.
The car body was another parameter studied. The largest number of vehicles surveyed in the analyzed dataset were SUVs. In recent years, SUVs (sport utility vehicles) have gained popularity as a type of body for electric vehicles [58,59]. This state of affairs is caused by the fact that the driving range of new electric vehicles has increased. SUVs, although they are larger and weigh more, also have more space to store batteries, allowing them to increase the range of the vehicle [60,61].
The last parameter analyzed in Figure 3 was the plug type. The plug type of an electric vehicle (EV) refers to the type of connector and charging protocol that is used to charge the EV’s battery. There are several types of plugs that are used to charge EVs, including the following.
Type 1: This is a common plug type that is used in North America and parts of Asia [62];
The specific plug type used for EV charging depends on the EV model and the charging infrastructure available in a given region. Most of the examined vehicles had type 2 CCS.
The selection of the selected vehicles used the popularity of the models to reflect as much as possible the statistical sample of EVs used worldwide.
2.3. Data Processing
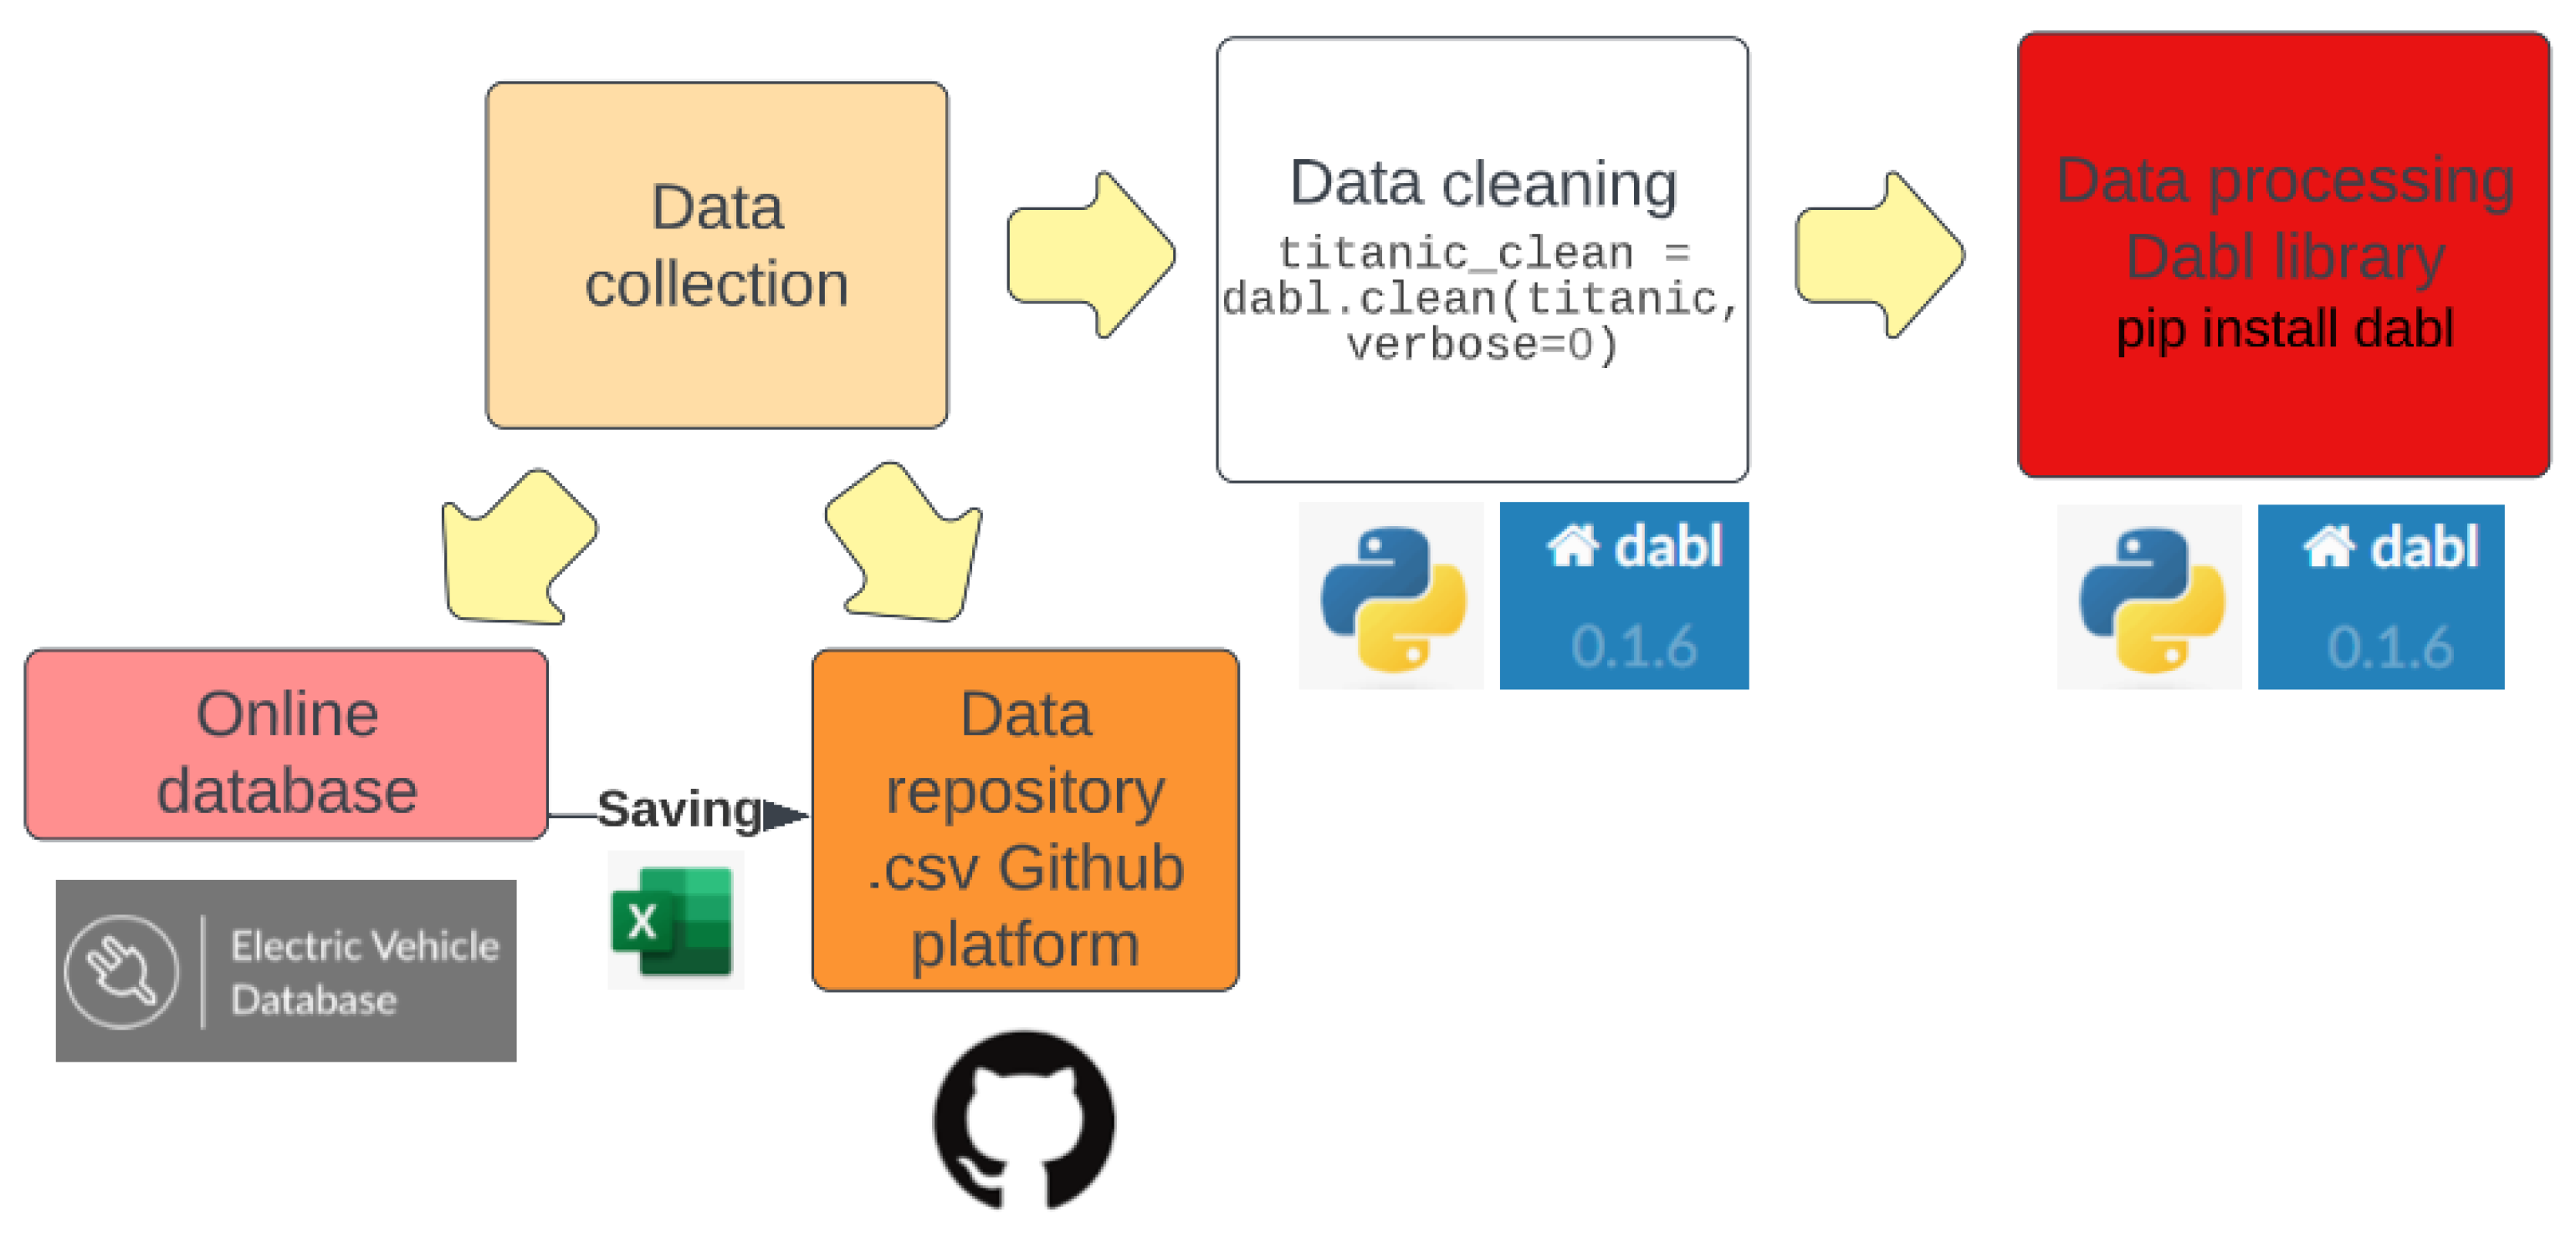
Data processing aims at collecting and manipulating data in order to obtain useful information from their analysis. For data processing, we can distinguish the following steps: data collection, data cleaning, data integration, data transformation, and visualization [67]. Data cleaning aims to identify and correct incorrect attributes for saved data records, e.g., removing empty fields or removing duplicate data [68]. Data integration combines data from various sources and prepares the data for further analysis [69]. Data transformation and visualization cause data to be properly converted at the beginning to the required specificity of the data format, and then visualizations are created [70,71,72]. A flowchart is shown in Figure 4 for the activities performed.
The selected catalog EV parameters were saved in an excel spreadsheet and then saved as a .csv file, which was imported into the Github data repository. The next steps for cleaning operations and data handling are described below. Data processing is an important step in the data analysis process as it helps ensure that data is accurate, consistent, and ready for analysis. Data processing can be performed manually step by step to implement the points described above, or it can be performed with the use of specialized tools that allow some automation [73].
In the first data processing step, the collected data was compiled into an .xls file, then converted to a .csv file and uploaded to the data repository on the GitHub platform. Github is a platform that provides tools for software development. It is a web hosting service designed to implement programming projects [74]. This service has been operating since 2008. Github provides free program hosting and private repositories [75]. For the described case, the Github platform was used as a data repository for the EV data.
The next step of data processing used the dabl library tool.
Dabl (Data Analysis Baseline Library) is a Python library that provides a set of tools and utilities for data analysis and machine learning. The dabl library was created to simplify and speed up the data preparation for further analysis. This library allows data cleaning, preselection of the best-fitting model, and evaluation of this model [76]. The main advantage of this library is the attempt to standardize the data analysis. This library is often used together with others, e.g., pandas, NumPy, and skikit-learn [77,78].
The dabl tool was used to perform visualizations for: target distribution, continuous feature vs. target, and categorical feature vs. target. Visualization analysis was presented based on the parameter energy consumption. Additional analysis of the data studied was performed on Pearson’s correlation coefficient.
For the most important functions of the dabl library, we can list the codes presented in Algorithm 1.
| Algorithm 1: Data processing of EVs in dabl |
|
The code snippets presented above can be used for further replication to create data analysis for other datasets. Algorithm 1 briefly explains some steps to process the data for the EV database under study. The algorithm recalls the functions that are used to install the dabl library packages; then the steps for importing tools to prepare charts are presented. The initial step is to identify the data source in csv format. A convenient way to save data, and one also used in this work, is to import a ready-made database into a Github data repository. Such a file requires prior preparation, while its raw path is needed for further processing. Subsequently, such data can be appropriately processed with a call to the desired functions of the dabl library. For example, an important step is to check the correctness of data writing and its appropriate cleaning. For this purpose, you can call the function titanic_clean, which provides a lot of information that relates to various columns for the data. The results of calling this cleaning function allow us to find incomplete data records or those that identify the wrong type of data, which may interfere with further analysis. Sometimes the use of inappropriate characters, such as “-”, can cause incorrect identification of the type of data, which limits further analysis of such a set as, for example, a sequence of numbers. The cleaning function also quickly identifies columns that are identified as useless.
In further analysis, it can be noticed that certain parameters from the calculation are excluded, for example, Pearson’s correlation coefficient. Such a state of affairs conditions the recording of certain columns of data parameters; for example, there were some deficiencies for data catalogs, e.g., for the charging speed parameter, and therefore the data could not be qualified for analysis for continuous data.
3. Results and Discussion
3.1. Results of Data Analysis
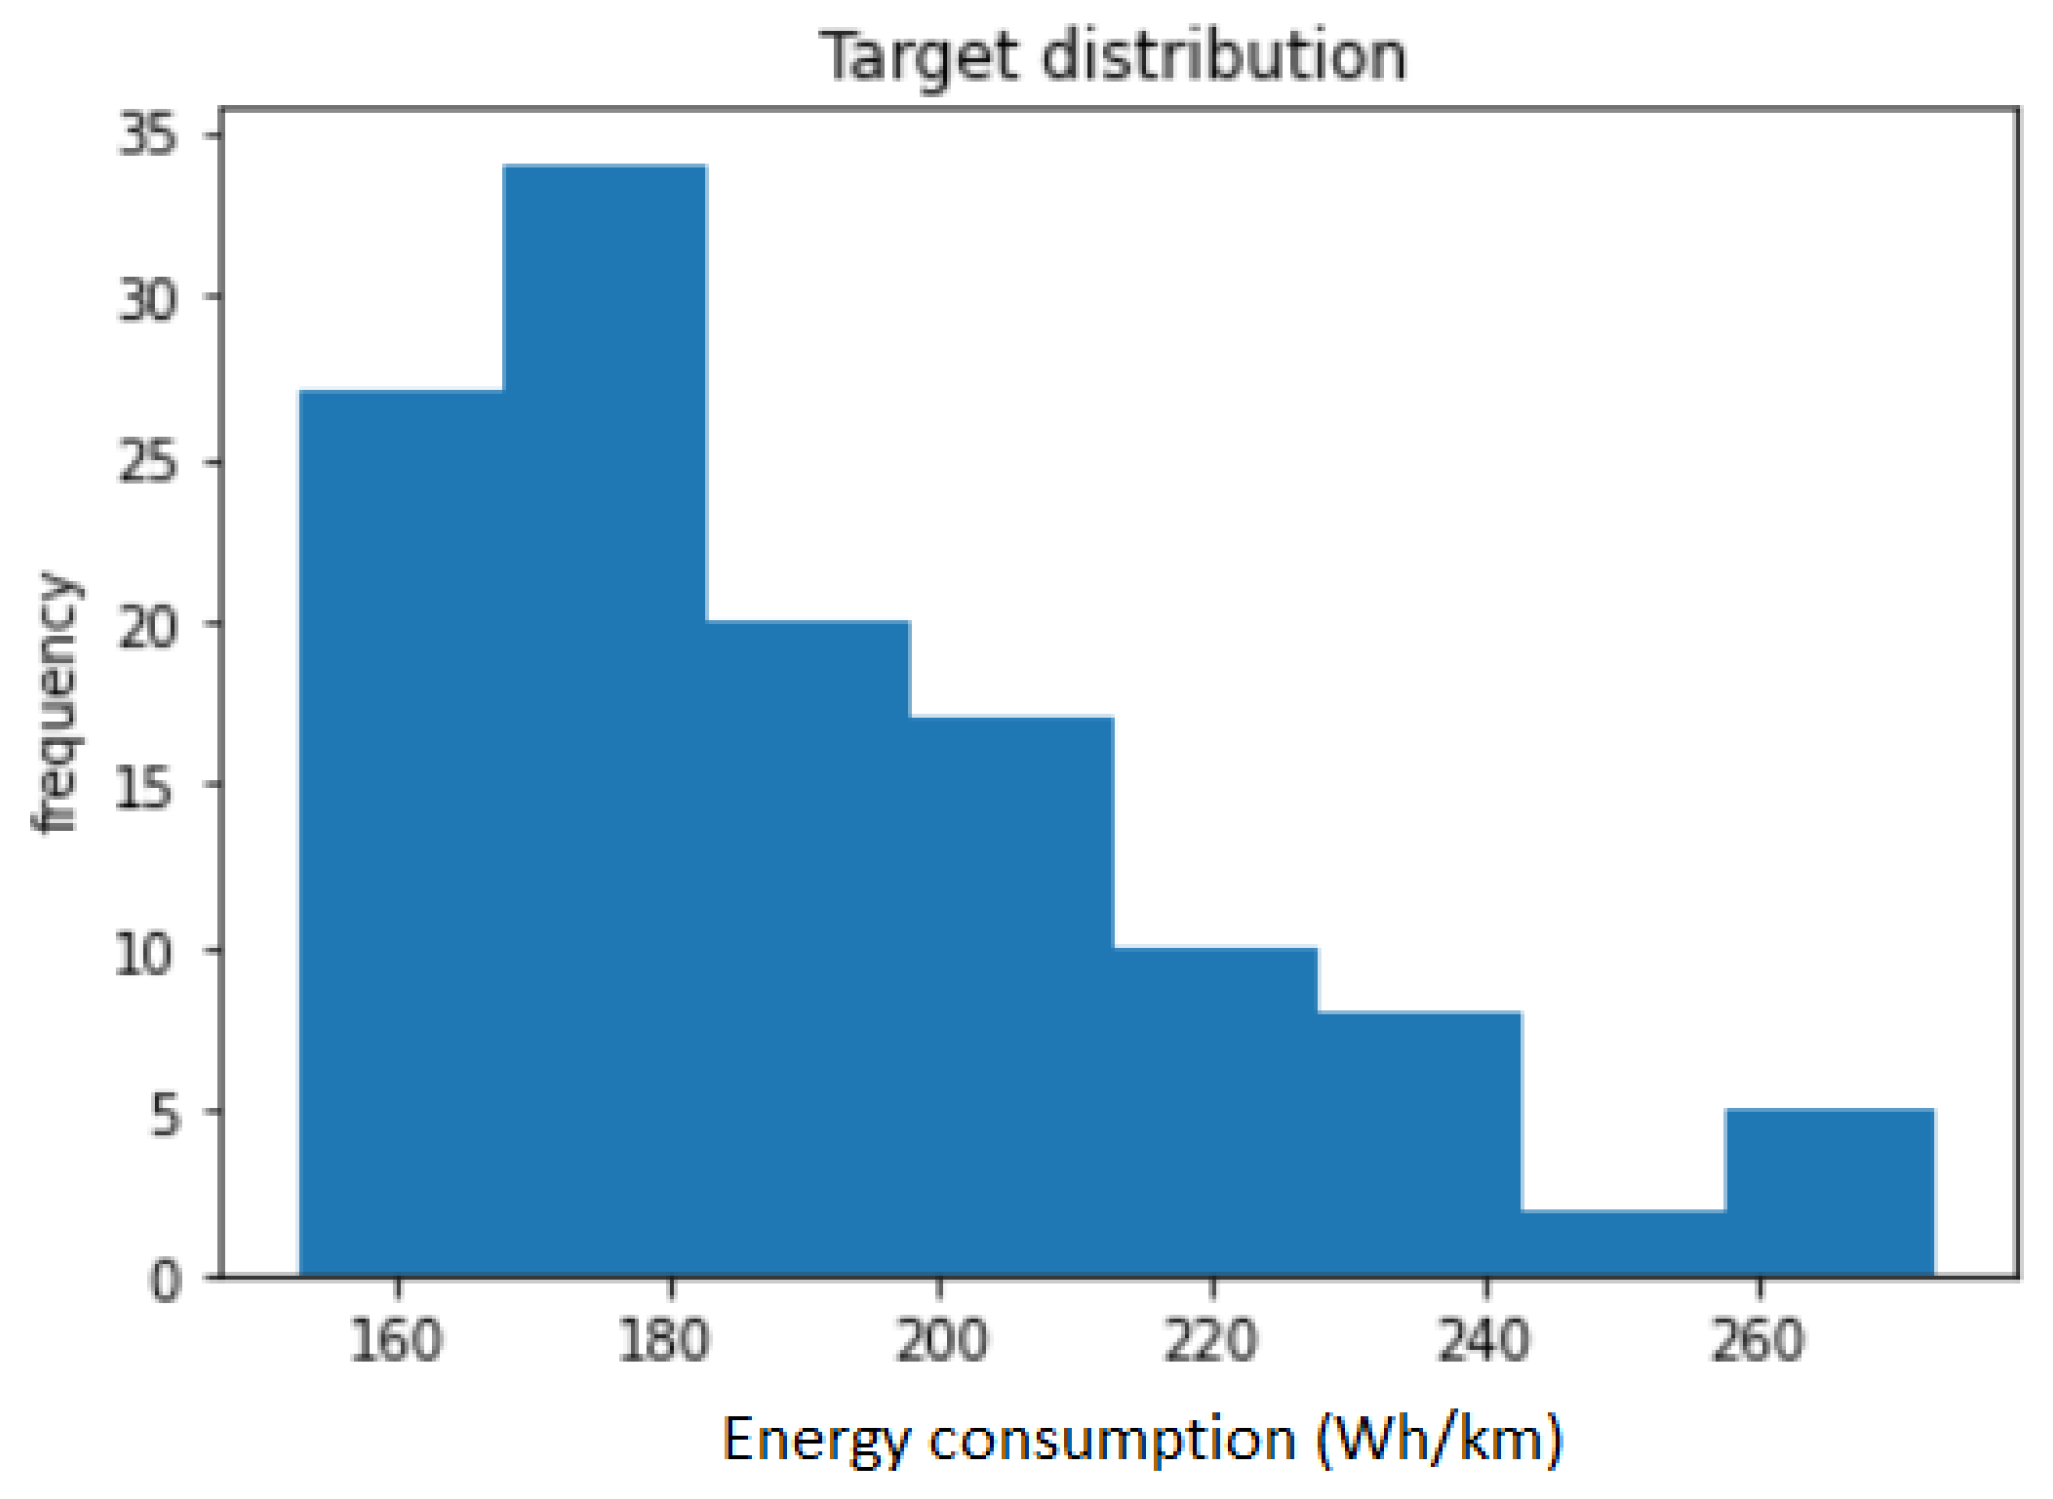
The dabl tool imported input files for the data records under study with the target parameter, which was energy consumption. Detailed analysis of the data attributes makes it possible to see which parameters affect the size of others and whether the data used for analysis is continuous data or data that are specific to classification. This is especially helpful with larger datasets since by generating simple charts or looking at the data it is not possible to classify such data. The data distribution for the energy consumption parameter is shown in Figure 5.
Based on Figure 5, it can be observed that the highest frequency is shown in the data for the range of 160–175 Wh/km. The rest of the data is in the range from 175–270 Wh/km, with the trend of data frequency decreasing to a level of about 230 Wh/km, while the subsequent ranges are characterized by no visible trend. The average value of the energy consumption parameter based on the work of Hao and Ho [79] is about 170–200 Wh/km, which confirms a certain statistical sample which is included in the analysis of the work.
In the next step, the data cleaning command was applied. The dabl tool attempts to identify the type of data and detect potential data quality problems. The purpose of this cleaning process is to get the quality right for visualizing the results.
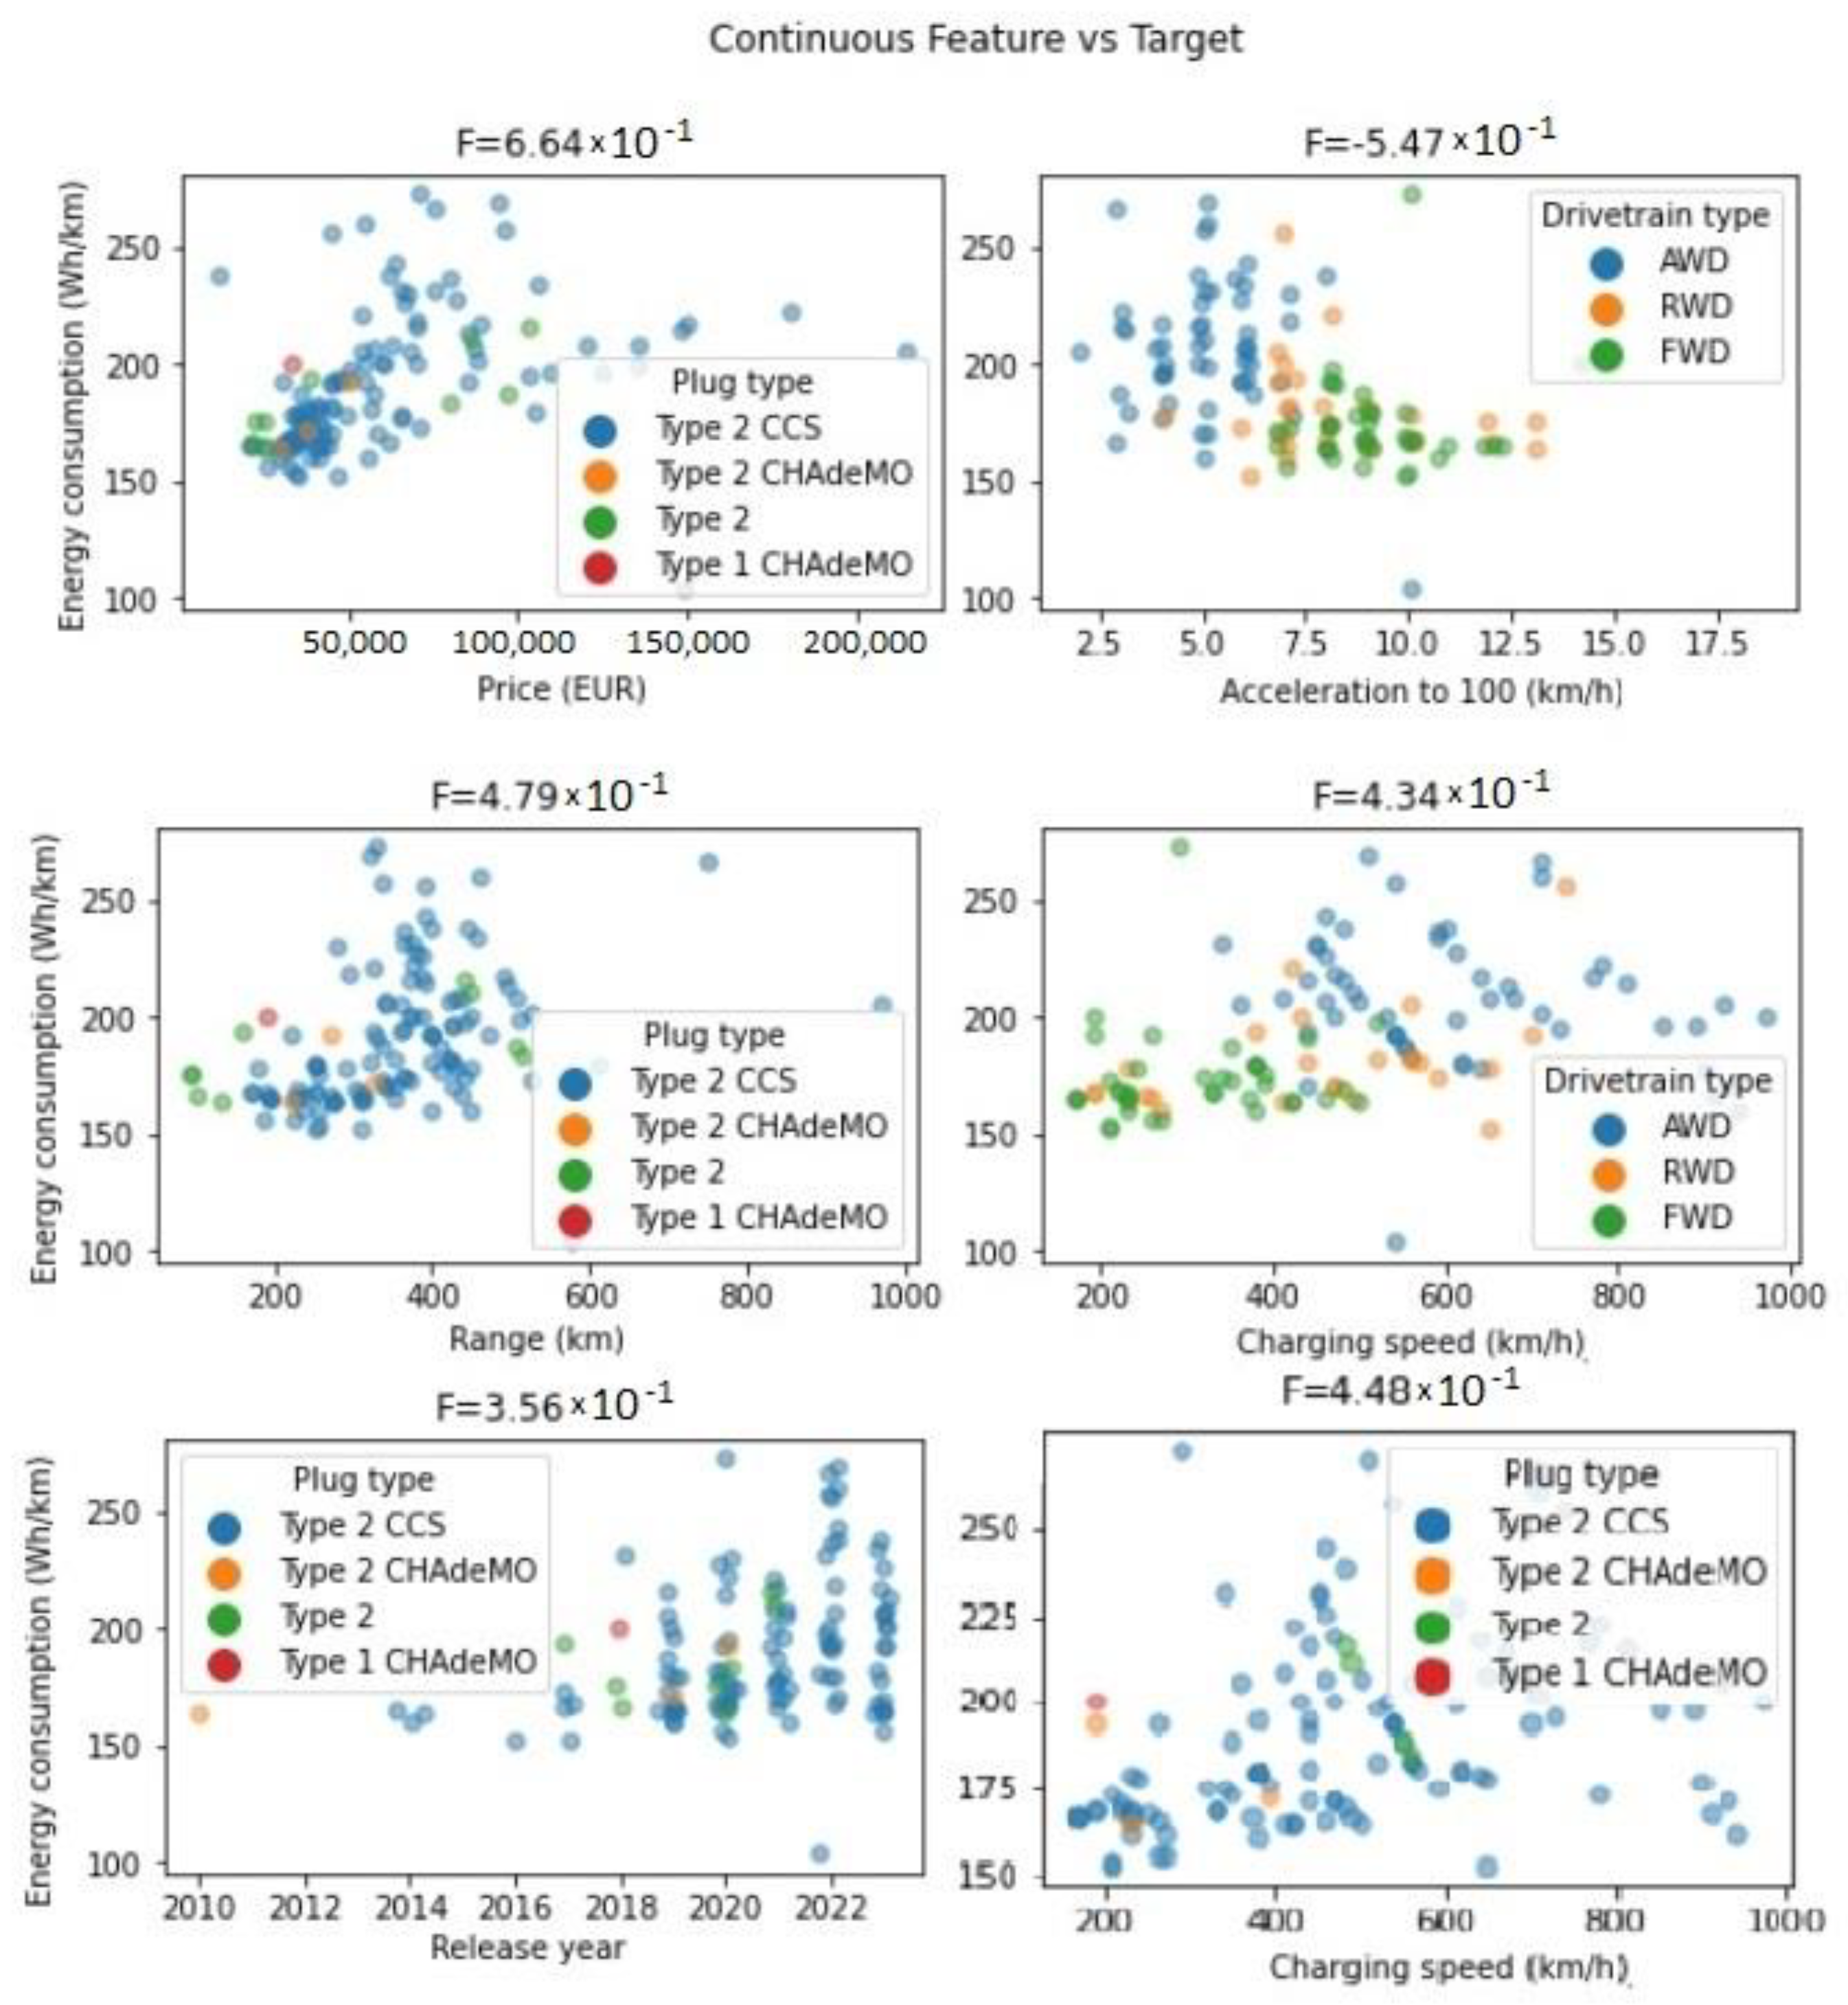
In the actual part of the work, exploratory data analysis (EDA) was performed on the data. Exploratory data analysis (EDA) allows analysis and summary of datasets to find certain relationships between data parameters [80,81,82]. The dabl tool selected four parameters that have the greatest impact on the target parameter. The analysis of these parameters as continuous feature vs. target is shown in Figure 6.
In data analysis, a continuous feature is a type of feature that can take on any value within a range or scale. Continuous features are typically used to describe characteristics or attributes of an entity that have a numerical value [83]. Based on Figure 6, it is possible to analyze the influence of the studied feature as a continuous feature on the energy consumption parameter. Data were presented as scatter plots and certain groups of data were clustered, for example, plug type or drivetrain type. This state of affairs makes it possible not only to analyze the influence of the parameters as a total dataset but also to analyze in detail certain groups of data on the parameter studied.
The main conclusions based on Figure 6 are as follows:
- The parameters studied are characterized by the low presence of outliers, which could affect the quality of further analysis.
- For three of the parameters studied (price (EUR), range (km), and release year), additional clusters were created for data against the plug-type parameter.
- For two of the parameters studied (acceleration to 100 (km/h) and charging speed (km/h)), additional clusters were created for the data against the parameter drivetrain type.
- Positive, negative, and no correlation instances can be observed for the data.
- Positive correlations against energy consumption occur for the parameters range (km), price (EUR), and release year.
- A negative correlation with energy consumption occurs for the acceleration parameter to 100 km/h.
- No correlation against energy consumption is for the parameter charging speed (km/h).
- EVs with AWD have the best acceleration at 100 km/h for the analyzed set of vehicles.
- For the newer vehicles in the EV data series, an increasing trend in energy consumption can be observed, especially for the group of vehicles that have Type 2 CCS.
Based on the dabl library’s automatically created series of graphs presenting the parameters as above as a function of continuous feature vs. energy consumption as target, we can observe, for example, attributes that have insufficient weight for analysis, e.g., Type 1 charging. The library itself also has some drawbacks in the form of graph generation and the selection of appropriate categorical-type data to reflect the desired analytical effect; e.g., in the presented graphs in Figure 6 it can be seen, for example, the presentation of the results of the charging speed parameter categorized against the drivetrain type. Therefore, we additionally reworked the database to create an additional graph presenting, for example, charging speed as a function with the type from charger as a categorical clustering of data.
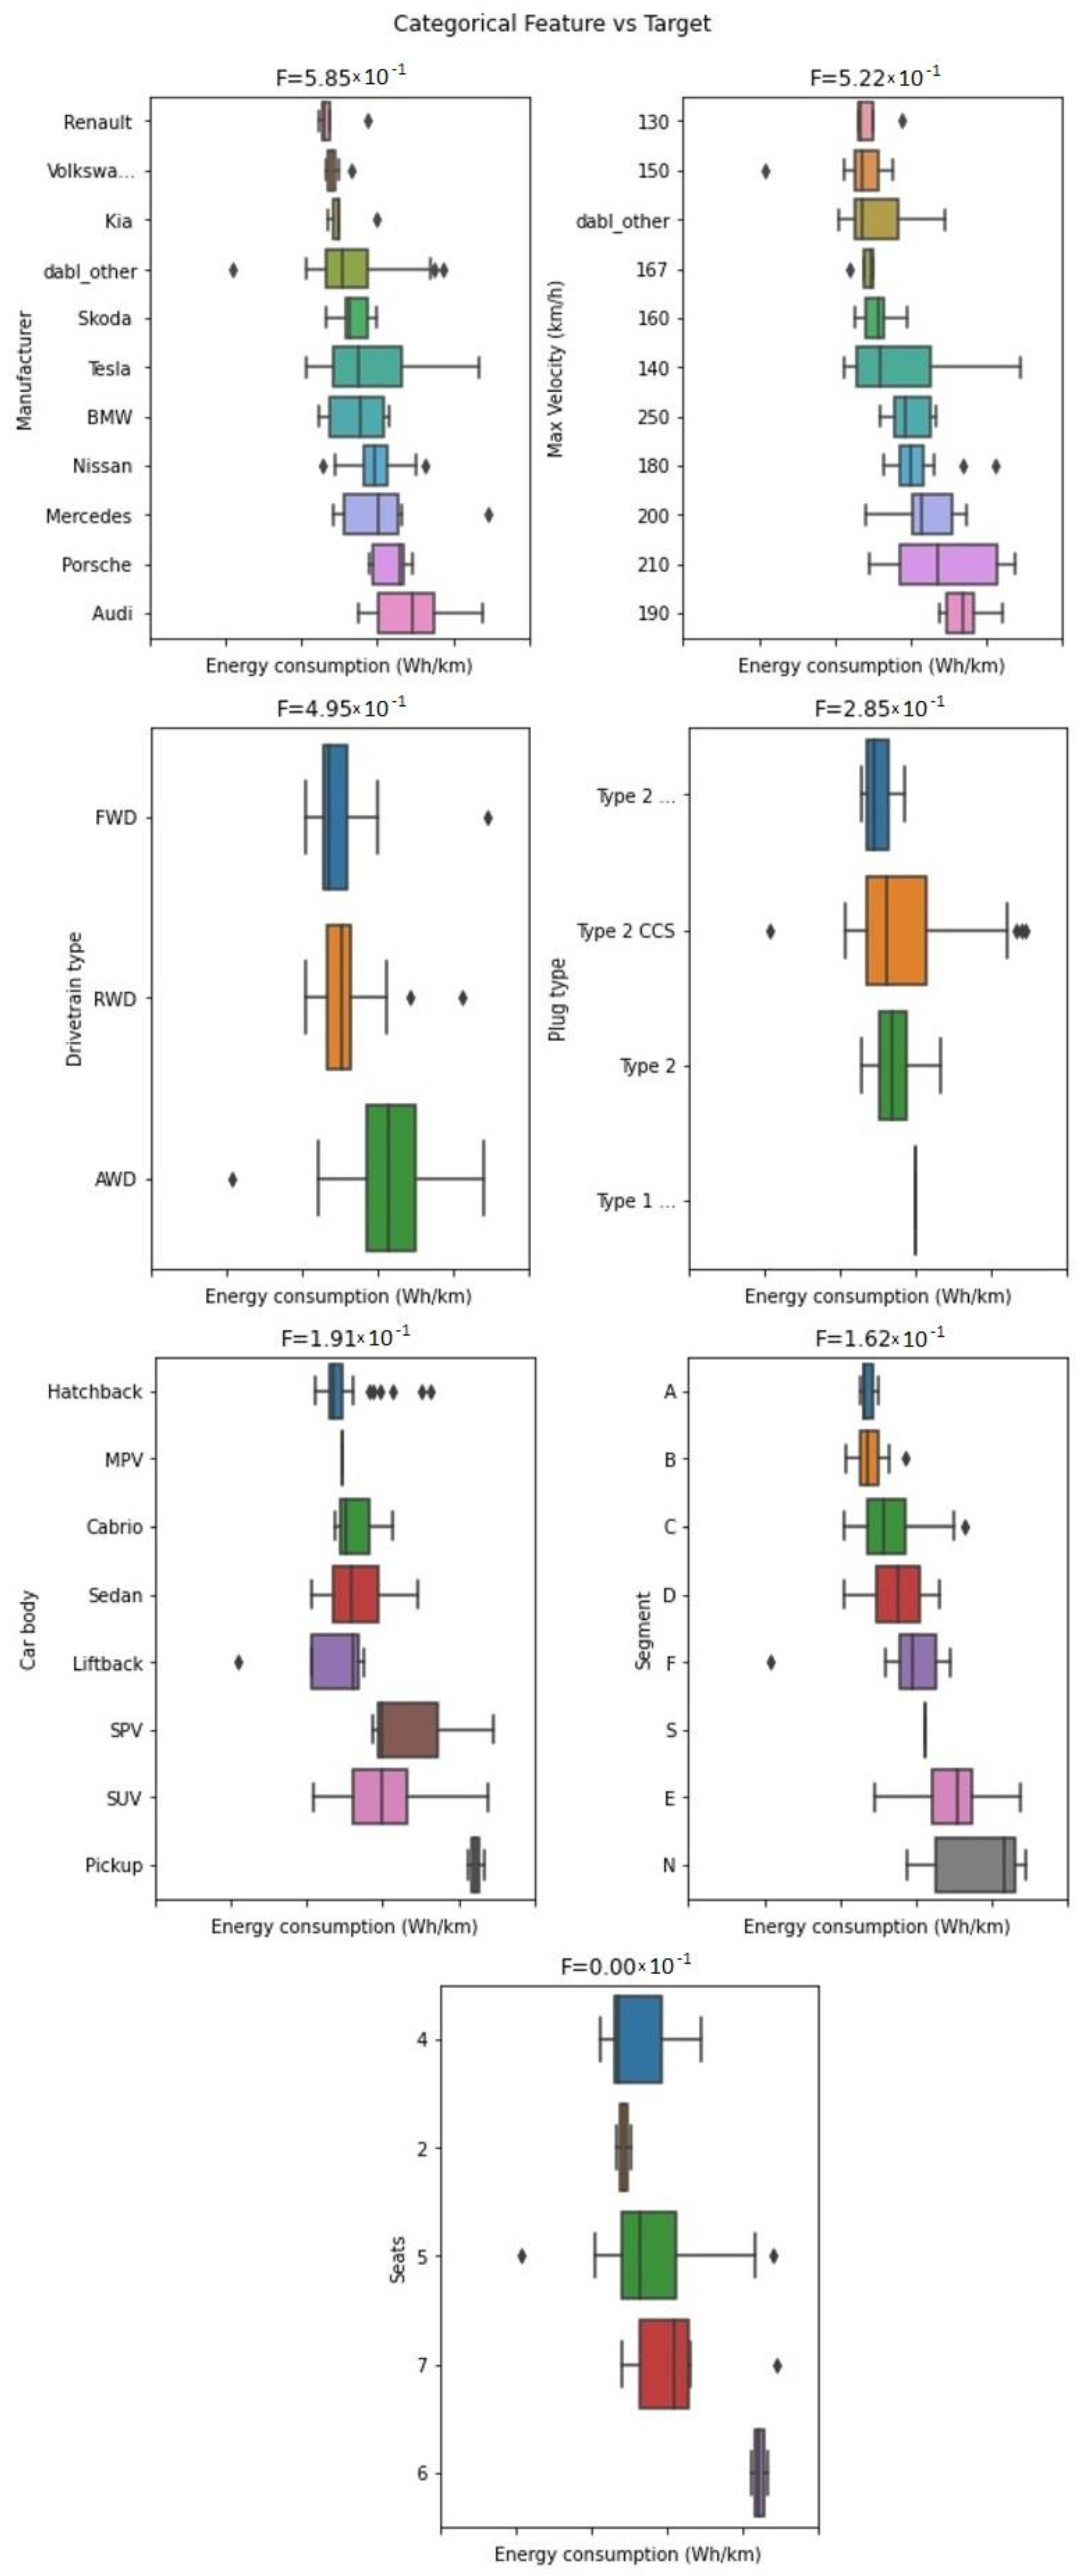
In the next step, categorical feature vs. target parameter analysis was undertaken. In data analysis, a categorical feature is a type of feature that can take on a limited number of values, which are usually categories or labels. Categorical features are commonly used to describe characteristics or attributes of an entity that does not have a numerical value [84]. In data analysis, it is common to use categorical features as predictors or independent variables in a model and to use the target as the dependent variable [85]. The results for the categorical feature vs. target parameter data presentation are shown in Figure 7.
Based on Figure 7, it is possible to observe the influence of categorical features as researched parameters on the target parameters, i.e., energy consumption. The data were classified in terms of manufacturer, max velocity (km/h), drivetrain type, plug type, card body, segment, and seat parameters. The data were visualized and indicate the minimum, maximum, mean, and standard deviation values. The main conclusions based on Figure 7 are as follows:
- The highest energy consumption characterizes the analyzed vehicles of the manufacturer Audi, also for Tesla, looking at the maximum value, one can observe its highest value relative to the rest of the manufacturers.
- The smallest energy consumption is characterized by the vehicles of the manufacturers Renault, Volkswagen, and Kia.
- The highest energy consumption is attributed to the parameter max. velocity for speeds higher than 180 km/h and for the maximum value for max velocity 140 km/h.
- The highest energy consumption for average values relative to the drivetrain type parameter occurs for AWD vehicles.
- The largest energy consumption relative to the car body parameter occurs for EVs of the SUV, pickup, and SPV types, while the smallest occurs for hatchback vehicles.
- The largest energy consumption relative to the segment parameter occurs for the E and N vehicle classes.
- For the number of seats parameter, the largest energy consumption for the surveyed vehicles occurs for 6 seats, while the smallest occurs for 4 and 2 seats.
For categorical feature vs. energy consumption, it is also worth noting that taking into account, for example, the variable number of seats could limit and reduce the predictive capabilities of a future AI model since this parameter has little variation. In this case, to create a robust AI model, it is recommended additionally to examine the variance of the variables for each analyzed variable, which can be used as an explanatory variable for the future machine learning model.
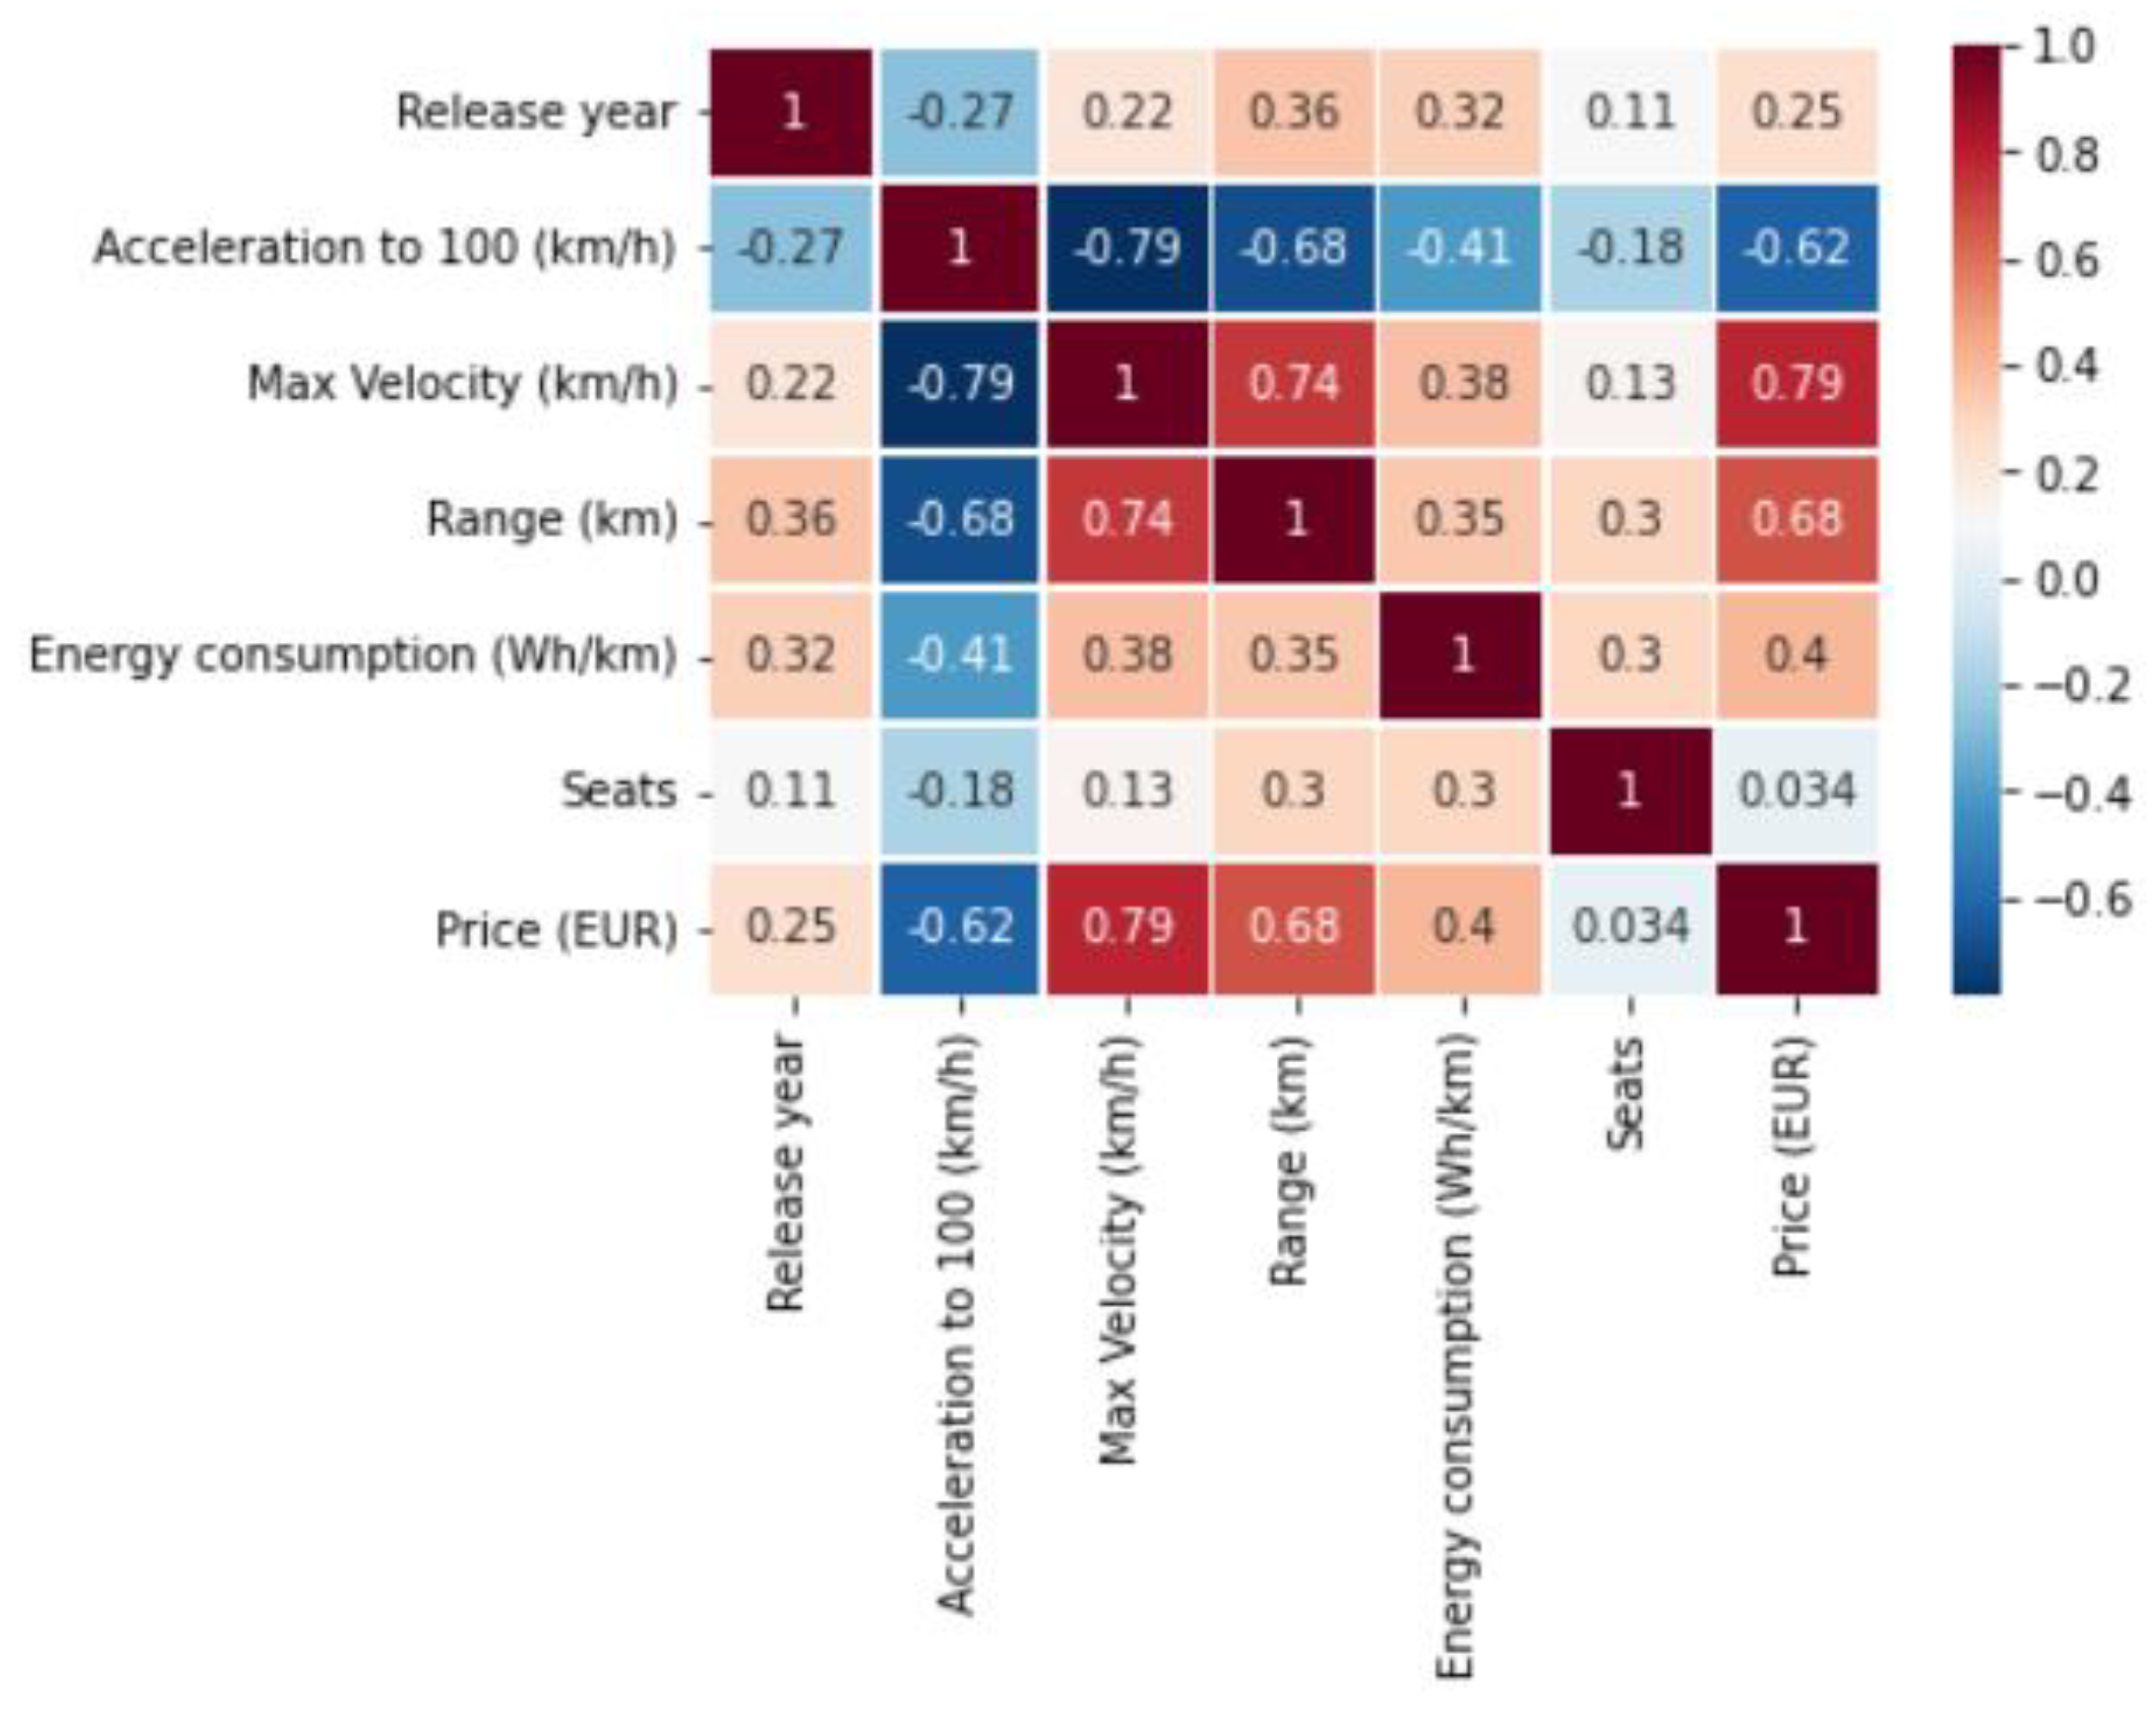
Pearson’s correlation coefficient was determined to verify the correlation of all the studied with each other. Pearson’s correlation is a statistical measure of the linear relationship between two continuous variables [86,87]. It is a measure of the strength and direction of the association between variables, and ranges from −1 to 1 [88].
n—number of paired values of x and y.
The results of the Pearson correlation coefficient calculation for the numerical parameters are shown in Figure 8.
The variables shown in Figure 8, their mutual correlation, do not include comparisons for all analyzed parameters because some variables were classified as categorical and therefore the coefficient was not calculated. An alternative method to check the correlation for all variables regardless of their type could be to use a predictive power score, and this is a recommendation for further work. However, the calculated Pearson’s correlation coefficient gives some insight into the parameters potential use of the studied as future explanatory variables for AI models. The results of the Pearson correlation coefficient in Figure 8 are shown as a correlation heatmap. A correlation heatmap is a graphical representation of the relationship between variables in a dataset. It is a type of visualization that is used to understand the strength and direction of associations between variables and is often used in data analysis and machine learning [90]. Based on the results of Figure 8, the following correlations can be observed for the parameter energy consumption of the studied parameter compared to the rest of the parameters:
- The highest correlation value with respect to energy consumption is found for the price (EUR) and equals 0.4.
- The next parameters with the highest correlation with the energy consumption parameter are max. velocity (0.38), range (0.35), and seats (3.0).
- The negative correlation against the energy consumption parameter is for the acceleration to 100 km/h parameter and is −0.41.
3.2. Discussion
The EV data evaluation and analysis methodology presented in the article allows for a comprehensive classification of a given dataset. Developed visualizations of parameter variation against the target parameter allow us to better understand the data and, if necessary, to clean it and supplement it with missing information. The analysis of the graphs together with Pearson’s correlation coefficient analysis is helpful, for example, in selecting a set of best predictors for further data analysis, such as in preparing a machine learning model. However, the presented approach using the dabl library and, in addition, the Pearson correlation coefficient must take into account additional factors that may contribute to the selection of the best set of predictors. For example, a limitation of the use of Pearson’s correlation coefficient is that it can only apply to categorical data, and this limitation is evident in the results for the parameters tested. In addition, it is also worth adding to the algorithms a function that checks the variance for variables because, for example, such a parameter as the number of seats is characterized by low variance, which would adversely affect the created future model. Future creation of a machine learning model should be performed against a previous data check and classification against the data series for regression and classification models. In terms of the dataset analyzed from the analysis, one can see the potential for creating machine learning models. For example, for classification data, a model can be created that will automatically create data clusters for the car body parameter, creating a set of segment-specific data. Classification models, based on the class label, predict the result based on input data [91,92], for the case under study, for the parameters such as energy consumption or range. Based on the resulting data analysis, it is also possible to create a regression model that would estimate, for example, the range of a vehicle based on its year of manufacture, type of drivetrain, or charging speed. Regression models are widely used for data from electric vehicles [93,94].
The performance of the EV data analysis presented in the paper and the possible creation of potential machine learning models can be helpful for the analysis of a large datasets for EVs. It is possible to predict, for example, future ranges of electric vehicles based on historical and current data for these vehicles.
Examples of other works that analyze data from electric vehicles could be, for example, the work by Lv et al. [95], where the authors collect data from a network of electric vehicles for analysis using K-means and fuzzy theory to create a fuzzy mean clustering algorithm theory (FCM). Another example of a work is the study by Sadeghianpourhamami et al. [96], where the authors perform a quantification of electric vehicle flexibility based on a large-scale real-world dataset. In this work, three behavioral clusters are identified based on vehicle arrival and departure data. Another work using electric vehicle data analysis is [97], which aimed to identify electric vehicle market share through panel data analysis based on time series data from 2011 to 2015 in 31 countries. The authors selected the five most influential independent variables that are expected to affect electric vehicle adoption. Another interesting paper is [98], in which the authors analyze vehicle data based on the public EV charging infrastructure network in the city of Amsterdam. This work is based on an analysis of the actual usage patterns of the public charging infrastructure in the city of Amsterdam, based on more than 109,000 charging sessions.
There are still few works that describe the problem of analyzing the energy consumption parameter in relation to the analysis of datasets from electric vehicles. Examples of such works include the work by Basso et al. [99], which presents an energy model that includes topography, speed, acceleration, and powertrain efficiency. This work also presents a method to calculate the energy cost coefficients for the road network. Another work that examines the topic of energy consumption in relation to the construction parameters of EVs is the work by Zhao et al. [100]. The authors of this work propose an effective and scientific method for the construction of a representative driving cycle for electric vehicles (EV). However, the subject matter of the paper itself is exclusively related to the construction of a driving cycle for electric vehicles.
Given the methodology developed and a review of the available literature, it can be observed that there are a small number of articles describing the use of data for electric vehicles in terms of energy consumption parameters. The methodology developed for dealing with the use and analysis of such data can be helpful for analyzing even larger datasets as the methods and tools used can be scalable for other cases. Such information and data can be used to create, for example, national reports based on vehicles in use.
4. Conclusions
The paper presents methodologies for creating analysis for electric vehicle databases using the Python environment and the Dabl library. Analysis of data from these vehicles offers the potential to create, for example, machine learning models which can be used, for example, to classify the data or to create regression models for further prediction of, for example, vehicle utilization, or against the analyzed parameter of energy consumption.
The presented methodology for data analysis for electric vehicles for selected parameters allows:
- Analysis of the variability of the parameters under study for the entire dataset, which improves the process of understanding the data.
- Analyzing the impact of the correlation of the selected target parameter against the parameters describing it, in order to find patterns and, for example, appropriate clusters of data for further analysis.
- Selection of appropriate parameters, i.e., the best predictors for a given explanatory variable in order to create machine learning models.
- For the studied parameter energy consumption, there is a high correlation with other parameters, e.g., the range of an electric vehicle or its maximum speed.
- For the examined parameter energy consumption, there is a negative correlation with respect to the parameter acceleration to 100 km/h.
- There is no correlation with energy consumption for the parameter charging speed.
- The highest values of correlations with the energy consumption parameter are as follows: max. velocity (0.38), range (0.35), and seats (3.0).
A limitation and at the same time an indication for further work on the topic is the expansion of the current database to include more EV models. However, the very purpose of the work was to show a methodology for processing EVs data that produces results as quickly as possible, which helps to better understand the data and possibly gather the best set of predictors that can be used for further analysis. A limitation of the work is also the lack of variance calculation for the variables studied. The value of the parameters variance for the studied case would give additional value added to the set of best possible predictors. The use of Pearson’s correlation coefficient also does not give a complete view, in particular, for categorical data analysis, so in this case further recommendations assume the use of another indicator, which could be, for example, a predictive power score.
In terms of further work, it is also possible to use other libraries that are dedicated to data analysis and can also give effective results to a good extent. It is also possible to create your own libraries, which would be exclusively dedicated to, for example, the analysis of data from electric vehicles and could be combined with ready-made databases that can be updated on an ongoing basis.
Author Contributions
Conceptualization, M.M. and T.C.; methodology, M.M.; software, M.M.; validation, T.C. and M.M.; formal analysis, T.C.; investigation, M.M.; resources, T.C. and M.M.; data curation, M.M.; writing—original draft preparation, M.M. and T.C.; writing—review and editing, M.M. and T.C.; visualization, M.M.; supervision, T.C. All authors have read and agreed to the published version of the manuscript.
Funding
This research received no external funding.
Data Availability Statement
Not applicable.
Conflicts of Interest
The authors declare no conflict of interest.
Nomenclature
| AC | Alternating current |
| AWD | All-wheel drive |
| CCS | Combined charging system |
| DC | Direct current |
| EDA | Exploratory data analysis |
| EV | Electric vehicle |
| FWD | Front-wheel drive |
| RWD | Rear-wheel drive |
| SUV | Sport utility vehicle |
References
- Tsakalidis, A.; Gkoumas, K.; Pekár, F. Digital Transformation Supporting Transport Decarbonisation: Technological Developments in EU-Funded Research and Innovation. Sustainability 2020, 12, 3762. [Google Scholar] [CrossRef]
- Bonoli, A.; Zanni, S.; Serrano-Bernardo, F. Sustainability in Building and Construction within the Framework of Circular Cities and European New Green Deal. The Contribution of Concrete Recycling. Sustainability 2021, 13, 2139. [Google Scholar] [CrossRef]
- Miklautsch, P.; Woschank, M. A framework of measures to mitigate greenhouse gas emissions in freight transport: Systematic literature review from a Manufacturer’s perspective. J. Clean. Prod. 2022, 366, 132883. [Google Scholar] [CrossRef]
- Aminzadegan, S.; Shahriari, M.; Mehranfar, F.; Abramović, B. Factors affecting the emission of pollutants in different types of transportation: A literature review. Energy Rep. 2022, 8, 2508–2529. [Google Scholar] [CrossRef]
- Jaworski, A.; Mądziel, M.; Lew, K.; Campisi, T.; Woś, P.; Kuszewski, H.; Wojewoda, P.; Ustrzycki, A.; Balawender, K.; Jakubowski, M. Evaluation of the Effect of Chassis Dynamometer Load Setting on CO2 Emissions and Energy Demand of a Full Hybrid Vehicle. Energies 2022, 15, 122. [Google Scholar] [CrossRef]
- Kazancoglu, Y.; Ozbiltekin-Pala, M.; Ozkan-Ozen, Y.D. Prediction and evaluation of greenhouse gas emissions for sustainable road transport within Europe. Sustain. Cities Soc. 2021, 70, 102924. [Google Scholar] [CrossRef]
- Zahedi, S.; Batista-Foguet, J.M.; van Wunnik, L. Exploring the public’s willingness to reduce air pollution and greenhouse gas emissions from private road transport in Catalonia. Sci. Total Environ. 2019, 646, 850–861. [Google Scholar] [CrossRef]
- Laporte, S.; Coquery, G.; Deniau, V.; De Bernardinis, A.; Hautière, N. Dynamic wireless power transfer charging infrastructure for future evs: From experimental track to real circulated roads demonstrations. World Electr. Veh. J. 2019, 10, 84. [Google Scholar] [CrossRef]
- Jaworski, A.; Mądziel, M.; Kuszewski, H. Sustainable Public Transport Strategies—Decomposition of the Bus Fleet and Its Influence on the Decrease in Greenhouse Gas Emissions. Energies 2022, 15, 2238. [Google Scholar] [CrossRef]
- Thiel, C.; Julea, A.; Acosta Iborra, B.; De Miguel Echevarria, N.; Peduzzi, E.; Pisoni, E.; Gómez Vilchez, J.J.; Krause, J. Assessing the Impacts of Electric Vehicle Recharging Infrastructure Deployment Efforts in the European Union. Energies 2019, 12, 2409. [Google Scholar] [CrossRef] [Green Version]
- Jones, B.; Nguyen-Tien, V.; Elliott, R.J. The electric vehicle revolution: Critical material supply chains, trade and development. World Econ. 2022. [Google Scholar] [CrossRef]
- Razmjoo, A.; Ghazanfari, A.; Jahangiri, M.; Franklin, E.; Denai, M.; Marzband, M.; Maheri, A. A Comprehensive Study on the Expansion of Electric Vehicles in Europe. Appl. Sci. 2022, 12, 11656. [Google Scholar] [CrossRef]
- Yu, J.; Yang, P.; Zhang, K.; Wang, F.; Miao, L. Evaluating the Effect of Policies and the Development of Charging Infrastructure on Electric Vehicle Diffusion in China. Sustainability 2018, 10, 3394. [Google Scholar] [CrossRef]
- Orlov, A.; Kallbekken, S. The impact of consumer attitudes towards energy efficiency on car choice: Survey results from Norway. J. Clean. Prod. 2019, 214, 816–822. [Google Scholar] [CrossRef]
- de Rubens, G.Z. Who will buy electric vehicles after early adopters? Using machine learning to identify the electric vehicle mainstream market. Energy 2019, 172, 243–254. [Google Scholar] [CrossRef]
- Tran, M.-K.; Bhatti, A.; Vrolyk, R.; Wong, D.; Panchal, S.; Fowler, M.; Fraser, R. A Review of Range Extenders in Battery Electric Vehicles: Current Progress and Future Perspectives. World Electr. Veh. J. 2021, 12, 54. [Google Scholar] [CrossRef]
- Dik, A.; Omer, S.; Boukhanouf, R. Electric Vehicles: V2G for Rapid, Safe, and Green EV Penetration. Energies 2022, 15, 803. [Google Scholar] [CrossRef]
- Chen, T.; Zhang, X.P.; Wang, J.; Li, J.; Wu, C.; Hu, M.; Bian, H. A review on electric vehicle charging infrastructure development in the UK. J. Mod. Power Syst. Clean Energy 2020, 8, 193–205. [Google Scholar] [CrossRef]
- Koch, N.; Ritter, N.; Rohlf, A.; Scarazzato, F. When is the electric vehicle market self-sustaining? Evidence from Norway. Energy Econ. 2022, 110, 105991. [Google Scholar] [CrossRef]
- Zhou, W.; Hagos, D.A.; Stikbakke, S.; Huang, L.; Cheng, X.; Onstein, E. Assessment of the impacts of different policy instruments on achieving the deep decarbonization targets of island energy systems in Norway–The case of Hinnøya. Energy 2022, 246, 123249. [Google Scholar] [CrossRef]
- Lanz, L.; Noll, B.; Schmidt, T.S.; Steffen, B. Comparing the levelized cost of electric vehicle charging options in Europe. Nat. Commun. 2022, 13, 5277. [Google Scholar] [CrossRef] [PubMed]
- Falchetta, G.; Noussan, M. Electric vehicle charging network in Europe: An accessibility and deployment trends analysis. Transp. Res. Part D Transp. Environ. 2021, 94, 102813. [Google Scholar] [CrossRef]
- Talluri, G.; Grasso, F.; Chiaramonti, D. Is Deployment of Charging Station the Barrier to Electric Vehicle Fleet Development in EU Urban Areas? An Analytical Assessment Model for Large-Scale Municipality-Level EV Charging Infrastructures. Appl. Sci. 2019, 9, 4704. [Google Scholar] [CrossRef]
- Panchal, C.; Stegen, S.; Lu, J. Review of static and dynamic wireless electric vehicle charging system. Eng. Sci. Technol. Int. J. 2018, 21, 922–937. [Google Scholar] [CrossRef]
- Wu, X.; Freese, D.; Cabrera, A.; Kitch, W.A. Electric vehicles’ energy consumption measurement and estimation. Transp. Res. Part D Transp. Environ. 2015, 34, 52–67. [Google Scholar] [CrossRef]
- Yu, B.; Yang, J.; Wang, D.; Shi, J.; Chen, J. Energy consumption and increased EV range evaluation through heat pump scenarios and low GWP refrigerants in the new test procedure WLTP. Int. J. Refrig. 2019, 100, 284–294. [Google Scholar] [CrossRef]
- De Cauwer, C.; Maarten, M.; Heyvaert, S.; Coosemans, T.; Van Mierlo, J. Electric vehicle use and energy consumption based on realworld electric vehicle fleet trip and charge data and its impact on existing EV research models. World Electr. Veh. J. 2015, 7, 436–446. [Google Scholar]
- Mądziel, M.; Jaworski, A.; Savostin-Kosiak, D.; Lejda, K. The Impact of Exhaust Emission from Combustion Engines on the Environment: Modelling of Vehicle Movement at Roundabouts. Int. J. Automot. Mech. Eng. 2020, 17, 8360–8371. [Google Scholar] [CrossRef]
- Ziółkowski, A.; Fuć, P.; Lijewski, P.; Jagielski, A.; Bednarek, M.; Kusiak, W. Analysis of Exhaust Emissions from Heavy-Duty Vehicles on Different Applications. Energies 2022, 15, 7886. [Google Scholar] [CrossRef]
- Cardenas, A.; Guzman, C.; Martinez, W. EV Overnight Charging Strategy in Residential Sector: Case of Winter Season in Quebec. Vehicles 2021, 3, 557–577. [Google Scholar] [CrossRef]
- Kumar, S.; Bharj, R.S. Experimental analysis of a light weight refrigerated electric vehicle in the summer and winter season. In AIP Conference Proceedings; AIP Publishing LLC: Melville, NY, USA, 2021; Volume 2317, p. 030006. [Google Scholar]
- Ristiana, R.; Rohman, A.S.; Machbub, C.; Purwadi, A.; Rijanto, E. A new approach of EV modeling and its control applications to reduce energy consumption. IEEE Access 2019, 7, 141209–141225. [Google Scholar] [CrossRef]
- Sagaria, S.; Neto, R.C.; Baptista, P. Modelling approach for assessing influential factors for EV energy performance. Sustain. Energy Technol. Assess. 2021, 44, 100984. [Google Scholar] [CrossRef]
- Skuza, A.; Jurecki, R.S. Analysis of factors affecting the energy consumption of an EV vehicle-a literature study. In IOP Conference Series: Materials Science and Engineering; IOP Publishing: Bristol, UK, 2022; Volume 1247, p. 012001. [Google Scholar]
- Wang, J.B.; Liu, K.; Yamamoto, T.; Morikawa, T. Improving estimation accuracy for electric vehicle energy consumption considering the effects of ambient temperature. Energy Procedia 2017, 105, 2904–2909. [Google Scholar] [CrossRef]
- Schücking, M.; Jochem, P.; Fichtner, W.; Wollersheim, O.; Stella, K. Influencing factors on specific energy consumption of EV in extensive operations. In Proceedings of the 29th International Electric Vehicle Symposium, Montreal, QC, Canada, 19–22 June 2016. [Google Scholar]
- Hinov, N.; Punov, P.; Gilev, B.; Vacheva, G. Model-Based Estimation of Transmission Gear Ratio for Driving Energy Consumption of an EV. Electronics 2021, 10, 1530. [Google Scholar] [CrossRef]
- Li, W.; Stanula, P.; Egede, P.; Kara, S.; Herrmann, C. Determining the main factors influencing the energy consumption of electric vehicles in the usage phase. Procedia Cirp 2016, 48, 352–357. [Google Scholar] [CrossRef]
- Elahi, M.Q.; Elsaadany, M.; Rehman, H.; Mukhopadhyay, S. Battery Energy Consumption Optimization for the EV Traction System. In Proceedings of the 2022 IEEE 16th International Conference on Compatibility, Power Electronics, and Power Engineering (CPE-POWERENG), Birmingham, UK, 29 June–1 July 2022; pp. 1–5. [Google Scholar]
- Sweeting, W.J.; Hutchinson, A.R.; Savage, S.D. Factors affecting electric vehicle energy consumption. Int. J. Sustain. Eng. 2011, 4, 192–201. [Google Scholar] [CrossRef]
- Yao, E.; Yang, Z.; Song, Y.; Zuo, T. Comparison of electric vehicle’s energy consumption factors for different road types. Discret. Dyn. Nat. Soc. 2013, 2013, 328757. [Google Scholar] [CrossRef]
- Yi, Z.; Bauer, P.H. Effects of environmental factors on electric vehicle energy consumption: A sensitivity analysis. IET Electr. Syst. Transp. 2017, 7, 3–13. [Google Scholar] [CrossRef]
- Mediouni, H.; Ezzouhri, A.; Charouh, Z.; El Harouri, K.; El Hani, S.; Ghogho, M. Energy Consumption Prediction and Analysis for Electric Vehicles: A Hybrid Approach. Energies 2022, 15, 6490. [Google Scholar] [CrossRef]
- Biová, J.; Dietz, N.; Chan, Y.O.; Joshi, T.; Bilyeu, K.; Škrabišová, M. AccuCalc: A Python Package for Accuracy Calculation in GWAS. Genes 2023, 14, 123. [Google Scholar] [CrossRef]
- Bullejos, M.; Cabezas, D.; Martín-Martín, M.; Alcalá, F.J. Confidence of a k-Nearest Neighbors Python Algorithm for the 3D Visualization of Sedimentary Porous Media. J. Mar. Sci. Eng. 2023, 11, 60. [Google Scholar] [CrossRef]
- Jena, K.K.; Bhoi, S.K.; Malik, T.K.; Sahoo, K.S.; Jhanjhi, N.Z.; Bhatia, S.; Amsaad, F. E-Learning Course Recommender System Using Collaborative Filtering Models. Electronics 2023, 12, 157. [Google Scholar] [CrossRef]
- Zhu, X.; Yang, J.; Huang, Q.; Liu, T. A Review on Pollution Treatment in Cement Industrial Areas: From Prevention Techniques to Python-Based Monitoring and Controlling Models. Processes 2022, 10, 2682. [Google Scholar] [CrossRef]
- Zhang, T.; Zhang, X.; Li, J.; Xu, X.; Wang, B.; Zhan, X.; Xu, Y.; Ke, X.; Zeng, T.; Su, H.; et al. SAR Ship Detection Dataset (SSDD): Official Release and Comprehensive Data Analysis. Remote Sens. 2021, 13, 3690. [Google Scholar] [CrossRef]
- Al-Dhabyani, W.; Gomaa, M.; Khaled, H.; Fahmy, A. Dataset of breast ultrasound images. Data Brief 2020, 28, 104863. [Google Scholar] [CrossRef]
- Xu, R.; Xiang, H.; Xia, X.; Han, X.; Li, J.; Ma, J. Opv2v: An open benchmark dataset and fusion pipeline for perception with vehicle-to-vehicle communication. In Proceedings of the 2022 International Conference on Robotics and Automation (ICRA), Philadelphia, PA, USA, 23–27 May 2022; pp. 2583–2589. [Google Scholar]
- Yang, D.; Li, L.; Redmill, K.; Özgüner, Ü. Top-view trajectories: A pedestrian dataset of vehicle-crowd interaction from controlled experiments and crowded campus. In Proceedings of the 2019 IEEE Intelligent Vehicles Symposium (IV), Paris, France, 9–12 June 2019; pp. 899–904. [Google Scholar]
- Bock, J.; Krajewski, R.; Moers, T.; Runde, S.; Vater, L.; Eckstein, L. The ind dataset: A drone dataset of naturalistic road user trajectories at german intersections. In Proceedings of the 2020 IEEE Intelligent Vehicles Symposium (IV), Las Vegas, NV, USA, 9 October–13 November 2020; pp. 1929–1934. [Google Scholar]
- Wicki, M.; Brückmann, G.; Quoss, F.; Bernauer, T. What do we really know about the acceptance of battery electric vehicles?–Turns out, not much. Transp. Rev. 2023, 43, 62–87. [Google Scholar] [CrossRef]
- Carvalho Pinheiro, H.D.; Messana, A.; Sisca, L.; Ferraris, A.; Airale, A.G.; Carello, M. Torque Vectoring in Electric Vehicles with In-wheel Motors. In IFToMM World Congress on Mechanism and Machine Science; Springer: Cham, Switzerland, 2019; pp. 3127–3136. [Google Scholar]
- Miri, I.; Fotouhi, A.; Ewin, N. Electric vehicle energy consumption modelling and estimation—A case study. Int. J. Energy Res. 2021, 45, 501–520. [Google Scholar] [CrossRef]
- Cui, H.; Ruan, J.; Wu, C.; Zhang, K.; Li, T. Advanced deep deterministic policy gradient based energy management strategy design for dual-motor four-wheel-drive electric vehicle. Mech. Mach. Theory 2023, 179, 105119. [Google Scholar] [CrossRef]
- Brand, C.; Cluzel, C.; Anable, J. Modeling the uptake of plug-in vehicles in a heterogeneous car market using a consumer segmentation approach. Transp. Res. Part A Policy Pract. 2017, 97, 121–136. [Google Scholar] [CrossRef]
- Karaaslan, E.; Zhao, Y.; Tatari, O. Comparative life cycle assessment of sport utility vehicles with different fuel options. Int. J. Life Cycle Assess. 2018, 23, 333–347. [Google Scholar] [CrossRef]
- Lutsey, N.; Nicholas, M. Update on electric vehicle costs in the United States through 2030. Int. Counc. Clean Transp. 2019, 12. Available online: https://theicct.org/wp-content/uploads/2021/06/EV_cost_2020_2030_20190401.pdf (accessed on 29 January 2023).
- Malhotra, K. Consumer Buying Behavior and Brand Choice in Sport Utility Vehicle (SUV) Segment: A Literature Review. IUP J. Brand Manag. 2022, 19, 40–52. [Google Scholar]
- Axsen, J.; Long, Z. Sport utility vehicles and willingness-to-downsize: A mixed-method exploration of functional, symbolic, and societal consumer perceptions in Canada. Energy Res. Soc. Sci. 2022, 92, 102776. [Google Scholar] [CrossRef]
- Mouli GR, C.; Kaptein, J.; Bauer, P.; Zeman, M. Implementation of dynamic charging and V2G using Chademo and CCS/Combo DC charging standard. In Proceedings of the 2016 IEEE Transportation Electrification Conference and Expo (ITEC), Dearborn, MI, USA, 27–29 June 2016; pp. 1–6. [Google Scholar]
- Kang, H.C.; Kang, K.B.; Ahn, H.K.; Lee, S.H.; Ahn, T.H.; Jwa, J.W. The smart EV charging system based on the big data analysis of the power consumption patterns. Int. J. Internet Broadcast. Commun. 2017, 9, 1–10. [Google Scholar]
- Mouli GR, C.; Schijffelen, J.; van den Heuvel, M.; Kardolus, M.; Bauer, P. A 10 kW solar-powered bidirectional EV charger compatible with chademo and COMBO. IEEE Trans. Power Electron. 2018, 34, 1082–1098. [Google Scholar] [CrossRef]
- Menon, L.M.; Nithin, S. Development of a communication simulator for Electric Vehicle charging based on GB/T. In Proceedings of the 2021 6th International Conference on Communication and Electronics Systems (ICCES), Coimbato, India, 8–10 July 2021; pp. 177–183. [Google Scholar]
- Dobrzański, D. Overview and characteristics of the EV fast charging connector systems. Masz. Elektr. Zesz. Probl. 2017, 3, 91–96. [Google Scholar]
- Biyani, N.; Righetto, R.D.; McLeod, R.; Caujolle-Bert, D.; Castano-Diez, D.; Goldie, K.N.; Stahlberg, H. Focus: The interface between data collection and data processing in cryo-EM. J. Struct. Biol. 2017, 198, 124–133. [Google Scholar] [CrossRef]
- Chu, X.; Ilyas, I.F.; Krishnan, S.; Wang, J. Data cleaning: Overview and emerging challenges. In Proceedings of the 2016 International Conference on Management of Data, San Francisco, CA, USA, 26 June 2016–1 July 2016; pp. 2201–2206. [Google Scholar]
- Prasser, F.; Kohlbacher, O.; Mansmann, U.; Bauer, B.; Kuhn, K.A. Data integration for future medicine (DIFUTURE). Methods Inf. Med. 2018, 57, e57–e65. [Google Scholar] [CrossRef] [PubMed]
- Rahimi, S.; Wood, C.M.; Teague, D.P. Performance of different transformation techniques for MASW data processing considering various site conditions, near-field effects, and modal separation. Surv. Geophys. 2021, 42, 1197–1225. [Google Scholar] [CrossRef]
- Khalid, Z.M.; Zeebaree, S.R. Big data analysis for data visualization: A review. Int. J. Sci. Bus. 2021, 5, 64–75. [Google Scholar]
- Qin, X.; Luo, Y.; Tang, N.; Li, G. Making data visualization more efficient and effective: A survey. VLDB J. 2020, 29, 93–117. [Google Scholar] [CrossRef]
- Adão, T.; Hruška, J.; Pádua, L.; Bessa, J.; Peres, E.; Morais, R.; Sousa, J.J. Hyperspectral imaging: A review on UAV-based sensors, data processing and applications for agriculture and forestry. Remote Sens. 2017, 9, 1110. [Google Scholar] [CrossRef]
- Cosentino, V.; Luis, J.; Cabot, J. Findings from GitHub: Methods, datasets and limitations. In Proceedings of the 13th International Conference on Mining Software Repositories, Austin, TX, USA, 14–22 May 2016; pp. 137–141. [Google Scholar]
- Cosentino, V.; Izquierdo, J.L.C.; Cabot, J. A systematic mapping study of software development with GitHub. IEEE Access 2017, 5, 7173–7192. [Google Scholar] [CrossRef]
- Subha, T.; Ranjana, R.; Aarthi, B.; Pavithra, S.; Srinidhi, M.S. Skill Analysis and Scouting Platform Using Machine Learning. In Proceedings of the 2022 International Conference on Communication, Computing and Internet of Things (IC3IoT), Chennai, India, 10–11 March 2022; pp. 1–6. [Google Scholar]
- Wang, Z.; Zhang, W.; Guo, Y.; Han, M.; Wan, B.; Liang, S. A multi-objective chicken swarm optimization algorithm based on dual external archive with various elites. Appl. Soft Comput. 2022, 133, 109920. [Google Scholar] [CrossRef]
- Hao, J.; Ho, T.K. Machine learning made easy: A review of scikit-learn package in python programming language. J. Educ. Behav. Stat. 2019, 44, 348–361. [Google Scholar] [CrossRef]
- Bac, J.; Mirkes, E.M.; Gorban, A.N.; Tyukin, I.; Zinovyev, A. Scikit-dimension: A python package for intrinsic dimension estimation. Entropy 2021, 23, 1368. [Google Scholar] [CrossRef]
- Sahoo, K.; Samal, A.K.; Pramanik, J.; Pani, S.K. Exploratory data analysis using Python. Int. J. Innov. Technol. Explor. Eng. (IJITEE) 2019, 8, 2019. [Google Scholar] [CrossRef]
- Verbeeck, N.; Caprioli, R.M.; Van de Plas, R. Unsupervised machine learning for exploratory data analysis in imaging mass spectrometry. Mass Spectrom. Rev. 2020, 39, 245–291. [Google Scholar] [CrossRef]
- Majumder, M.G.; Gupta, S.D.; Paul, J. Perceived usefulness of online customer reviews: A review mining approach using machine learning & exploratory data analysis. J. Bus. Res. 2022, 150, 147–164. [Google Scholar]
- Javed, U.; Ijaz, K.; Jawad, M.; Ansari, E.A.; Shabbir, N.; Kütt, L.; Husev, O. Exploratory Data Analysis Based Short-Term Electrical Load Forecasting: A Comprehensive Analysis. Energies 2021, 14, 5510. [Google Scholar] [CrossRef]
- Mukherjee, M.; Khushi, M. SMOTE-ENC: A novel SMOTE-based method to generate synthetic data for nominal and continuous features. Appl. Syst. Innov. 2021, 4, 18. [Google Scholar] [CrossRef]
- Wang, C.; Wang, Y.; Shao, M.; Qian, Y.; Chen, D. Fuzzy rough attribute reduction for categorical data. IEEE Trans. Fuzzy Syst. 2019, 28, 818–830. [Google Scholar] [CrossRef]
- Wu, L.; Huang, G.; Fan, J.; Zhang, F.; Wang, X.; Zeng, W. Potential of kernel-based nonlinear extension of Arps decline model and gradient boosting with categorical features support for predicting daily global solar radiation in humid regions. Energy Convers. Manag. 2019, 183, 280–295. [Google Scholar] [CrossRef]
- Yu, H.; Hutson, A.D. Inferential procedures based on the weighted Pearson correlation coefficient test statistic. J. Appl. Stat. 2022, 1–16. [Google Scholar] [CrossRef]
- Fraihat, H.; Almbaideen, A.A.; Al-Odienat, A.; Al-Naami, B.; De Fazio, R.; Visconti, P. Solar Radiation Forecasting by Pearson Correlation Using LSTM Neural Network and ANFIS Method: Application in the West-Central Jordan. Future Internet 2022, 14, 79. [Google Scholar] [CrossRef]
- Al-Jaafreh, T.M.; Al-Odienat, A. The Solar Energy Forecasting by Pearson Correlation using Deep Learning Techniques. WSEAS Trans. Earth Sci. Hum. Constr. 2022, 2, 158–163. [Google Scholar] [CrossRef]
- Sugianela, Y.; Ahmad, T. Pearson correlation attribute evaluation-based feature selection for intrusion detection system. In Proceedings of the 2020 International Conference on Smart Technology and Applications (ICoSTA), Surabaya, Indonesia, 20 February 2020; pp. 1–5. [Google Scholar]
- Liao, Y.; Liu, S.; Li, G.; Wang, F.; Chen, Y.; Qian, C.; Li, B. A real-time cross-modality correlation filtering method for referring expression comprehension. In Proceedings of the IEEE/CVF Conference on Computer Vision and Pattern Recognition, New Orleans, LA, USA, 19–20 June 2022; pp. 10880–10889. [Google Scholar]
- Talukdar, S.; Singha, P.; Mahato, S.; Pal, S.; Liou, Y.A.; Rahman, A. Land-use land-cover classification by machine learning classifiers for satellite observations—A review. Remote Sens. 2020, 12, 1135. [Google Scholar] [CrossRef] [Green Version]
- Sharifzadeh, M.; Sikinioti-Lock, A.; Shah, N. Machine-learning methods for integrated renewable power generation: A comparative study of artificial neural networks, support vector regression, and Gaussian Process Regression. Renew. Sustain. Energy Rev. 2019, 108, 513–538. [Google Scholar] [CrossRef]
- Mądziel, M.; Jaworski, A.; Kuszewski, H.; Woś, P.; Campisi, T.; Lew, K. The Development of CO2 Instantaneous Emission Model of Full Hybrid Vehicle with the Use of Machine Learning Techniques. Energies 2022, 15, 142. [Google Scholar] [CrossRef]
- Lv, Z.; Qiao, L.; Cai, K.; Wang, Q. Big data analysis technology for electric vehicle networks in smart cities. IEEE Trans. Intell. Transp. Syst. 2020, 22, 1807–1816. [Google Scholar] [CrossRef]
- Sadeghianpourhamami, N.; Refa, N.; Strobbe, M.; Develder, C. Quantitive analysis of electric vehicle flexibility: A data-driven approach. Int. J. Electr. Power Energy Syst. 2018, 95, 451–462. [Google Scholar] [CrossRef]
- Kim, S.; Lee, J.; Lee, C. Does Driving Range of Electric Vehicles Influence Electric Vehicle Adoption? Sustainability 2017, 9, 1783. [Google Scholar] [CrossRef]
- Van den Hoed, R.; Helmus, J.R.; De Vries, R.; Bardok, D. Data analysis on the public charge infrastructure in the city of Amsterdam. World Electr. Veh. J. 2013, 6, 829–838. [Google Scholar] [CrossRef]
- Basso, R.; Kulcsár, B.; Egardt, B.; Lindroth, P.; Sanchez-Diaz, I. Energy consumption estimation integrated into the electric vehicle routing problem. Transp. Res. Part D Transp. Environ. 2019, 69, 141–167. [Google Scholar] [CrossRef]
- Zhao, X.; Ye, Y.; Ma, J.; Shi, P.; Chen, H. Construction of electric vehicle driving cycle for studying electric vehicle energy consumption and equivalent emissions. Environ. Sci. Pollut. Res. 2020, 27, 37395–37409. [Google Scholar] [CrossRef]
Figure 1.
General structure of the work.

Figure 2.
E-vehicle energy consumption (the red line indicates the average value, dots represent each vehicle’s record).
Figure 2.
E-vehicle energy consumption (the red line indicates the average value, dots represent each vehicle’s record).

Figure 3.
Selected pie charts of analyzed parameters of electric vehicles.

Figure 4.
Flowchart for data processing in Python.

Figure 5.
Distribution of the data analyzed for the energy consumption parameter.

Figure 6.
Selected continuous feature vs. energy consumption as a target.

Figure 7.
Categorical feature vs. energy consumption as a target.

Figure 8.
Heatmap Pearson’s correlation coefficient for the analyzed parameters.

Disclaimer/Publisher’s Note: The statements, opinions and data contained in all publications are solely those of the individual author(s) and contributor(s) and not of MDPI and/or the editor(s). MDPI and/or the editor(s) disclaim responsibility for any injury to people or property resulting from any ideas, methods, instructions or products referred to in the content. |
© 2023 by the authors. Licensee MDPI, Basel, Switzerland. This article is an open access article distributed under the terms and conditions of the Creative Commons Attribution (CC BY) license (https://creativecommons.org/licenses/by/4.0/).
Share and Cite
MDPI and ACS Style
Mądziel, M.; Campisi, T. Energy Consumption of Electric Vehicles: Analysis of Selected Parameters Based on Created Database. Energies 2023, 16, 1437. https://doi.org/10.3390/en16031437
AMA Style
Mądziel M, Campisi T. Energy Consumption of Electric Vehicles: Analysis of Selected Parameters Based on Created Database. Energies. 2023; 16(3):1437. https://doi.org/10.3390/en16031437
Chicago/Turabian StyleMądziel, Maksymilian, and Tiziana Campisi. 2023. "Energy Consumption of Electric Vehicles: Analysis of Selected Parameters Based on Created Database" Energies 16, no. 3: 1437. https://doi.org/10.3390/en16031437
Note that from the first issue of 2016, this journal uses article numbers instead of page numbers. See further details here.