
The Nuclear Magnetic Flowmeter for Monitoring the Consumption and Composition of Oil and Its Complex Mixtures in Real-Time


1
Institute of Physics and Mechanics, Peter the Great St. Petersburg Polytechnic University, 195251 St. Petersburg, Russia
2
Institute of Electronics and Telecommunications, Peter the Great St. Petersburg Polytechnic University, 195251 St. Petersburg, Russia
3
All Russian Research Institute of Phytopathology, 143050 Moscow, Russia
4
Department of Photonics and Communication Lines, The Bonch-Bruevich Saint Petersburg State University of Telecommunication, 193232 St. Petersburg, Russia
*
Author to whom correspondence should be addressed.
Energies 2022, 15(9), 3259; https://doi.org/10.3390/en15093259
Submission received: 6 April 2022
/
Revised: 26 April 2022
/
Accepted: 27 April 2022
/
Published: 29 April 2022
(This article belongs to the Section H1: Petroleum Engineering)
Abstract
:The necessity of increasing the efficiency of primary oil purification in a drilling station or an offshore platform has been substantiated. We consider the problems that arise during the primary processing of oil mixtures. Important conditions for increasing the efficiency of primary purification (separation) of oil mixtures include measuring the consumption and determining the content of various impurities (water, undissolved particles) and air in them, with an error of no more than 2%. We analyzed the possibilities of using various designs of flowmeters to measure the consumption of the oil mixture coming from a well. It is also necessary to use other measuring instruments to control the state of this mixture, which creates additional problems (searching for an appropriate locations to place them, providing the required operating conditions). Various designs of nuclear magnetic flowmeters–relaxometers were considered, making it possible to measure the consumption of a liquid medium and its times of longitudinal T1 and transverse T2 relaxation with one device. The measured values of T1 and T2 determine the state of the medium. The design of the industrial nuclear magnetic flowmeter–relaxometer M-Phase 5000, which is used to control the flow and quality of oil and oil products, was considered in more detail. Problems were identified that did not allow using this design of a nuclear magnetic flowmeter–relaxometer in a drilling rig or offshore platform. A new design of a nuclear magnetic flowmeter–relaxometer was developed, implementing the methods for measuring q, T1, and T2. These methods and various technical solutions make it possible to use this device at a drilling station or offshore platform. The measurement errors of the consumption q, T1, and T2 were determined. The results of various media studies are presented and compared with q, T1, and T2 measurements on other devices and measured volume (to confirm the adequacy of q measurements). The application scopes of the developed nuclear magnetic flowmeter–relaxometer were determined, in addition to the systems of primary oil processing.
1. Introduction
Oil is currently one of the primary energy sources for the movement of various objects (vehicles, aircraft, helicopters, ships) [1,2,3,4,5]. In addition, mobile diesel power plants are often needed to solve many tasks (for example, work on the route of an oil pipeline to ensure the operation of a drilling platform) [6,7,8,9]. These and other factors make oil a strategic raw material that has a huge impact on the economy and politics in the world [9,10].
Despite the development of other energy sources [11,12,13,14,15,16], it is currently impossible to completely abandon the use of hydrocarbon fuels. The global demand for oil is growing (even a pandemic cannot stop this process). Oil reserves in easily accessible fields have significantly decreased. Many companies are forced to develop oil fields in difficult conditions (for example, in the Arctic regions or on the sea shelf using drilling platforms) [17,18,19,20,21,22,23]. In addition, the depth of the reservoir from which oil is extracted has increased, leading to cost increases of production and primary processing of oil. Fluctuations in market prices for oil has created large financial problems that affect profits (funds allocated for research and development in various sectors of the economy are reduced). Under such conditions, reducing the cost of oil production and processing becomes extremely important [24,25,26,27].
The solution to this problem includes several directions in scientific developments and the introduction of new technologies. Various groups of scientists and engineers have realized these directions.
One of these areas involves increasing the efficiency of primary oil treatment at drilling stations or platforms (its purification (separation) from water, associated gas (including oxygen), insoluble impurities, etc.).
It further determines the quality of energy sources produced from oil [5,28,29,30,31,32,33,34,35,36,37]. The oil processing process should occur in an automatic (continuous) mode. Large volumes of high-pressure water are pumped into the reservoir in deep oil production, leading to the destruction of rocks and the appearance of additional impurities. It should be noted that, during the production process, the concentration of water, associated gas, and various solid impurities in the oil flow, are constantly changing.
To ensure high efficiency in the primary separation process (cleaning) of oil, in addition to the consumption of the oil flow (or flow rate), it is necessary to obtain information on the concentration of water, associated gas, and various impurities in it [37,38,39,40,41,42,43,44,45,46,47]. This information must be fed into the control system in real-time to adjust the separator’s operation automatically. Further work on the oil preparation for its transportation through a pipeline or loading into a tanker depends on the effectiveness of the primary oil purification. If the control measurements in the oil show non-compliance with the standards, a second cleaning is performed, which requires additional funds and time. Cleaning a tanker’s dirt, water emulsions, and other impurities, is very expensive. Rapid additional separation of the oil stream when loading it into a tanker, or before pumping it into the main pipeline, may not provide the requirements for oil quality after an inefficient first treatment.
Further, the consumption of “clean” oil q and its quality are constantly monitored. Various devices have been developed [48,49,50,51,52,53,54,55,56,57,58,59,60,61,62,63,64]. The greatest preference in recent years in this area is given to the use of non-contact devices [49,51,52,53,54,55,56,57,58,60,61,62]. Therefore, electromagnetic and ultrasonic flowmeters are often used to measure oil consumption [52,53,54,55,56,57,58,60,61,62,63,64,65,66,67]. Monitoring the state of oil in the pipeline is carried out by optical instruments (for example, spectrophotometers and refractometers) [68,69,70,71,72]. Recently, nuclear magnetic flowmeters–relaxometers have been introduced into the system for monitoring the flow and condition of oil [73,74,75,76,77,78,79,80,81,82,83,84,85,86]. This device makes it possible to measure the oil consumption q and monitor its state by the measured values of the longitudinal T1 and transverse T2 relaxation times in real-time [73,77,82,84,87,88,89,90,91,92,93,94,95,96,97,98,99,100].
Some difficulties arose while using these devices to determine the oil flow parameters that enter the primary treatment from the well. Ultrasonic flowmeters cannot be used at this stage of the technological cycle due to the presence of air in the oil stream. Therefore, they were replaced by flowmeters operating on the Coriolis force. These devices also have several significant drawbacks: large dimensions and weight, the strong influence of the temperature factor and vibrations on the measurement results, the small dynamic range of measurements, the viscosity of the medium should not exceed 1500 mPa∙s, and the content of gas inclusions in the liquid should not exceed 5%. These limitations can lead to more than 5–10% or more measurement errors. In addition, to determine the presence of water, air, and impurities in oil, it is necessary to use other measuring instruments (mainly optical) [69,70,72,101,102,103]. Gradually, the use of these flowmeters will be abandoned.
These devices are being replaced by electromagnetic flowmeters. In these devices, a calibration dependence is used to determine the value of q, obtained at the enterprise manufactured device [54,55,56,57,58,104,105,106]:
where E is the potential difference arising from the interaction of moving an electrically conductive liquid with a magnetic field and B is the magnetic induction. D is the distance between the ends of the electrodes (coincides with the inner diameter of the flowmeter pipeline made of a non-magnetic material), and k is a correction factor that depends on temperature T and the composition of the liquid medium (set by the enterprise when calibrating the device).
The enterprise’s electromagnetic flowmeters are not tested on oil media coming from the well for primary treatment. Standard model solutions and “clean” oil are used. In addition, no one exactly knows how much water, gas, or various impurities will be contained in the oil from the well. Therefore, the average value k is taken (considering the type of oil). It increases the consumption measurement error by at least 1.5% when using electromagnetic flowmeters for measurements in oil flows from wells.
Various coatings are applied to the electrodes to increase the service life in electromagnetic flowmeters [105,106,107]. The use of coatings on the electrodes do not allow electromagnetic flowmeters to measure the consumption of liquid media with ionic conductivity. They can only be used to measure consumption in liquid media with electronic conductivity, such as water or hydrocarbons [104,105,106]. The appearance of impurities with ionic conductivity in the current oil flow will decrease the measured value E. Following (1), q will decrease (in reality, the pipeline’s oil flow rate or consumption does not change). The separator control system will receive false information about the value q, and the cleaning efficiency of the oil mixture will decrease.
In the presence of air or impurities with low electronic conductivity, the value E also decreases. It will decrease q as determined by (1). In reality, the oil flow rate through the pipeline does not change. The separator’s automatic system is rebuilt for a new unreliable value of q, reducing the efficiency of cleaning the oil mixture.
The appearance of water in the oil flow, whose electronic conductivity is higher than that of oil, increases the value E. In accordance with (1), q increases. The separator control system will receive unreliable information about the value q, affecting the efficiency of cleaning the oil mixture.
It is necessary to use other measuring instruments (mainly optical) to determine the presence of water, air, and various impurities in the oil flow (as in the case of using mechanical flowmeters). If there are many undissolved impurities in it, the error in determining the amount of water in this flow with an optical device can exceed 15–20%.
In addition, in the current flow, impurities and air are unevenly distributed over the cross-section of the pipeline. This increases the scattering of optical radiation and creates interference from multiple reflections, increasing the measurement error. The concentration of impurities in such a situation is not determined (the level states only their presence: high, medium, and low).
For these reasons, in most cases, separation systems during the primary purification of the oil mixture are adjusted according to the average values of q, the content of water, air, and impurities. In this case, an electromagnetic flowmeter is necessary to control pumping this mixture out of the well (control of the production process by changes in the oil consumption). For these purposes, standard models of electromagnetic flowmeters with coatings on electrodes are used to measure the consumption of “clean” oil in pipelines. Therefore, to ensure the required oil quality, it is often necessary to use a second cycle of cleaning the oil mixture.
Considering the deterioration in the quality of crude oil from wells, this situation does not suit oil companies for the reasons noted earlier. Scientists are faced with new challenges in finding solutions to this problem. Various studies (their results are presented in the text of the article) have shown that modernization of the used systems for monitoring the parameters of crude oil in the flow from the well does not allow solving it.
Of particular interest in this situation is the use of a nuclear magnetic flowmeter–relaxometer, at this stage of the technological process of oil processing [74,76,78,80,82,87,88,90,91,92,95,97,98,100,108,109,110,111,112]. In these devices, the contact of measuring elements with the current medium is completely excluded [90,91,92,95,97,98,100,108,109,110,111,112,113,114,115,116,117,118,119,120,121,122,123,124]. At present, only one industrial design of a nuclear magnetic flowmeter-relaxometer M-Phase 5000 has been developed (Krohne company, Duisburg, Germany) [88,108,125,126] and many laboratory prototypes of these devices [73,74,75,76,77,78,82,88,95,97,98,100,109,110,111,112,114,115,117,118,119,120,121,122,123] for measuring oil consumption, hydrocarbons, water, and acids, as well as controlling their conditions.
In these designs, to measure the q and the longitudinal T1 and transverse T2 relaxation times, the pulse technique is mainly used (T1 and T2 are determined from the decay of the free induction signal, and the value of q is determined from the attenuation of the NMR signal amplitude over time). In several NMR flowmeter models for measurement q, calibration dependencies are used (for example, the amplitude change dependence of the NMR signal from the change of q).
In the industrial flowmeter, M-Phase 5000 for measurements are used pulse techniques; the measurement range of q is from 2 to 20 m3/h when the temperature of “clean” oil changes from 293 to 308 K [88,108,125,126] at pipeline diameters of 100–200 mm. The measurement error in determining q is about 2%. The error in measuring the times of longitudinal T1 and transverse T2 relaxation is about 1.5% (the state of the current medium is determined from their values). For the main pipeline diameter of 200 mm, the range of the measured oil flow rate by a nuclear magnetic flowmeter–relaxometer ranges from 5 to 110 mm/s.
In pipelines for primary treatment, the oil mixture flows at 100 to 800 mm/s. The pipeline diameter varies from 50 to 100 mm. Analyzing these parameters, we can conclude that the M-Phase 5000 industrial nuclear magnetic flowmeter–relaxometer can be effectively used at this stage of the oil refining process cycle. A more detailed analysis shows several problems that will arise when using this device. They are associated with using a pulse technique for measuring the consumption of a liquid flowing medium and its relaxation times T1 and T2. For these measurements, we use the dependence constructed from the amplitude peaks during the decay of the NMR signal after exposure to a magnetized liquid of a π/2 pulse and a sequence of 7 π-pulses. It is necessary to provide a signal-to-noise ratio (S/N) greater than 3.0 in the registered NMR signal to perform measurements with an error of less than 2%. The current medium must be in the polarizing magnet (pre-polarization region [88,108,125,126]) for a time tp to do this, which is determined by the following relationship [91,92,93,94,95,96,97,98,99,100,124,127,128,129,130]:
If the liquid medium is in the polarizer magnet for a time less than tp = Vp/q (Vp is the volume of the polarizer), then this leads to its incomplete magnetization [91,92,93,94,95,96,97,98,99,100,124,127,128,129,130]. The amplitude of the registered NMR signal decreases. The S/N ratio decreases. If the S/N ratio becomes less than 3.0, it is impossible to measure the q, T1, and T2 values with a measurement error of no more than 2.0% [74,76,78,80,82,87,88,90,91,92,95,97,98,100,108,109,110,111,112,114,115,117,118,119,120,121,122,123]. The measurement error of these quantities will increase to 3% or more.
In addition, a certain time interval must be provided between the pulses (π/2 and π) in the radiofrequency coils. Moreover, the interval between the moments of registration of the NMR signal in the receiving coils after each impact on the magnetization of the flowing liquid by a π-pulse should be provided. It is necessary to determine T2 from the decay of the free induction signal. The magnetized liquid must be in the field of the magnet of the NMR signal detection system for a time greater than 3T2 to do this. In addition, in this magnetic system, it is necessary to measure the values of q and T1 from the decrease in magnetization due to relaxation processes (that requires additional time comparable to the T1 value). The residence time of the current liquid in the magnet of the registration system tr must be greater than 3T2 + T1. It requires a significant length of the straight section of the pipeline in the flowmeter.
Such requirements lead to the fact that the length of the M-Phase 5000 nuclear magnetic flowmeter–relaxometer is more than 3.6 m, and the device’s weight exceeds 1150 kg. In the conditions of a drilling rig or an offshore platform, it will be difficult to place a device with such dimensions and weight.
In this technological cycle of cleaning the oil mixture, pipelines of a smaller diameter are used in oil transportation systems (the flow rate of the liquid mixture is four times higher). In this case, the times tp and tr must be quadrupled to ensure the process of measuring q and relaxation times with an error of less than 2%. In this case, the length of the device will increase to 15 m (weight can increase up to 4000 kg). These parameters need to be further increased by at least 20% since T1 and T2 for the oil mixture from the well are longer than for “clean” oil (therefore, tp and tr will change). It would be unrealistic to use a device with such dimensions and weight at a drilling station or offshore platform since there are severe restrictions on the placement space and weight of the measuring equipment.
Assume that we use two transitional connections with a length of more than 500 mm (for the transition from a pipeline with a diameter of 100 mm to a pipeline with 200 mm before the flowmeter and back after). Then, when measuring the parameters of the oil mixture, it will only be necessary to make changes to the design of the nuclear magnetic flowmeter–relaxometer M-Phase 5000 related to an increase in T1 and T2. The flow rate of the oil mixture from the well through the pipeline υm in the nuclear magnetic flowmeter–relaxometer M-Phase 5000 will be the same as when measuring the parameters of “clean” oil (the diameter of the pipeline was changed from 100 to 200 mm with transitional connections, the value of υm decreased by four times). In this case, the length of the instrument’s measuring structure will increase to 5.4 m (with weight up to 1450 kg). Difficulties with placing such a device on a drilling rig or an offshore platform will increase. In principle, they probably could have been solved if there was no other problem.
It is necessary to provide currents of the order of 10 A in the radio frequency coil at voltages of several kilovolts (pulse duration of 0.001 s is considered at a fill rate of 10 MHz) to form a forced precession of magnetic moments in a magnetized liquid using a π/2 pulse and a sequence of seven π-pulses for large pipeline diameters (for example, 200 mm). In the case of an increase in the duration of the pulses, it will be necessary to increase the size and dimensions of the nuclear magnetic flowmeter–relaxometer. On a drilling rig or an oil platform, the device is operated in conditions of high humidity (rain, snow, sea breeze). Working with such voltages and currents under these conditions will greatly endanger people. Possible measures to protect the device from humidity raise serious doubts about its practical effectiveness and feasibility. For these reasons, a nuclear magnetic flowmeter–relaxometer based on the M-Phase 5000 model is not currently used at this stage of the oil mixture purification process.
Therefore, developing new models of nuclear magnetic flowmeters–relaxometers to solve this complex problem and control the consumption and the state of “clean” oil and hydrocarbons with higher accuracy than other devices is critical. In our work, one of the possible solutions is presented.
2. The Design of a Nuclear Magnetic Flowmeter–Relaxometer for Monitoring the Parameters of the Flowing Medium
Determining the consumption (or flow rate) of flowing fluid in a pipeline and measuring relaxation times T1 and T2 have been considered in many works, since 1946. The first experiments using NMR for research on flowing liquid were conducted by Suryan [131], who found that the nuclear absorption signal changed in proportion to liquid velocity. The first industrial design of the NMR flowmeter was developed by Vander et al. [132] in the late 1960s. This design had very limited industrial applications. Further, in scientific publications and monographs, descriptions of various NMR spectrometers, flowmeters, and relaxometers appeared for studying and measuring the parameters of a flowing liquid [74,76,78,80,82,87,88,90,91,92,95,97,98,100,108,109,110,111,112,114,115,117,118,119,120,121,122,123]. Many of these works have greatly contributed to the development of the theory and technology of NMR in a flowing liquid, allowing scientists and engineers from the Krohne company to manufacture a multifunctional industrial NMR flowmeter–relaxometer [88,108,125,126]. Considering the results of various studies [74,76,78,80,82,87,88,90,91,92,95,97,98,100,108,109,110,111,112,114,115,117,118,119,120,121,122,123,124,125,126,127,128,129,130,131,132], as well as data on the operation industrial NMR flowmeter–relaxometer M-Phase 5000 (Krohne company), we developed the design of a laboratory prototype of a nuclear magnetic flowmeter–relaxometer. The block diagram of the developed design is shown in Figure 1.
The liquid flowing through the pipeline enters the magnetic system (magnet polarizer 1). This magnet creates a strong field between the poles with an induction Bp ≈ 1.532 T (inhomogeneity 0.02 cm−1). The section of the pipeline (polarizing vessel 2), which is located between the poles of the magnet 1, is made in the form of a spiral (this is necessary so that the liquid medium is under the action of the Bp field for more time). The volume of the polarizer vessel Vp is increased to ensure the fulfillment of condition from formula (2). Further, the magnetized liquid enters the nutation coil 4 through the connecting section of the pipeline with a diameter of 100 mm. In the nutation coil, under the influence of a resonant variable radio field H1, the orientation of the nuclear moment magnetization vector Mp changes. The complete inversion of the magnetization Mp—the rotation of the vector by the angle φn = 180° occurs relative to the direction of the constant magnetic field at the resonant frequency fn of the radio field H1. The frequency fn is related to the magnetic field B0 in which the nutation coil 4 is located, as follows:
where γ is the gyromagnetic ratio of the nuclei.
The maximum S/N ratio of the recorded NMR signal from a liquid with magnetization inversion in the recording circuit 12 corresponds to a certain radio field amplitude H1 in the nutation coil 4 with a frequency fn following (3). The automatic gain control (AGC) circuit located in the processing and control device 14 adjusts the amplitude of the H1 field in the nutation coil 4 to the maximum S/N ratio. The processing and control device 14 also houses an automatic frequency control (AFC) circuit that adjusts the frequency fn of the nutation generator 16 to the maximum S/N ratio. After the liquid passes through the measuring section of pipeline 7, the magnetization value is recorded by coil 9, which is in the field Ba of the analyzer magnet 8 (Ba = 0.456 T, inhomogeneity 0.0005 cm−1, da = 218 mm), connected to a high-frequency generator of weak oscillations (autodyne), which is part of the recording circuit 12. A modulation technique is used to record the NMR signal [87,94,95,96,97,114,115,133]. This technique makes it possible to reduce the time tr of the flowing liquid in the magnet analyzer 8, which is necessary for measuring q, T1, and T2, to a value of 2.5 T2. The vessel analyzer 10 is made in the form of a cylinder with a diameter of 200 mm in the area of the coil 9 to improve the S/N ratio. In addition, a two-fold increase in the diameter of the pipeline makes it possible to reduce the flow rate of the liquid in the registration coil 9 by four times. This makes it possible to reduce the linear dimensions (the length of the poles) of the analyzer magnet 8.
In the device developed by us, the NMR signal is recorded from all protons of crude oil that are in the volume of the registration coil 9. Since an autodyne detector (integrated device) is used to register the NMR signal, the distribution of protons over the volume of the registration coil 9 does not play any role (the total sum is taken from all magnetic moments from all protons). Optical radiation or light is not used in the instrument for measurements. The presence of impurities and air in crude oil is determined by the values of the relaxation times and the change in the amplitude of the registered NMR signal. It is one of the main advantages of the device developed by us compared to the use of a measuring complex of an electromagnetic flow meter and an optical analyzer to control the parameters of the flow of crude oil from a well. Mixing and heterogeneity of impurities and air in the crude oil stream can be anything (the signal-to-noise ratio of the registered NMR signal must be greater than 3).
3. The Results of Experimental Investigations and the Measuring Principle of the Consumption and the Relaxation Times T1 and T2 in Flowing Liquid
The conducted studies of the motion of the magnetization vector Mz in the nutation coil 4 made it possible to obtain, in the device design developed by us, the shape of the NMR signal from the flowing medium necessary for measuring q, T1, and T2. Figure 2 and Figure 3 show, as an example, the registered NMR signals from the feedwater (water that has been specially prepared for use in the second loop of a nuclear reactor) at 299.3 K.
Feedwater was chosen for experiments as a liquid medium because its relaxation times T1 and T2 are very close to the values of the relaxation times of oil mixtures coming from their wells (for example, mixtures in oil fields near the cities of Ukhta and Novy Urengoy (Russian Federation)). In these regions, mining is carried out in very difficult climatic conditions. The NMR waveform in Figure 2 corresponds to the rotation angle of the magnetization vector φn = 0°, and φn = 180° in Figure 3 (NMR signal with magnetization inversion in flowing liquid).
If φn = 90° = 270°, the components of the magnetization vector Mz = Mx = My = 0; therefore, Us = 0 in the registration scheme. An analysis of the obtained results shows that the recorded NMR signal (Figure 3 and Figure 4) has a high resolution (more than five damped peaks—“wiggles”). This makes it possible to measure T1 and T2 with an error of no more than 1% using the following methods. The dependence of the decay of the free induction signal is used to determine the value of T2 [133,134]. A curve is drawn along the maxima of the peaks of the recorded NMR signal from the feedwater (Figure 4-graph 1).
This curve can be approximated by the following function [80,81]:
where a is the rate of change in the detuning of the magnetic field, T2* is the effective time of transverse relaxation, U0 is the maximum value of the amplitude of the registered NMR signal.
The T2 value of the flowing medium, in this case, is determined using the following formula [133,134]:
where ΔBa is the inhomogeneity of the magnetic field in the area where the NMR signal registration coil is located.
In the case of small values of ΔBa, the contribution of this term to (6) in determining the value of T2 is small and T2 ≈ T2*. The transverse relaxation time can be immediately determined using the registered NMR signal. With an increase in the inhomogeneity of the magnetic field ΔBa, the number of peaks in the registered NMR signal (Figure 4) decreases. The error in determining T2* increases. Therefore, it is not always advisable to use our NMR flowmeter–relaxometer design for large pipeline diameters (only in the case of low liquid flow rates, when it is possible to reduce the pipeline diameter in the NMR signal registration zone).
To measure the value of T1 in the design of the NMR flowmeter–relaxometer, we use the method developed by us using two modulation modes of the field Ba [114,115]. This method is successfully used in NMR devices (developed by the authors of this article) for express control of the state of condensed media [87,135,136]. T1 and T2 measurements are carried out simultaneously using the same registered NMR signal.
The following technique is implemented to determine the value q in the developed design of the device. The moments of flowing liquid arrival with and without inversion of magnetization (Figure 2 and Figure 3) to the registration coil 9 are recorded. For example, after the flow with the inversion of magnetization enters the registration coil 9, the control and processing unit 14 generates a pulse. This pulse opens one of the switches of system 15. The nutation coil 4 stops receiving the sinusoidal voltage from generator 16, and the magnetization inversion does not occur in it.
Further, the flowing liquid without magnetization inversion enters after some time into the registration coil 9. The NMR signal is registered (Figure 2), and a rectangular pulse is generated, which closes one of the switches 15. A sinusoidal voltage is supplied to the nutation coil 4 from generator 16, and the magnetization inversion is formed, etc. In this case, information about q is represented as a rectangular pulse, the duration τn of which is equal to the time of the liquid medium flow from the nutation coil 4 to the registration coil 9 (Figure 1). The value q, in this case, is determined from the following relationship:
where Vc is the volume of the connecting section of the pipeline 7 between the nutation coil 3 and the registration coil 10.
The error Δq in determining the consumption in the developed design will be determined by the stability of the comparator’s operation levels in the control circuit (this error is less than 0.5%). Moreover, by the error in determining the volume Vc (for all permissible errors in measuring the inner diameter of the pipeline and the distance between coils 3 and 10, this error will be less than 0.3%. This error will increase to 0.5%, considering the degradation of the pipeline during the operation of the device.
Using the developed NMR flowmeter–relaxometer to control an oil mixture containing gas, water, and insoluble impurities, problems may arise with determining the trigger level of the comparator in the registered NMR signal from the flowing medium with magnetization inversion. This is because the amplitude of the registered NMR signal from a flowing liquid with magnetization inversion is smaller in absolute value than the amplitude of the registered NMR signal from a flowing liquid without magnetization inversion (Figure 2 and Figure 3). The magnetization inversion in the flowing fluid is formed in the nutation coil 4. This process depends on the value of q and the presence of water, gas, and various impurities in the flowing medium. All these parameters can change rapidly in the flow of the oil mixture from the well. The trigger level of the comparator will constantly change. At some point, for example, when the q changes rapidly, a situation may arise when the magnetization inversion is not realized (the AFC and AGC systems will not have time to build the frequency fn and the field H1 to obtain it). In coil 9, a classical NMR signal is recorded for the case of using the modulation technique (Figure 3). Consumption measurement will be terminated, automatic control in the device will not be able to restore the q measurement without turning it off. The control of the technological process of cleaning the oil mixture will be violated. To exclude this case in this device design, we used an additional modulation of the field B0, in which the magnetization inversion was formed in the flowing liquid. Radio frequency coil 5 was placed between the poles of permanent magnet 6 to do this. The experiments performed showed that by changing the frequency fm and the amplitude Bm of the modulation field, it is possible to obtain registration of an NMR signal from a flowing liquid with magnetization inversion at the noise level (Figure 5) in a wide range of values q.
In this case, the trigger level of the comparators can be set by half the amplitude of the recorded NMR signal Us from the flowing liquid without magnetization inversion. This level is easily determined and is the same for the two considered cases of triggering the comparators. In such a situation, information about the consumption of the current medium q is represented as a rectangular pulse (meander), the period of which Tn is equal to twice the time τn. The q value is calculated using the following formula:
In Figure 6, as an example, the process of measuring q of feed water in a pipeline is shown.
In fact, the device implements a frequency measurement of the q value since the meander period is measured. In this case, the error of the trigger levels of the comparators becomes irrelevant. A delay error appears, which is associated with an uneven distribution of gas or impurities in the oil mixture, in which there are no magnetic moments. As a result, in the recording coil 9 at different times, NMR signals are recorded that differ from each other in amplitude. This can introduce an additional error of no more than 0.3% into the measurements of q.
It is also necessary to note one of the advantages in the NMR flowmeter–relaxometer developed by us in comparison with other flowmeters, for example, electromagnetic. In the developed design of the flowmeter, the consumption q is directly measured using (1) in real-time (τn is measured with high accuracy since this is the duration of the meander). Graduation, in this case, is not required for the flowmeter. After manufacturing, the device must be checked or calibrated to determine the validity of the q measurement results. It is not necessary to calibrate the device before installation on the pipeline. The value of volume Vc of the pipeline section is included in the unit design of the device and does not change during the transportation of the device. Verifying the device during operation for a long time is not required since the value of Vc (straight section of the pipeline) changes insignificantly. Processes of contamination of the pipeline walls are slow (fast liquid flow and straight pipe). The measurement error changes insignificantly.
To verify the reliability of the developed methods for measuring q, we compared the results of measuring the consumption of a liquid mixture made from feedwater with air bubbles and insoluble particles (with ionic conductivity (polymer) and electronic conductivity (bitumen)) using a device developed by us with the results of flow measurements performed by using electromagnetic flowmeter OPTIFLUX 4030 (KROHNE, Germany).
This device is designed to measure oil flow in various situations. The measurement error of the OPTIFLUX 4030 at the initial stage of its operation for pure liquids is ±0.3%. During the operation of the device, as well as in the case of contamination of the flowing liquid with various impurities, the measurement error increases. For the liquid mixture we used, when checking the reliability of the developed NMR flowmeter–relaxometer, the error in measuring Δq of the OPTIFLUX 4030 electromagnetic flowmeter was less than 1.0%.
Additionally, a measured volume was used to control the consumption q of the manufactured liquid mixture. Ten measurements of the volumetric consumption of the liquid mixture were performed over 10 s. The average consumption value and measurement error were calculated (then these data were converted to m3/h). The results of comparing the results for both devices and the measuring volume are presented in Table 1.
Measurements at consumption values of more than 23.07 m3/h were not carried out because the circulation pump reached its maximum power on the experimental bench under difficult operating conditions (liquid mixture with air and impurities).
Using the NMR flowmeter–relaxometer design developed by us, we measured the relaxation times T1 and T2 of a liquid mixture of feedwater with air bubbles and insoluble particles (with ionic conductivity (polymer) and electronic conductivity (bitumen)) for various temperatures T. We compared them with the results of measurements on an industrial NMR relaxometer Minispec mq 20M (BRUKER, Rheinstetten, Germany). A comparison of the obtained results is presented in Table 2.
In various fields, the temperatures of oil mixtures that come from wells for primary processing differ by several tens of degrees (this depends on the production method and other factors). Therefore, in our work, we tried to measure T1 and T2 at the highest temperature that could be obtained on an experimental bench for pumping liquid media. The capabilities of our stand were limited by a temperature of 351.1 K. Therefore, the measurements of T1 and T2 were carried out up to a temperature of 349.5 K.
It should be noted that, in the developed device, the process of measuring q, T1, and T2 does not depend on the turbidity and viscosity of the medium, which makes it possible to measure various grades of “clean” oil in pipelines of small diameters (up to 150 mm) or at their low flow rate. Figure 7 shows, as an example, an NMR signal recorded from heavy grades of TAT Oil [5,113,116].
4. Discussion
An analysis of the results obtained in Figure 5 and Figure 6 showed that the amplitude Us of the registered NMR signal will be at the noise level in a wide range of changes in the q value of the current mixture (of the order of ±q/2, provided that the frequency fn and field H1 are initially adjusted when measuring q to the center nutation lines). With this setting, the q measurement mode in the flowmeter will be violated only in a few cases. For example, if an emergency occurred (the oil mixture stopped flowing into the pipeline). In another situation—the pressure in the wellbore increased sharply, and the flow rate of the mixture increased sharply. The developed NMR flowmeter–relaxometer at some point in time will give information about a sharp increase in the q value of the oil mixture and stop measurements if it exceeds 3q/2.
An important parameter, in this case, is the rate of change dq/dt. For the device we developed, it was found that if dq/dt is greater than q/4 per second (when the consumption changes by more than q/2), the AFC and AGC systems will not have time to adjust the parameters of sinusoidal oscillations on nutation coil 4 and modulation 5 (Figure 1) under the conditions for generating an NMR signal with magnetization inversion (there will be no rectangular pulse at the output of the control and processing unit 14).
It should be noted that such a sharp change in the value of q during oil production is also considered an emergency, for the elimination of which there are special means and measures. The operation of the oil mixture purification system, in this case, is stopped.
The studies carried out made it possible to establish that a change in the temperature T of the flowing mixture within 20–25 K has an insignificant effect on the amplitude Us of the registered NMR signal. In these cases, the value of Us will also be at the noise level. The error in measuring consumption of the oil mixture Δq will not change.
The declared error in measuring the flow rate Δq of the oil mixture is confirmed by the data presented in Table 1. We used an industrial electromagnetic flowmeter with a measurement error no higher than the device we developed to compare the measurement results. The results of measuring q by the two instruments coincided with the limits of the measurement error. The electromagnetic flowmeter measured a lower value of q (accordingly, the flow rate was less than the real one) since air and impurities were in the liquid medium. The results of measuring q of the liquid mixture using the measured volume confirmed that the two instruments used make reliable measurements of q. For a measured volume, q is greater than that for an electromagnetic flowmeter (as the air escapes into the atmosphere, while impurities remain in the liquid medium).
An analysis of the results of measurements of the relaxation times T1 and T2, presented in Table 2, shows that they coincide with the measurement error. The error in measuring T1 and T2 in an industrial NMR Minispec mq 20M relaxometer is less than 0.3% for such mixtures. This is several times less than in the NMR flowmeter–relaxometer developed by us. This fact once again confirms the validity of the use of the methods proposed by us for measuring the values of T1 and T2 in the developed design of the NMR flowmeter–relaxometer.
It should be noted that the measurement error of q, T1, and T2 depends on the value of S/N, which depends on the number of protons per unit volume in the oil mixture and the relaxation times themselves. More impurities and air in the mixture—fewer protons. The S/N ratio decreases. In case of values S/N = 3 and below, the device developed by us will work, but the measurement error of q, T1, and T2 will increase. By registering the change in the amplitude of the NMR signal and measuring the values of the relaxation times of T1 and T2, it is possible to establish the appearance of an additional amount of water, air, and impurities in the oil mixture.
Any appearance of salt in crude oil leads to a decrease in the values of T1 and T2. Pure oil has the highest values of T1 and T2. In the device, all magnetization processes for the current flow, and also the registration of NMR signal are set to the maximum values of T1 and T2. Therefore, a decrease in the values of T1 and T2, for this reason, which is often found in oil production, will not have a significant effect on the process and the measurement errors of q, T1, and T2.
In the device’s developed design, to measure T1, T2, and q of the oil mixture, it is necessary that its investigated segment is in the registration coil 9 of the order 2.5 T2. At a maximum flow rate of the oil mixture in the NMR signal detection system of about 200 mm/s, the length of the magnetic system for recording the NMR signal with coil 9 (its length is about 60 cm) is no more than 90 cm. The total length of the design of the NMR flowmeter–relaxometer we developed is about 189 cm. This is almost two times less than the industrial nuclear magnetic flowmeter–relaxometer M-Phase 5000.
5. Conclusions
The data obtained show the reliability of the design of the NMR flowmeter–relaxometer developed by us for monitoring the flow and state (by the measured values of T1 and T2 and the amplitude of the recorded NMR signal) of the current flow of the oil mixture.
The research results and their analyses with comparisons with other types of flowmeters (including nuclear magnetic ones, including industrial NMR flowmeter–relaxometer) confirm the promising nature of the device design that we developed. This is because the device’s developed design can be used without changing it to control the flow and quality of oil, for example, when it is loaded into a tanker or injected into the main pipeline. The instrument can monitor the flow and quality of refined petroleum products (e.g., gasoline, diesel fuel, engine oil) and hazardous chemicals (e.g., acids and alkalis). In principle, the flowmeter–relaxometer developed by NMR can be used to control the flow rate and the state of any liquid medium containing protons. However, this is not always economically feasible. It should be noted that almost 99% of liquid media contain protons.
Unlike the M-Phase 5000 industrial NMR flowmeter–relaxometer, which is used after separation to control the oil flow parameters, the device developed by us has several advantages. Its dimensions and weight will be at least several times less than that of the modernized design of the M-Phase 5000 NMR flowmeter–relaxometer for parameter control of the oil mixture from the well. In the NMR flowmeter–relaxometer developed by us, the maximum usable voltage is 220 V (standard power supply). The working currents do not exceed 2 A. These are typical voltages and currents for measuring equipment on an offshore oil platform and drilling rig, for which moisture protection measures are successfully applied. It should also be noted that in the industrial NMR flowmeter M-Phase 5000, the measuring error of the consumption q is about 2%. The error in measuring the times of longitudinal T1 and transverse T2 relaxation is about 1.5% (using these values determined the flowing oil state). This estimate is for pure oil measurements. For a crude oil mixture from a well, measurement errors of this device will be higher. In the NMR flowmeter–relaxometer developed by us, the error in measuring the q, T1, T2 for a model solution of an oil mixture is about 1.5%. For pure oil, it does not exceed 1%.
According to various estimates by experts, the cost of secondary purification (separation) of oil at a drilling station or offshore platform ranges from USD 0.4 to 1.00 per barrel. In addition, additional time is spent on this process, which is very difficult to evaluate in financial terms. The use of the device developed by us allows us to reduce these costs.
Author Contributions
Conceptualization, R.D. and V.D. (Vadim Davydov); methodology, V.D. (Vadim Davydov); software, R.D.; validation, V.D. (Vadim Davydov) and R.D.; formal analysis, V.D. (Valentin Dudkin); investigation, R.D.; resources, V.D. (Valentin Dudkin); data curation, R.D.; writing—original draft preparation, V.D. (Vadim Davydov); writing—review and editing, R.D.; visualization, R.D.; supervision, V.D. (Valentin Dudkin); project administration, V.D. (Vadim Davydov); funding acquisition, V.D. (Vadim Davydov). All authors have read and agreed to the published version of the manuscript.
Funding
The research is partially funded by the Ministry of Science and Higher Education of the Russian Federation under the strategic academic leadership program ‘Priority 2030’ (agreement 075-15-2021-1333 dated 30 September 2021).
Institutional Review Board Statement
Not applicable.
Informed Consent Statement
Not applicable.
Conflicts of Interest
The authors declare no conflict of interest.
Abbreviations
| NMR | nuclear magnetic resonance |
| N/S | ratio of signal-to-noise |
| T1 | longitudinal relaxation time |
| T2 | transverse relaxation time |
| q | consumption |
| E | potential difference |
| Bp | polarizer magnet field induction |
| Vp | polarizer vessel volume |
| Mp | magnetization of flowing liquid |
| fn | resonant frequency of the radio field (nutation frequency) |
| φn | rotation angle of magnetization vector |
| B0 | constant magnetic field induction in the area of nutation coil |
| Ba | analyzer magnet field induction |
| Us | amplitude of registered NMR signal |
| a | detuning change rate of magnetic field |
| effective transverse relaxation time | |
| Vc | volume of connective pipeline part |
| Δq | consumption measurement error |
| fm | modulation field frequency |
| Bm | induction value (amplitude) of modulation field |
References
- Liu, Q.; Zhao, Z.; Liu, Y.; He, Y. Natural resources commodity prices volatility, economic performance and environment: Evaluating the role of oil rents. Resour. Policy 2022, 76, 102548. [Google Scholar] [CrossRef]
- Cengiz, E.; Babagiray, M.; Aysal, F.E.; Aksoy, F. Kinematic viscosity estimation of fuel oil with comparison of machine learning methods. Fuel 2022, 316, 123422. [Google Scholar] [CrossRef]
- Xu, Y.; Lun, Z.; Pan, Z.; Wang, H.; Zhou, X.; Zhao, C.; Zhang, D. Occurrence space and state of shale oil: A review. J. Pet. Sci. Eng. 2022, 211, 110183. [Google Scholar] [CrossRef]
- Chen, Z.; Wang, L.; Wei, Z.; Wang, Y.; Deng, J. Effect of components on the emulsification characteristic of glucose solution emulsified heavy fuel oil. Energy 2022, 244, 123147. [Google Scholar] [CrossRef]
- Gizatullin, B.; Gafurov, M.; Murzakhanov, F.; Vakhin, A.; Mattea, C.; Stapf, S. Molecular Dynamics and Proton Hyperpolarization via Synthetic and Crude Oil Porphyrin Complexes in Solid and Solution States. Langmuir 2021, 37, 6783–6791. [Google Scholar] [CrossRef]
- De Robbio, R.; Cameretti, M.C.; Mancaruso, E. Investigation by modelling of a plug-in hybrid electric commercial vehicle with diesel engine on WLTC. Fuel 2022, 317, 123519. [Google Scholar] [CrossRef]
- Luján, J.M.; García, A.; Monsalve-Serrano, J.; Martínez-Boggio, S. Effectiveness of hybrid powertrains to reduce the fuel consumption and NOx emissions of a Euro 6d-temp diesel engine under real-life driving conditions. Energy Convers. Manag. 2019, 199, 111987. [Google Scholar] [CrossRef]
- Brenna, M.; Dolara, A.; Foiadelli, F.; Leva, S.; Longo, M. Sustainable solutions for internal mobility in spread university campuses. WSEAS Trans. Environ. Dev. 2018, 14, 464–473. [Google Scholar]
- Nourelfath, M.; Lababidi, H.M.S.; Aldowaisan, T. Socio-economic impacts of strategic oil and gas megaprojects: A case study in Kuwait. Int. J. Prod. Econ. 2022, 246, 108416. [Google Scholar] [CrossRef]
- Faksness, L.-G.; Leirvik, F.; Taban, I.C.; Engen, F.; Vensen, H.V.; Holbu, J.W.; Dolva, H.; Bråtveit, M. Offshore field experiments with in-situ burning of oil: Emissions and burn efficiency. Environ. Res. 2022, 205, 112419. [Google Scholar] [CrossRef]
- Treshcheva, M.; Anikina, I.; Sergeev, V.; Skulkin, S.; Treshchev, D. Selection of Heat Pump Capacity Used at Thermal Power Plants under Electricity Market Operating Conditions. Energies 2021, 14, 226. [Google Scholar] [CrossRef]
- Chen, Y.; Zhang, Y.; Wang, J.; Lu, Z. Optimal Operation for Integrated Electricity–Heat System with Improved Heat Pump and Storage Model to Enhance Local Energy Utilization. Energies 2020, 13, 6729. [Google Scholar] [CrossRef]
- Alekseev, P.N.; Gagarinskii, A.Y.; Kalugin, M.A.; Fomichenko, P.A.; Asmolov, V.G. On a Strategy for the Development of Nuclear Power in Russia. Atomic Energy 2019, 126, 207–212. [Google Scholar] [CrossRef]
- Bobyl, A.; Malyshkin, V.; Dolzhenko, V.; Grabovets, A.; Chernoivanov, V. Scientific activity in the problems of technical and economic modeling of solar stations. An example of unstable climatic conditions. IOP Conf. Ser. Mater. Sci. Eng. 2019, 390, 012047. [Google Scholar] [CrossRef]
- Sergeev, V.; Anikina, I.; Kalmykov, K. Using Heat Pumps to Improve the Efficiency of Combined-Cycle Gas Turbines. Energies 2021, 14, 2685. [Google Scholar] [CrossRef]
- Temiz, M.; Dincer, I. Development of an HTR-Type nuclear and bifacial PV solar based integrated system to meet the needs of energy, food and fuel for sustainable indigenous cities. Sustain. Cities Soc. 2021, 74, 103198. [Google Scholar] [CrossRef]
- Marchenko, I. Features of geotechnical surveys and leg penetration analysis for drilling platforms in the Arctic seas. IOP Conf. Ser. Mater. Sci. Eng. 2019, 700, 012047. [Google Scholar] [CrossRef]
- Alekseeva, M.N.; Svarovskaya, L.I.; Yashchenko, I.G. Risks of pollution of Arctic territories by oil and oil products. AIP Conf. Proc. 2019, 2167, 02000. [Google Scholar] [CrossRef]
- Oliveira-Pinto, S.; Rosa-Santos, P.; Taveira-Pinto, F. Electricity supply to offshore oil and gas platforms from renewable ocean wave energy: Overview and case study analysis. Energy Convers. Manag. 2019, 186, 556–569. [Google Scholar] [CrossRef]
- Pye, M. The discovery and development of the Brae Area Fields, U.K. South Viking Graben. AAPG Mem. 2018, 115, 155–161. [Google Scholar] [CrossRef]
- Jones, D.W.; Van Bergen, P. Reservoir geology of the upper jurassic brae sandstone member, kingfisher field, South Viking Graben, U.K. North Sea. AAPG Mem. 2018, 115, 283–305. [Google Scholar] [CrossRef]
- Krueger, S.; Sharpe, R.; Attridge, W.; Ruszka, J. Introduction of new drilling technology provides continuous high build rate capability in complex corkscrew well trajectory, accessing unswept reserves in the north sea. In Proceedings of the SPE/IADC Drilling Conference and Exhibition, Hague, The Netherlands, 14–16 March 2017. [Google Scholar] [CrossRef]
- Pascal, C. Heat flow of Norway and its continental shelf. Mar. Pet. Geol. 2015, 66, 956–969. [Google Scholar] [CrossRef]
- Da Silva, G.N.; Rochedo, P.R.R.; Szklo, A. Renewable hydrogen production to deal with wind power surpluses and mitigate carbon dioxide emissions from oil refineries. Appl. Energy 2022, 311, 118631. [Google Scholar] [CrossRef]
- Iqbal, K.; Jiang, W.; Ma, R.; Deng, C. Synthesis of large-scale total water network with multiple water resources under seasonal flow rate constraints. J. Clean. Prod. 2022, 337, 130462. [Google Scholar] [CrossRef]
- Zhang, S.; Lei, Q.; Wu, L.; Wang, Y.; Zheng, L.; Chen, X. Supply chain design and integration for the Co-Processing of bio-oil and vacuum gas oil in a refinery. Energy 2022, 241, 122912. [Google Scholar] [CrossRef]
- Batlle, E.A.O.; Palacio, J.C.E.; Lora, E.E.S.; Bortoni, E.D.C.; Nogueira, L.A.H.; Caballero, G.E.C.; Julio, A.A.V.; Escorcia, Y.C. Energy, economic, and environmental assessment of the integrated production of palm oil biodiesel and sugarcane ethanol. J. Clean. Prod. 2021, 311, 127638. [Google Scholar] [CrossRef]
- De Paulo, E.H.; dos Santos, F.D.; Folli, G.S.; Santos, L.P.; Nascimento, M.H.C.; Moro, M.K.; da Cunha, P.H.P.; Castro, E.V.R.; Cunha Neto, A.; Filgueiras, P.R. Determination of gross calorific value in crude oil by variable selection methods applied to 13C NMR spectroscopy. Fuel 2022, 311, 122527. [Google Scholar] [CrossRef]
- Gafurov, M.; Mamin, G.; Gracheva, I.; Murzakhanov, F.; Ganeeva, Y.; Yusupova, T.; Orlinskii, S. High-Field (3.4 T) ENDOR Investigation of Asphaltenes in Native Oil and Vanadyl Complexes by Asphaltene Adsorption on Alumina Surface. Geofluids 2019, 2019, 3812875. [Google Scholar] [CrossRef] [Green Version]
- Davydov, V.V.; Myazin, N.S.; Grebenikova, N.M.; Dudkin, V.I. Determination of the Composition and Concentrations of the Components of Mixtures of Hydrocarbon Media in the Course of its Express Analysis. Meas. Tech. 2020, 62, 1090–1098. [Google Scholar] [CrossRef]
- Rakhmatullin, I.; Efimov, S.; Tyurin, V.; Gafurov, M.; Al-Muntaser, A.; Varfolomeev, M.; Klochkov, V. Qualitative and quantitative analysis of heavy crude oil samples and their SARA fractions with 13c nuclear magnetic resonance. Processes 2020, 8, 995. [Google Scholar] [CrossRef]
- Davydov, V.V.; Dudkin, V.I.; Vysoczky, M.G.; Myazin, N.S. Small-size NMR Spectrometer for Express Control of Liquid Media State. Appl. Magn. Reson. 2020, 51, 653–666. [Google Scholar] [CrossRef]
- Martínez-Martínez, S.; Rosa-Urbalejo, D.D.L.; Rua-Mojica, L.F.; Hernández-Altamirano, R.; Mena-Cervantes, V.Y. Experimental analysis of real-world emissions using ultra-low carbon intensity biodiesel for a light-duty diesel vehicle in Monterrey metropolitan area. Fuel 2022, 317, 123408. [Google Scholar] [CrossRef]
- Dimitriadis, A.; Meletidis, G.; Pfisterer, U.; Auersvald, M.; Kubička, D.; Bezergianni, S. Integration of stabilized bio-oil in light cycle oil hydrotreatment unit targeting hybrid fuels. Fuel Process. Technol. 2022, 230, 107220. [Google Scholar] [CrossRef]
- Qiu, B.; Yang, C.; Shao, Q.; Liu, Y.; Chu, H. Recent advances on industrial solid waste catalysts for improving the quality of bio-oil from biomass catalytic cracking: A review. Fuel 2022, 315, 123218. [Google Scholar] [CrossRef]
- Li, B.; Tang, J.; Huang, H.; Xie, X.; Lin, D.; Zhang, S.; Huang, Y.; Liu, D.; Xu, Z.; Chen, D. Biocoke production from heat treatment of bio-oil: Effect of temperature. J. Anal. Appl. Pyrolysis 2022, 161, 10540. [Google Scholar] [CrossRef]
- Feng, Q.; Xu, L.; Liu, C.; Hao, Y.; Yang, Z.; Zhang, T.; Liu, Y.; Su, H. Enhancing the anode performance of microbial fuel cells in the treatment of oil-based drill sludge by adjusting the stirring rate and supplementing oil-based drill cuttings. Sustain. Energy Fuels 2021, 5, 5773–5788. [Google Scholar] [CrossRef]
- Coto, B.; Suárez, I.; Tenorio, M.J.; Huerga, I. Extraction of aromatic and polyaromatic compounds with NMP: Experimental and model description. Fluid Phase Equilibria 2022, 554, 113293. [Google Scholar] [CrossRef]
- Li, Y.; Wang, D.; Xu, G.; Li, Q.; Yong, L.; Hongyu, G.; Lei, S.; Dongwei, L.; Meng, G.; Guoran, L.; et al. ZIF-8/PI Nanofibrous Membranes With High-Temperature Resistance for Highly Efficient PM0.3 Air Filtration and Oil-Water Separation. Front. Chem. 2021, 9, 810861. [Google Scholar] [CrossRef]
- Zhao, L.; Zeng, X.; Zhao, W.; Zhu, F.; Hou, M.; Fan, G. Structural optimization for an axial oil-water separator with multi-stage separation. Heat Mass Transf. 2021, 57, 1949–1963. [Google Scholar] [CrossRef]
- Jafarinejad, S.; Esfahani, M.R. A review on the nanofiltration process for treating wastewaters from the petroleum industry. Separations 2021, 8, 206. [Google Scholar] [CrossRef]
- Li, Z.; Zhu, Y.; Xi, J.; Ye, D.; Hu, W.; Song, L.; Hu, Y.; Cai, W.; Gui, Z. Scalable production of hydrophobic and photo-thermal conversion bio-based 3D scaffold: Towards oil-water separation and continuous oil collection. J. Clean. Prod. 2021, 319, 128567. [Google Scholar] [CrossRef]
- Erith, M.; Alfonso, Z.; Erik, L. A Multi-Sensor Approach to Separate Palm Oil Plantations from Forest Cover Using NDFI and a Modified Pauli Decomposition Technique. In Proceedings of the International Geoscience and Remote Sensing Symposium (IGARSS 2020), Waikoloa, HI, USA, 26 September–2 October 2020. [Google Scholar] [CrossRef]
- Shafi, H.; Velswamy, K.; Ibrahim, F.; Huang, B. A hierarchical constrained reinforcement learning for optimization of bitumen recovery rate in a primary separation vessel. Comput. Chem. Eng. 2020, 140, 106939. [Google Scholar] [CrossRef]
- Acharya, T.; Casimiro, L. Evaluation of flow characteristics in an onshore horizontal separator using computational fluid dynamics. J. Ocean. Eng. Sci. 2020, 5, 261–268. [Google Scholar] [CrossRef]
- Liu, M.; Zhu, Z.; Zhang, Z.; Chu, Y.; Yuan, B.; Wei, Z. Development of highly porous mullite whisker ceramic membranes for oil-in-water separation and resource utilization of coal gangue. Sep. Purif. Technol. 2020, 237, 116483. [Google Scholar] [CrossRef]
- Mahmoud, M.; Tariq, Z.; Kamal, M.S.; Al-Naser, M. Intelligent prediction of optimum separation parameters in the multistage crude oil production facilities. J. Pet. Explor. Prod. Technol. 2019, 9, 2979–2995. [Google Scholar] [CrossRef] [Green Version]
- Dayev, Z.A.; Latyshev, L.N. Application of the multichanneling principle for solution of the problems related to increase of substance flowmeter accuracy. Flow Meas. Instrum. 2017, 56, 18–22. [Google Scholar] [CrossRef]
- Patrone, P.N.; Cooksey, G.; Kearsley, A. Dynamic Measurement of Nanoflows: Analysis and Theory of an Optofluidic Flowmeter. Phys. Rev. Appl. 2019, 11, 034025. [Google Scholar] [CrossRef] [Green Version]
- Arkharov, I.A.; Kakorin, I.D. A Method for the Evaluation of the Flow Rate of Cryogenic Two-Phase Flows in Venturi Flowmeters Without Separation. Meas. Tech. 2020, 63, 549–558. [Google Scholar] [CrossRef]
- Gu, Y.; Zhao, Y.; Lv, R.; Yang, Y. Theory and structure of a modified optical fiber turbine flowmeter. Flow Meas. Instrum. 2016, 50, 178–184. [Google Scholar] [CrossRef] [Green Version]
- Shaaban, S. Design and optimization of a novel flowmeter for liquid hydrogen. Int. J. Hydrogen Energy 2017, 42, 14621–14632. [Google Scholar] [CrossRef]
- Klingensmith, W.C.; Mays, D.C. Information Content of Wastewater Flowmeter Data before and during a Surcharge. J. Environ. Eng. 2018, 144, 05018004. [Google Scholar] [CrossRef]
- Yang, Y.; Ha, W.; Zhang, C.; Liu, M.; Zhang, X.; Wang, D. Measurement of high-water-content oil-water two-phase flow by electromagnetic flowmeter and differential pressure based on phase-isolation. Flow Meas. Instrum. 2022, 84, 102142. [Google Scholar] [CrossRef]
- Jin, N.; Yu, C.; Han, Y.; Yang, Q.; Ren, Y.; Zhai, L. The Performance Characteristics of Electromagnetic Flowmeter in Vertical Low-Velocity Oil-Water Two-Phase Flow. IEEE Sens. J. 2021, 21, 464–475. [Google Scholar] [CrossRef]
- Wang, Y.; Li, H.; Liu, X.; Chen, L.; Xie, R.; Han, L. A Novel Method for Measuring the Flow Rate of High Viscous Fluid in Polymer Injection Well by Nonuniform Magnetic Field Electromagnetic Flowmeter. In Proceedings of the 8th Annual IEEE International Conference on Cyber Technology in Automation, Control and Intelligent Systems, Tianjin, China, 19–23 July 2018. [Google Scholar] [CrossRef]
- Han, Y.; Jin, N.; He, Y.; Ren, Y. Flow Measurement of Oil-in-Water Emulsions Using Arc-Type Conductivity Probes and Electromagnetic Flowmeter. IEEE Trans. Instrum. Meas. 2018, 67, 667–677. [Google Scholar] [CrossRef]
- Wang, Y.; Li, H.; Liu, X.; Zhang, Y.; Xie, R.; Huang, C.; Hu, J.; Deng, G. Novel downhole electromagnetic flowmeter for oil-water two-phase flow in high-water-cut oil-producingwells. Sensors 2016, 16, 1703. [Google Scholar] [CrossRef]
- Kumar, A.; Ridha, S.; Narahari, M.; Ilyas, S.U. Physics-guided deep neural network to characterize non-Newtonian fluid flow for optimal use of energy resources. Expert Syst. Appl. 2021, 183, 115409. [Google Scholar] [CrossRef]
- Krasnov, A.N.; Prakhova, M.Y.; Novikova, Y.V. Predicting the Decrease in the Metrological Reliability of Ultrasonic Flow Meters in Conditions of Wax Deposition. Lect. Notes Electr. Eng. 2022, 857, 513–521. [Google Scholar] [CrossRef]
- Savanin, A.S. Analysis of the rheological properties influence on fluid at flow meters’ metrological characteristics. Neftyanoe Khozyaystvo Oil Ind. 2020, 7, 128–132. [Google Scholar] [CrossRef]
- Safonov, A.V. Experience with the use of ultrasonic flowmeters in systems for measuring the quantity and quality of petroleum. Meas. Tech. 2014, 57, 458–460. [Google Scholar] [CrossRef]
- Mills, C. Process effects on coriolis flowmeter calibration. Hydrocarb. Process. 2020, 99, 8. [Google Scholar]
- Prakhova, M.Y.; Krasnov, A.N. Coriolis flowmeter for commercial accounting of crude oil. J. Phys. Conf. Ser. 2020, 1582, 012071. [Google Scholar] [CrossRef]
- Rondon, J.; Barrufet, M.A.; Falcone, G. A novel downhole sensor to determine fluid viscosity. Flow Meas. Instrum. 2012, 23, 9–18. [Google Scholar] [CrossRef]
- Falcone, G.; Hewitt, G.F.; Alimonti, C.; Harrison, B. Multiphase Flow Metering: Current Trends and Future Developments. J. Pet. Technol. 2002, 54, 77–84. [Google Scholar] [CrossRef]
- Pedersen, S.; Durdevic, P.; Yang, Z. Review of slug detection, modeling and control techniques for offshore oil & gas production processes. IFAC-Pap. 2015, 28, 89–96. [Google Scholar] [CrossRef]
- Armstrong, B.D.; Lingwood, M.D.; McCarney, E.R.; Brown, E.R.; Blümler, P.; Han, S. Portable X-Band System for Solution State Dynamic Nuclear Polarization. J. Magn. Reason. 2008, 191, 273–281. [Google Scholar] [CrossRef]
- Arvoh, B.K.; Hoffmann, R.; Halstensen, M. Estimation of Volume Fractions and Flow Regime Identification in Multiphase Flow Based on Gamma Measurements and Multivariate Calibration. Flow Meas. Instrum. 2012, 23, 56–65. [Google Scholar] [CrossRef]
- Laney, S.; Yeung, H. Investigation of the Exploitation of a Fast-Sampling Single Gamma Densitometer and Pattern Recognition to Resolve the Superficial Phase Velocities and Liquid Phase Water Cut of Vertically Upward Multiphase Flows. Flow Meas. Instrum. 2008, 19, 57–66. [Google Scholar] [CrossRef]
- Davydov, V.V.; Grebenikova, N.M.; Smirnov, K.Y. An Optical Method of Monitoring the State of Flowing Media with Low Transparency That Contain Large Inclusions. Meas. Tech. 2019, 62, 519–526. [Google Scholar] [CrossRef]
- Davydov, V.V.; Kruzhalov, S.V.; Grebenikova, N.M.; Smirnov, K.Y. Method for Determining Defects on the Inner Walls of Tubing from the Velocity Distribution of the Flowing Fluid. Meas. Tech. 2018, 61, 365–372. [Google Scholar] [CrossRef]
- Appel, M.; Freeman, J.; Pusiol, D. Robust Multi-Phase Flow Measurement Using Magnetic Resonance Technology. In Proceedings of the SPE Middle East Oil and Gas Show and Conference, Manama, Bahrain, 25–28 September 2011. [Google Scholar] [CrossRef]
- Blumich, B.; Casanova, F.; Appelt, S. NMR at Low Magnetic Fields. Chem. Phys. Lett. 2009, 477, 231–240. [Google Scholar] [CrossRef]
- Danieli, E.; Perlo, J.; Blümich, B.; Casanova, F. Small Magnets for Portable NMR Spectrometers. Angew. Chem. Int. 2010, 49, 4133–4135. [Google Scholar] [CrossRef] [PubMed]
- Davydov, R.V.; Dudkin, V.I.; Nikolaev, D.I.; Davydov, V.V.; Makeev, S.S.; Moroz, A.V. Structure of a Nuclear Magnetic Resonance Signal in a Small Relaxometer. J. Commun. Technol. Electron. 2021, 66, 632–636. [Google Scholar] [CrossRef]
- Falcone, G.; Hewitt, G.F.; Alimonti, C.; Harrison, B. Multiphase flow metering: Current trends and future developments. In Proceedings of the SPE Annual Technical Conference and Exhibition, New Orleans, LA, USA, 30 September–3 October 2001. [Google Scholar] [CrossRef]
- Fridjonsson, E.O.; Graham, B.F.; Akhfash, M.; May, E.F.; Johns, M.L. Optimized Droplet Sizing of Water-in-Crude Oil Emulsions Using Nuclear Magnetic Resonance. Energy Fuels 2014, 28, 1756–1764. [Google Scholar] [CrossRef] [Green Version]
- Hansen, L.S.; Pedersen, S.; Durdevic, P. Multi-Phase Flow Metering in Offshore Oil and Gas Transportation Pipelines: Trends and Perspectives. Sensors 2019, 19, 2184. [Google Scholar] [CrossRef] [PubMed] [Green Version]
- Kantzas, A.; Kryuchkov, S.; Chandrasekaran, B. Advances in Multiphase Flow Measurements Using Magnetic Resonance Relaxometry. J. Phys. 2009, 147, 012029. [Google Scholar] [CrossRef]
- Li, L.-P.; Huang, Y.-Q.; Yuan, J.-F.; Tong, M.S. On-line measurement method of multiphase flow in oil wells by NMR. In Proceedings of the International Field Exploration and Development Conference, Xi’an, China, 16–18 October 2020. [Google Scholar] [CrossRef]
- O’Neill, K.T.; Hopper, T.A.J.; Fridjonsson, E.O.; Johns, M.L. Quantifying motional dynamics in nuclear magnetic resonance logging. J. Magn. Reson. 2022, 337, 107167. [Google Scholar] [CrossRef]
- Piela, K.; Delfos, R.; Ooms, G.; Westerweel, J.; Oliemans, R.V.A. On the Phase Inversion Process in an Oil–Water Pipe Flow. Int. J. Multiph. Flow 2008, 34, 665–677. [Google Scholar] [CrossRef]
- Rodriguez, I.H.; Yamaguti, H.K.B.; De Castro, M.S.; Da Silvo, M.J.; Rodriguez, O.M.H. Slip Ratio in Dispersed Viscous Oil–Water Pipe Flow. Exp. Therm. Fluid Sci. 2011, 35, 11–19. [Google Scholar] [CrossRef]
- Thorn, R.; Johansen, G.A.; Hammer, E.A. Recent Developments in Three-Phase Flow Measurement. Meas. Sci. Technol. 1997, 8, 691–701. [Google Scholar] [CrossRef]
- Zargar, M.; Fridjonsson, E.O.; Graham, B.F.; May, E.F.; Johns, M.L. Oil-Based Binding Resins: Peculiar Water-in-Oil Emulsion Breakers. Energy Fuels 2019, 33, 8448–8455. [Google Scholar] [CrossRef]
- Davydov, V.V.; Myazin, N.S.; Makeev, S.S.; Dudkin, V.I. Method for Monitoring the Longitudinal Relaxation Time of Flowing Liquids Over the Entire Range of Flow Rate Measurements. Meas. Tech. 2020, 63, 368–374. [Google Scholar] [CrossRef]
- Zargar, M.; Johns, M.L.; Aljindan, J.M.; Noui-Mehidi, M.N.; O’Neill, K.T. Nuclear magnetic resonance multiphase flowmeters: Current status and future prospects. SPE Prod. Oper. 2021, 36, 423–436. [Google Scholar] [CrossRef]
- Carroll, M.R.J.; O’Neill, K.; Bristow, N.W.; Hopper, T.; Vogt, S.J.; Johns, M.L.; Fridjonsson, E.O. NMR derived water content from high magnetic susceptibility rock cuttings. Miner. Eng. 2018, 122, 211–219. [Google Scholar] [CrossRef]
- Deng, F.; Xiao, L.; Wang, M.; Tao, Y.; Kong, L.; Zhang, X.; Liu, X.; Geng, D. Online NMR Flowing Fluid Measurements. Appl. Magn. Reson. 2016, 47, 1239–1253. [Google Scholar] [CrossRef]
- Deng, F.; Chen, G.; Wang, M.; Xu, D.; Chen, S.; Zhang, X.; Xiong, C.; Zhang, J.; Lei, Q.; Shi, J.; et al. Magnetic resonance multi-phase flowmeter & fluid analyzer. In Proceedings of the SPE Asia Pacific Oil & Gas Conference and Exhibition, Virtual, 17–19 November 2020. [Google Scholar] [CrossRef]
- O’Neill, K.T.; Brancato, L.; Stanwix, P.L.; Fridjonsson, E.O.; Johns, M.L. Two-phase oil/water flow measurement using an Earth’s field nuclear magnetic resonance flow meter. Chem. Eng. Sci. 2019, 202, 222–237. [Google Scholar] [CrossRef]
- Marusina, M.Y.; Bazarov, B.A.; Galaidin, P.A.; Marusin, M.P.; Silaev, A.A.; Zakemovskaya, E.Y.; Mustafaev, Y.N. Design of a Gradient System for a Multiphase Flowmeter. Meas. Tech. 2014, 57, 580–586. [Google Scholar] [CrossRef]
- D’yachenko, S.V.; Zhernovoi, A.I. The Langevin formula for describing the magnetization curve of a magnetic liquid. Tech. Phys. 2016, 61, 1835–1837. [Google Scholar] [CrossRef]
- Davydov, V.V. Some specific features of the NMR study of fluid flows. Opt. Spectrosc. 2016, 121, 18–24. [Google Scholar] [CrossRef]
- Davydov, V.V. Control of the longitudinal relaxation time T1 of a flowing liquid in NMR flowmeters. Russ. Phys. J. 1999, 42, 822–825. [Google Scholar] [CrossRef]
- Marusina, M.Y.; Bazarov, B.A.; Galaidin, P.A.; Silaev, A.A.; Marusin, M.P.; Zakemovskaya, E.Y.; Gilev, A.G.; Alekseev, A.V. A magnetic system based on permanent magnets for a flowmeter of multiphase fluid media. Meas. Tech. 2014, 57, 461–465. [Google Scholar] [CrossRef]
- Chandrasekera, T.C.; Mitchell, J. Numerical inversion methods for recovering negative amplitudes in two-dimensional nuclear magnetic resonance relaxation-time correlations. Phys. Rev. E 2018, 98, 043308. [Google Scholar] [CrossRef]
- Fridjonsson, E.O.; Vogt, S.J.; Vrouwenvelder, J.S.; Johns, M.L. Early Non-Destructive Biofouling Detection in Spiral Wound RO Membranes Using a Mobile Earth’s Field NMR. J. Membr. Sci. 2015, 489, 227–236. [Google Scholar] [CrossRef] [Green Version]
- Deng, F.; Xiao, L.; Liao, G.; Zong, F.; Chen, W. A New Approach of Two-Dimensional the NMR Relaxation Measurement in Flowing Fluid. Appl. Magn. Reason. 2014, 45, 179–192. [Google Scholar] [CrossRef]
- Tjugum, S.A.; Hjertaker, B.T.; Johansen, G.A. Multiphase Flow Regime Identification by Multibeam Gamma-Ray Densitometry. Meas. Sci. Technol. 2002, 13, 1319–1326. [Google Scholar] [CrossRef]
- Sætre, C.; Johansen, G.A.; Tjugum, S.A. Tomographic Multiphase Flow Measurement. Appl. Radiat. Isot. 2012, 70, 1080–1084. [Google Scholar] [CrossRef]
- Davydov, V.V.; Nikolaev, D.I.; Moroz, A.V. Design of a Flow-Through Refractometer for Monitoring the State of Transparent Media with a Cylindrical Insert in the Form of a Vertical Section of a Pipeline. Meas. Tech. 2021, 64, 305–313. [Google Scholar] [CrossRef]
- Im, S.H.; Kim, K.Y.; Park, G.S. A study on the effect of excitation coil system to improve measurement accuracy of electromagnetic flowmeter on the ship. Trans. Korean Inst. Electr. Eng. 2021, 70, 1460–1466. [Google Scholar] [CrossRef]
- Dasgupta, S. Flow distortion effect on electromagnetic flowmeter and mitigation using magnetic flux manipulation. Tech. Mess. 2021, 88, 508–518. [Google Scholar] [CrossRef]
- Yao, X.; Li, X. Numerical study on magnetic field characteristics of electromagnetic flowmeter with small excitation module. In ACM International Conference Proceeding Series; ACM: New York, NY, USA, 2021; pp. 86–89. [Google Scholar] [CrossRef]
- Beck, K.J.; Barfuss, S.L.; Sharp, Z.B.; Moon, T.K. An alternative analysis method for evaluating electromagnetic flowmeter performance. AWWA Water Sci. 2021, 3, e1242. [Google Scholar] [CrossRef]
- Bilgic, A.M.; Kunze, J.W.; Stegemann, V.; Hogendoorn, J.; Cerioni, L.; Zoeteweij, M. Multiphase flow metering with nuclear magnetic resonance. Tech. Mess. 2015, 82, 539–548. [Google Scholar] [CrossRef]
- Aydin, E.; Makinwa, K.A.A. A low-field portable nuclear magnetic resonance (NMR) microfluidic flowmeter. In Proceedings of the 2021 21st International Conference on Solid-State Sensors, Actuators and Microsystems (Transducers), Orlando, FL, USA, 20–24 June 2021. [Google Scholar] [CrossRef]
- Kartalović, N.M.; Đekić, S.D.; Đekić, S.B.; Nikezić, D.P.; Ramadani, U.R. Possibility of application nuclear magnetic resonance for measurement of fluid-flow. Nucl. Technol. Radiat. Prot. 2021, 36, 168–173. [Google Scholar] [CrossRef]
- Deng, F.; Xiong, C.; Chen, S.; Chen, G.; Wang, M.; Liu, H.; Zhang, J.; Lei, Q.; Cao, G.; Xu, D.; et al. A method and device for online magnetic resonance multiphase flow detection. Pet. Explor. Dev. 2020, 47, 855–866. [Google Scholar] [CrossRef]
- Zhernovoi, A.I. A direct method of determining the water content in water-oil emulsions. Chem. Technol. Fuels Oils 2006, 42, 142–143. [Google Scholar] [CrossRef]
- Gizatullin, B.; Gafurov, M.; Vakhin, A.; Rodionov, A.; Mamin, G.; Orlinskii, S.; Mattea, C.; Stapf, S. Native Vanadyl Complexes in Crude Oil as Polarizing Agents for in Situ Proton Dynamic Nuclear Polarization. Energy Fuels 2019, 33, 10923–10932. [Google Scholar] [CrossRef]
- Davydov, V.V.; Dudkin, V.I.; Karseev, A.Y. Formation of the nutation line in NMR measuring system with flowing samples. Tech. Phys. Lett. 2015, 41, 355–358. [Google Scholar] [CrossRef]
- Davydov, V.V.; Dudkin, V.I.; Myazin, N.S.; Davydov, R.V. On the Possibility of Studying Ferrofluids by a Nuclear Magnetic Magnetometer with a Flowing Sample. J. Commun. Technol. Electron. 2020, 65, 558–564. [Google Scholar] [CrossRef]
- Gizatullin, B.; Gafurov, M.; Rodionov, A.; Stapf, S.; Orlinskii, S. Proton-Radical Interaction in Crude Oil—A Combined NMR and EPR Study. Energy Fuels 2018, 32, 11261–11268. [Google Scholar] [CrossRef]
- Meribout, M.; Azzi, A.; Ghendour, N.; Kharouac, N.; Khezzard, L.; AlHosani, E. Multiphase Flow Meters Targeting Oil & Gas Industries. Measurement 2020, 165, 108111. [Google Scholar] [CrossRef]
- Davydov, V.V.; Dudkin, V.I.; Karseev, A.Y.; Vologdin, V.A. Special Features in Application of Nuclear Magnetic Spectroscopy to Study Flows of Liquid Media. J. Appl. Spectrosc. 2016, 82, 1013–1019. [Google Scholar] [CrossRef]
- Ling, N.N.A.; Haber, A.; May, E.F.; Fridjonsson, E.O.; Johns, M.L. By-Line NMR Emulsion Droplet Sizing. Chem. Eng. Sci. 2017, 160, 362–369. [Google Scholar] [CrossRef]
- Mandal, S.; Utsuzawa, S.; Cory, D.G.; Hürlimann, M.; Poitzsch, M.; Song, Y.-Q. An Ultra-Broadband Low-Frequency Magnetic Resonance System. J. Magn. Reason. 2014, 242, 113–125. [Google Scholar] [CrossRef] [PubMed]
- Mitchell, J.; Chandrasekera, T.C.; Gladden, L.F. Numerical Estimation of Relaxation and Diffusion Distributions in Two Dimensions. Prog. Nucl. Magn. Reason. Spectrosc. 2012, 62, 34–50. [Google Scholar] [CrossRef] [PubMed]
- O’Neill, K.T.; Fridjonsson, E.O.; Stanwix, P.L.; Johns, M.L. Quantitative Velocity Distributions via Nuclear Magnetic Resonance Flow Metering. J. Magn. Reason. 2016, 26, 179–185. [Google Scholar] [CrossRef] [PubMed]
- O’Neill, K.T.; Klotz, A.; Stanwix, P.L.; Fridjonsson, E.O.; Johns, M.L. Quantitative Multiphase Flow Characterisation Using an Earth’s Field NMR Flow Meter. Flow Meas. Instrum. 2017, 58, 104–111. [Google Scholar] [CrossRef]
- Harpen, M.D. Indicator dilution approach to NMR signal-flow curves. Phys. Med. Biol. 1985, 30, 687–693. [Google Scholar] [CrossRef]
- Hogendoorn, J.; Boer, A.; Zoeteweij, M.; Bousché, O.; Tromp, R.; de Leeuw, R.; Moeleker, P.; Appel, M.; de Jong, H. Magnetic resonance multiphase flow meter: Gas flow measurement principle and wide range testing results. In Proceedings of the 32nd International North Sea Flow Measurement Workshop, St. Andrews, Scotland, 21–24 October 2014. [Google Scholar]
- Hogendoorn, J.; Zande, M.V.D.; Zoeteweij, M.; Tromp, R.; Cerioni, L.; Boer, A.; de Leeuw, R. Practical experiences obtained with the magnetic resonance multiphase flowmeter. In Proceedings of the North Sea Flow Measurement Workshop, Sandefjord, Norway, 24–27 October 2017. [Google Scholar]
- Strosin, R.G.; Battocletti, J.H.; Sances, A.; Knox, T.A. Evaluation of reactive hyperemia in the human limb by doppler ultrasound & nuclear magnetic resonance. J. Clin. Eng. 1988, 13, 433–442. [Google Scholar] [CrossRef]
- Boccalon, H. Study of vasomotility in man using plethysmography and flowmetry. Arch. Mal. Coeur Vaiss. 1990, 83, 43–50. [Google Scholar]
- Tessier, J.J.; Packer, K.J. The characterization of multiphase fluid transport in a porous solid by pulsed gradient stimulated echo nuclear magnetic resonance. Phys. Fluids 1998, 10, 75–85. [Google Scholar] [CrossRef]
- Giulotto, L.; Lanzi, G.; Tosca, L. Nuclear Relaxation and Molecular Association in Liquids. J. Chem. Phys. 1956, 24, 632–644. [Google Scholar] [CrossRef]
- Suryan, G. Nuclear resonance in flowing liquids. Proc. Indian Acad. Sci. Sect. A 1951, 33, 107. [Google Scholar] [CrossRef]
- Vander, H.W.R.; Genthe, W.K.; Battocletti, J.H.; McCormick, W.S.; Snowball, H.M. NMR applied to flow measurement. Instrum. Tech. 1968, 15, 53–58. [Google Scholar]
- Leshe, A. Nuclear Induction; Veb Deustscher Verlag Der Wissenschaften: Berlin, Germany, 1963; 864p. [Google Scholar]
- Abragam, A. The Principles of Nuclear Magnetism; Oxford at the Clarendon Press: Oxford, UK, 1961; 646p. [Google Scholar]
- Davydov, V.V.; Dudkin, V.I.; Karseev, A.Y. A Compact Nuclear Magnetic Relaxometer for the Express Monitoring of the State of Liquid and Viscous Media. Meas. Tech. 2014, 57, 912–918. [Google Scholar] [CrossRef]
- Davydov, V.V.; Dudkin, V.I.; Karseev, A.Y. Feasibility of Using Nuclear Magnetic Spectroscopy for Rapid Monitoring of Liquid Media. J. Appl. Spectrosc. 2015, 82, 794–800. [Google Scholar] [CrossRef]
Figure 1.
Structural diagram of the design of the NMR flowmeter–relaxometer: 1—magnet polarizer; 2—vessel polarizer; 3—magnetic screen; 4—nutation coil; 5—field modulation coils B0; 6—constant magnet; 7—connecting section of pipeline; 8—magnet analyzer; 9—NMR signal registration coil; 10—vessel analyzer; 11—modulation coils of the magnet analyzer field; 12—NMR signal registration scheme; 13—radio frequency generator; 14—scheme of processing and control; 15—electronic keys; 16 and 17—nutation and modulation coil generators; 18—oscilloscope.

Figure 2.
Shape of NMR signal lines at the output of registration circuit 11 from feedwater at H1 = 0.
Figure 2.
Shape of NMR signal lines at the output of registration circuit 11 from feedwater at H1 = 0.

Figure 3.
Shape of NMR signal lines at the output of registration circuit 11 from feedwater with inversion of magnetization at fn = 1,435,106 Hz, H1 = 14.3 A/m.
Figure 3.
Shape of NMR signal lines at the output of registration circuit 11 from feedwater with inversion of magnetization at fn = 1,435,106 Hz, H1 = 14.3 A/m.

Figure 4.
Dependence of the change in the amplitude Us of the registered NMR signal on time t. Graph 1 approximates the decay of the free induction signal during a single passage through the resonance.
Figure 4.
Dependence of the change in the amplitude Us of the registered NMR signal on time t. Graph 1 approximates the decay of the free induction signal during a single passage through the resonance.

Figure 5.
Shape of NMR signal lines at the output of registration circuit 11 from feed water with inversion of magnetization at fn = 1,441,278 Hz, H1 = 14.7 A/m, Hm = 31.1 A/m, fm = 3127 Hz.
Figure 5.
Shape of NMR signal lines at the output of registration circuit 11 from feed water with inversion of magnetization at fn = 1,441,278 Hz, H1 = 14.7 A/m, Hm = 31.1 A/m, fm = 3127 Hz.

Figure 6.
The sequence of control pulses on the electronic key 15.

Figure 7.
The dependence of the change in the amplitude Us of the registered NMR signal on time t at T = 298.4 K.
Figure 7.
The dependence of the change in the amplitude Us of the registered NMR signal on time t at T = 298.4 K.


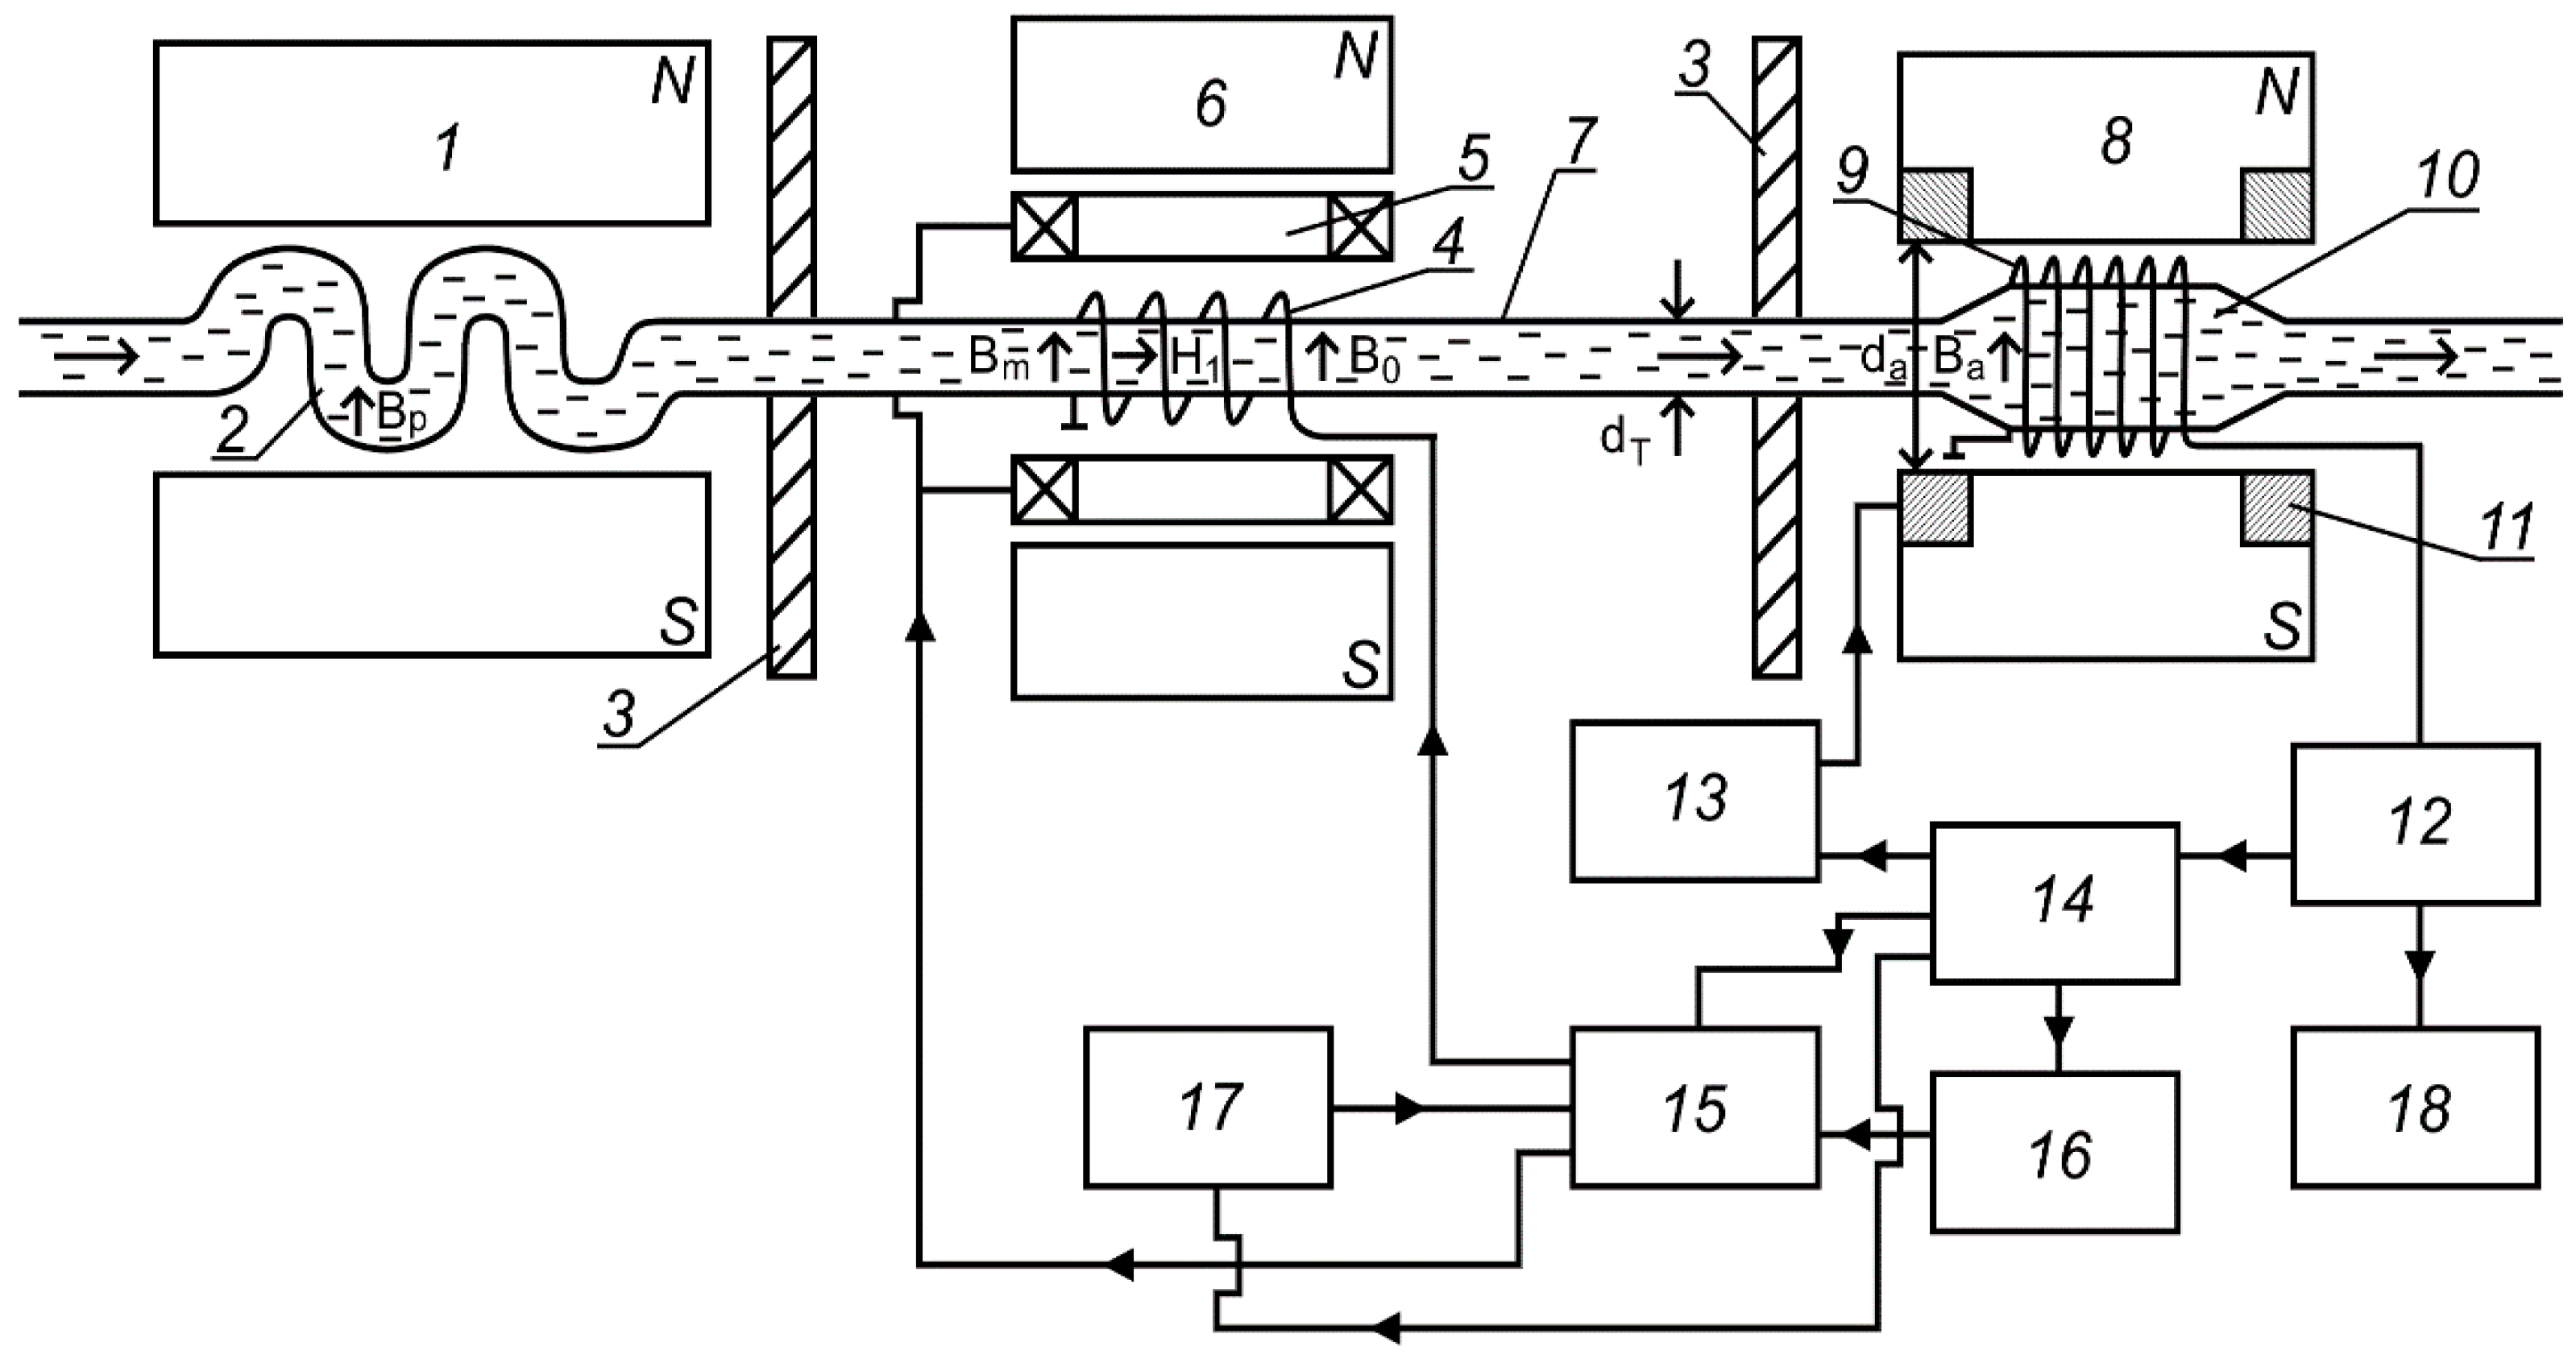
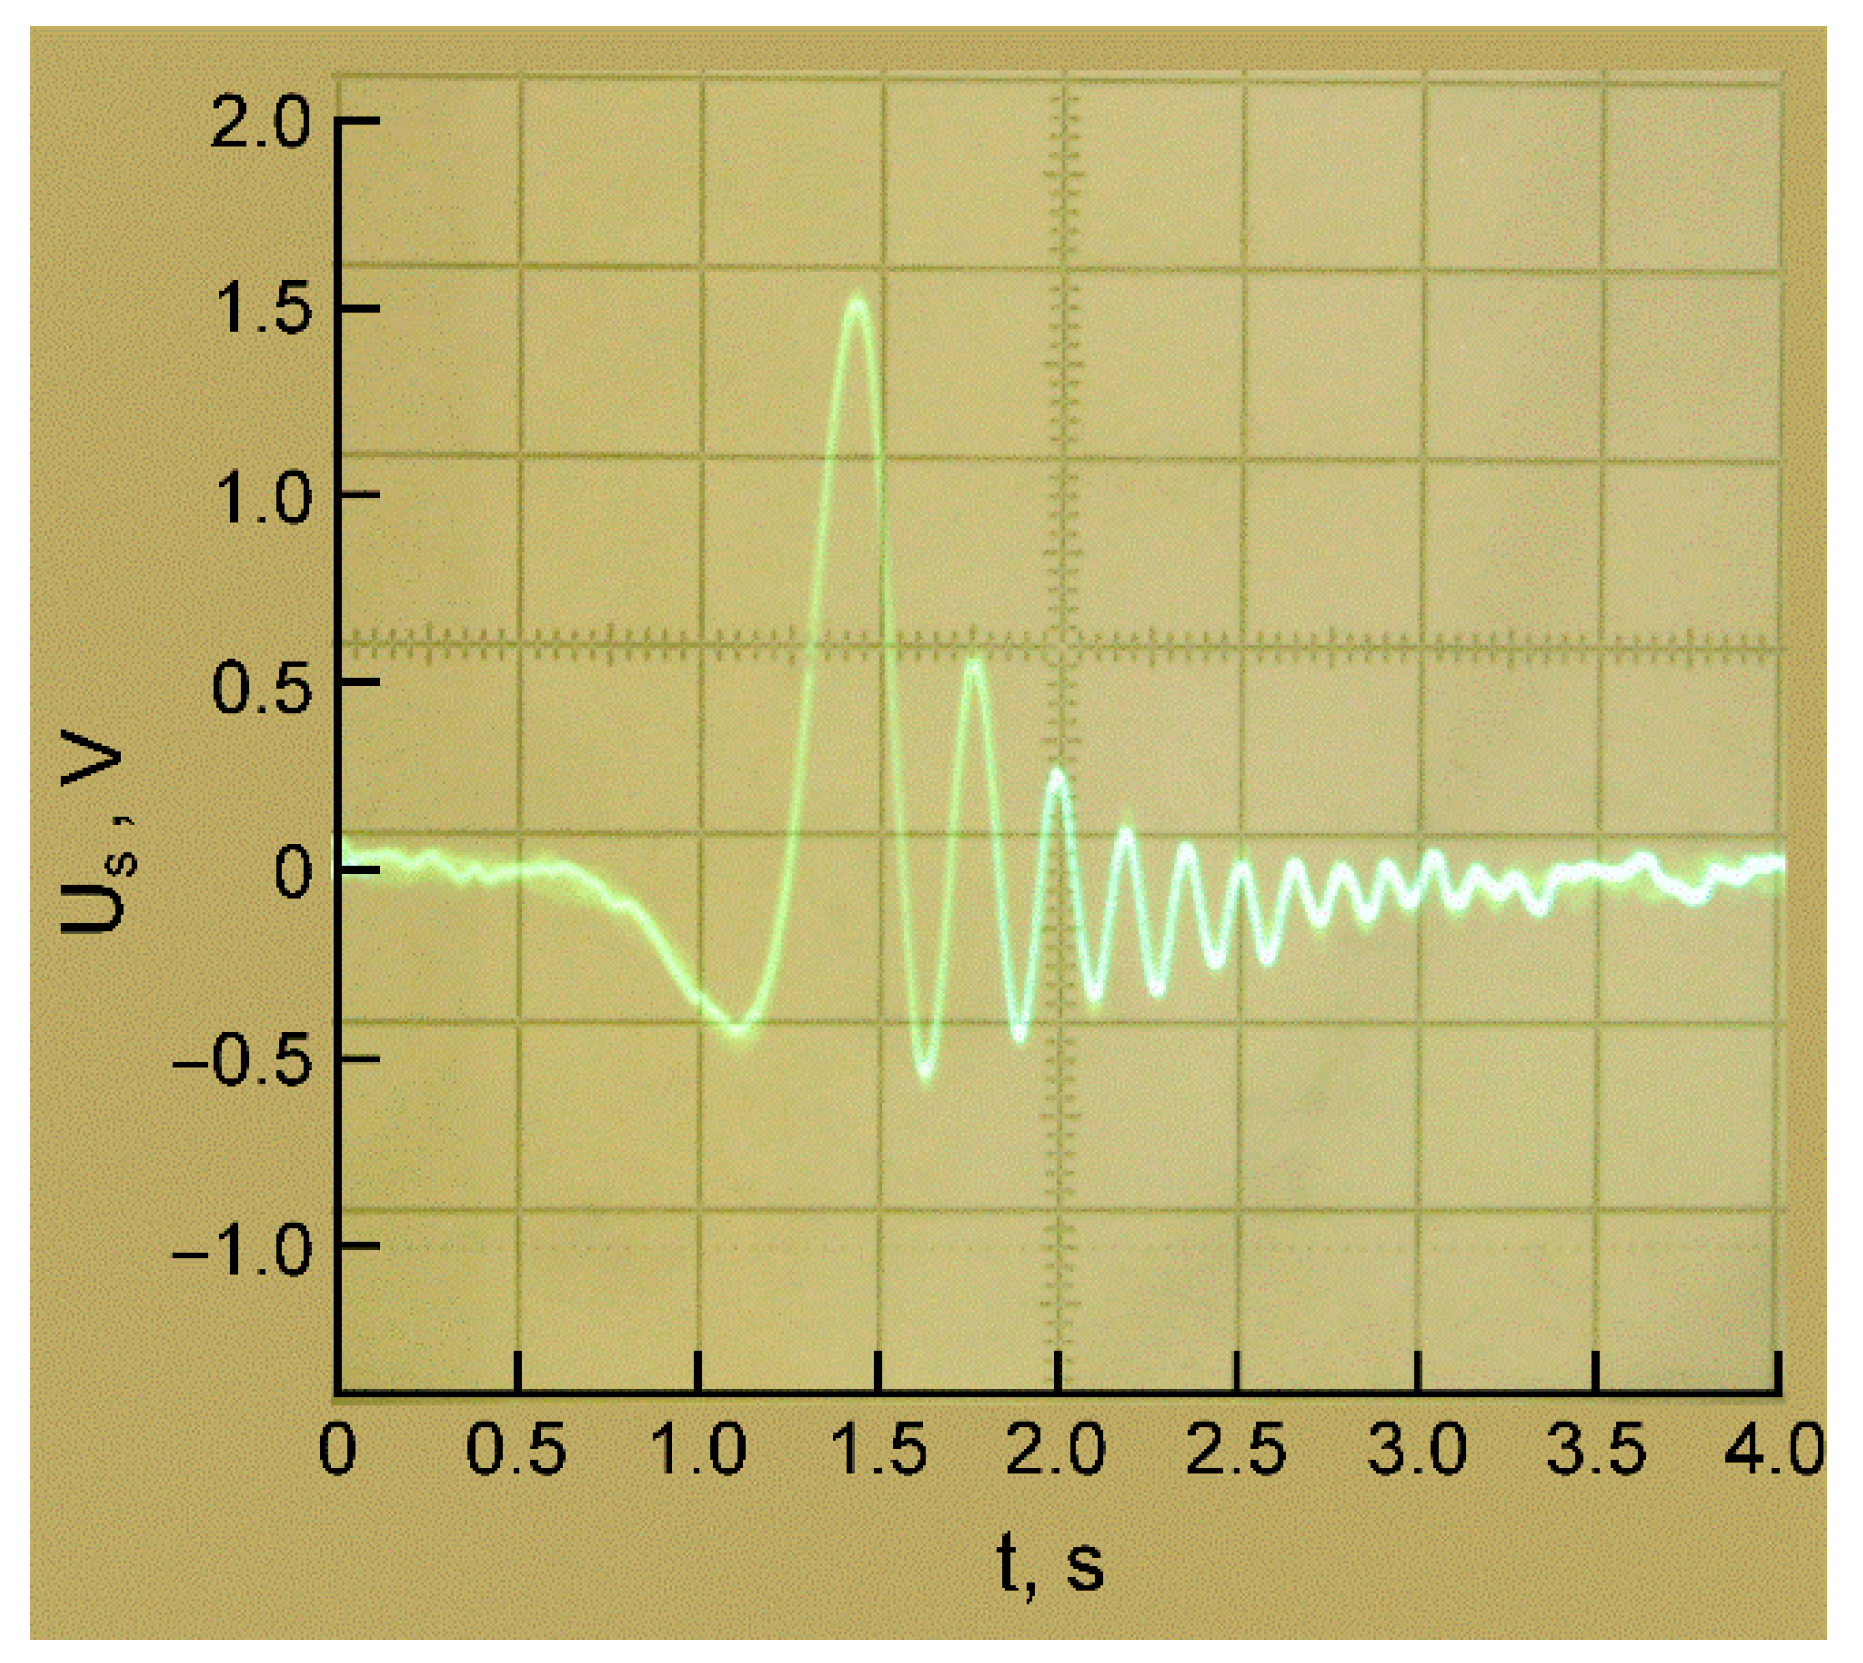
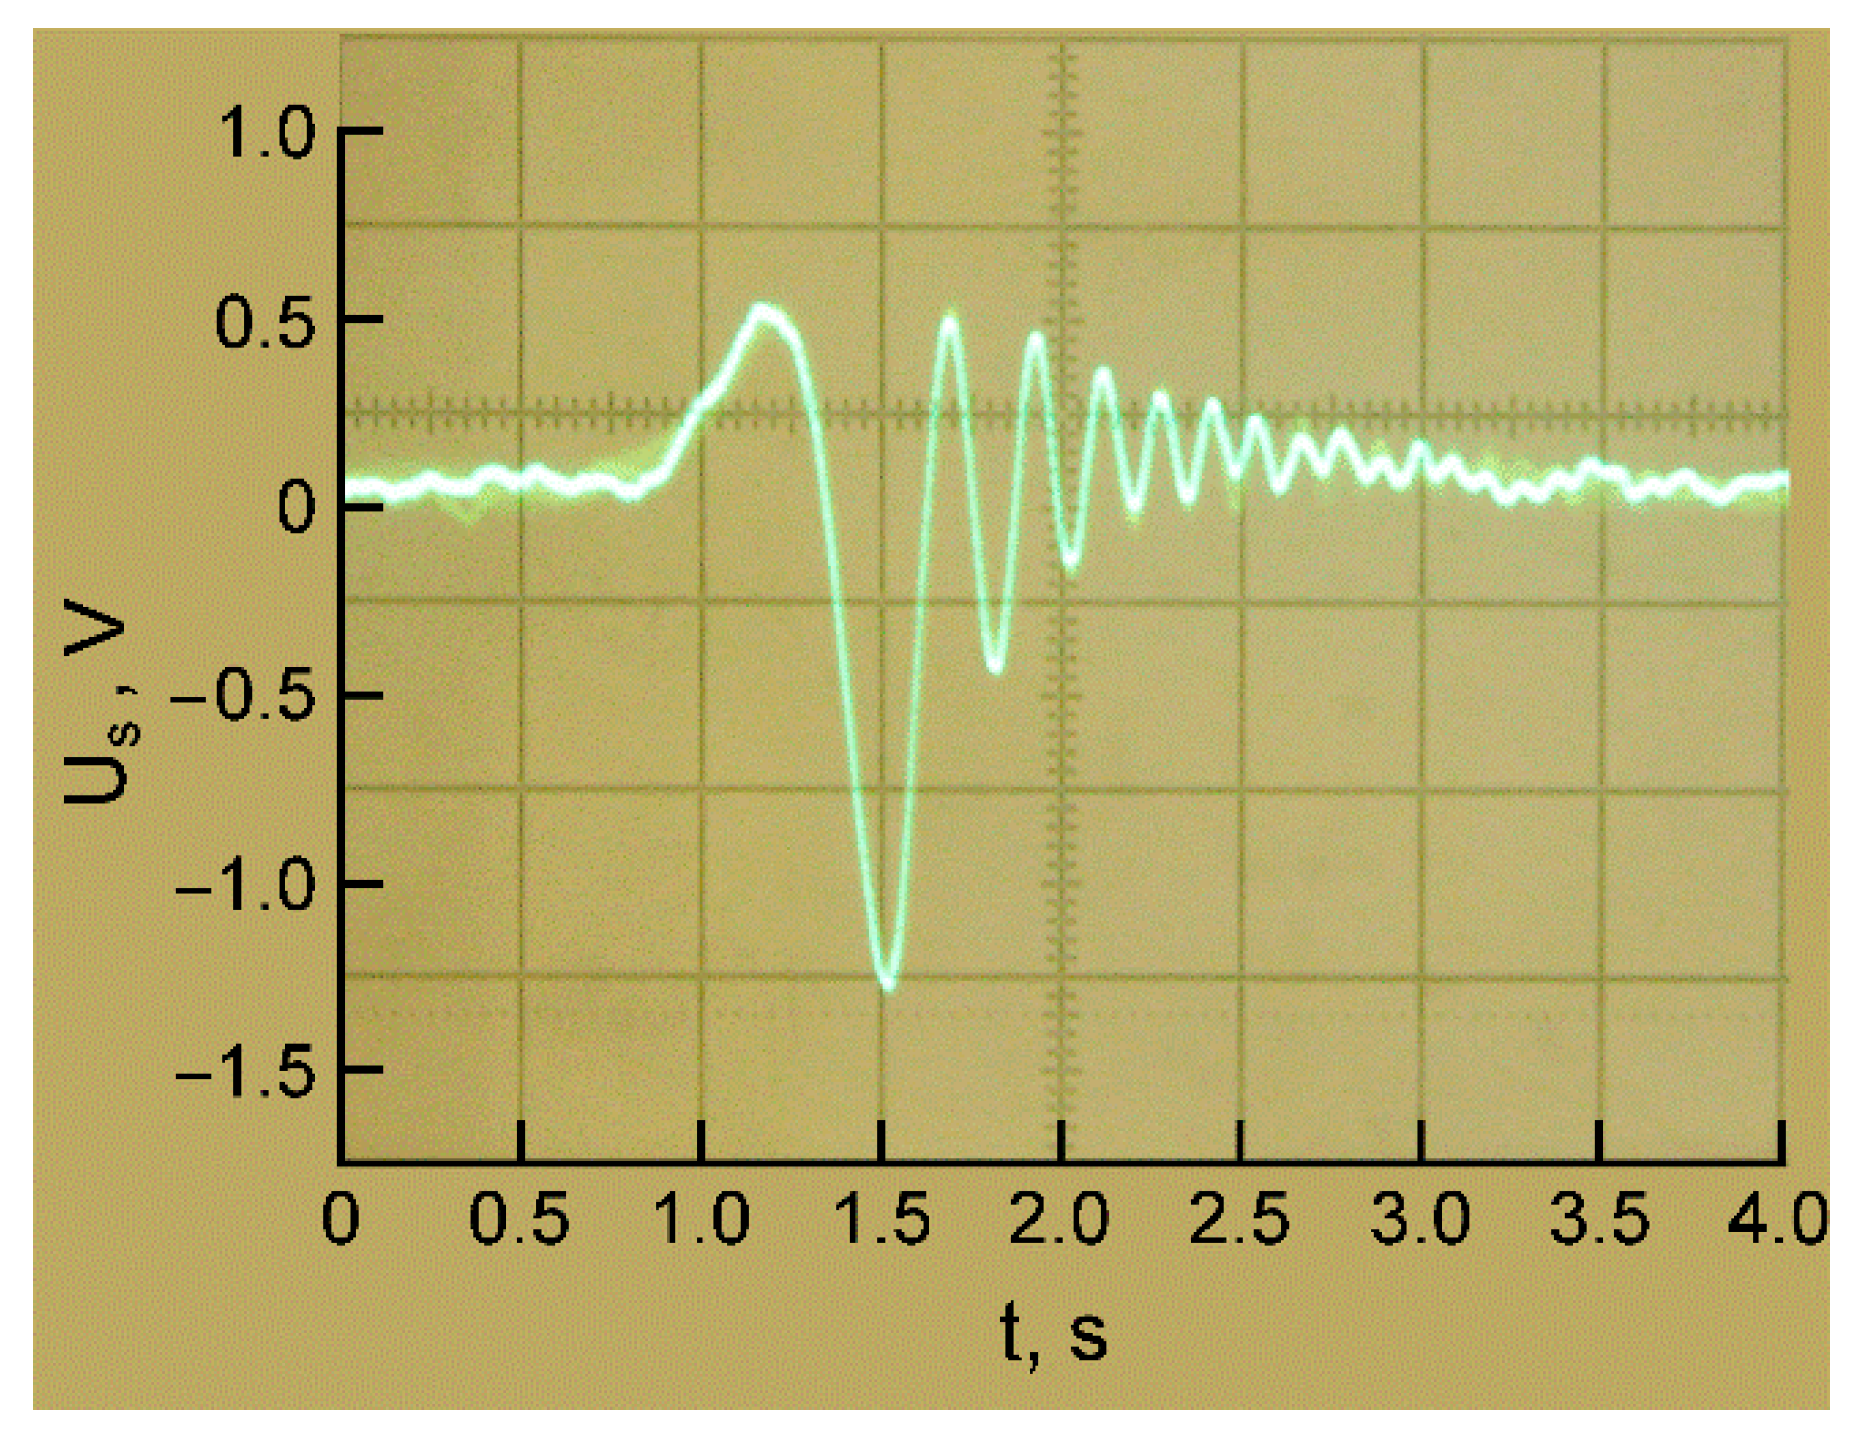
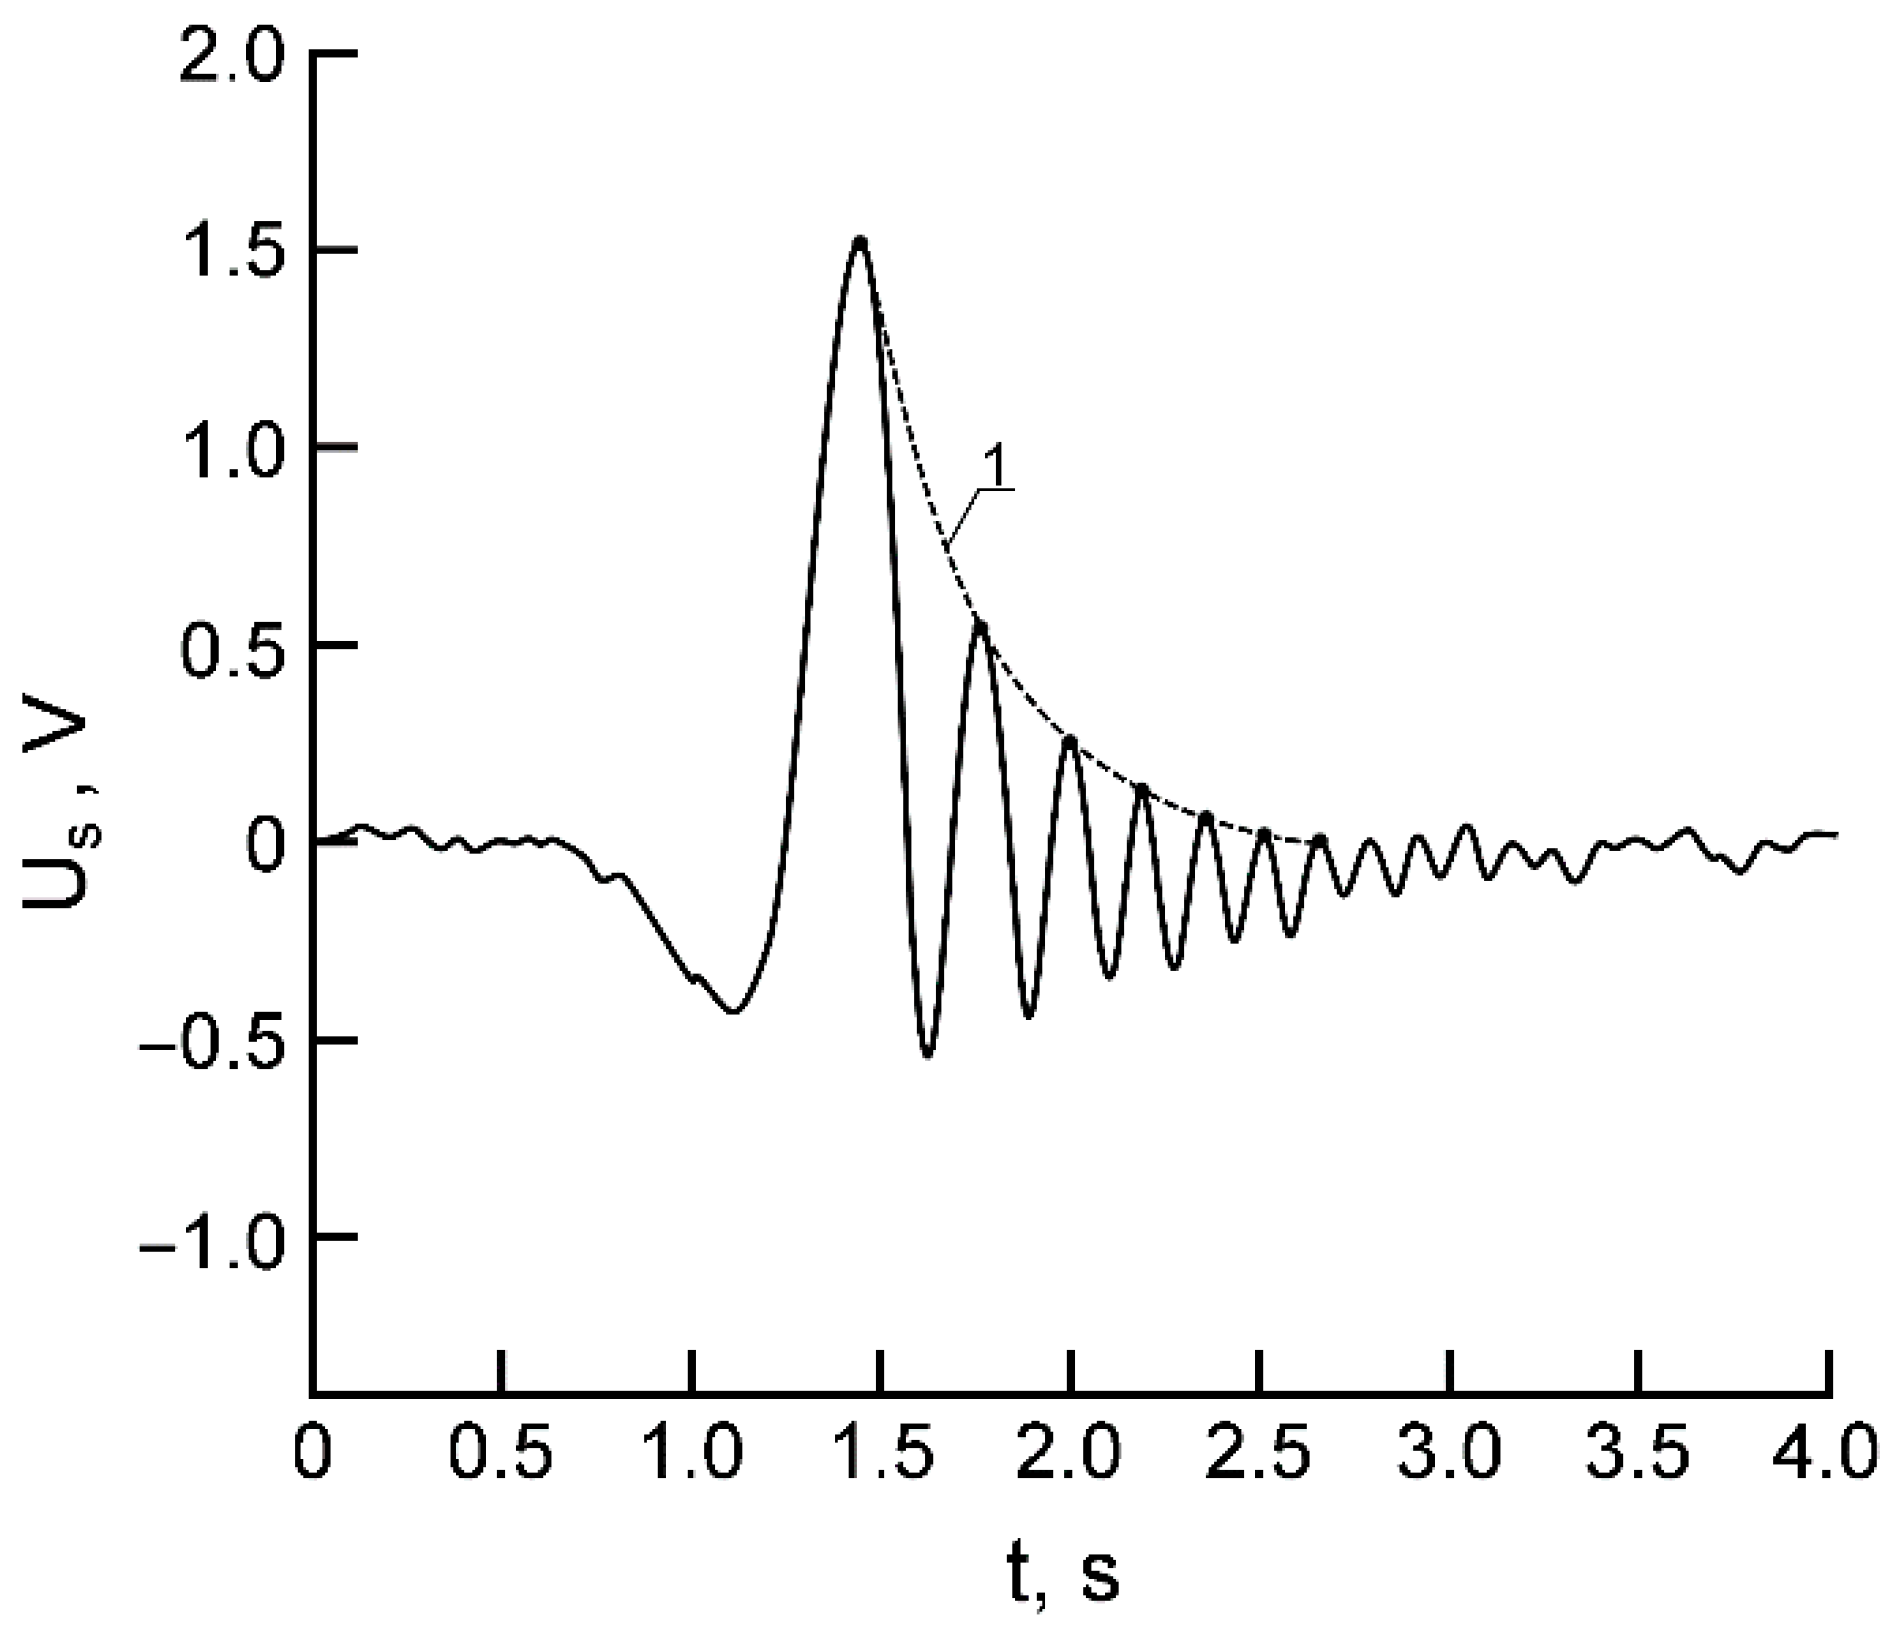
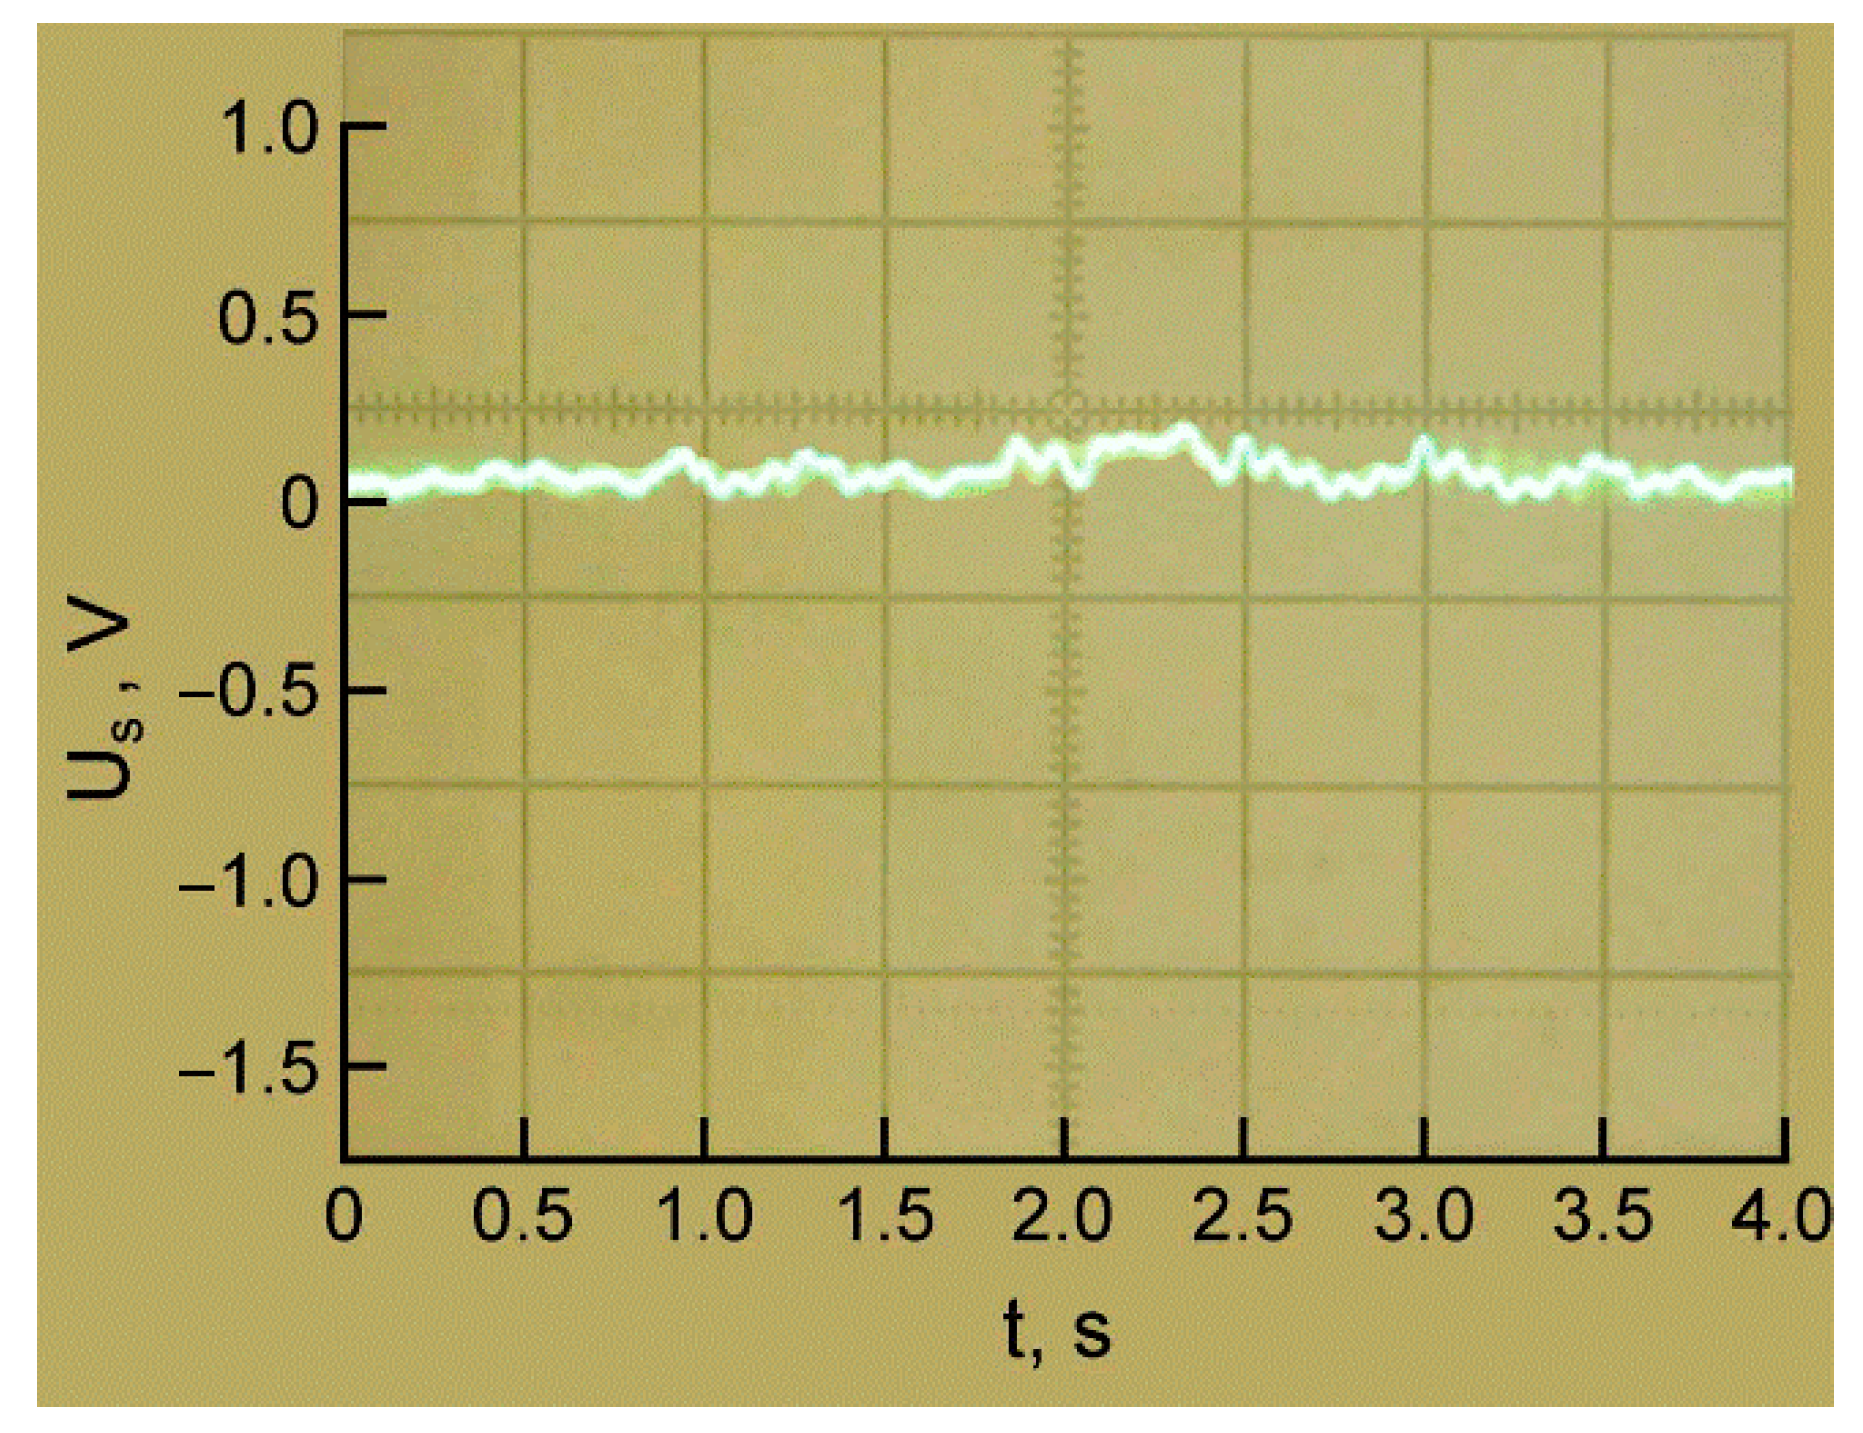
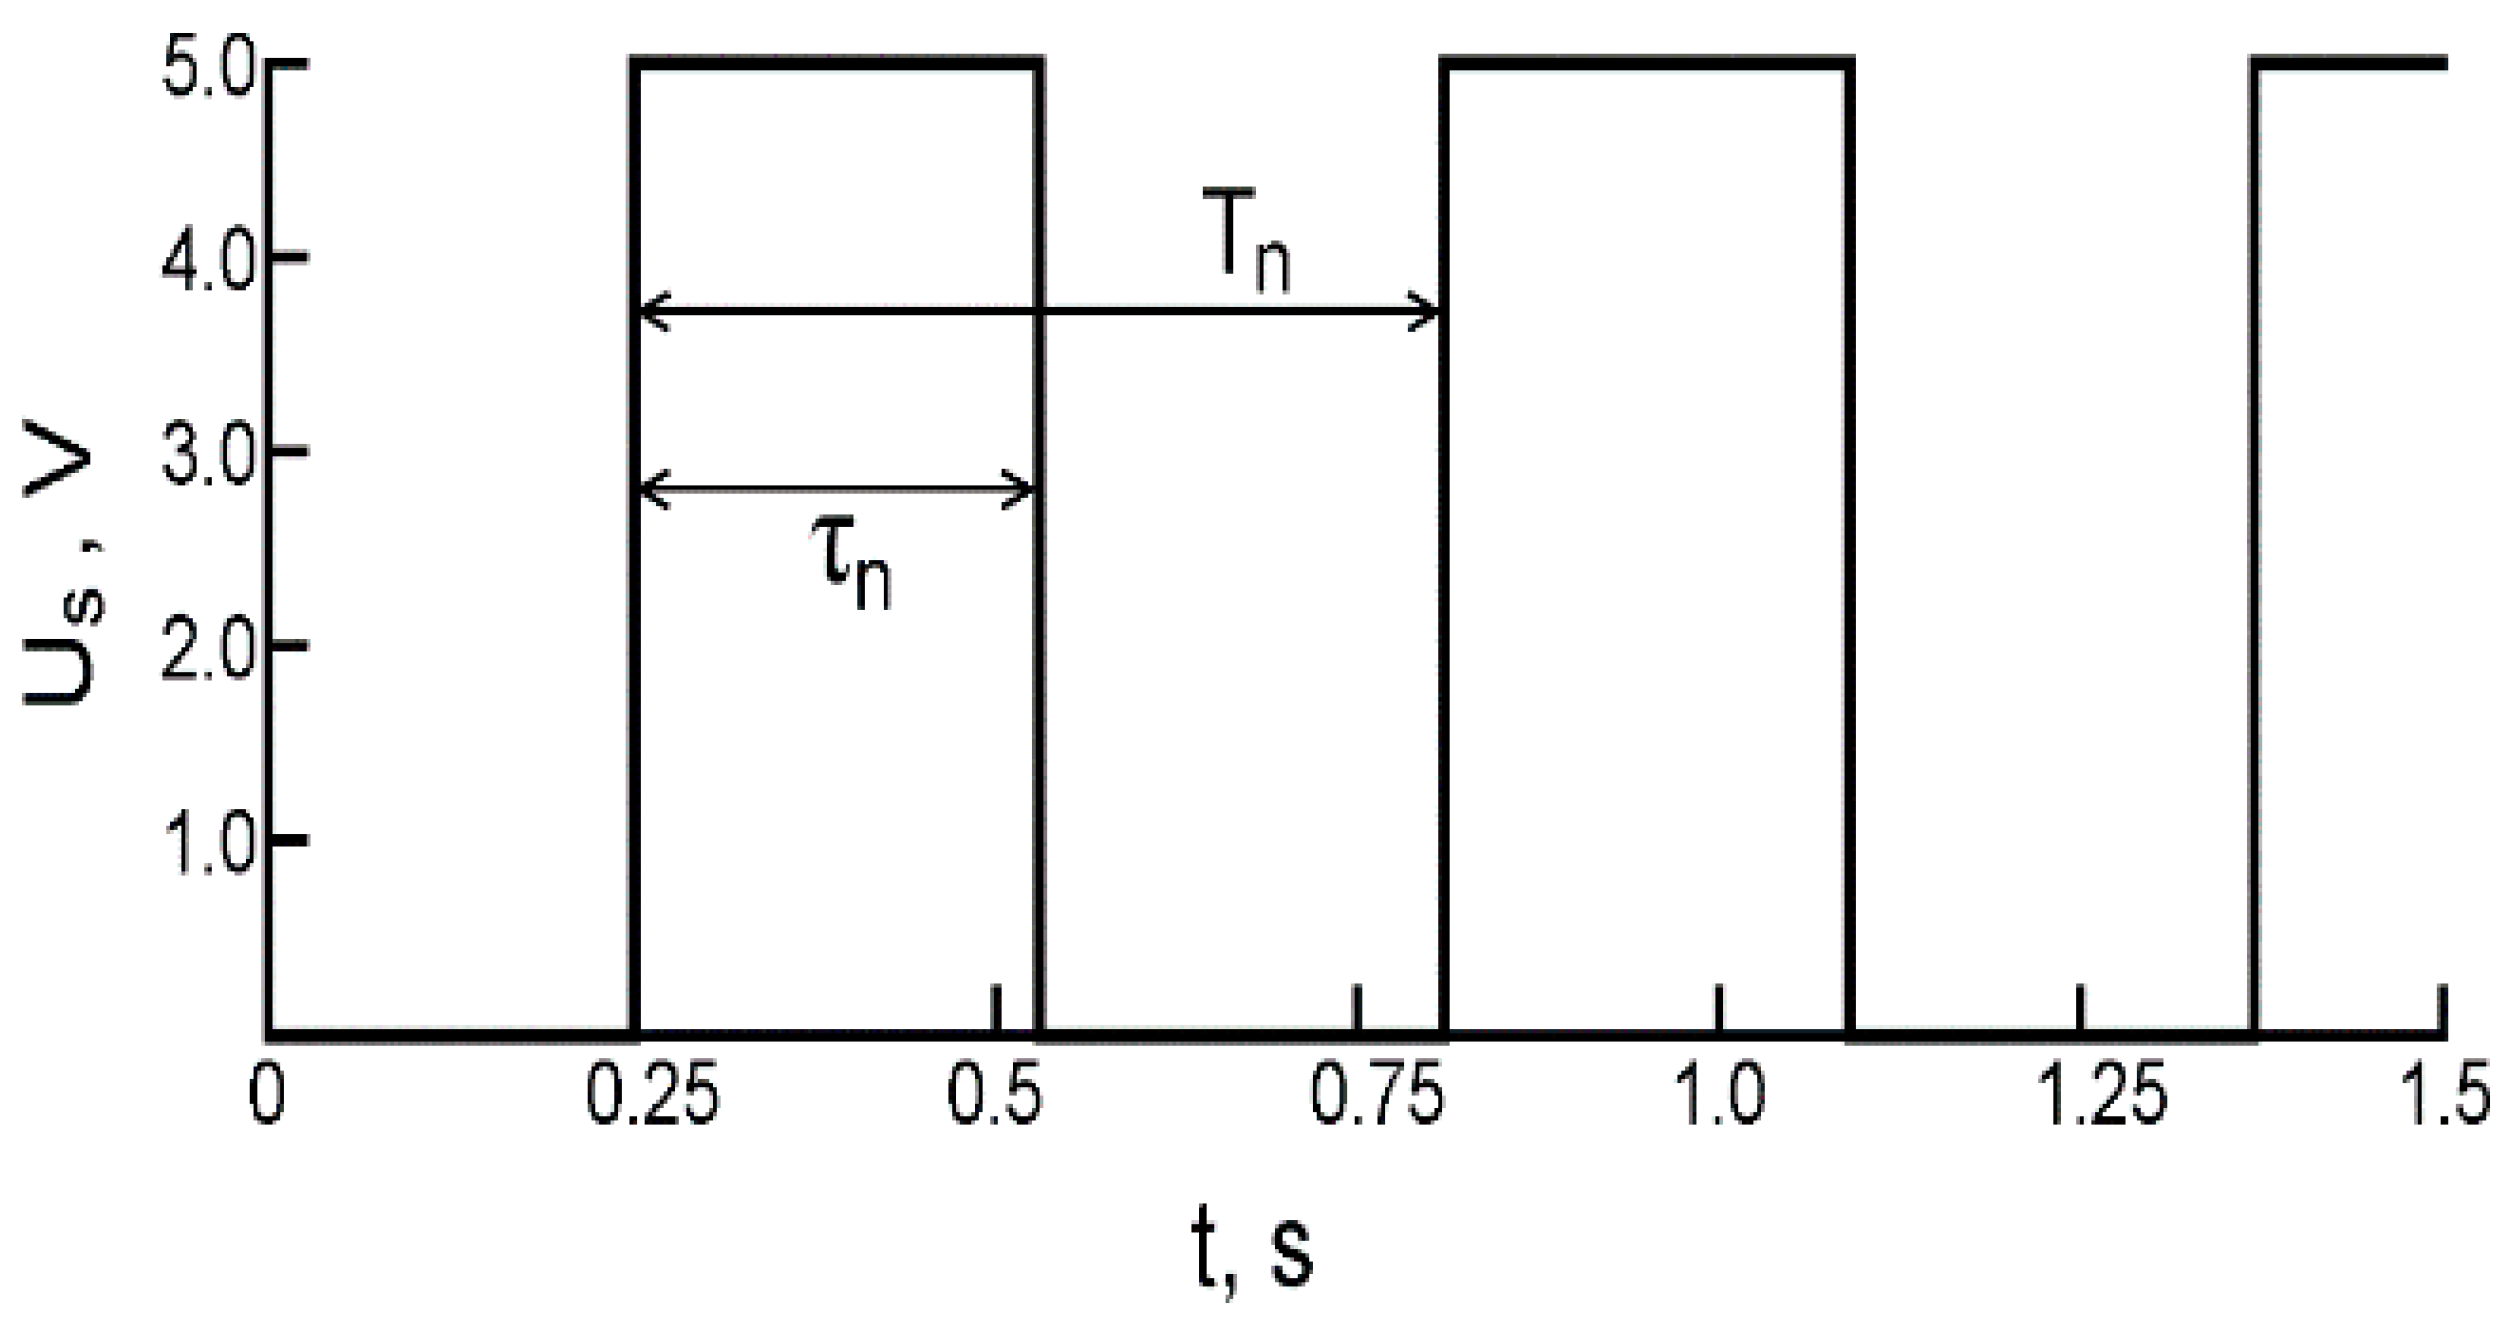
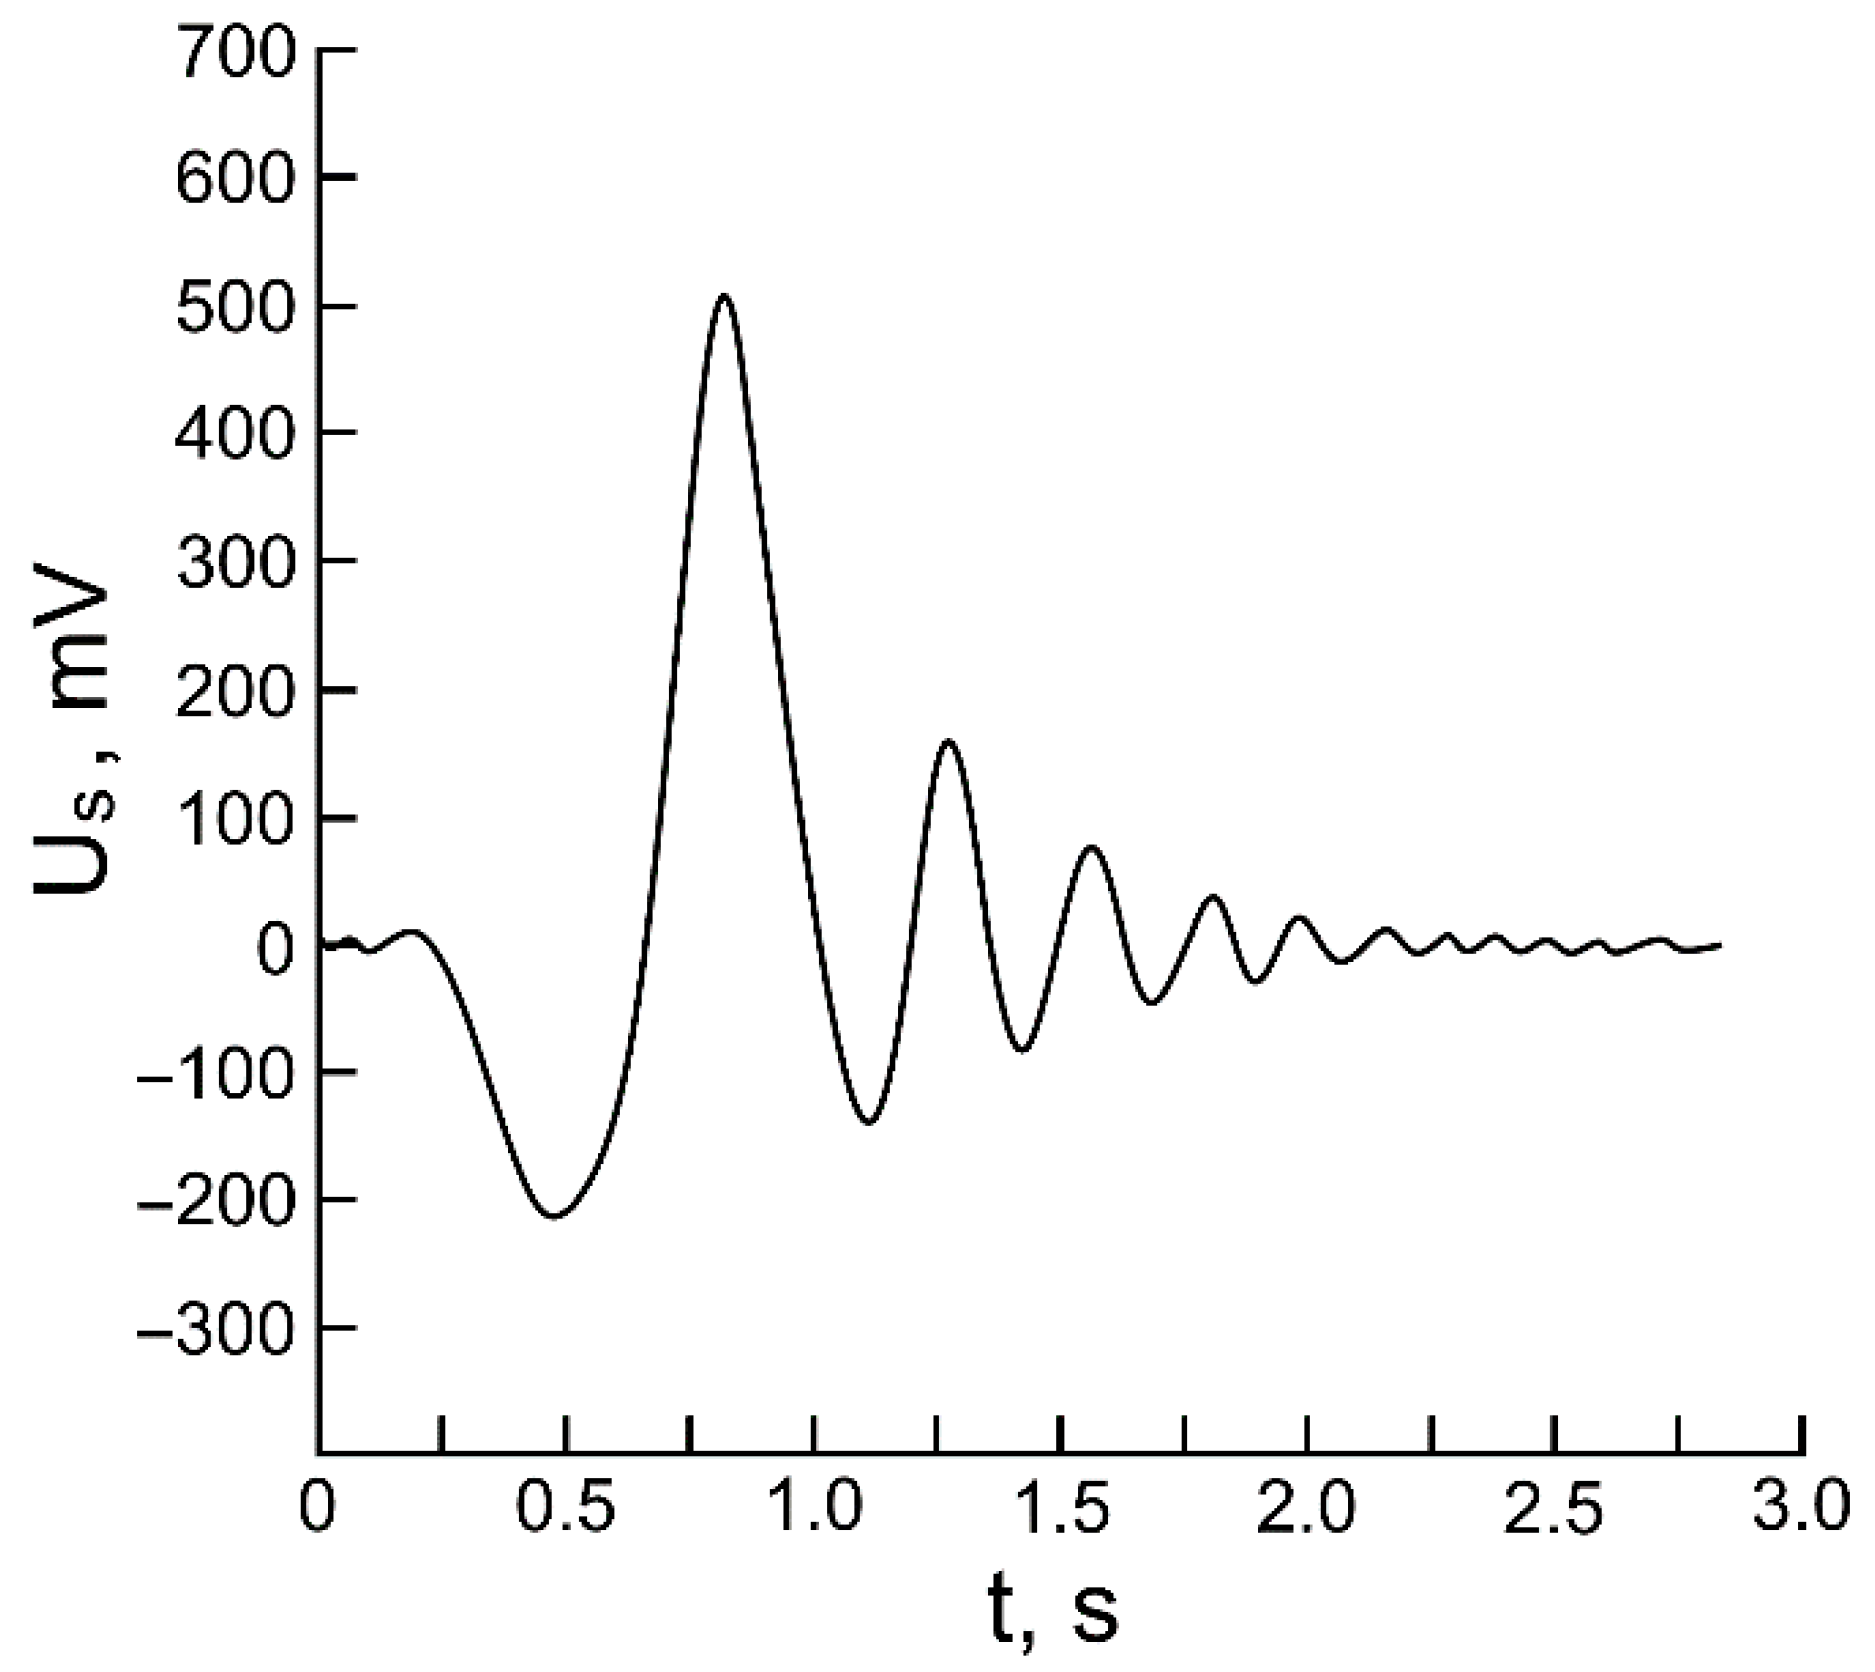
Table 1.
The results of measuring the consumption q (m3/h) of a liquid mixture of feedwater with air bubbles and insoluble particles (with ionic conductivity (polymer) and electronic conductivity (bitumen)) at a temperature of T = 324.6 K in the pipeline of the experimental stand using various devices and a measured volume.
| Measurement Number | NMR Flowmeter–Relaxometer | Electromagnetic Flowmeter OPTIFLUX 4030 | Measured Volume |
|---|---|---|---|
| 1 | 2.826 ± 0.027 | 2.799 ± 0.027 | 2.811 ± 0.071 |
| 2 | 3.754 ± 0.036 | 3.725 ± 0.036 | 3.738 ± 0.094 |
| 3 | 5.672 ± 0.056 | 5.628 ± 0.056 | 5.651 ± 0.141 |
| 4 | 8.936 ± 0.089 | 8.847 ± 0.087 | 8.903 ± 0.222 |
| 5 | 10.427 ± 0.103 | 10.301 ± 0.101 | 10.362 ± 0.258 |
| 6 | 12.137 ± 0.117 | 11.990 ± 0.117 | 12.064 ± 0.315 |
| 7 | 14.572 ± 0.142 | 14.398 ± 0.142 | 14.487 ± 0.362 |
| 8 | 16.843 ± 0.165 | 16.627 ± 0.165 | 16.734 ± 0.417 |
| 9 | 18.528 ± 0.183 | 18.272 ± 0.183 | 18.402 ± 0.460 |
| 10 | 20.016 ± 0.196 | 19.726 ± 0.196 | 19.877 ± 0.496 |
| 11 | 21.526 ± 0.213 | 21.198 ± 0.204 | 21.373 ± 0.534 |
| 12 | 23.021 ± 0.228 | 22.556 ± 0.212 | 22.754 ± 0.568 |
Table 2.
The results of measuring the consumption q (m3/h) of a liquid mixture of feedwater with air bubbles and insoluble particles (with ionic conductivity (polymer) and electronic conductivity (bitumen)) at a temperature of T = 324.6 K in the pipeline of the experimental stand using various devices and a measured volume.
| T, K | NMR Flowmeter–Relaxometer | NMR Relaxometer Minispec mq 20M | ||
|---|---|---|---|---|
| T1, s | T2, s | T1, s | T2, s | |
| 284.2 | 1.231 ± 0.011 | 0.695 ± 0.006 | 1.227 ± 0.004 | 0.689 ± 0.002 |
| 299.6 | 1.289 ± 0.011 | 0.731 ± 0.007 | 1.280 ± 0.004 | 0.726 ± 0.002 |
| 303.5 | 1.320 ± 0.012 | 0.748 ± 0.007 | 1.311 ± 0.004 | 0.741 ± 0.002 |
| 315.3 | 1.416 ± 0.013 | 0.827 ± 0.008 | 1.406 ± 0.005 | 0.819 ± 0.003 |
| 322.7 | 1.509 ± 0.014 | 0.899 ± 0.008 | 1.498 ± 0.005 | 0.886 ± 0.003 |
| 334.4 | 1.677 ± 0.015 | 0.938 ± 0.008 | 1.662 ± 0.005 | 0.928 ± 0.003 |
| 339.2 | 1.848 ± 0.017 | 0.951 ± 0.009 | 1.834 ± 0.006 | 0.942 ± 0.003 |
| 343.1 | 2.007 ± 0.018 | 1.089 ± 0.010 | 1.990 ± 0.006 | 1.078 ± 0.003 |
| 349.5 | 2.279 ± 0.020 | 1.252 ± 0.011 | 2.261 ± 0.007 | 1.239 ± 0.004 |
Publisher’s Note: MDPI stays neutral with regard to jurisdictional claims in published maps and institutional affiliations. |
© 2022 by the authors. Licensee MDPI, Basel, Switzerland. This article is an open access article distributed under the terms and conditions of the Creative Commons Attribution (CC BY) license (https://creativecommons.org/licenses/by/4.0/).
Share and Cite
MDPI and ACS Style
Davydov, R.; Davydov, V.; Dudkin, V. The Nuclear Magnetic Flowmeter for Monitoring the Consumption and Composition of Oil and Its Complex Mixtures in Real-Time. Energies 2022, 15, 3259. https://doi.org/10.3390/en15093259
AMA Style
Davydov R, Davydov V, Dudkin V. The Nuclear Magnetic Flowmeter for Monitoring the Consumption and Composition of Oil and Its Complex Mixtures in Real-Time. Energies. 2022; 15(9):3259. https://doi.org/10.3390/en15093259
Chicago/Turabian StyleDavydov, Roman, Vadim Davydov, and Valentin Dudkin. 2022. "The Nuclear Magnetic Flowmeter for Monitoring the Consumption and Composition of Oil and Its Complex Mixtures in Real-Time" Energies 15, no. 9: 3259. https://doi.org/10.3390/en15093259
Note that from the first issue of 2016, this journal uses article numbers instead of page numbers. See further details here.