Review

Wind and Solar Intermittency and the Associated Integration Challenges: A Comprehensive Review Including the Status in the Belgian Power System

by
Siavash Asiaban
1,
Nezmin Kayedpour
1,2,
Arash E. Samani
1,2,
Dimitar Bozalakov
1,2,
Jeroen D. M. De Kooning
1,3,
Guillaume Crevecoeur
1,2 and
Lieven Vandevelde
1,2,*
1
Department of Electromechanical, Systems and Metal Engineering, Ghent University, Tech Lane Ghent Science Park—Campus Ardoyen, Technologiepark—Zwijnaarde 131, B-9052 Ghent, Belgium
2
FlandersMake@UGent—Corelab EEDT-DC, Flanders Make, 9052 Ghent, Belgium
3
FlandersMake@UGent—Corelab EEDT-MP, Flanders Make, 9052 Ghent, Belgium
*
Author to whom correspondence should be addressed.
Energies 2021, 14(9), 2630; https://doi.org/10.3390/en14092630
Submission received: 9 March 2021 / Revised: 13 April 2021 / Accepted: 28 April 2021 / Published: 4 May 2021
(This article belongs to the Special Issue Electrical Engineering for Sustainable and Renewable Energy)

Abstract

:
Renewable Energy Sources (RES) have drawn significant attention in the past years to make the transition towards low carbon emissions. On the one hand, the intermittent nature of RES, resulting in variable power generation, hinders their high-level penetration in the power system. On the other hand, RES can aid not only to supply much more eco-friendly energy but also it allows the power system to enhance its stability by ancillary service provision. This article reviews the challenges related to the most intermittent RES utilised in Belgium, that is, wind energy and solar energy. Additionally, wind speed and solar irradiance variations, which are the cause of wind and solar intermittency, are studied. Then, recent techniques to forecast their changes, and approaches to accommodate or mitigate their impacts on the power system, are discussed. Finally, the latest statistics and future situation of RES in the Belgian power system are evaluated.

1. Introduction

Due to the depletion of fossil fuels, energy security awareness, increasing electricity demands, and ever-rising concerns about environmental issues, renewable energy sources attract more attention as time goes by. For example, oil and gas reserves of the UK’s North sea are in decline as the peak of extraction has already occurred in 2003 [1]. In [2] the global peak of extraction of crude oil and natural gas liquids is estimated to happen between 2009 and 2021. In terms of coal, the peak timing of the worldwide production is predicted to occur between 2011 and 2047 on an energy basis and between 2010 and 2048 on a tonnage basis by [3]. Besides, it is projected that the gas peaks between 2030 and 2035 by [4,5] and between 2024 and 2046 by [2].
Regarding the environmental matters, when fossil fuels are combusted, in the burning process, their carbon combines with oxygen, and Carbon Dioxide (CO 2 ) is released [6]. In [7,8], it is shown that climate change relates directly to CO 2 in the atmosphere as it traps radiated heat from the surface of the earth and raises the temperature. The authors of [9] reported an average temperature rise of 0.6 °C over the last century and forecast 2–4 °C in this century while in the Paris Agreement [10] 1.5 °C is defined as the threshold for the temperature rise, and Intergovernmental Panel on Climate Change (IPCC) already warned about the consequences of passing this limit [11]. Not only that, among the three mediums in which CO 2 is stored, namely atmosphere, biosphere, and oceans, almost 93% of CO 2 can be found in ocean waters, and the gas can easily move into and out of a place to the other one [12]. When the ambient temperature rises, the temperature of the oceans increases respectively, reducing their ability to keep CO 2 and, therefore, releasing more CO 2 to the atmosphere. This has a knock-on effect on the environment as it traps more heat, leading to more atmosphere temperature rise, which again increases the temperature of oceans [8].
Considering the facts mentioned above, switching to an alternative energy supply seems inevitable. Not only renewable energy is a clean and eco-friendly form of energy, but also the resources are abundantly available, which makes them a promising alternative for fossil fuels. Also, energy security is of paramount importance globally. With a large portion of proven oil reserves of the world situated in the Middle Eastern countries, the tendency towards switching to reliable alternatives is increasing in other countries [13]. Another attractive advantage is that RES provide a substantial number of job opportunities. International Renewable Energy Agency (IRENA) reported that the number of provided jobs by RES in 2019 was 11.46 million, with 9% and 4% growth compared to the years 2017 and 2018 consecutively [14]. Moreover, IRENA projects 42 million jobs provided by the RES by 2050 [15]. Being offered in various formats, RES could be benefited at least in some parts of each country, the selection of which mostly depends on the geographical location and weather conditions. Figure 1 shows the cumulative installed capacity of RES in three different countries situated in different continents with dissimilar weather conditions, namely New Zealand [16], Belgium [17] and Uruguay [18]. The three countries are chosen due to their unalike climate and seasonal weather variations. It can be seen that depending on the location of the countries and weather conditions, various renewable energy sources have been utilised.
So far, different resources for energy conversion have been introduced, among which solar energy, wind energy, tidal energy, hydro energy, geothermal energy and bioenergy are the most popular ones. The term ’renewable energy’ is dedicated to the sources that are sustainable and endless in nature, meaning that although, say wind energy, never runs out, it relies on a particular weather condition, which in this case is the wind strength needed to be strong enough to be able to rotate blades of a turbine. As another example, a clear sky is needed by solar panels to get the required radiation components to generate electricity. This introduces a major drawback of the RES, which is intermittency [19,20,21]. However, many efforts have been put to address this problem for intermittent sources and, where possible, accommodate or even mitigate the variability of their output power. Additionally, from the electrical grid point of view, the integration of some of the resources in the energy system is a challenging task. This stems from the intermittent output of some RES since it significantly affects the voltage, frequency and power quality of the electrical systems. Nevertheless, it must be stated that by providing ancillary services, they could increase the stability of the power system [22]. Although consumers, depending on the adopted incentive measures of governments, could save money by using renewable energy, related technologies are more expensive upfront compared to conventional ones. To combat the fluctuating nature of RES, energy storage systems have been introduced [23,24]. Yet, they could be expensive, especially for large-scale capacities.
All in all, the advantages of RES indeed outweigh the disadvantages. That is why studies demonstrate that the attitude of the public towards the RES is satisfactorily acceptable, and the trend of a positive outlook is swelling in most countries [25,26,27]. Nevertheless, public awareness still needs to be raised [28].
In this article, a comprehensive review is conducted on the most intermittent RES used in Belgium, that is, solar energy and wind energy. It must be noted that hydro-power is benefited in Belgium as well. Nevertheless, due to the small share of it compared to wind and solar output power, in this article, it is not discussed. Additionally, there is less predicted room for improvement of hydro-power in Belgium because of the fairly flat topology of the country. Apart from that, the tendency towards utilising bioenergy is increasing in Belgium. However, as it is far more predictable than wind and solar energy, and the focus of this article is on intermittent RES, it is excluded in this study. Wind and solar energy are two of the proven technologies for a clean energy production. Nevertheless, to achieve a reliable operation of the power system and avoid the degradation of frequency response, studying their negative impacts as well as the positive effects on the grid is of significant importance for the power system operators. Furthermore, it is crucial to identify the roots of the volatile nature of wind speed and solar irradiance as it leads to the accommodation or even mitigation of the intermittency of wind and solar output power. As this article is based on the intermittent RES that are used in Belgium, the status of the Belgian power system is evaluated as well. In this article, the authors have used the most recent technical reports as well as the latest and most cited scientific sources. The rest of the article is organised as follows—Section 2 assesses the impacts of the volatile nature of wind and solar energy on the power system. Section 3 and Section 4 are dedicated to a thorough review of the mentioned renewable sources, that is, wind and solar, each of which starts with a history and milestones of the source harvesting, followed by the statistical investigation of the source in the world. What is more, in these sections, a short assessment of the COVID-19 impact on the RES progress is provided to evaluate the resiliency of the source. Then, the variations of wind speed and solar irradiance are appraised. In Section 5, the state-of-the-art methods used to forecast wind speed and solar irradiance are investigated. Section 6 discusses the technologies to combat wind and solar energy volatile nature by assessing the existing approaches for accommodating or mitigating the intermittency. Subsequently, Section 7 investigates the current status of the Belgian power system concerning the RES dominancy as well as the goals of the country for decarbonisation and strength of its power system. Finally, in the last section, a comparison between wind and solar energy technologies are made and conclusions are drawn.

2. Intermittency and the Power System

The intermittent nature of some RES is a hindrance for high penetration of them in the electrical grid. That is, the erratic wind and solar output power, which is the result of wind speed and solar irradiance variations, causes some challenges for power system reliability and stability such as overvoltages and voltage unbalances occur in the distribution network [30,31].
The primary goal of a system operator is to reliably match the electric generation and demand at the lowest possible cost at all times. The intermittent nature of wind and solar power has some inevitable impacts on the power system, which depend on the size and inherent flexibility of the power system as well as the penetration level of volatile RES in the grid [32]. The impacts of the varying output power of wind and solar on the grid can be classified into two main groups—short-term, which includes balancing the power system at the operational time scale (minutes to hours), and long-term, which incorporates providing sufficient power during peak load situations [32].

2.1. Power System Reserves

The first short-term influence on the power system is the negative impact of wind speed and solar irradiance uncertainty on system reserves. Generation and demand need to be balanced at all instants. Utilities carry operation electricity reserve within the power system to compensate for the sudden fail of generation and unexpected load variations. When determining the amount of operating reserve, any unpredictable demand or generation fluctuations must be taken into account. Inevitably, as a result of the changing nature of wind and solar energy, the amount of scheduled operating reserve must be increased to regulate the system adequately, leading to a higher cost of integration [33]. In Figure 2, the resulted change in the reserve of the power system is illustrated [34]. As shown, with the penetration of the intermittent RES, in this case, wind energy, the reserve capacity has to be increased to compensate for the RES uncertainty.
Several studies have investigated the aforementioned impact and possible solutions to avoid the undesired increase in the reserve capacity as a result of the intermittent RES penetration in the grid. The authors of [36] modelled this impact and compared the increase in the power system reserve as a percentage of the wind penetration level of six different models. They concluded that up to 30% wind penetration level, the primary reserve capacity increases by 0.3–1.0% of the installed unit capacity, while the reserve size could surpass 1% at the penetration level of 40%. The difference in the calculated reserve sizes for the same penetration level is attributed to dissimilar reserve sizing methodologies used in different studies. Moreover, it is concluded that as a result of lesser predictability, a larger capacity of the reserve is required for the same solar Photovoltaic (PV) penetration as the wind. In [37], the reserve associated with the wind intermittency, referred to as wind power reserve, is quantified. In their case study with 100 MW load, a 10% wind power uncertainty, and a [−2,2] load uncertainty interval, it is deduced that wind power reserve increases linearly with respect to the wind penetration rate. Quantitatively, with the wind penetration rate (output power of wind/load) ranging from 0% to 50%, wind power reserve (defined as the ratio of the wind power reserve and the load) varies from 0 to 0.1. However, with the higher wind penetration level in the grid, which results in less generation of conventional units, the operating cost of the power system can be reduced from 0 to more than 25% for the wind power penetration rate ranging from 0–50%.

2.2. CO 2 Emission

The second short-term impact of wind and solar intermittency is on the expected reduction of CO 2 emissions. Theoretically, it is expected that when a conventional plant generating a specific amount of power is replaced by, for instance, a wind power plant with the same generation capacity, the CO 2 emissions related to the conventional plant are replaced by the CO 2 emissions associated with the wind plant. However, it is not the case in practice. The amount of the reduction in CO 2 emission relies on what sort of production or fuel is replaced by the wind power plant. What is more, conventional power plants are designed to operate at a specific output level at which their performance is optimised. Nevertheless, as a result of the penetration of intermittent RES in the power system, the ramping rate (the ability of a generator to change its output) of on-line generators has to be increased, or their number of start-ups and shut-downs increases to follow the load variations as well as the output fluctuations of RES. For example, it may happen that while demand increases, the output power of intermittent RES decreases, or vice versa. In both situations, an apparent increased rate of change in the load of the system occurs, leading to non-optimal performance of conventional power plants [33,38]. Therefore, the efficiency of power plants decreases and their CO 2 emissions rises, as shown in Figure 3 [35].
The authors of [35,36] compared a few studies and showed that at intermittent RES penetration levels (percentage of annual load) of 11% (wind), 23% (wind-solar), and 33% (wind-solar), the average increase in specific CO 2 emissions of thermal plants are 7%, 2.3%, and <1%, respectively. However, it is deduced by [35] that despite the reduced reduction in expected CO 2 , still integrating RES in the power system has a significant positive impact on the CO 2 emission reduction.

2.3. Power System Losses

The third short-term effect is that intermittent RES can affect transmission and distribution losses and, consequently, increase the costs. Depending on where wind farms and solar plants are located, concerning the voltage level of the integration point and distance to the load, this could be either a positive or negative effect. The authors of [32] claim that in the UK, with the concentration of the wind power production in the north, estimated extra transmission costs would be doubled to 2 €/MWh and 3 €/MWh at a penetration level of 20% and 30%, respectively. In [39], it is reported that based on an eighteen months experience and monitoring daily forecasted transmission losses, an increase in losses during high wind speed hours and decrease in the noon, when PV generation was at its peak, was observed. However, in their observation, days with bad weather conditions, such as rainy or snowy days, are excluded because of additional corona losses of the transmission lines. Based on their model, the impacts of wind intermittent output in one month is resulted and depicted in Figure 4 [39].

2.4. Power Curtailment

The fourth short-term impact stemming from wind and solar power intermittent nature is when their output power exceeds the amount that can be absorbed and utilised safely by the power system, taking place due to high wind speeds and clear days. To provide frequency, voltage, and in general, electric grid stability, a certain number of conventional plants must remain on-line at any time instant. Inevitably, when the output power of solar and wind generation units goes above a certain threshold, curtailment of their power is required. The authors of [32] stated that approximately 10% energy penetration level is the beginning point where curtailing wind power may be necessary. However, it is a rough estimation and still greatly depends on transmission line capacity and infrastructure, demand, and transmission capacity to neighbouring countries. The authors of [40] identified the curtailment ratio of a few countries, that is, the ratio of curtailed energy and summation of wind and PV generation. In a six-year period, it is shown that at the penetration ratio (the ratio of summation of wind and PV generation and total generation) of 2.5–13.8%, the curtailment ratio varied from 9.7–0.3% in Italy. In contrast, during the same period but with one year difference in Spain, the penetration ratio increased from 10.9% to 25.3%, with the curtailment ratio ranged from 0.3% to 1.6%. The authors of [41] analysed the curtailment ratio of wind power in some countries. In their study, in China, Germany and Ireland at the penetration levels of 2.6%, 9.8% and 22.5%, respectively, the curtailment ratio was calculated 11%, 0.7% and 3%, successively. The fluctuating behaviour of curtailment ratio with respect to the penetration level in different countries is justified by [42], where it is stated that countries with high curtailment levels suffer from a lack of sufficient transmission capacity. Notably, the curtailment levels vary significantly by region. As a result, in the areas with more insufficient transmission capacity and infrastructure, by enhancing the transmission capacity and grid infrastructure as well as adding some extra technologies and interconnections to provide more flexibility for the power system, this could reduce considerably. Nevertheless, it is worth mentioning that the system operator can also benefit from the curtailment to address the uncertainty issue of intermittent RES.

2.5. Ancillary Services

The fifth short-term impact of the RES on the power system is their effects on the characteristics of the grid. As mentioned before in this article, the dominant difficulty in the transition to RES is related to the intermittent and unpredictable nature of renewables and the non-dispatchable characteristic of these sources, resulting in mismatching between electricity generation and electricity consumption. Moreover, liberalisation of the electricity market and the increased capacity of transactions have led to large fluctuations in the electricity price and complicate managing the security and reliability of the power system [43]. RES can help the power system by providing Ancillary Services (AS). Therefore, ancillary services are required to dynamically address the mentioned problems and ensure the power system quality and safety. Ancillary services generally can be classified into several groups, that is, frequency control, voltage control, and emergency control services [22]. Wind and solar energy sources become extremely engaging to participate in electricity markets. The authors of [44] considered the feasibility of renewables in developing the strategies for sustainable growth. In [45], the authors discussed the possibility of wind power integration in Denmark by supplying the full range of relevant frequency and voltage control. The provision of ancillary services by wind generation resources in the United States is investigated in [46]; the possibility of both inertia emulation and primary frequency support was summarised, along with the impacts of different control architectures. The economic profitability of wind technology as a potential participant in the Spanish secondary regulation market is analysed in [47]. In [48], a wind power trading model, including a regulation strategy, is proposed for the day-ahead California electricity market. The fundamentals of grid code requirements and wind turbine control methods for frequency control participation in Ireland and the UK is investigated by [49]. In addition to wind energy-based ancillary services, a control strategy has been suggested in [50,51] for PV generators to adjusting their active power outputs for frequency regulation. Moreover, a state-space dynamic model is proposed in [52] for PV systems with full ancillary services support. In [53], a reactive power regulation method is suggested to provide ancillary services by PV inverters using three-phase control strategies.

2.6. Protection and Control Systems

The last short-term effect of RES on the grid is their effect on the protection and control systems. This stems from the fact that the dynamic features of the power system are changing ceaselessly because of the rapid integration of RES into the network. Protection, automation and control functions that are defined for relays have to be kept up-to-date in accordance with the changing power system characteristics. Thus, following a reconfiguration in the grid, the protection devices need to modify their operational settings. Protection is related to maintaining the grid stable state against abnormal incidents. On the other hand, the control system is associated with providing access to alter the state of any equipment to preserve the normal operation of the power system [54]. The authors of [55] investigated the impact of RES on the performance of transmission line distance protection, referred to as R21. In this study, the setting of R21 is assessed and based on three studied benchmark studies, it is concluded that wind farms affect the operation of distance protection which varies with respect to the fault type, fault location and wind generation level. Furthermore, the necessity of revising the protection schemes based on updated models of the grid is highlighted. In [56], the behaviour of power swing protection in presence of large scale integration of wind generation is studied. Aiming to ensure the efficiency of the protection scheme, the authors conducted a qualitative study through investigating case studies and concluded that wind generation results in the increase in the probability of power swing blocking false operation and may alter the location of the electric centre of the power system. The authors of [57] conducted a study on the effects of Distributed Generation (DG) on distribution grids. They compared various protection schemes and divided the strategies to mitigate the impact of DG on the distribution network into two groups: maintaining the conventional protection strategies and modifying the current strategies. While the former approach minimises the cost and operational downtime of industrial consumers, the latter is more expensive and paves the way for further penetration of DGs into the grid. Moreover, stemming from the multidirectional power flow in the power system because of DGs, it is essential to benefit from directional overcurrent relays.

2.7. Power System Reliability

The long-term impact of RES is on the power system adequacy. In general, the reliability of a power system can be assessed by three terms: reliability, security and adequacy [58]. Reliability is defined as all approaches to deliver the desired amount of electrical energy to all points of utilisations in the power system. Security is a measure to evaluate how a power system can withstand unanticipated occurrences such as loss of any elements in the network or probable faults like short-circuit in a part of the grid. Finally, adequacy is a measure of the ability of a power system to supply the electrical energy of customers and meet load demand within limited voltage and frequency ratings while considering operating constraints. Considerable desire to integrate RES into the power system can affect the reliability of the grid due to the volatile nature of RES. Thus, it is crucial to study the impacts of the intermittent RES on the overall system reliability. The authors of [59] investigated RES effects on the power system to find out whether increasing the share of wind and solar PV in electricity generation has an adverse effect on the power system. Based on their empirical study in the U.S., they concluded that at first, increasing the net generation from wind and solar PV has a negative impact on the grid reliability. Nevertheless, in case that their total net generation surpasses 1200 GWh, the duration of disruptions is predicted to lessen. Moreover, the marginal impact of wind and solar PV on the power system reliability is evaluated in this study. It is deduced that if the net generation from wind and solar PV increases by one GWh, the customers that are fed by suppliers who provide less than 1200 GWh of their net generation from wind and solar PV may experience power system outages lasting less than one minute.
Capacity credit is an index to measure the amount of load that can be supplied on the power system by a generation unit with no increase in the Loss Of Load Probability, known as LOLP in the literature. LOLP is the probability of a Loss Of Load Event (LOLE) happening in the power system. In fact, the capacity credit of a generating unit shows the contribution of that unit to the adequacy of the power system and its capability to increase the reliability of the power system [60]. Capacity credit is often expressed as a percentage of the capacity of the installed generation unit. It goes without saying that capacity credit reduction leads to a higher amount of capacity required to maintain system adequacy [35]. In [61], based on some studies, it is concluded that for low penetration levels of <5%, the capacity credit of wind energy is almost equal to the average wind power. At larger wind contribution levels, such as >40% of the generation, the capacity credit goes towards a constant percentage, which is determined by the LOLP without wind energy and its probability of having zero output power. Moreover, in a power system with a few large power plants, the capacity credit of wind energy tends to be higher than a power system consisting of many small generation units. Besides, distributing a wind farm over a wider geographical area can raise the capacity credit about 20% over its value for just one site. Finally, a good correlation between wind power and demand, which is not always the case, can raise the capacity credit by about 20%. The authors of [62] investigated capacity credit of PV and wind in the Moroccon power system at the penetration levels of 16%, 20% and 27%. In all three cases, the mentioned penetration levels consist of 21.8% of PV and 78.1% wind. The calculated capacity credits are 30.0%, 26.6% and 23.7%, respectively. Additionally, it is concluded that as penetration level increases, capacity credit decreases and its value saturates. In Table 1, the RES quantitative impacts on the power system and their variations with respect to the RES share, which are researched in different studies, are tabulated.

3. Wind Energy

In this section, the most notable milestones in the realm of wind energy are evaluated, and approaches for wind harvesting are compared both qualitatively and quantitatively. Subsequently, wind speed variations resulting in the generated power fluctuations are investigated.

3.1. History and Improvements

Exploiting wind energy initiated by using windmills. While some studies suggest that the first idea of wind energy utilisation was by a wind-powered instrument in Egypt either in 1st century A.C. or B.D. [63], some others doubt about its function, structure and even existence [64,65]. The second known reference to windmills dates back to the 9th century A.D. when in the Persian part of Seistan (located in Iran) they were in use [66] and later on in the 12th century, windmills appeared in England, Europe [67]. However, for some reasons, such as being non-transportable and non-dispatchable, windmills were replaced by coal when the Industrial Revolution happened. In the late years of the 19th century, with the emergence of electrical generators, again windmills were used to rotate generators. In the following years, the authors of [68] suggested the three-blade wind turbines, which resembled today’s existing turbines, instead of their two-blade counterparts, as they were superior to two-blade ones in that they could result in far less vibration. The next breakthrough could be considered at the end of the 20th century, when supporting technologies made remarkable improvements as well, such as aerodynamics, material science, power electronics, control engineering, computer science, to name but a few [69].
In general, wind energy harvesting can be categorised into onshore wind and offshore wind energy, with the former is benefited on land and the latter in bodies of water, such as in the oceans. The first emerged commercial wind turbine was onshore, built in the late years of the 1800s, while almost one century later, an offshore wind farm consisting of 11 turbines evolved in 1991 in Denmark [70,71]. Although onshore wind turbines have reached maturity due to the sooner evolution and, currently, most of the existing wind farms are onshore, offshore harvesting has drawn attention in the past years as well due to its desirable features. Not only the wind speed is higher in offshore areas, but also it is more predictable and consistent, leading to the fatigue of the turbine becoming less critical and an increase in the lifetime of the infrastructures. What is more, they do not occupy any land; therefore, noise emission becomes less significant and there is less visual impact on the landscape. On the contrary, because of the turbines’ special place, the costs of the required technology are higher than onshore turbines. This also adds additional maintenance needed for the turbines, which is more challenging and time-consuming than onshore ones [71,72].
The cumulative onshore and offshore installations of Europe and the world are shown in Figure 5 [73]. By the end of 2020, globally, China with 273.0 GW, U.S. with 117.7 GW, Germany with 54.4 GW, India with 38.5 GW, and Spain with 27.0 GW were the leading countries in the onshore market. On the other hand, concerning cumulative offshore installations up to the end of the same year, the UK with 10.3 GW, China with 8.9 GW, Germany with 7.7 GW, the Netherlands with 2.5 GW, and Belgium with 2.2 GW were the top five countries [74].
Today, the average size of the onshore wind turbines being manufactured is around 2.5–3 MW, which can power more than 1500 average European Union (EU) households. For their offshore peers, in 2019, the average size of installed offshore wind turbines in Europe was 7.8 MW, with a 1 MW increase compared to 2018 [75,76]. It is projected by [77] to have 4–5 MW and 12 MW ratings for onshore and offshore commissioned turbines, respectively, by the year 2025. However, Vestas has recently announced a new turbine, that is, the V236, with a rated power of 15 MW, which is expected to be installed in 2022 [78].
Another notable point worth mentioning is the wind energy reaction in the face of unprecedented times due to the COVID-19 crisis investigated by [79,80]. While the fossil fuels industry faced market fluctuations during the pandemic, the wind energy sector showed a relatively stable reaction. In the pre-COVID projections for the year 2020, new wind power capacity installations of 75.5 GW was expected. While it was predicted to see about a 20% reduction in installations because of the pandemic, with new predictions and considering the installed capacity in the first half of 2020, only a 6% decrease is expected now. This shows the excellent resilience of the wind industry. Additionally, as some project completion dates were postponed to 2021, because of the pandemic, 2021 is expected to record in the wind industry with the projected power capacity installations of 78 GW.

3.2. Wind Speed Variations

Wind speed varies both in space and time. Spatially reasons are classified into three groups by [32], namely, global, regional, and local. Stemming from different altitudes and solar insulation, there are various climate regions on earth worldwide. From the regional perspective, whether plains, mountains or both surround a specific location, causes differences in the blowing winds. The size of the land and its distance to the sea is another influential regional factor. Locally, vegetation sort and the shape of land surface and its features, which is known as topography, have a leading role in the variability of the wind speed. However, based on many studies, such as [81] and confirmed by [32,82], mean wind power output has been estimated to have a 10% or less standard deviation from one 20-year period to the next, resulting in not a considerable uncertainty of the resource wind spatially.
In terms of temporal reasons, it is needed to split time into time intervals to use appropriate measures for predicting wind speed. In other words, while some approaches can forecast long-term wind speed, some others are only suitable for short-term predictions. Consequently, based on the prediction method, different time intervals are defined, ranging from seconds to years [32,83,84]. As far as wind speed varies on all time scales, that is, seconds, minutes, hours, days, months, and years, irrespective of the chosen duration of a time interval, the time intervals’ duration are chosen somehow that can be categorised into four main groups of very short-term (predicting from a few seconds to a few minutes), short-term (predicting from a few minutes to a few hours), medium-term (predicting from a few hours to a month ahead) and long-term (predicting more than a month ahead). In [32,82], wind variations are divided into turbulences, which is changes of wind in the order of seconds or minutes, diurnal, which is variations of wind concerning the time of day, synoptic, which is related to the passage of weather systems, seasonal and annual. Figure 6 shows peaks associated with turbulence, diurnal and synoptic temporal variations in a wind spectrum captured in the U.S [85,86].
In contrast to turbulences that are not predictable, seasonal and diurnal wind changes are predictable. In comparison with seasonal variations, annual fluctuations are less predictable, but their changes are small. Synoptic variations are predictable as well, but not more than a few days ahead. Additionally, each of these variation types has a different effect on the power system, which is beyond the scope of this article but is investigated in detail in [32].
It is worth mentioning that temporal variations of wind power can be smoothened by aggregation of wind turbine outputs, which positively affects both power system operation and power quality. In [32], it is stated that aggregation of wind power production lessens the temporal changes of wind in two ways—an increased number of turbines in a wind farm and the spreading of wind farms over a wider geographical area. Firstly, an increase in the number of wind turbines within a wind farm smoothens the negative effect of turbulences as wind gusts do not hit every single turbine simultaneously. This reduces the turbulence peak in Figure 6 [85,86]. The authors of [82] reported that ideally, with the number of turbines n, the percentage variation of the output power of turbines is reduced to n 1 2 , and resulted that to achieve a significant smoothing, the number of wind turbines does not need to be very large. Secondly, the distribution of wind farms over a wider area reduces the impacts of diurnal and synoptic wind peaks as changing weather patterns do not get to affect each individual turbine at the same time, meaning that by expanding the distribution of wind turbines, changing weather patterns face a larger land area [32]. Consequently, up and down ramp rates are much lower for aggregated dispersed wind farms in comparison with a single large wind farm [32]. The exact amount of smoothing effect of the distributing wind turbines significantly depends on local weather effects, and the total size of the aggregated wind farms land [32]. Nevertheless, for example, based on 10 min and 1-hour data of a site, it is reported by [87] that aggregation of wind power outputs of 17 dispersed wind farms is estimated to reduce the variability of the resultant output power by 60–70% in comparison with a single wind farm. In Table 2, temporal variation of winds and their predictability are summarised [82].

4. Solar Energy

Investigating solar energy more in detail, this section starts with the breakthroughs related to solar energy utilisation, followed by the evaluation of measures for solar electricity applications. Then, variations associated with the solar irradiance are discussed.

4.1. History and Improvements

The first practical use of solar energy is said that happened sometime between 287–212 B.C. [88]. However, from the electricity point of view, the first milestone of solar energy dates back to 1839, when it was found out that light can swell electricity generation in two metal electrodes that are placed in an acidic solution, defined as photovoltaic effect [89]. Later in 1873, it was discovered that selenium could act as a photoconductor, leading to another discovery work three years later when it was observed that selenium generates electricity when exposed to sunlight [90]. With benefiting from this, in 1883, the first solar cell made from selenium was created, with less than 1% efficiency [89]. Finally, in 1954, selenium was replaced by silicon, which is today’s used material for solar cells, and the first silicon photovoltaic cell was created, being able to power an electric device for several hours with 6% efficiency [91].
Solar energy can be benefited in various ways. In addition to the several applications of solar energy such as in heating buildings [92], heating water [93], ventilation [92,94] and even vehicular purposes like in cars [95], or bicycles [96], which are beyond the scope of this article, solar electricity has attracted significant attention in the past years. It can be divided into two main categories of PV solar system and Concentrated Solar Power (CSP).

4.2. Solar PV Systems

Being the primary technology for solar energy harvesting, PV solar system directly converts sunlight into electricity. In PV technology, consisting of semiconductors, solar irradiance is absorbed by the semiconductors. This leads to having the electrons released in them and flowing through the semiconductor, which causes electricity generation. Later, the generated direct current (DC) is turned to an alternating current (AC) using inverters. Figure 7 shows a general PV system [97].
As it can be seen in Figure 7, a general PV system consists of the following parts: PV arrays, which are responsible for the conversion of solar irradiance into electricity; a battery storage system for storing energy if it is needed; a controller to decide for either charging or discharging the storage system; DC/DC converters for increasing the voltage (if needed), or for Maximum Power Point Tracking (MPPT), usually using a Perturb and Observe algorithm, like a Hill Climber; and turning DC to AC for the use of AC load consumers using DC/AC inverters [97].

4.3. Solar Thermal Power Systems

In CSP plants, mirrors concentrate the solar irradiance onto a central point or line with a carrier fluid and produce heat and steam to generate electricity via a conventional thermodynamic cycle [98]. Based on the apparatus used for concentrating sunlight, CSP can be further divided into four groups—Parabolic Trough (PT), Solar Tower (ST), Fresnel Reflector (FR), and Solar Dish (SD).
PT, the most mature CSP technology with a parabolic cross-section and being linear in the third dimension, consists of parabolic mirrors that focus the solar irradiance onto the heat receivers which are mounted on the focal line. Both reflectors and receivers of the sunlight track the path of the sun from East (sunrise) to West (sunset) [98,99]. In ST plants, a large number of computer-assisted mirrors, known as heliostats, concentrate the solar irradiance onto a single receiver, which is situated on top of a central tower. Tracking of the sun in ST is done individually by each heliostat that is able to move over two axes [98]. Although FR plants are similar to their PT counterparts, they use flat or slightly curved mirrors to concentrate the solar irradiance onto a fixed linear receiver. In FR plants, mirrors are located at different angles and can follow the sun on a single or dual-axis regime [98,100]. Similar to a satellite dish in terms of shape, SD configuration consists of a parabolic dish that concentrates the sunlight onto a receiver placed at the focal point of the dish. In an SD system, both the dish and receiver track the sun at the same time [98,100]. Schematic of CSP plants, that is, PT, ST, FR, and SD plants are depicted in Figure 8 [101,102].
Initially, PT was the dominant used technology among the other CSP systems, accounting for more than 90% of the total installed CSP capacity. Nevertheless, due to the higher reachable temperature, leading to higher efficiency, and being more cost-effective compared to SD, ST has been favoured since 2010 [103]. Unlike PT and FR plants that get the sunlight focused on a focal line and reach maximum operating temperatures between 300–550 °C, ST and SD plants concentrate the sunlight on a single focal point and, consequently, can reach higher temperatures between 800–1000 °C. FR is the most recent CSP technology. The capacity factor of CSP plants can be enhanced by utilising a thermal storage system. Evidently, the higher the reachable temperature for a CSP technology, the more expensive the thermal storage system. Due to the relative simplicity, while the manufacturing and installation costs of the FR plants is less than PT plants, it is not clear whether FR generated electricity is cheaper than that of the PT. SD is superior to other CSP technologies in that it does not require cooling systems for the exhaust heat, making them suitable for use in water-constrained regions. Finally, high-temperature ST plants are potentially superior to other CSP technologies in terms of capacity factors, efficiency, heat storage, and costs and can provide cheaper electricity in case their complementary technologies make progress and more commercial experience is gained [98]. In Table 3, the main characteristics of CSP plants are summarized [98,100].
When it comes to comparing PV solar systems and CSP, the most notable point is the enormous difference between their generation. It is reported by [104] that, by the end of 2019, while cumulative solar PV deployment reached 578 GW, CSP deployment reached 6 GW, being at its infancy. A few facts can justify this: first, it is known that when solar irradiance enters the atmosphere, it is manipulated. Excluding the absorbed portion by the suspended particles in the atmosphere, they divide into three parts: direct component or Direct Normal Irradiance (DNI), passes unaffected through the atmosphere; indirect or Diffused Horizontal Irradiance (DHI), scattered by atmospheric particles as well as ground; and reflected component, which can be neglected, shown in Figure 9 [105]. The summation of these three components, which is the total solar irradiance incident on a horizontal surface, is called Global Horizontal Irradiance (GHI).
Contrary to solar PV, which collects all the three sunlight components, CPS only uses the direct component. Even though DNI represents up to 90% of the total sunlight during sunny days, it is negligible on cloudy days. Not only that, CSP plants can supply cost-efficient energy in regions with DNIs > 2000 kWh/m 2 /year, that is, Sun Belt regions. High DNIs, however, could be reachable at high altitudes too, where scattering is low. In the best regions in terms of DNI (DNIs > 2800 kWh/m 2 /year), the CSP generation potential is 100–130 GWhe/km 2 /year, which is roughly equivalent to the annual generated electricity by a 20 MW coal-fired power plant with a 75% capacity factor [98].
Secondly, the trend of investors choosing solar PV over CSP has led to remarkable declines in PV costs in the last ten years. According to IRENA statistics, for every doubling cumulative installed capacity of solar PV, its Levelised Cost Of Energy (LCOE) lessened by 36% between 2010 and 2019. Furthermore, crystalline silicon (c-Si) PV module price has decreased more than 90% since 2010 [104]. Lastly, PV systems are far easier to manufacture as they do not require much time or cost to be spent [106]. Additionally, a larger area is required by CSP plants for large-scale applications.
Nevertheless, it is worth mentioning that as CSP plants convert the energy of the sun into heat, thermal energy storage can be utilised with them to store energy and release it during cloudy days or at nights to generate electricity. This can combat the intermittent nature of the volatile RES, for example, solar PV and wind. On the other hand, as stated before, solar PV directly converts the sunlight to electricity, making it unable to use thermal storage systems and as mentioned before, storing electricity, especially at large-scale is still a challenging task. In Figure 10, the cumulative installed capacity of solar PV and CSP in the world and Europe are shown [73].
Globally, in terms of the cumulative installed capacity of solar PV in the year 2020, China with 253.8 GW, U.S. with 73.8 GW, Japan with 66.9 GW, Germany with 53.7 GW, and India with 38.9 GW were the top five countries. Considering solar thermal power cumulative installations, Spain with 2.3 GW, U.S. with 1.7 GW, Morocco with 530 MW, China with 521 MW, and South Africa with 500 MW were the leading countries [73].
From a resiliency point of view in the shadow of COVID-19, it was expected to have additional installations of nearly 107 GW in the year 2020. However, in the first two quarters of the year, 19.0 GW and 21.1 GW of new installations are reported by [107] respectively, decreasing by almost 25% and 9% with respect to the similar period in the year 2019 consecutively. Nevertheless, it is worth mentioning that due to stricter measures taken by governments in the first few months of 2020, and later, when the approaches were eased to some extent in the following months, it is expected to not witnessing a significant decline in the new installations, proving excellent resiliency of solar energy.

4.4. Solar Irradiance Variations

Like wind speed, solar irradiance varies both spatially and temporally. However, basically, the variability of solar irradiance that reaches the surface of the earth is mostly assessed by studying its consisting components, that is, DNI, DHI and reflections, among which the latter can be neglected.
From the spatial perspective, solar irradiance varies over distance, or changes in the position of the sun affect the solar energy systems output. The authors of [108] compared one-year daily and monthly averages of irradiance sums, that is, GHI, derived from satellite images of three sites in Germany. The first site, chosen as the reference, is compared with two other sites situated at distances of 55 km and 633 km, respectively. Although in the two closer locations, the captured GHI are not identical, they are closely related. Nevertheless, this is not the case about the further cases, and the difference in GHI patterns becomes more significant as the distance increases. It is also notable that daily fluctuations of all three cases around their monthly average value are substantial.
Notably, unlike PV generation fluctuations stemmed from the position of the sun, which is almost uniform, changes in the PV output power due to the motion of clouds are not uniform. In other words, in either consistently clear sky or overcast days, PV plants output variations are of minor importance, but it becomes considerable on partly cloudy days when GHI changes are more significant [109]. In [1], the effect of a passing cloud on irradiance in a summer’s day in the UK, which is shown in Figure 11, is clearly visible before 18:00. PV generation can decrease by more than 60 % in a matter of seconds as a result of a reduction in solar insolation when a cloud passes. Nevertheless, the time a passing cloud needs to shade an entire PV system depends on the PV system dimension, cloud pace, cloud height, and a few other factors. For instance, for a PV system with a rated capacity of 100 MW, the needed time by a passing cloud to shade the whole system would be in the order of minutes [109].
In addition to the presence of clouds which influence solar irradiance, other atmospheric conditions such as dust storms, water or ice concentration in a region, types of water particles or ice crystals, the amount of water vapour existing in the atmosphere as well as the aerosol type and its amount all have impacts on the solar generation [110].
When it comes to comparing PV and CSP plants, it is notable that due to the presence of a thermal mass, such as oil or water, variations in output power of CSP plants are less significant. The less dependency of CSP plants on the variations of solar irradiance stems from the fact that as a result of the presence of a thermal mass, such as oil or water, the output power of CSP plants is smoothened. The thermal mass acts similar to a storage system, making CSP plants inherently more capable of handling weather passages even without a major Energy Storage System (ESS).
Similar to wind power plants, in solar plants, the output fluctuations of the power can be smoothened by the aggregating solar plants. This occurs as by connecting solar plants, when a cloud passes, it does not get to affect the entire system simultaneously, or it may even leave some parts of plants unaffected.

5. Wind and Solar Forecasting Methods

Solar and wind energy forecasting is critical for the sustainable integration of these sources into the power system. Forecasting wind and solar energy provides the system operators with a better insight into the allocation of the resources, resulting in a secure and economic grid operation. Additionally, it can address the problem of intermittency as it gives the end-users an estimation of the future wind and solar generation. Besides, moving towards an inclusive and liberalised electricity market is impractical without accurately predicting the behaviour of these sources. Furthermore, understanding the forecasting errors is of paramount importance. In [111], it is concluded that wind power forecasting error has a serious impact on the fluctuations of the intra-day price. However, stemming from the volatility of RES, forecasting the behaviour of wind and solar energy, precisely, is a demanding task. Several methods are reported in literature that provide accurate short and long-term predictions (from a few minutes to the next few days). These methods can be categorised into four groups: physical-based models, statistical methods, deep learning-based algorithms, and hybrid methods [112]. Physical models are technically able to simulate the atmospheric dynamics according to natural laws and boundary conditions based on meteorological and geographical information [113]. However, when it comes to short-term forecasting, physical methods are not desirable due to their calibration requirement with extensive computational resources, especially in the occurrence of unexpected errors during prediction [114].
Aiming to find the mathematical relationship between time-series data of renewables, statistical methods are the second approach for forecasting wind and solar energy. The authors of [115] proposed a new Repeated Wavelet Transform (WT) based Auto Regressive Integrated Moving Average (ARIMA) (WT-ARIMA) model to predict the wind speed on very short time intervals. Time series ARIMA modelling is used in [116] to predict monthly radiations of the sun utilising remote sensing data obtained from National Aeronautics and Space Administration (NASA)’s POWER (Prediction of Worldwide Energy Resources). In order to reduce wind speed prediction errors, a novel approach is proposed in [117] that applies a sparse Bayesian-based robust functional regression model.
Forecasting models based on deep learning are able to overcome the barriers and limitations of the existing statistical forecasting models, which are mostly formulated as a linear model in dealing with longer forecasting time horizons. In [118], a developed forecasting model for short and long-term predictions of GHI has been suggested based on integrating the support vector machine and discrete wavelet transformation algorithm. A feature selection method is proposed in [119], which uses the Long Short Term Memory (LSTM) structure to lessen the errors of short-term wind speed prediction while decreasing its calculation time. A novel intelligent wind power forecasting method based on a fuzzy neural network is presented in [120], taking advantage of the Particle Swarm Optimization (PSO) algorithm as a new training approach. In [121], the authors proposed a hybridised deep learning framework that integrates the convolutional neural network for pattern recognition with the LSTM for half-hourly GHI forecasting. The authors of [122], investigate the performance of the ’Group Method of Data Handling’ type neural network algorithm in short-term time series prediction of wind and solar energy.
Despite the promising results of using deep learning methods in forecasting renewables, some challenges, for example, demanding parameter determination and computational complication, still remain. Therefore, hybrid models are improved to conquer the shortcomings and improve the performance of forecasting. One type of hybrid model takes advantage of data preprocessing and an optimal algorithm to enhance the performance of predictions [123]. In [124], the forecasting performance of two hybrid models, that is, ARIMA-Artificial Neural Network (ANN) and ARIMA-Kalman, are compared. In the hybrid ARIMA-ANN model, the ARIMA model is used to decide the structure of an ANN model. In the hybrid ARIMA-Kalman model, the ARIMA model is applied to initialise the state equations for a Kalman model. Both cases give a reliable performance, which can be employed in the non-stationary wind speed prediction. Another type of Hybrid model presented in [125] combines numerical weather prediction and statistical learning using multivariate post-processing procedures to forecast solar irradiance. The authors showed that the proposed method significantly reduces forecasting errors.

6. Accommodating or Mitigating Intermittency

Finding technological solutions to overcome the adverse effects of intermittent RES is a controversial topic in the literature. Not only the intermittent RES have a variable generation pattern on each certain day, but also they have fast short-time oscillations. Consequently, balancing both types of variation on a long and short time scale is inevitable. Although there are other ways to mitigate or accommodate intermittency, ESSs are of significant interest to date. Thus, in this study, mitigation or accommodation solutions are categorised into two classifications—solutions not-associated with ESSs and solutions associated with ESSs. The former can be further divided into Supply-Side Management (SSM) and Demand-Side Management (DSM).
By controlling the production of generation units, including the RES plants, it is possible to diminish the negative effects of intermittency of RES on the power system, known as SSM. The first way of accommodating the volatile output of wind and solar power was described in Section 3.2 and Section 4.4, namely aggregating wind farms or solar plants, which reduce the variable output power of them to some extent. In Figure 12 the effect of aggregating wind turbines and solar plants are shown [126,127]. For the PV plants, assuming that the time-series are captured when the PV plants were operating at their rated capacity, for the aggregation of 5 and 23 sites, the maximum change in the output of all PV plants in 1-min falls to 40% and 20% respectively, which is far below than 80% that occurred for a single site [127].
Furthermore, wind speed and solar irradiance forecasting methods that were illustrated in Section 5 can smoothen the effect of intermittency as they provide the system operators with an approximate insight of wind and solar near-future generation. Besides, the authors of [128] examined the seasonal and annual patterns of wind and solar power output and found out that they can complement each other in some periods. That is why several studies have focused on combining these two intermittent sources while considering evaluating the system reliability and challenges for connection of the system to the grid [129], assessing the hybrid-system cost [129,130], the capability of meeting load demand [131], CO 2 emission [132], sizing the system [131] and so forth. The optimal allocation of generation mainly depends on the region where the hybrid-system is installed. In general, any generation unit or technological equipment that can provide a complimentary wind or solar generation pattern can be utilised in combination with them to reduce intermittency. That is why combining power plants that have a more flexible output, for example, gas turbine, benefiting from Plug-in Electric Vehicles (PEV) if a moderate portion of PEV owners are convinced to provide service [133] and using diesel generators in combination with other less intermittent RES can reduce output fluctuations of them [134]. In order to decrease the added reserve capacity due to the presence of wind energy, [135] proposed a multi-objective stochastic optimization to provide wind farm operators with an optimal set-point of the wind farm. In this study, the two objectives are maximising the wind farm set-point and the probability of fulfilling the determined set-point in the real-time operation, leading to the reduction of the uncertainty of the output power. Discarding the redundant output power of the intermittent RES plants, power curtailment is another solution associated with the generation side to accommodate the intermittency. In addition to that, RES plants can aid the power system by providing ancillary services. Both of the aforementioned solutions were elaborated in Section 2. Finally, by benefiting from dispatchable power plants, that is, the plants that have a fast ramp rate, it is possible to compensate for the RES fluctuations. For this purpose, reliable power plants with high availability are required. Gas turbine generators, due to having the mentioned attributes, are the most desirable option to accommodate RES intermittency [136].
In terms of DSM, which is also referred to as demand-side response in literature, both on a residential and industrial scale, flexibility can be provided for the grid to some extent. In [137], DSM is categorized into two main groups: energy reduction programme, aiming to decrease the load through the more efficient processes or types of equipment; and load management programme, trying to modify the load pattern and encourage consumers to utilise less during peak hours by adopting incentive measures. The authors of [138] investigated the industry contribution to the grid, by co-optimising the operation of a chlor-alkali electrolysis process and concluded that the flexible operation of the electrolyser is beneficial for the power system.
ESSs can ease the large-scale integration of the intermittent RES. As mentioned before, it is not possible to synchronise demand and electricity production, especially with the presence of renewable generation units. That is, at some hours, RES power output is not sufficient when the load demand is at its peak or vice versa. Being able to store the surplus of intermittent RES when load demand is low and release it during peak hours, ESSs are one of the desiring options for mitigating RES intermittency, shown in Figure 13 [139]. Furthermore, ESSs can provide additional system service for the grid, making them a unique technology to be utilised in combination with RES [140,141].
Generally, ESSs can be classified into five main categories in terms of the form of energy in which electricity is stored—mechanical, electrochemical, chemical, electromagnetic and thermal. Each of them, depending on their materials, manufacturing process, and form of energy, can be further divided into sub-categories, shown in Figure 14 [142].
There are three commonly used technologies regarding mechanical ESSs, namely Flywheel, Pumped Hydroelectric Storage (PHES), and Compressed Air Energy Storage (CAES). As the name suggests, this type of ESS uses the mechanical form of energy to store and release electricity. Flywheel, consisting of a rotor that can be accelerated to the high speed of 20,000 to 50,000 rpm, stores the energy in kinetic form. Having the most maturity among other ESSs, PHES stores and releases energy in the form of potential via two water reservoirs at different heights. CAES uses off-peak electricity or surplus intermittent RES power to compress air in either under or above ground structures.
Electrochemical energy storage systems work based on reversible chemical reactions and store energy in the form of chemical energy. Redox Flow Battery (RFB), also known as Flow Battery, is an electromechanical cell that provides chemical energy by two chemical components dissolved in liquids. Battery Energy Storage Systems (BESSs) are among the most accepted technologies between storage technologies, consisting of individual battery cells connecting in series, parallel, or both. A battery cell consists of a negative electrode (anode), a positive electrode (cathode), and an ionic conductor (electrolyte), and based on the material used for them, various types of BESS have emerged. So far, Lead-acid battery, Nickel-Cadmium (NiCd) battery, Zinc-Bromide (ZnBr) battery, Sodium-Sulphur (NaS) battery, and Lithium-ion (Li-ion) battery have been the most common types of BESSs. The latter, that is, Li-ion battery, concerning the component of electrodes, can further be divided into Nickel Cobalt Aluminum (NMC), Nickel Cobalt Aluminium Oxide (NCA), Lithium Iron Phosphate (LFP) which are the popular materials for cathode, and, graphite and carbon black that are commonly used materials for the anode [143].
Chemical Energy Storage Systems (CESSs) benefit from the released energy of the chemical reactions. Using the energy of a fuel, Fuel Cell (FC) is the most well-known technology among CESSs. Many fuel types have been investigated in the literature and are suggested to be used in FC [144]. Due to the high energy density and other favourable attributes, Hydrogen Fuel Cell (HFC) has attracted attention in the past years [145,146]. However, as a result of the high electrolyser costs and fairly low hydrogen price, the direct conversion of electrical energy to hydrogen is not economically desiring [141]. Among other existing FCs, Proton Exchange Membrane Fuel Cell (PEMFC), Direct Methanol Fuel Cell (DMFC), Alkaline Fuel Cells (AFC), and Solid Oxide Fuel Cells (SOFC) are the most known ones [142].
Unlike other ESS types, in Electrical Energy Storage Systems (EESSs), no transformation of energy occurs. Instead, they store energy in an electromagnetic field by utilising Ultra-Capacitors (UC) or superconducting electromagnets in Superconducting Magnetic Energy Storage (SMES) systems.
The last category, that is, Thermal Energy Storage Systems (TESSs) storing energy in the form of heat, depending on the operating temperature, can be classified in low-temperature TESSs and high-temperature TESSs. The latter is categorised into three sub-groups: latent heat, sensible heat, and thermal-chemical sorption energy storage [142].
While SE and Flywheel have the highest efficiency among the other types of ESSs with 95–98% and 90–95% successively, HFC with 20–50% has the lowest. When it comes to the lifetime (cycle), Flywheel is superior to other types with near 100k-1M cycles. On the other hand, RFB (0.3–1.4k) and Lead-acid (0.25–2.5k) suffer from a short lifetime in terms of the number of cycles. Concerning response time, most of the mentioned ESSs have a fast response time in the order of milliseconds. However, the response time of PHES and CAES (in the order of minutes) and TESS (in the order of hours) are slower than others [142]. In Figure 15, the characteristics of the most common ESSs are illustrated.

7. Belgian Power System

Due to the mentioned reasons in Section 1, similar to many countries, Belgium is investing in switching to RES and has joined the Paris Agreement. Under the framework of this agreement, participating countries have defined and quantified their targets to reduce CO 2 and other greenhouse gas emissions. In the delivered pledges, which is called Nationally Determined Contributions (NDCs), 170 out of 188 participating parties (90% of the total) mentioned renewables, and 134 of them (71% of the total) quantified the renewable energy target. According to the NDCs, IRENA estimates a growth of 42% in the global installed capacity for renewable power generation within the decade, from 2523 GW in 2019 to 3564 GW in 2030. Furthermore, IRENA projected that amid the COVID-19 pandemic, many countries are likely to miss their 2020 NDC deadline [150].

7.1. The Path towards Decarbonisation

In line with the decarbonisation goals, Europe has committed a reduction in carbon emissions of at least 80% by 2050. Being one of the most critical sectors in this scope, electricity is of paramount importance. The European Commission has defined various scenarios, each of which investigates final consequences in the shadow of a probable incident. To hit the goal of decarbonisation, the European Commission forecasts that the share of RES in electricity generation will have to account for between 64% (in a high-efficiency scenario) and 97% (in a high RES scenario which incorporates notable ESSs) by 2050 [151]. As a result, European countries plan to replace coal-fired plants with RES plants and nuclear plants’ phase-out. By doing so, it is estimated that a 20% reduction in conventional generation capacity in Northern Europe, that is, France, Germany, Netherlands, Great Britain and Belgium, will occur by 2030 [152].
Belgium is one of the countries that have quantified its goal in the renewable energy sector. Considering the commitment of Belgium to the Paris Agreement and the decision to phase out nuclear generation by 2025, it can be deduced that the country needs a clear energy roadmap. In Figure 16, the planned time for the phase-out of each nuclear reactor in Belgium, namely Doel 3 (D3), Tihange 2 (T2), Doel 1 (D1), Doel 4 (D4), Tihange 3 (T3), Tihange 1 (T1) and Doel 2 (D2) are shown [153]. The last reactor, that is, D2, is going to be decommissioned in December 2025. This becomes more crucial if it is remembered that nearly one-third of the total installed generation capacity of Belgium and almost half of the electricity generation consists of nuclear plants.
In line with the decommissioning of nuclear plants, the Belgian Transmission System Operator (TSO), Elia, stated that to have the nuclear exit occur in an orderly way, a replacement capacity of 3.9 GW will be needed as of 2025. Besides, neighbouring countries of Belgium, that is, the UK, the Netherlands, Italy, France and especially Germany, are shutting down their coal plants sooner than expected, harming the ability of Belgium to import electricity during winter. Elia estimated that in the winters of 2022–2023, 2023–2024 and 2024–2025, more than 1 GW of capacity is needed to maintain the security of supply in these periods [153]. To clarify the path for achieving the goals, Elia has evaluated the strength and challenges of Belgium, which are summarised in Table 4 [152].
Nevertheless, despite the chosen target of 13% share of renewable energy for 2020 (10% in transport, 21% in electricity and about 12% in heating and cooling [154]), in the last days of 2020, authorities announced that the share of renewable energy in energy generation is capped at 11.68%, rising from 9.1% from the beginning days of 2019 [155,156]. In addition to that, Belgium has promised to reach a 2030 total renewable goal of 18.3%. In the draft plan, the renewable share of 40.4% in electricity, 20.6% in transport and 12.7% in heating and cooling are promised by 2030 [156]. This can be compared with the Europe target of having 32% and 50–60% share of RES in energy and electricity consumption successively, by 2030 [153]. Regarding the electricity generation historical values, in Figure 17 share of electricity generated by RES in Belgium in the past years is shown [154]. The potential of Belgium for renewable generation mainly relies on onshore and offshore wind as well as solar PV. However, biomass, geothermal, and hydro energy could still contribute to energy provision, albeit in far lower volumes [152]. Figure 18 depicts the electricity generation mix in 2020, the year marked by the outbreak of the COVID-19 [157].
In terms of CO 2 production, the emissions of Belgium in the last ten years are depicted in Figure 19 [158]. In order to have a better image of the CO 2 production of Belgium, the top five countries in terms of tonnage of CO 2 production in the last five years are compared with Belgium, considering the population of the countries, shown in Table 5. The index is known as CO 2 emissions per capita. It can be seen that Belgium needs to urgently move towards a more sustainable way of life to decrease its CO 2 emissions. This could stem from the fact that, in general, each person in Belgium consumes a higher amount of primary energy compared to the people in the mentioned countries in Table 5. Statistically, after Norway that had the highest primary energy consumption per capita in 2019 with 328.5 GJ per person, Belgium with 235.1 GJ per person was the second country in Europe [158].
Becoming the seventh country in the EU to cut out the tremendously polluting fossil fuel in the electricity generation sector, Belgium closed its last coal-fired power plant in Langerlo in March 2016 [167]. However, since October 2018, two gas turbines of 470 MW and 255 MW returned to the market, reported by Elia. This can be clearly seen in Figure 20, which shows the monthly energy mix for the year 2018 and 2019 in which a significant change in October 2018 is noticeable [168]. It is worth mentioning that in Figure 20, the category ‘other’ includes hydro-electricity, biomass, and so forth.

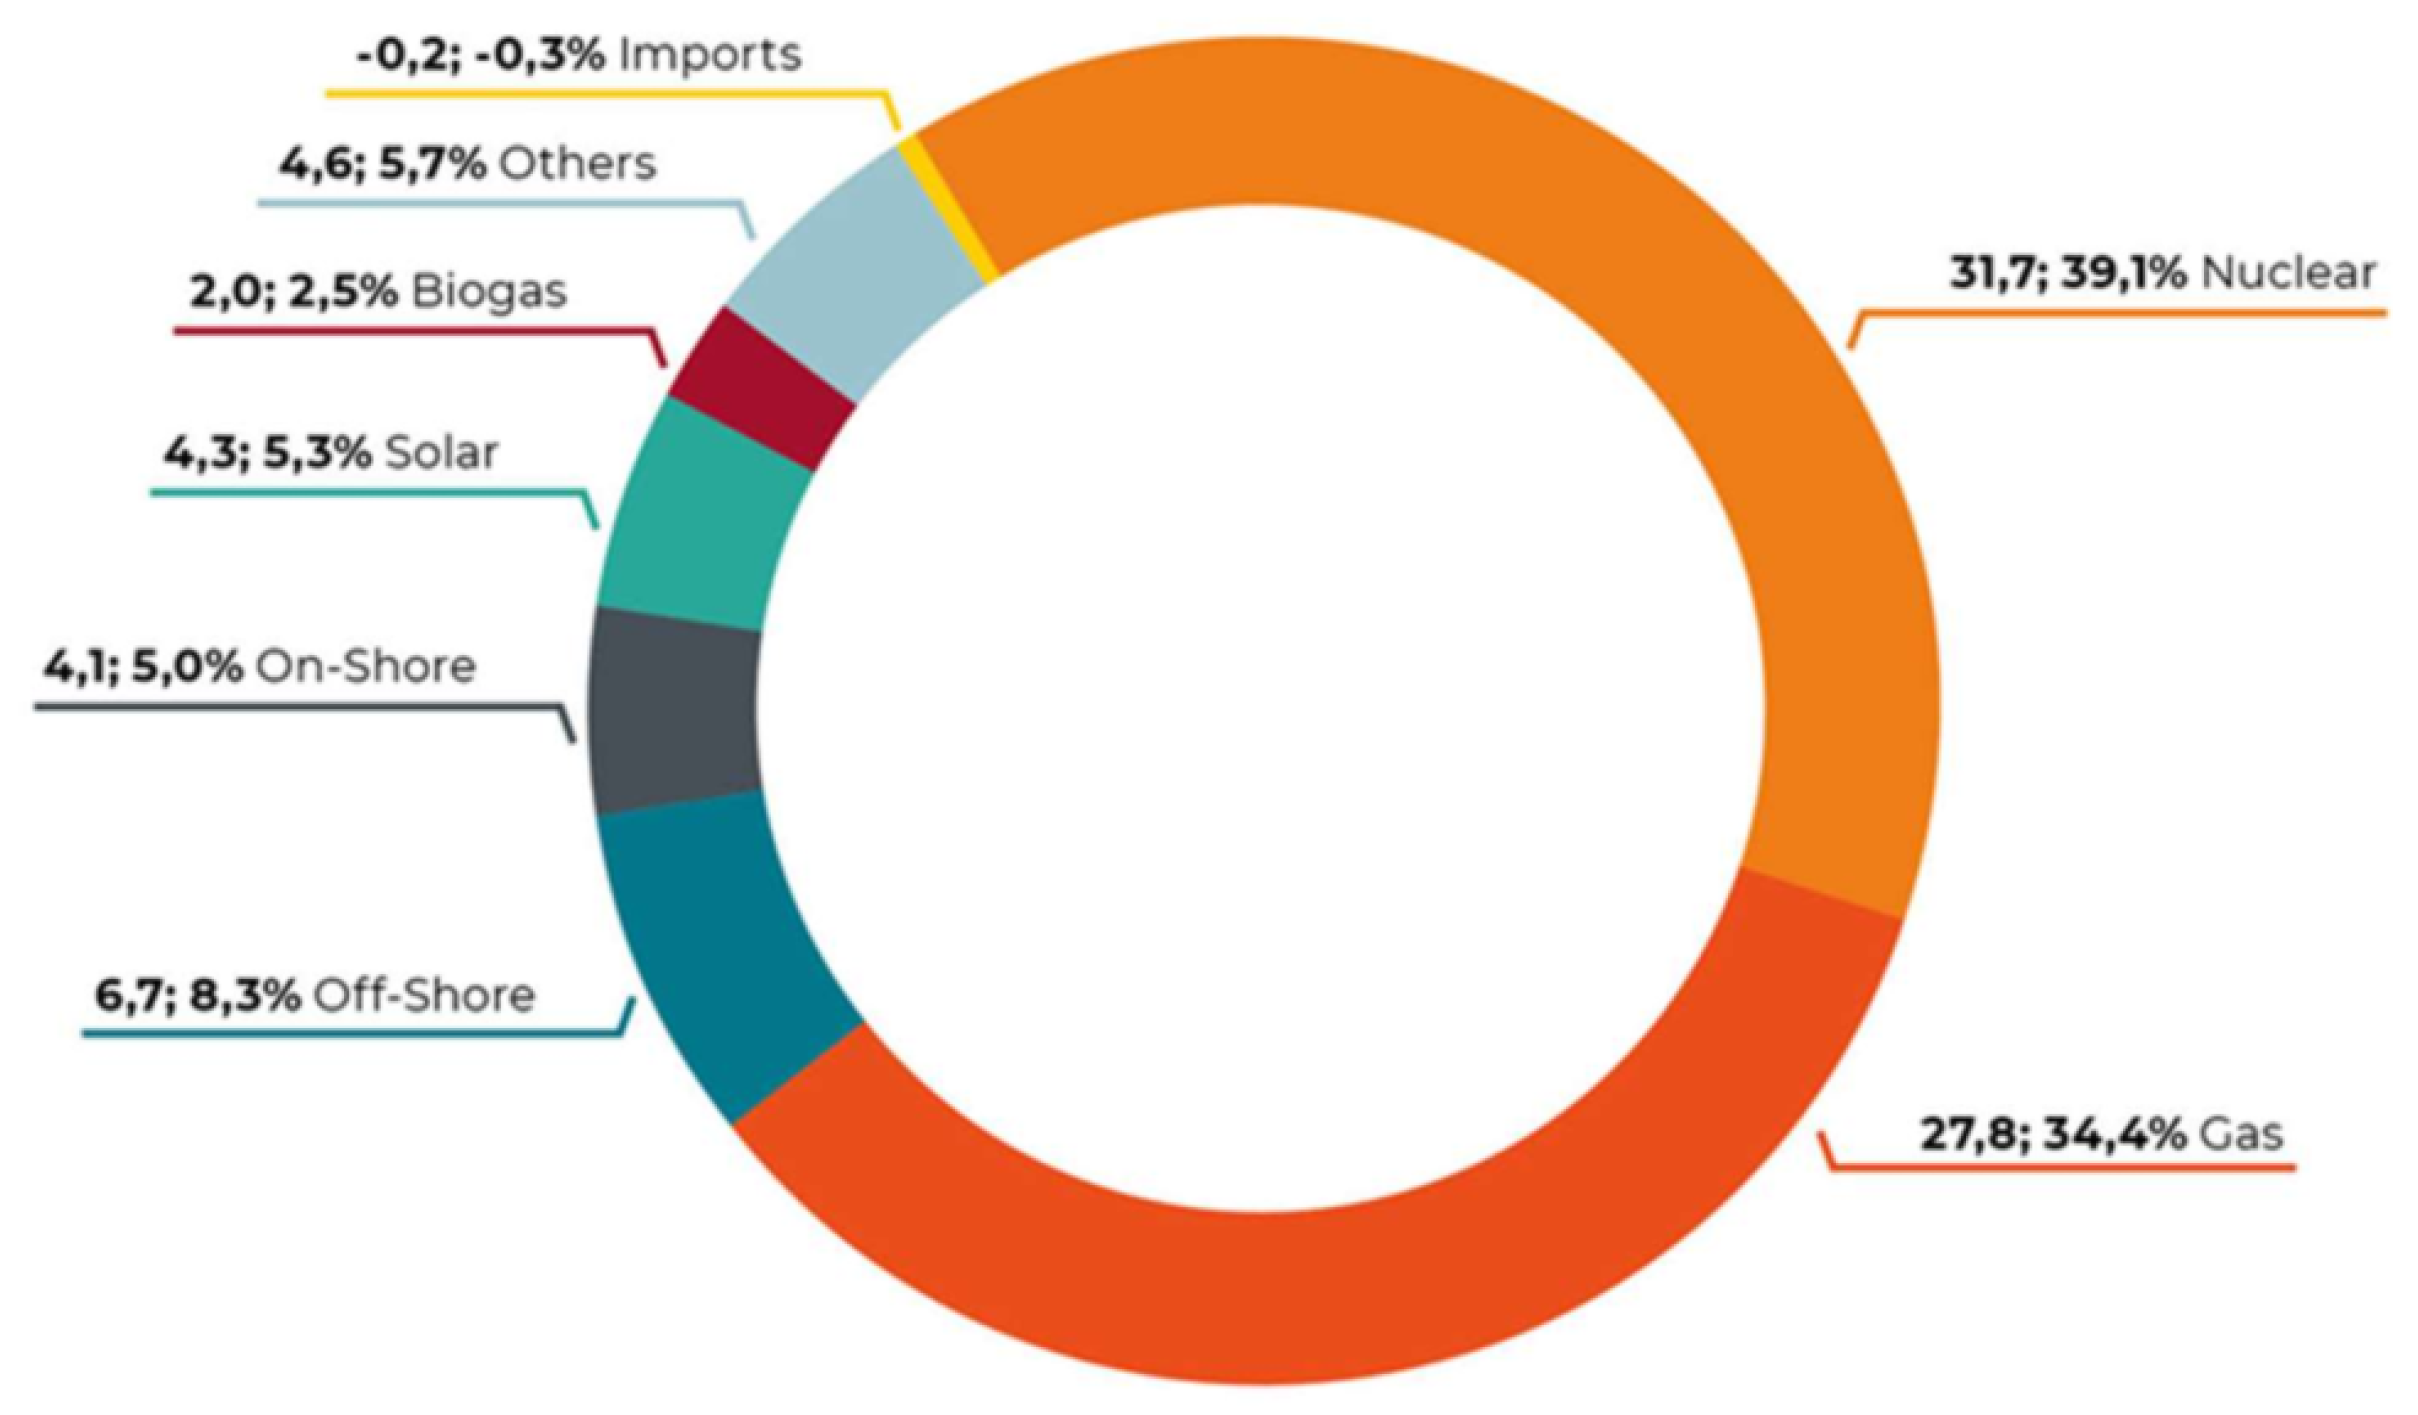
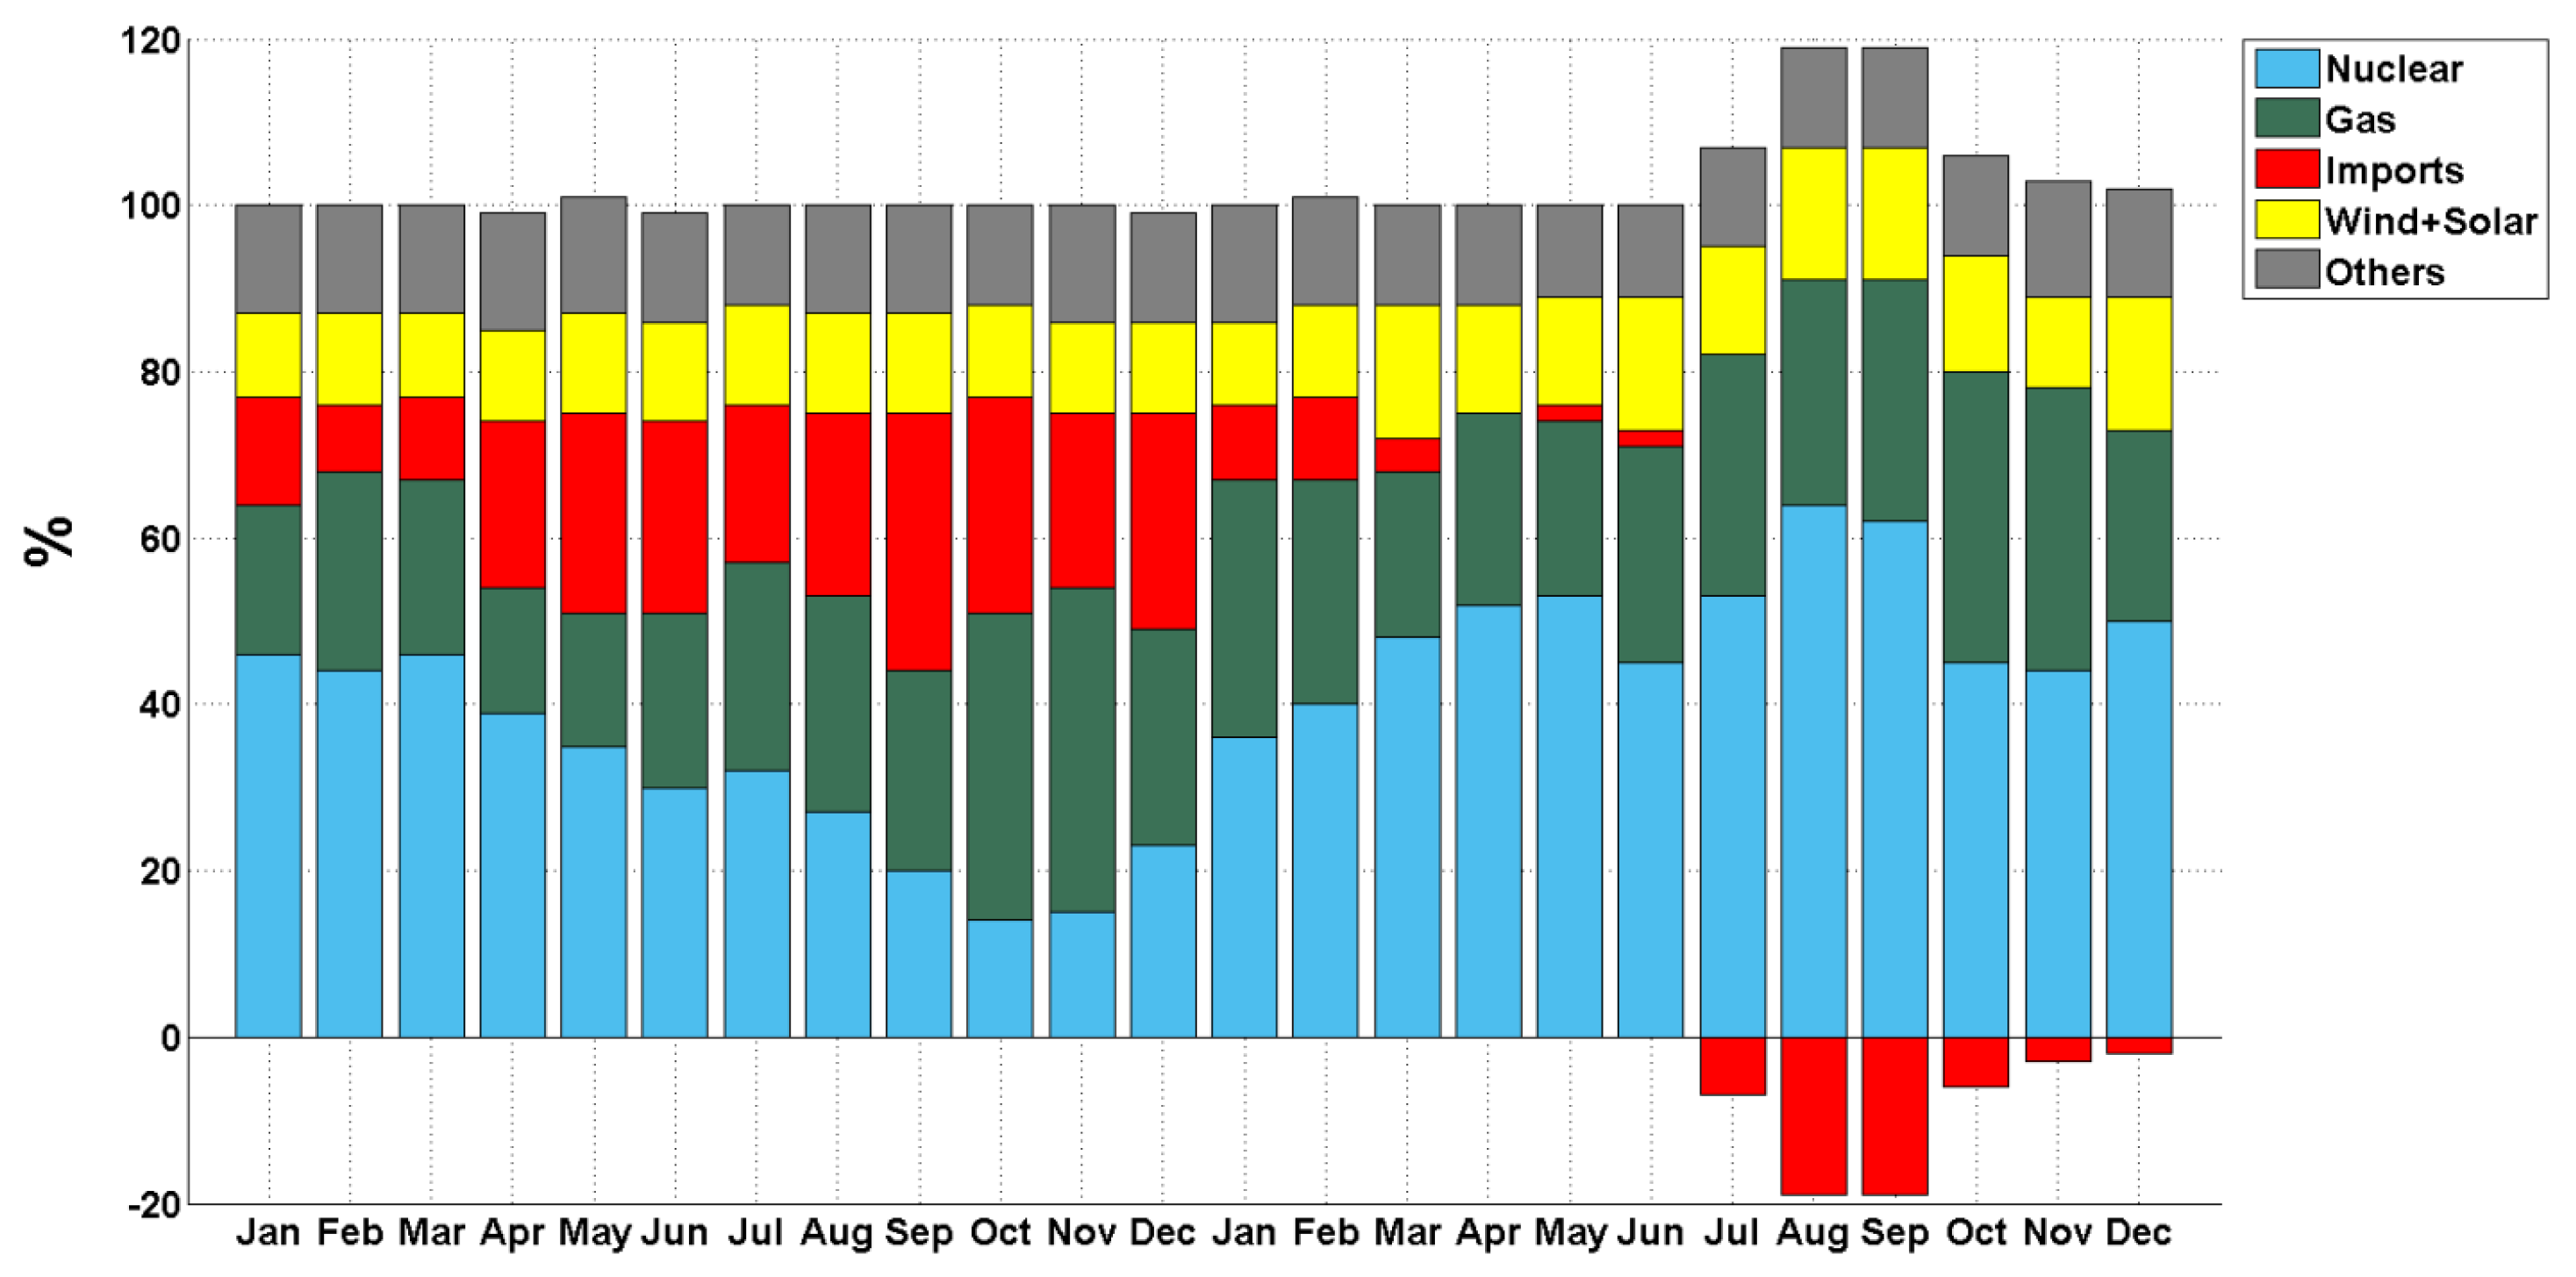
7.2. Status of the Power System

Concerning the reliability of the power system, different countries have adopted various metrics to evaluate their grid reliability based on the configuration of the power system. For instance, in Australia, an annual Expected Energy Not Served (EENS) standard is used, considering 0.002% to be an appropriate risk level for the expected unserved energy in one year. In the North-West part of the USA, the LOLP metric is applied, which considers 5% for LOLP value and implies that an average of one calendar year in 20 is allowed to have unreliability events at most. On the other hand, in Europe, a reliability standard of LOLE is used, which is expressed in hours/year. For example, the Netherlands uses 4 h/year for this metric or France has defined 3 h/year threshold. Two countries in Europe use dual reliability standards, meaning that two metrics are applied to assess the power system reliability. Apart from Portugal, Belgium is the second country that uses two reliability standards. Having a two-part LOLE criterion, Belgium has set an average LOLE of 3 h/year, in addition to equally binding criteria, known as LOLE95, which should be less than 20 h [169]. The latter metric benefits from Monte Carlo simulation, a technique to understand the consequences of risk and uncertainty in forecasting models [170]. LOLE95 implies that 95% of simulated Monte Carlo calendar years should have a loss of load of less than a certain number of hours, which in Belgium’s case is 20 h.
Every year Elia publishes a report evaluating their performance in terms of reliability and grid availability. In the report, in line with the international standard, the number of incidents resulting in at least one customer interruption that lasted more than 3 min for which the TSO is responsible are recorded. That is, interruptions stemmed from customer errors, thunderstorms, third parties, birds, and so forth, are excluded. In Figure 21 the number and duration of incidents that occurred in the past three years at different voltage levels are depicted [171]. It can be seen that even with the annual share of RES, including intermittent sources, in electricity generation of 19.6%, 24.5% and 21.3% in 2017, 2018, and 2019, respectively, still the required reliability and availability is maintained.
Concerning the power system adequacy, Elia conducted a study to quantify the needed amount of three reserve types, namely primary reserve or Frequency Containment Reserve (FCR), secondary reserve or automatic Frequency Restoration Reserve (aFRR), and tertiary reserve or manual Frequency Restoration Reserve (mFRR), in ten years from 2017 to 2027. The FCR aims to stabilise the frequency within the range of 49.8 and 50.2 Hz. In order to achieve this goal, the response time has to be very quick, as, in less than 30 s, it needs to compensate for any probable increase or decrease in the frequency. Elia states that it may acquire 70% of the needed R1 reserve outside Belgium. The aFRR has two goals—regulate the frequency to 50 Hz in order to relieve the pressure on the FCR, and ensure that the constant physical import/export rate always remains in correspondence to the contractually agreed import/export balance by the market place in a control area (in Elia’s case Belgium and a part of Luxembourg). The set-point signal, which is based on ongoing measurements of the difference between the mentioned import/export balances, is calculated by Elia every 10 s and transmitted to all the power plants participating in the aFRR provision. Relieving the burden on aFRR reserve, the mFRR reserve is controlled manually by dispatchers of TSO with a response time ranging from a few minutes to a quarter of an hour at most. When aFRR is saturated or is at risk of getting saturated, for instance, following the loss of a vital generation unit, mFRR is activated. The tertiary reserve can be supplied by various sources, such as generation units that are already running, not-running units with a short start-up time, or consumers on the distribution and transmission network. As far as the Belgian power system is concerned, the capacity of transmission between the control areas is chiefly devoted to commercial exchanges. Thus, it cannot be assumed that neighbouring countries of Belgium could supply the requirements for mFRR. Elia estimated the required capacities of 80–100 MW, 140–175MW, and 825–1600 MW for the reserves FCR, aFRR, and mFRR, respectively in the period from 2017 to 2027 in Belgium [172]. The projected capacities are derived based on a statistical method in which historical system imbalances, as well as possible errors in forecasted RES generation, are extrapolated towards the future.

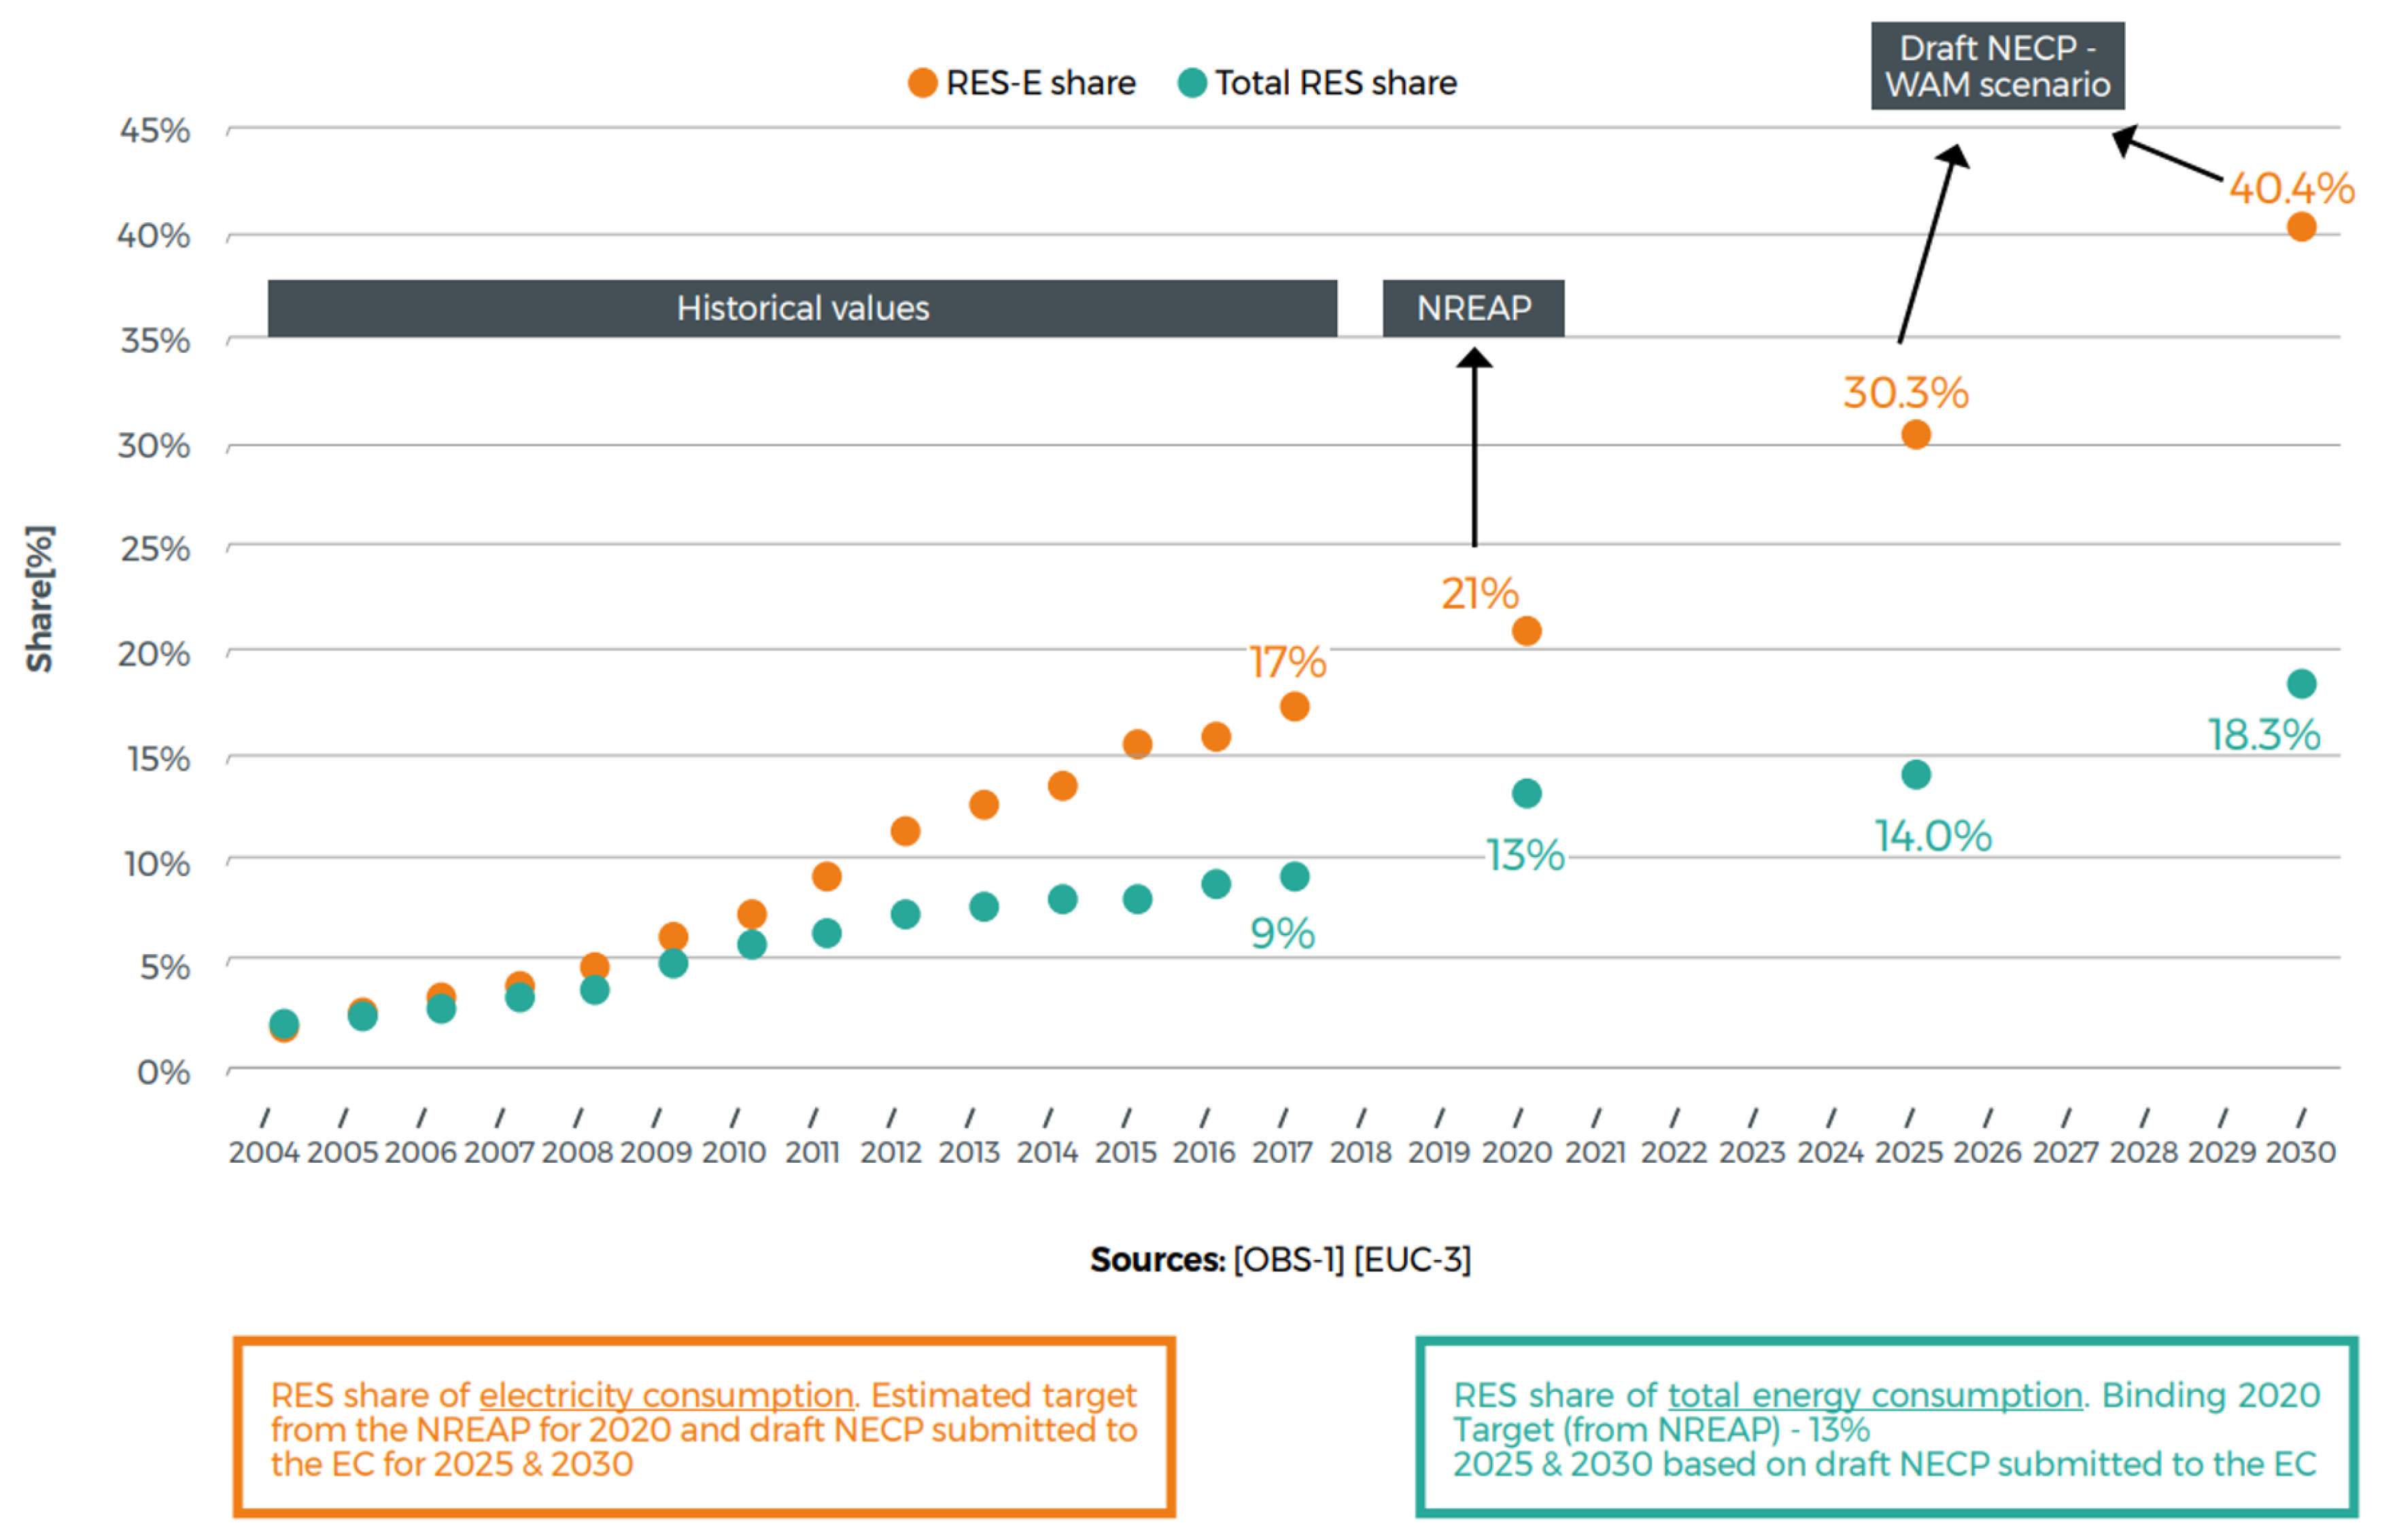
7.3. RES Share Predictions

When it comes to the predictions associated with RES in Belgium, Elia has defined three scenarios and quantified its projections for the installed capacity of onshore wind, offshore wind, and PV. In the main scenario, referred to as the Central scenario here, assumptions are based on the National Energy and Climate Plan (NECP) of Belgium, which is the most recent source of information from the authorities concerning RES generation and evolution of the demand. Each EU member was obliged to submit a draft NECP by the end of 2018 to the European Commission. As far as Belgium is concerned, NECP quantifies three main terms—firstly, offshore and onshore wind, PV, and biomass capacity to reach EU 2030 targets. Secondly, the nuclear capacity of the country, which, as mentioned earlier, follows a scheduled phase-out. Third, it consists of total electricity consumption growth, including TSO and Distribution System Operator (DSO) grid losses. The draft NECP for Belgium includes two scenarios called With Existing Measures (WEM) scenario, which considers measures that are already taken, and With Additional Measures (WAM) scenario, which considers additional measures into account as well [153]. Besides, each country has submitted a National Renewable Energy Action Plan (NREAP) in which approaches and energy mix are pursued to reach their targets. Historical values and planned share of RES in energy and electricity consumption based on NECP-WAM scenario and NREAP in Belgium is shown in Figure 22 [153].
Along with the Central scenario, High and Low RES scenarios, denoting higher and lower penetration of RES compared to the Central scenario, respectively, are simulated by Elia. In the High RES case, higher penetration in onshore wind and solar PV capacity in Belgium, as well as accelerated commissioning of the second wave of offshore wind is predicted. Conversely, Low RES case considers lower penetration of onshore wind and solar PV capacity in Belgium, while offshore capacity follows the same assumptions as in the Central scenario [153].
As far as onshore wind is concerned, an average increase of approximately 170 MW/year in Belgium is estimated by Elia in the Central scenario, resulting in 4.5 GW of installed onshore capacity in the country. However, this rate differs for High RES case and grows by 250 MW/year, which leads to 5.3 GW in 2030. In the Low RES scenario, 90 MW/year growth rate, which reaches the total onshore capacity to 3.6 GW, is foreseen. Figure 23 shows the historical and predicted values for onshore capacity per scenario in Belgium [153].
For offshore wind capacity, while in the Central scenario, up to 4 GW of capacity is predicted before the end of 2028, in the High RES case, the second offshore wave starts earlier compared to the Central scenario with 700 MW by 2025. The forecasted installed capacities for the other years are predicted to be similar. In Figure 24, the evolution of the offshore capacity in Belgium is depicted [153].
Reaching a total capacity of 11 GW by 2030, PV generation in the Central case is predicted to grow by 600 MW/year. In the High RES case, PV grows by 900 MW per year and reaches 14 GW in 2030. On the other hand, in the Low RES scenario, the growth rate falls to 300 MW/year, leading to 8 GW of installed PV capacity in 2030, shown in Figure 25 [153].

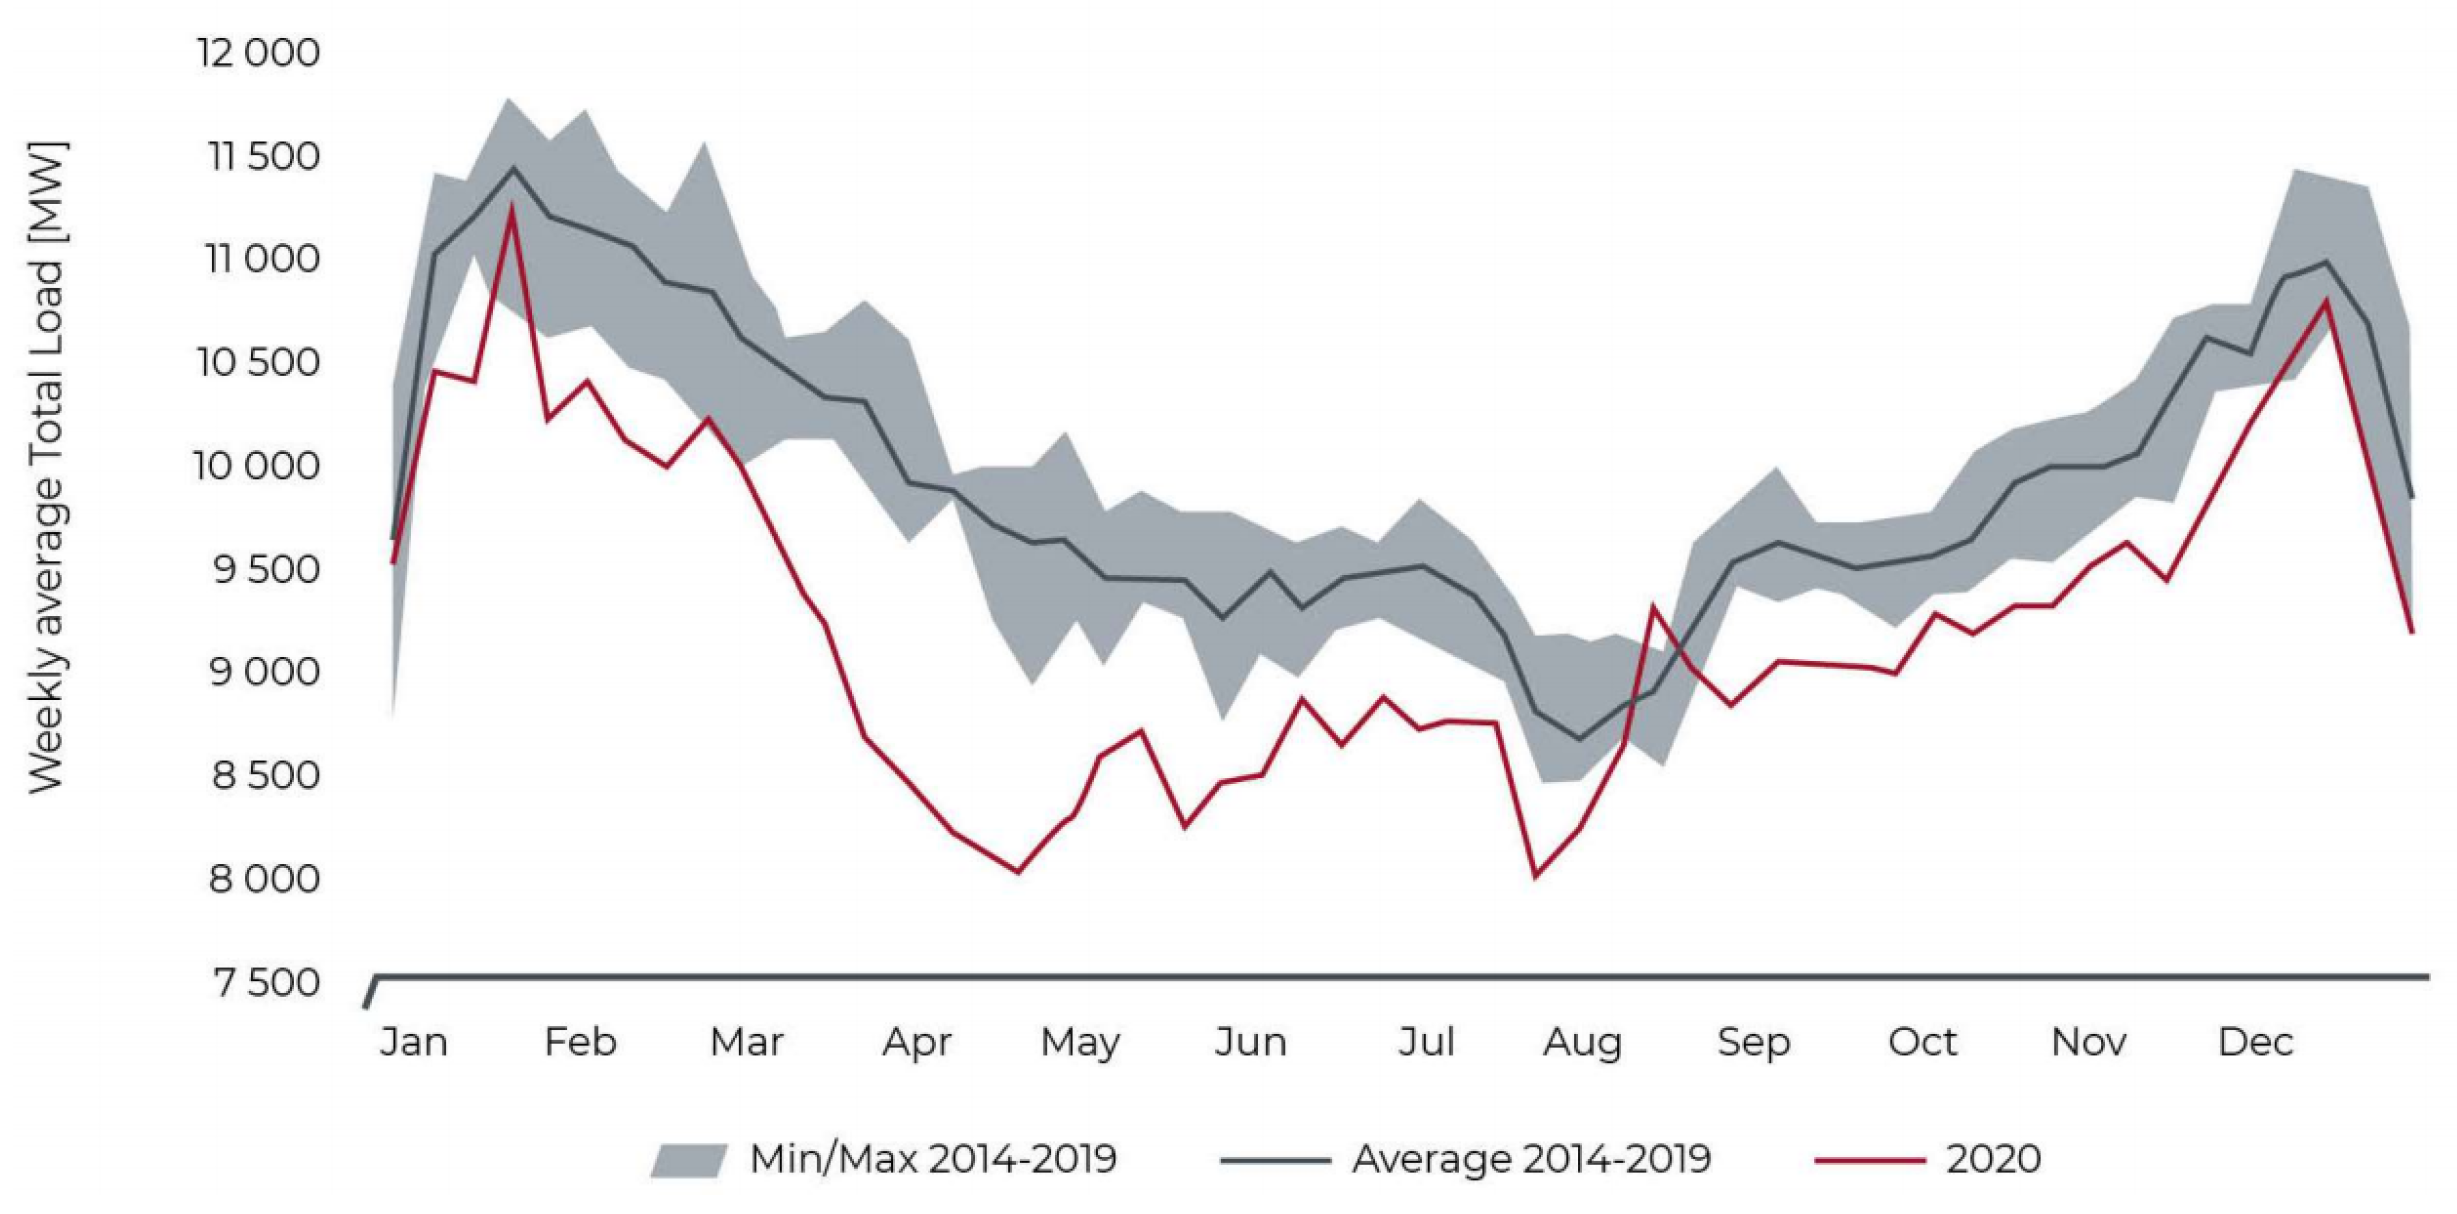
7.4. The Year Marked by COVID-19

In the year 2020, there are noteworthy points regarding matters associated with electricity generation in Belgium. First, there were 119 h in this year when more than 50% of the consumed electricity of the country was provided by RES. Considering Table 6, this becomes more significant if it is mentioned that this number had never been reached before in Belgium [157].
Furthermore, 39.1% of the electricity demand in Belgium was supplied by nuclear power, declining from 48.7% in 2019. Although in 2018, merely 31.2% of the country’s needs were met by nuclear plants, it must be mentioned that 2018 was the year marked by the significant unavailability of several reactors, especially in the last few months of the year. The impact can be clearly seen in the annual net import volume of Belgium in this year, shown in Figure 26. However, almost neutral annual net import capacity in 2020 proves that nuclear power reduction was compensated with the national generation, mostly with RES plants as gas-fired plants production was closely similar to 2019 [157].
In the end, the impact of COVID-19 on load demand must not be neglected. Although it is complicated to detect the impact of COVID-19 on the power system clearly, the 7% reduction in total load compared with the average for the five previous years, shown in Figure 27, could be mainly related to the COVID-19 pandemic. Elia reported that during the first phase of lockdown in Belgium, electricity consumption was 25% below normal at certain times of the day. The higher load in August could be justified by the heatwave that existed in the country. Finally, the fact that, on average, 2020 was warmer than the past five years should not be overlooked [157].

8. Discussion and Conclusions

In order to combat fossil fuel depletion, air pollution, and as a result of joining the Paris Agreement, countries have a strong desire to switch to alternative forms of energy. Due to abundance, being eco-friendly, and so forth, RES are one of the primary candidates for replacing fossil fuels. However, the transition to RES, besides its numerous advantages, introduces significant challenges to the TSO concerning the power system reliability and degradation of frequency response. Specifically, with the large scale integration of the intermittent RES, the following features are influenced—power system required reserves, CO 2 emissions of the conventional power plants, the grid losses both in transmission and distribution levels, generation of wind and solar plants when their output exceeds a threshold, protection and control systems, and reliability of the power system. Thus, countries need to switch to RES in an orderly and planned way to accommodate the adverse effects of the integration of RES. Having said that, according to the latest statistics, countries are investing in RES towards their decarbonisation goals in recent years.
Varying both temporally and spatially, wind speed and solar irradiance changes are the cause of the volatile nature of wind and solar energy. Consequently, forecasting their variations is crucial. It is notable that wind speed is higher in offshore areas, which, evidently, leads to a higher output power of the connected generator. Additionally, it is more consistent and foreseeable compared to onshore winds. Consequently, as well as a reduction in the level of intermittency of wind power to some extent, offshore turbines do not suffer from high fatigue and the related infrastructure lifetime increase. On the other hand, due to the presence of a thermal mass, such as oil or water, the variations of the output power of CSP plants are less significant. In order to accommodate the oscillations of the intermittent RES, ESSs, as the most promising solution, have been introduced. They can be categorised into five groups of mechanical, electrochemical, chemical, electromagnetic and thermal. Based on their features, each of the mentioned types can be utilised to smoothen the adverse effects of the volatile RES.
Regarding wind technologies, offshore and onshore turbines are used to generate electricity, with the latter is more mature in technology and the corresponding infrastructure due to almost 100 years sooner evolution than the former type. On the other hand, offshore wind harvesting is becoming more accepted, especially for countries with access to seas or oceans, due to its desiring features. Furthermore, from an environmental point of view, offshore turbines do not need to occupy any land as they are installed in the sea or ocean. However, this fact increases the required technology cost and makes the maintenance more costly.
Concerning solar energy, PV and CSP are the two dominant technologies for generating electricity globally. However, as CSP is strongly dependant on the geographical location and mainly could be benefited in regions with DNIs > 2000 kWh/m 2 /year to make it costly justifiable, PV is more utilised worldwide. While PV solar systems directly convert the sun irradiance to electricity, CSP plants concentrate the solar irradiance onto a point or line and first generate heat and steam and then convert it to electricity. Depending on the type of equipment for having the sunlight concentrated, CSP plants can be further categorised into PT, ST, FR, and SD power plants. Although PT plants are the most mature and dominant type among the others, ST has attracted attention in the past years as it has made a compromise between cost and efficiency.
In terms of comparing solar and wind energy, from the intermittency point of view, the solar irradiance variations are more predictable compared to the wind speed. In other words, the day and night changes of the solar irradiance have given a more foreseeable pattern to the output power of solar systems. Additionally, due to a higher correlation of solar output power with demand, it is easier to have them penetrated into the power grid. In Table 7, the most significant characteristics of wind and solar energy, including their related sub-technologies, are summarised.
Considering the Belgian power system, in line with the decommissioning of nuclear plants by 2025 and the Paris Agreement, Elia, with the corresponding authorities, is trying to define a clear and feasible roadmap on the path of the country towards decarbonisation targets. In Belgium, solar PV and wind harvesting consist of the dominant part of shares among other types of RES. Due to the access to the North Sea, Belgium is investing in offshore wind plants, too, making the country one of the leading countries in this aspect. Although Belgium failed to reach its 13% goal of RES share in energy for 2020, statistics, such as net import of the country and annual consumed hours of electricity generated by RES in the year 2020, show that the country is on the right path and achieving its goals by 2030 is not hard to reach. The reason for not hitting the targets in 2020 could be justified by the COVID-19 pandemic as it made authorities to postpone the commissioned project deadlines as the country experienced two phases of strict lockdown. That is why, if the situation regarding the pandemic becomes better than now and authorities relax the adopted measures, it is expected that 2021 can be an exceptional year for RES and some records in terms of RES.

Author Contributions

Conceptualization, S.A., N.K. and A.E.S.; methodology, S.A., N.K. and A.E.S.; validation, D.B.; investigation, S.A., N.K. and A.E.S.; writing—original draft preparation, S.A; writing—review and editing, N.K., A.E.S., D.B., J.D.M.D.K., G.C. and L.V.; supervision, D.B. and L.V.; All authors have read and agreed to the published version of the manuscript.

Funding

This research received no external funding.

Institutional Review Board Statement

Not applicable.

Informed Consent Statement

Not applicable.

Data Availability Statement

Not applicable.

Acknowledgments

This work was performed in the frame of the Energy Transition Fund project BEOWIND of the Belgian federal government, and the Catalisti cluster SBO project CO2PERATE.

Conflicts of Interest

The authors declare no conflict of interest.

Abbreviations

The following abbreviations are used in this manuscript:
RESRenewable Energy Sources
CO 2 Carbon Dioxide
IPCCIntergovernmental Panel on Climate Change
IRENAInternational Renewable Energy Agency
PVPhotovoltaic
ASAncillary Services
LOLPLoss Of Load Probability
LOLELoss Of Load Event
EUEuropean Union
CSPConcentrated Solar Power
DCDirect Current
ACAlternating Current
MPPTMaximum Power Point Tracking
PTParabolic Trough
STSolar Tower
FRFresnel Reflector
SDSolar Dish
DNIDirect Normal Irradiance
DHIDiffused Horizontal Irradiance
GHIGlobal Horizontal Irradiance
LCOELevelised Cost Of Energy
c-Sicrystalline Silicon
ESSEnergy Storage System
ISOInternational Organization for Standardization
WTWavelet Transform
ARIMAAuto Regressive Integrated Moving Average
NASANational Aeronautics and Space Administration
POWERPrediction of Worldwide Energy Resources
LSTMLong Short Term Memory
PSOParticle Swarm Optimization
ANNArtificial Neural Network
SSMSupply-Side Management
DSMDemand-Side Management
PEVPlug-in Electric Vehicles
PHESPumped Hydroelectric Storage
CAESCompressed Air Energy Storage
RFBRedox Flow Battery
BESSBattery Energy Storage System
NiCdNickel-Cadmium
ZnBrZinc-Bromide
NaSSodium-Sulphur
Li-ionLithium-ion
NMCNickel Cobalt Aluminium
NCANickel Cobalt Aluminium Oxide
LFPLithium Iron Phosphate
CESSChemical Energy Storage Systems
FCFuel Cell
HFCHydrogen Fuel Cell
PEMFCProton Exchange Menbrane Fuel Cell
DMFCDirect Methanol Fuel Cell
AFCAlkaline Fuel Cells
SOFCSolid Oxide Fuel Cells
EESSElectrical Energy Storage System
UCUltra-Capacitors
SMESSuperconducting Magnetic Energy Storage
TESSThermal Energy Storage System
NDCNationally Determined Contribution
TSOTransmission System Operator
EENSExpected Energy Not Served
FCRFrequency Containment Reserve
aFRRautomatic Frequency Restoration Reserve
mFRRmanual Frequency Restoration Reserve
NECPNational Energy and Climate Plan
DSODistribution System Operator
WEMWith Existing Measures
WAMWith Additional Measures
NREAPNational Renewable Energy Action Plan

References

  1. Infield, D.; Freris, L. Renewable Energy in Power Systems; Library, New York, NY, USA; John Wiley & Sons: Hoboken, NJ, USA, 2020. [Google Scholar]
  2. Maggio, G.; Cacciola, G. When will oil, natural gas, and coal peak? Fuel 2012, 98, 111–123. [Google Scholar] [CrossRef]
  3. Mohr, S.H.; Evans, G.M. Forecasting coal production until 2100. Fuel 2009, 88, 2059–2067. [Google Scholar] [CrossRef] [Green Version]
  4. Zhang, J.; Sun, Z.; Zhang, Y.; Sun, Y.; Nafi, T. Risk-opportunity analyses and production peak forecasting on world conventional oil and gas perspectives. Pet. Sci. 2010, 7, 136–146. [Google Scholar] [CrossRef] [Green Version]
  5. Mohr, S.; Evans, G. Long term forecasting of natural gas production. Energy Policy 2011, 39, 5550–5560. [Google Scholar] [CrossRef] [Green Version]
  6. Cleveland, C.J.; Morris, C.G. Handbook of Energy: Chronologies, Top Ten Lists, and Word Clouds; Library, New York, NY, USA; Elsevier: Amsterdam, The Netherlands, 2013. [Google Scholar]
  7. Pearson, P.N.; Foster, G.L.; Wade, B.S. Atmospheric carbon dioxide through the Eocene–Oligocene climate transition. Nature 2009, 461, 1110–1113. [Google Scholar] [CrossRef]
  8. Muneer, T.; Kolhe, M.; Doyle, A. Electric Vehicles: Prospects and Challenges; Library, New York, NY, USA; Elsevier: Amsterdam, The Netherlands, 2017. [Google Scholar]
  9. Dincer, I.; Rosen, M.A. Exergy: Energy, Environment and Sustainable Development; Library, New York, NY, USA; Elsevier: Amsterdam, The Netherlands, 2012. [Google Scholar]
  10. The Paris Agreement. Available online: https://unfccc.int/process-and-meetings/the-paris-agreement/the-paris-agreement (accessed on 28 April 2021).
  11. Hoegh-Guldberg, O.; Jacob, D.; Bindi, M.; Brown, S.; Camilloni, I.; Diedhiou, A.; Djalante, R.; Ebi, K.; Engelbrecht, F.; Guiot, J.; et al. Impacts of 1.5 C global warming on natural and human systems. In Global Warming of 1.5° C. An IPCC Special Report; Library, New York, NY, USA; IPCC Secretariat: Geneva, Switzerland, 2018. [Google Scholar]
  12. Sabine, C.L. Carbon Dioxide in the Ocean and Atmosphere. Available online: http://www.waterencyclopedia.com/Bi-Ca/Carbon-Dioxide-in-the-Ocean-and-Atmosphere.html (accessed on 28 April 2021).
  13. Desjardins, J. Map: The Countries With the Most Oil Reserves. 2019. Available online: https://www.visualcapitalist.com/map-countries-most-oil-reserves/ (accessed on 28 April 2021).
  14. IRENA. Renewable Energy and Jobs – Annual Review 2020; International Renewable Energy Agency: Abu Dhabi, United Arab Emirates, 2020. [Google Scholar]
  15. Ferroukhi, R.; Casals, X.; Parajuli, B. Measuring the Socio-Economics of Transition: Focus on Jobs; International Renewable Energy Agency: Abu Dhabi, United Arab Emirates, 2020. [Google Scholar]
  16. IRENA. Statistical Profiles-Oceania-New Zealand; International Renewable Energy Agency: Abu Dhabi, United Arab Emirates, 2020. [Google Scholar]
  17. IRENA. Statistical Profiles-Europe-Belgium; International Renewable Energy Agency: Abu Dhabi, United Arab Emirates, 2020. [Google Scholar]
  18. IRENA. Statistical Profiles-South America-Uruguay; International Renewable Energy Agency: Abu Dhabi, United Arab Emirates, 2020. [Google Scholar]
  19. Heptonstall, P.; Gross, R.; Steiner, F. The Costs and Impacts of Intermittency—2016 Update: A Systematic Review of the Evidence on the Costs and Impacts of Intermittent Electricity Generation Technologies; Technical Report; Library, New York, NY, USA; UK Energy Research Centre: London, UK, 2017. [Google Scholar] [CrossRef]
  20. Notton, G.; Nivet, M.L.; Voyant, C.; Paoli, C.; Darras, C.; Motte, F.; Fouilloy, A. Intermittent and stochastic character of renewable energy sources: Consequences, cost of intermittence and benefit of forecasting. Renew. Sustain. Energy Rev. 2018, 87, 96–105. [Google Scholar] [CrossRef]
  21. Suchet, D.; Jeantet, A.; Elghozi, T.; Jehl, Z. Defining and Quantifying Intermittency in the Power Sector. Energies 2020, 13, 3366. [Google Scholar] [CrossRef]
  22. Banshwar, A.; Sharma, N.K.; Sood, Y.R.; Shrivastava, R. Renewable energy sources as a new participant in ancillary service markets. Energy Strategy Rev. 2017, 18, 106–120. [Google Scholar] [CrossRef]
  23. Yang, Y.; Bremner, S.; Menictas, C.; Kay, M. Battery energy storage system size determination in renewable energy systems: A review. Renew. Sustain. Energy Rev. 2018, 91, 109–125. [Google Scholar] [CrossRef]
  24. Zhao, H.; Wu, Q.; Hu, S.; Xu, H.; Rasmussen, C.N. Review of energy storage system for wind power integration support. Appl. Energy 2015, 137, 545–553. [Google Scholar] [CrossRef]
  25. Hazboun, S.O.; Boudet, H.S. Public Preferences in a Shifting Energy Future: Comparing Public Views of Eight Energy Sources in North America’s Pacific Northwest. Energies 2020, 13, 1940. [Google Scholar] [CrossRef] [Green Version]
  26. Ribeiro, F.; Ferreira, P.; Araújo, M.; Braga, A.C. Public opinion on renewable energy technologies in Portugal. Energy 2014, 69, 39–50. [Google Scholar] [CrossRef]
  27. Ntanos, S.; Kyriakopoulos, G.; Chalikias, M.; Arabatzis, G.; Skordoulis, M. Public perceptions and willingness to pay for renewable energy: A case study from Greece. Sustainability 2018, 10, 687. [Google Scholar] [CrossRef] [Green Version]
  28. Qazi, A.; Hussain, F.; Rahim, N.A.; Hardaker, G.; Alghazzawi, D.; Shaban, K.; Haruna, K. Towards sustainable energy: A systematic review of renewable energy sources, technologies, and public opinions. IEEE Access 2019, 7, 63837–63851. [Google Scholar] [CrossRef]
  29. IRENA. Renewable Capacity Statistics 2021; International Renewable Energy Agency: Abu Dhabi, United Arab Emirates, 2021. [Google Scholar]
  30. Bozalakov, D.V.; Laveyne, J.; Mnati, M.J.; Van de Vyver, J.; Vandevelde, L. Possible Power Quality Ancillary Services in Low-Voltage Grids Provided by the Three-Phase Damping Control Strategy. Appl. Sci. 2020, 10, 7876. [Google Scholar] [CrossRef]
  31. Bozalakov, D.; Mnati, M.J.; Laveyne, J.; Desmet, J.; Vandevelde, L. Battery storage integration in voltage unbalance and overvoltage mitigation control strategies and its impact on the power quality. Energies 2019, 12, 1501. [Google Scholar] [CrossRef] [Green Version]
  32. Ackermann, T. (Ed.) Wind Power in Power Systems; Library, New York, NY, USA; Wiley Online Library: Hoboken, NJ, USA, 2005; Volume 140. [Google Scholar]
  33. Wan, Y.h.; Parsons, B.K. Factors Relevant to Utility Integration of Intermittent Renewable Technologies; Technical Report; National Renewable Energy Lab.: Golden, CO, USA, 1993. [Google Scholar]
  34. Reddoch, T.; Barnes, P.; Lawler, J.; Skroski, J. Strategies for Minimizing Operational Impacts of Large wind Turbine Arrays on Automatic Generation Control Systems; Library, New York, NY, USA; ASME: New York, NY, USA, 1982. [Google Scholar]
  35. Ren, G.; Liu, J.; Wan, J.; Guo, Y.; Yu, D. Overview of wind power intermittency: Impacts, measurements, and mitigation solutions. Appl. Energy 2017, 204, 47–65. [Google Scholar] [CrossRef]
  36. Brouwer, A.S.; Van Den Broek, M.; Seebregts, A.; Faaij, A. Impacts of large-scale Intermittent Renewable Energy Sources on electricity systems, and how these can be modeled. Renew. Sustain. Energy Rev. 2014, 33, 443–466. [Google Scholar] [CrossRef]
  37. Huang, H.; Zhou, M.; Li, G. An endogenous approach to quantifying the wind power reserve. IEEE Trans. Power Syst. 2019, 35, 2431–2442. [Google Scholar] [CrossRef]
  38. Gutiérrez-Martín, F.; Da Silva-Álvarez, R.; Montoro-Pintado, P. Effects of wind intermittency on reduction of CO2 emissions: The case of the Spanish power system. Energy 2013, 61, 108–117. [Google Scholar] [CrossRef]
  39. Sulakov, S.I. Forced renewables penetration impact on ohmic transmission losses. In Proceedings of the IEEE 2016 19th International Symposium on Electrical Apparatus and Technologies (SIELA), Bourgas, Bulgaria, 29 May–1 June 2016; Library, New York, NY, USA. pp. 1–4. [Google Scholar]
  40. Yasuda, Y.; Bird, L.; Carlini, E.M.; Estanqueiro, A.; Flynn, D.; Forcione, A.; Lázaro, E.G.; Higgins, P.; Holttinen, H.; Lew, D.; et al. International comparison of wind and solar curtailment ratio. In Proceedings of WIW2015 Workshop Brussels; Energynautics: Darmstadt, Germany, 2015; pp. 20–22. [Google Scholar]
  41. Bird, L.; Lew, D.; Milligan, M.; Carlini, E.M.; Estanqueiro, A.; Flynn, D.; Gomez-Lazaro, E.; Holttinen, H.; Menemenlis, N.; Orths, A.; et al. Wind and solar energy curtailment: A review of international experience. Renew. Sustain. Energy Rev. 2016, 65, 577–586. [Google Scholar] [CrossRef] [Green Version]
  42. Pfenninger, S.; Keirstead, J. Renewables, nuclear, or fossil fuels? Scenarios for Great Britain’s power system considering costs, emissions and energy security. Appl. Energy 2015, 152, 83–93. [Google Scholar] [CrossRef] [Green Version]
  43. Šćekić, L.; Mujović, S.; Radulović, V. Pumped Hydroelectric Energy Storage as a Facilitator of Renewable Energy in Liberalized Electricity Market. Energies 2020, 13, 6076. [Google Scholar] [CrossRef]
  44. Lund, H. Renewable energy strategies for sustainable development. Energy 2007, 32, 912–919. [Google Scholar] [CrossRef] [Green Version]
  45. Østergaard, P.A. Ancillary services and the integration of substantial quantities of wind power. Appl. Energy 2006, 83, 451–463. [Google Scholar] [CrossRef]
  46. Singarao, V.Y.; Rao, V.S. Frequency responsive services by wind generation resources in United States. Renew. Sustain. Energy Rev. 2016, 55, 1097–1108. [Google Scholar] [CrossRef]
  47. Saiz-Marin, E.; García-González, J.; Barquin, J.; Lobato, E. Economic assessment of the participation of wind generation in the secondary regulation market. IEEE Trans. Power Syst. 2012, 27, 866–874. [Google Scholar] [CrossRef]
  48. Zhang, Z.S.; Sun, Y.Z.; Cheng, L. Potential of trading wind power as regulation services in the California short-term electricity market. Energy Policy 2013, 59, 885–897. [Google Scholar] [CrossRef]
  49. Díaz-González, F.; Hau, M.; Sumper, A.; Gomis-Bellmunt, O. Participation of wind power plants in system frequency control: Review of grid code requirements and control methods. Renew. Sustain. Energy Rev. 2014, 34, 551–564. [Google Scholar] [CrossRef]
  50. Rajan, R.; Fernandez, F.M. Power control strategy of photovoltaic plants for frequency regulation in a hybrid power system. Int. J. Electr. Power Energy Syst. 2019, 110, 171–183. [Google Scholar] [CrossRef]
  51. Zarina, P.; Mishra, S.; Sekhar, P. Exploring frequency control capability of a PV system in a hybrid PV-rotating machine-without storage system. Int. J. Electr. Power Energy Syst. 2014, 60, 258–267. [Google Scholar] [CrossRef]
  52. Batzelis, E.I.; Anagnostou, G.; Cole, I.R.; Betts, T.R.; Pal, B.C. A state-space dynamic model for photovoltaic systems with full ancillary services support. IEEE Trans. Sustain. Energy 2018, 10, 1399–1409. [Google Scholar] [CrossRef] [Green Version]
  53. Xavier, L.S.; Cupertino, A.F.; Pereira, H.A. Ancillary services provided by photovoltaic inverters: Single and three phase control strategies. Comput. Electr. Eng. 2018, 70, 102–121. [Google Scholar] [CrossRef]
  54. Das, R.; Kanabar, V.; Chair, V. Centralized substation protection and control. In IEEE Power System Relaying Committee Working Group K15 Report; Library, New York, NY, USA; IEEE PSRC: New York, NY, USA, 2015. [Google Scholar]
  55. Henry Gras. Impact of Renewables on Transmission System Protection. Available online: https://www.emtp.com/system/files/UG-PWS-2016-Henry-gras.pdf (accessed on 28 April 2021).
  56. Haddadi, A.; Kocar, I.; Karaagac, U.; Gras, H.; Farantatos, E. Impact of Wind Generation on Power Swing Protection. IEEE Trans. Power Deliv. 2019, 34, 1118–1128. [Google Scholar] [CrossRef]
  57. Norshahrani, M.; Mokhlis, H.; Bakar, A.; Halim, A.; Jamian, J.J.; Sukumar, S. Progress on protection strategies to mitigate the impact of renewable distributed generation on distribution systems. Energies 2017, 10, 1864. [Google Scholar] [CrossRef] [Green Version]
  58. Mercados, A. Identification of appropriate generation and system adequacy standards for the internal electricity market. In Final Report Prepared for the European Commission; Library, New York, NY, USA; Publications Office of the European Union: Luxembourg, 2016. [Google Scholar]
  59. Steele, A.J.H.; Burnett, J.W.; Bergstrom, J.C. The impact of variable renewable energy resources on power system reliability. Energy Policy 2021, 151, 111947. [Google Scholar] [CrossRef]
  60. Amelin, M. Comparison of capacity credit calculation methods for conventional power plants and wind power. IEEE Trans. Power Syst. 2009, 24, 685–691. [Google Scholar] [CrossRef]
  61. Diesendorf, M. The Economic Value of Wind Power in Electricity Grids. In Proceedings of the International Colloquium on Wind Energy, Brighton, UK, 27–28 August 1981; BHRA Fluid Engineering: Cranfield, UK; pp. 127–132. [Google Scholar]
  62. Bouramdane, A.A.; Tantet, A.; Drobinski, P. Adequacy of Renewable Energy Mixes with Concentrated Solar Power and Photovoltaic in Morocco: Impact of Thermal Storage and Cost. Energies 2020, 13, 5087. [Google Scholar] [CrossRef]
  63. Woodcroft, B. The Pneumatics of Hero of Alexandria: From the Original Greek; Library, New York, NY, USA; Taylor, Walton and Maberly: London, UK, 1851. [Google Scholar]
  64. Shepherd, D.G. Historical Development of the Windmill; Technical Report; Dept. of Mechanical and Aerospace Engineering, Cornell University: Ithaca, NY, USA, 1990. [Google Scholar]
  65. Drachmann, A. Heron’s Windmill; Library, New York, NY, USA; Dept. of Mechanical and Aerospace Engineering, Cornell University: Ithaca, NY, USA, 1961. [Google Scholar]
  66. Vowles, H.P. Early evolution of power engineering. Isis 1932, 17, 412–420. [Google Scholar] [CrossRef]
  67. Vowles, H.P. An Inquiry into Origins of the Windmill. Trans. Newcom. Soc. 1930, 11, 1–14. [Google Scholar] [CrossRef]
  68. Jacobs, M.L. Experience with Jacobs Wind-Driven Electric Generating Plant, 1931–1957. In UN Conference on New Sources of Energy, Rome; Library, New York, NY, USA; United Nations Digital Library: New York, NY, USA, 1973; pp. 155–158. [Google Scholar]
  69. Manwell, J.F.; McGowan, J.G.; Rogers, A.L. Wind Energy Explained: Theory, Design and Application; Library, New York, NY, USA; John Wiley & Sons: Hoboken, NJ, USA, 2010. [Google Scholar]
  70. The world’s First Offshore Wind Farm is Retiring. 2017. Available online: https://orsted.com/en/media/newsroom/news/2017/03/the-worlds-first-offshore-wind-farm-is-retiring, (accessed on 28 April 2021).
  71. Onshore vs. Offshore Wind: What Are the Differences and Facts? 2019. Available online: https://greencoast.org/onshore-vs-offshore-wind/ (accessed on 28 April 2021).
  72. Esteban, M.D.; Diez, J.J.; López, J.S.; Negro, V. Why offshore wind energy? Renew. Energy 2011, 36, 444–450. [Google Scholar] [CrossRef] [Green Version]
  73. IRENA. Renewabl Energy Statistics 2020; International Renewable Energy Agency: Abu Dhabi, United Arab Emirates, 2020. [Google Scholar]
  74. IRENA: International Renewable Energy Agency. Country Rankings. Available online: https://www.irena.org/Statistics/View-Data-by-Topic/Capacity-and-Generation/Country-Rankings (accessed on 28 April 2021).
  75. Wind Energy’s Frequently Asked Questions (FAQ): EWEA. Available online: https://www.ewea.org/wind-energy-basics/faq/ (accessed on 28 April 2021).
  76. Frangoul, A. Offshore Wind Installations in European Waters Hit a Record Level Last Year. 2020. Available online: https:https://www.cnbc.com/2020/02/06/offshore-wind-installations-in-europe-hit-a-record-level-last-year.html (accessed on 28 April 2021).
  77. IRENA. Future of Wind: Deployment, Investment, Technology, Grid Integration and Socio-Economic Aspects; International Renewable Energy Agency: Abu Dhabi, United Arab Emirates, 2019. [Google Scholar]
  78. V236-15.0 MW. Available online: https://www.vestas.com/en/products/offshore%20platforms/v236_15_mw#! (accessed on 28 April 2021).
  79. Colossal Six Months for Offshore Wind Support Renewable Energy Investment in First Half of 2020. 2020. Available online: https://about.bnef.com/blog/colossal-six-months-for-offshore-wind-support-renewable-energy-investment-in-first-half-of-2020/ (accessed on 28 April 2021).
  80. GWEC: Wind Power Industry to Install 71.3 GW in 2020, Showing Resilience during COVID-19 Crisis. 2020. Available online: https://gwec.net/gwec-wind-power-industry-to-install-71-3-gw-in-2020-showing-resilience-during-covid-19-crisis/ (accessed on 28 April 2021).
  81. Petersen, E.L.; Mortensen, N.G.; Landberg, L.; Højstrup, J.; Frank, H.P. Wind power meteorology. Part II: Siting and models. Wind Energy: Int. J. Prog. Appl. Wind Power Convers. Technol. 1998, 1, 55–72. [Google Scholar] [CrossRef]
  82. Albadi, M.; El-Saadany, E. Overview of wind power intermittency impacts on power systems. Electr. Power Syst. Res. 2010, 80, 627–632. [Google Scholar] [CrossRef]
  83. Santhosh, M.; Venkaiah, C.; Vinod Kumar, D. Current advances and approaches in wind speed and wind power forecasting for improved renewable energy integration: A review. Eng. Rep. 2020, e12178. [Google Scholar] [CrossRef]
  84. Nazir, M.S.; Alturise, F.; Alshmrany, S.; Nazir, H.; Bilal, M.; Abdalla, A.N.; Sanjeevikumar, P.; M Ali, Z. Wind Generation Forecasting Methods and Proliferation of Artificial Neural Network: A Review of Five Years Research Trend. Sustainability 2020, 12, 3778. [Google Scholar] [CrossRef]
  85. Van der Hoven, I. Power spectrum of horizontal wind speed in the frequency range from 0.0007 to 900 cycles per hour. J. Meteorol. 1957, 14, 160–164. [Google Scholar] [CrossRef] [Green Version]
  86. Burton, T.; Sharpe, D.; Jenkins, N.; Bossanyi, E. Wind Energy Handbook; Library, New York, NY, USA; Wiley Online Library: Hoboken, NJ, USA, 2001; Volume 2. [Google Scholar]
  87. AWS TrueWind. An analysis of the impacts of large-scale wind generation on the Ontario electricity system. In Report Prepared for the Canadian Independent Electricity System Operator; Library, New York, NY, USA; Independent Electricity Market Operator, Ontario Legislative Library eArchive: Toronto, ON, Canada, 2005. [Google Scholar]
  88. Belessiotis, V.; Papanicolaou, E. 3.03—History of Solar Energy. In Comprehensive Renewable Energy; Sayigh, A., Ed.; Elsevier: Oxford, UK, 2012; pp. 85–102. [Google Scholar] [CrossRef]
  89. Szabó, L. The history of using solar energy. In Proceedings of the 2017 International Conference on Modern Power Systems (MPS), Cluj-Napoca, Romania, 6–9 June 2017; Library, New York, NY, USA. pp. 1–8. [Google Scholar] [CrossRef]
  90. Richardson, L. History of Solar Energy: Timeline and Invention of Solar Panels: EnergySage. 2018. Available online: https://news.energysage.com/the-history-and-invention-of-solar-panel-technology/ (accessed on 28 April 2021).
  91. Perlin, J. Let It Shine: The 6000-Year Story of Solar Energy; Library, New York, NY, USA; New World Library: Novato, CA, USA, 2013. [Google Scholar]
  92. Henning, H.M.; Döll, J. Solar systems for heating and cooling of buildings. Energy Procedia 2012, 30, 633–653. [Google Scholar] [CrossRef]
  93. Jamar, A.; Majid, Z.; Azmi, W.; Norhafana, M.; Razak, A. A review of water heating system for solar energy applications. Int. Commun. Heat Mass Transf. 2016, 76, 178–187. [Google Scholar] [CrossRef] [Green Version]
  94. Solar Attic Fans: Residential Ventilation Products: Solatube By Perk Inc. Available online: https://www.solatulsa.com/attic-fans/ (accessed on 28 April 2021).
  95. Tiano, F.A.; Rizzo, G.; De Feo, G.; Landolfi, S. Converting a Conventional Car into a Hybrid Solar Vehicle: A LCA Approach. IFAC-PapersOnLine 2018, 51, 188–194. [Google Scholar] [CrossRef]
  96. Suresh, T.; Subha, T.; Kumar, C.S.; Subash, T. A study of novel technique-solar powered bicycle. In Materials Today: Proceedings; Library, New York, NY, USA; Elsevier: Amsterdam, The Netherlands, 2020. [Google Scholar]
  97. Yahyaoui, I. Advances in Renewable Energies and Power Technologies: Volume 1: Solar and Wind Energies; Library, New York, NY, USA; Elsevier: Amsterdam, The Netherlands, 2018. [Google Scholar]
  98. Simbolotti, G. Concentrating Solar Power: Technology Brief; IEA-ETSAP and IRENA: Abu Dhabi, United Arab Emirates, 2013. [Google Scholar]
  99. Steinhagen, H.M.; Trieb, F. Concentrating solar power, a review of the technology. Ingenia 2004, 18, 43–50. [Google Scholar]
  100. Zhang, H.; Baeyens, J.; Degrève, J.; Cacères, G. Concentrated solar power plants: Review and design methodology. Renew. Sustain. Energy Rev. 2013, 22, 466–481. [Google Scholar] [CrossRef]
  101. Breeze, P. Solar Power Generation; Library, New York, NY, USA; Academic Press: Cambridge, MA, USA, 2016. [Google Scholar]
  102. Qazi, S. Standalone Photovoltaic (PV) Systems for Disaster Relief and Remote Areas; Library, New York, NY, USA; Elsevier: Amsterdam, The Netherlands, 2016. [Google Scholar]
  103. Concentrated Solar Power Had a Global Total Installed Capacity of 6451 MW in 2019. 2020. Available online: http://helioscsp.com/concentrated-solar-power-had-a-global-total-installed-capacity-of-6451-mw-in-2019/ (accessed on 28 April 2021).
  104. IRENA: International Renewable Energy Agency. Solar Costs. Available online: https://irena.org/costs/Power-Generation-Costs/Solar-Power (accessed on 28 April 2021).
  105. Lee, J.F.; Rahim, N.A.; Al-Turki, Y.A. Performance of dual-axis solar tracker versus static solar system by segmented clearness index in Malaysia. Int. J. Photoenergy 2013, 2013. [Google Scholar] [CrossRef]
  106. Rikki Allessandra. Concentrated Solar Power (CSP) Vs Photovoltaic (PV): An In-depth Comparison. 2019. Available online: https://solarfeeds.com/csp-and-pv-differences-comparison/ (accessed on 28 April 2021).
  107. International Energy Agency (IEA). Covid-19 and the Resilience of Renewables—Renewables; IEA: Paris, France, 2020; Available online: https://www.iea.org/reports/renewables-2020 (accessed on 28 April 2021).
  108. Hammer, A.; Beyer, H.; Richter, C.; Lincot, D.; Guermard, A. Solar radiation, spatial and temporal variability. In Encyclopedia of Sustainability Science and Technology; Meyers, R.A., Ed.; Springer: New York, NY, USA, 2012; Volume 9744, p. 9758. [Google Scholar]
  109. Mills, A. Understanding Variability and Uncertainty of Photovoltaics for Integration with the Electric Power System; Library, New York, NY, USA; Berkeley National Laboratory: Berkeley, CA, USA, 2009. [Google Scholar]
  110. Makarov, Y.V.; Etingov, P.V.; Ma, J. Incorporating forecast uncertainty in utility control center. In Renewable Energy Integration; Library, New York, NY, USA; Elsevier: Amsterdam, The Netherlands, 2017; pp. 145–157. [Google Scholar]
  111. González-Aparicio, I.; Zucker, A. Impact of wind power uncertainty forecasting on the market integration of wind energy in Spain. Appl. Energy 2015, 159, 334–349. [Google Scholar] [CrossRef]
  112. Hodge, B.M.; Martinez-Anido, C.B.; Wang, Q.; Chartan, E.; Florita, A.; Kiviluoma, J. The combined value of wind and solar power forecasting improvements and electricity storage. Appl. Energy 2018, 214, 1–15. [Google Scholar] [CrossRef]
  113. Wang, H.; Lei, Z.; Zhang, X.; Zhou, B.; Peng, J. A review of deep learning for renewable energy forecasting. Energy Convers. Manag. 2019, 198, 111799. [Google Scholar] [CrossRef]
  114. Al-Yahyai, S.; Charabi, Y.; Gastli, A. Review of the use of numerical weather prediction (NWP) models for wind energy assessment. Renew. Sustain. Energy Rev. 2010, 14, 3192–3198. [Google Scholar] [CrossRef]
  115. Singh, S.; Mohapatra, A. Repeated wavelet transform based ARIMA model for very short-term wind speed forecasting. Renew. Energy 2019, 136, 758–768. [Google Scholar]
  116. Shadab, A.; Ahmad, S.; Said, S. Spatial forecasting of solar radiation using ARIMA model. Remote Sens. Appl. Soc. Environ. 2020, 20, 100427. [Google Scholar] [CrossRef]
  117. Wang, Y.; Wang, H.; Srinivasan, D.; Hu, Q. Robust functional regression for wind speed forecasting based on Sparse Bayesian learning. Renew. Energy 2019, 132, 43–60. [Google Scholar] [CrossRef]
  118. Deo, R.C.; Wen, X.; Qi, F. A wavelet-coupled support vector machine model for forecasting global incident solar radiation using limited meteorological dataset. Appl. Energy 2016, 168, 568–593. [Google Scholar] [CrossRef]
  119. Memarzadeh, G.; Keynia, F. A new short-term wind speed forecasting method based on fine-tuned LSTM neural network and optimal input sets. Energy Convers. Manag. 2020, 213, 112824. [Google Scholar] [CrossRef]
  120. Sharifian, A.; Ghadi, M.J.; Ghavidel, S.; Li, L.; Zhang, J. A new method based on Type-2 fuzzy neural network for accurate wind power forecasting under uncertain data. Renew. Energy 2018, 120, 220–230. [Google Scholar] [CrossRef]
  121. Ghimire, S.; Deo, R.C.; Raj, N.; Mi, J. Deep solar radiation forecasting with convolutional neural network and long short-term memory network algorithms. Appl. Energy 2019, 253, 113541. [Google Scholar] [CrossRef]
  122. Kayedpour, N.; Samani, A.E.; De Kooning, J.D.; Vandevelde, L.; Crevecoeur, G. A Data-Driven Approach Using Deep Learning Time Series Prediction for Forecasting Power System Variables. In Proceedings of the 2019 IEEE 2nd International Conference on Renewable Energy and Power Engineering (REPE), Toronto, ON, Canada, 2–4 November 2019; Library, New York, NY, USA. pp. 43–47. [Google Scholar]
  123. Zhang, K.; Qu, Z.; Wang, J.; Zhang, W.; Yang, F. A novel hybrid approach based on cuckoo search optimization algorithm for short-term wind speed forecasting. Environ. Prog. Sustain. Energy 2017, 36, 943–952. [Google Scholar] [CrossRef]
  124. Liu, H.; Tian, H.q.; Li, Y.f. Comparison of two new ARIMA-ANN and ARIMA-Kalman hybrid methods for wind speed prediction. Appl. Energy 2012, 98, 415–424. [Google Scholar] [CrossRef]
  125. Verbois, H.; Huva, R.; Rusydi, A.; Walsh, W. Solar irradiance forecasting in the tropics using numerical weather prediction and statistical learning. Sol. Energy 2018, 162, 265–277. [Google Scholar] [CrossRef]
  126. Rosas, P. Dynamic Influences of Wind Power on the Power System; Ørsted: Fredericia, Denmark, 2003. [Google Scholar]
  127. Mills, A. Implications of Wide-Area Geographic Diversity for Short-Term Variability of Solar Power; Library, New York, NY, USA; Berkeley National Laboratory: Berkeley, CA, USA, 2010. [Google Scholar]
  128. Takle, E.; Shaw, R. Complimentary nature of wind and solar energy at a continental mid-latitude station. Int. J. Energy Res. 1979, 3, 103–112. [Google Scholar] [CrossRef]
  129. Giraud, F.; Salameh, Z.M. Steady-state performance of a grid-connected rooftop hybrid wind-photovoltaic power system with battery storage. IEEE Trans. Energy Convers. 2001, 16, 1–7. [Google Scholar] [CrossRef]
  130. Bernal-Agustín, J.L.; Dufo-López, R.; Rivas-Ascaso, D.M. Design of isolated hybrid systems minimizing costs and pollutant emissions. Renew. Energy 2006, 31, 2227–2244. [Google Scholar] [CrossRef]
  131. González, A.; Riba, J.R.; Rius, A.; Puig, R. Optimal sizing of a hybrid grid-connected photovoltaic and wind power system. Appl. Energy 2015, 154, 752–762. [Google Scholar] [CrossRef] [Green Version]
  132. Bilal, B.O.; Sambou, V.; Ndiaye, P.; Kébé, C.; Ndongo, M. Study of the influence of load profile variation on the optimal sizing of a standalone hybrid PV/wind/battery/diesel system. Energy Procedia 2013, 36, 1265–1275. [Google Scholar] [CrossRef] [Green Version]
  133. Zhao, Y.; Noori, M.; Tatari, O. Boosting the adoption and the reliability of renewable energy sources: Mitigating the large-scale wind power intermittency through vehicle to grid technology. Energy 2017, 120, 608–618. [Google Scholar] [CrossRef]
  134. Rahimi, E.; Rabiee, A.; Aghaei, J.; Muttaqi, K.M.; Nezhad, A.E. On the management of wind power intermittency. Renew. Sustain. Energy Rev. 2013, 28, 643–653. [Google Scholar] [CrossRef] [Green Version]
  135. Bui, V.H.; Hussain, A.; Nguyen, T.T.; Kim, H.M. Multi-Objective Stochastic Optimization for Determining Set-Point of Wind Farm System. Sustainability 2021, 13, 624. [Google Scholar] [CrossRef]
  136. Balling, L. Fast cycling and rapid start-up: New generation of plants achieves impressive results. Mod. Power Syst. 2011, 31, 35–41. [Google Scholar]
  137. Karunanithi, K.; Saravanan, S.; Prabakar, B.; Kannan, S.; Thangaraj, C. Integration of demand and supply side management strategies in generation expansion planning. Renew. Sustain. Energy Rev. 2017, 73, 966–982. [Google Scholar] [CrossRef]
  138. Baetens, J.; De Kooning, J.D.; Van Eetvelde, G.; Vandevelde, L. A Two-Stage Stochastic Optimisation Methodology for the Operation of a Chlor-Alkali Electrolyser under Variable DAM and FCR Market Prices. Energies 2020, 13, 5675. [Google Scholar] [CrossRef]
  139. Ibrahim, H.; Ilinca, A. Techno-economic analysis of different energy storage technologies. In Energy Storage-Technologies and Applications; Library, New York, NY, USA; IntechOpen: London, UK, 2013. [Google Scholar]
  140. Dadkhah, A.; Bozalakov, D.; De Kooning, J.D.; Vandevelde, L. On the optimal planning of a hydrogen refuelling station participating in the electricity and balancing markets. Int. J. Hydrogen Energy 2021, 46, 1488–1500. [Google Scholar] [CrossRef]
  141. Samani, A.E.; D’Amicis, A.; De Kooning, J.D.; Bozalakov, D.; Silva, P.; Vandevelde, L. Grid balancing with a large-scale electrolyser providing primary reserve. IET Renew. Power Gener. 2020, 14, 3070–3078. [Google Scholar] [CrossRef]
  142. Liu, J.; Hu, C.; Kimber, A.; Wang, Z. Uses, Cost-Benefit Analysis, and Markets of Energy Storage Systems for Electric Grid Applications. J. Energy Storage 2020, 32, 101731. [Google Scholar] [CrossRef]
  143. Hesse, H.C.; Schimpe, M.; Kucevic, D.; Jossen, A. Lithium-ion battery storage for the grid—A review of stationary battery storage system design tailored for applications in modern power grids. Energies 2017, 10, 2107. [Google Scholar] [CrossRef] [Green Version]
  144. Shekhawat, D.; Spivey, J.J.; Berry, D.A. Fuel Cells: Technologies for Fuel Processing; Library, New York, NY, USA; Elsevier: Amsterdam, The Netherlands, 2011. [Google Scholar]
  145. Momirlan, M.; Veziroglu, T.N. The properties of hydrogen as fuel tomorrow in sustainable energy system for a cleaner planet. Int. J. Hydrogen Energy 2005, 30, 795–802. [Google Scholar] [CrossRef]
  146. Edwards, P.P.; Kuznetsov, V.L.; David, W.I.; Brandon, N.P. Hydrogen and fuel cells: Towards a sustainable energy future. Energy Policy 2008, 36, 4356–4362. [Google Scholar] [CrossRef]
  147. Enescu, D.; Chicco, G.; Porumb, R.; Seritan, G. Thermal energy storage for grid applications: Current status and emerging trends. Energies 2020, 13, 340. [Google Scholar] [CrossRef] [Green Version]
  148. IRENA. Electricity Storage Valuation Framework: Assessing System Value and Ensuring Project Viability; International Renewable Energy Agency: Abu Dhabi, United Arab Emirates, 2020. [Google Scholar]
  149. Kharel, S.; Shabani, B. Hydrogen as a long-term large-scale energy storage solution to support renewables. Energies 2018, 11, 2825. [Google Scholar] [CrossRef] [Green Version]
  150. IRENA. Renewable Energy and Climate Pledges: Five Years after the Paris Agreement; International Renewable Energy Agency: Abu Dhabi, United Arab Emirates, 2019. [Google Scholar]
  151. Energy: Roadmap 2050; Library, New York, NY, USA; Publications Office of the European Union: Luxembourg, 2012. [CrossRef]
  152. Elia Group. Elia’s View on Belgium’s Energy Vision for 2050; Elia: Brussels, Belgium, 2017. [Google Scholar]
  153. Elia group. Adequacy and Flexibility Study for Belgium 2020–2030; Elia: Brussels, Belgium, 2019. [Google Scholar]
  154. Belgium Energy Information. 2020. Available online: https://www.enerdata.net/estore/energy-market/belgium.html (accessed on 28 April 2021).
  155. Belgium Will Not Reach Its Renewable Energy Goal for 2020. 2020. Available online: https://www.brusselstimes.com/news/belgium-all-news/141197/belgium-will-not-reach-its-renewable-energy-goal-for-2020-energy-minister-tinne-van-der-straeten-house-committee-flanders-brussels-wallonia-marie-christine-marghem-wind-farms-n-va-bert-wollants/ (accessed on 28 April 2021).
  156. Belgian Energy and Climate Plan Proposes Renewables Target of 18.3. Available online: https://windeurope.org/newsroom/news/belgium-energy-and-climate-plan-proposes-renewable-energy-target-of-18-3-by-2030/ (accessed on 28 April 2021).
  157. Belgium’s Electricity Mix in 2020: Renewable Generation up 31% in a Year Marked by the COVID-19 Crisis. 2021. Available online: https://www.elia.be/en/news/press-releases/2021/01/20210107_belgium-s-electricity-mix-in-2020 (accessed on 28 April 2021).
  158. Dudley, B. BP Statistical Review of World Energy; BP Statistical Review: London, UK, 2020. [Google Scholar]
  159. Belgium Population (LIVE). Available online: https://www.worldometers.info/world-population/belgium-population/ (accessed on 28 April 2021).
  160. Germany Population (LIVE). Available online: https://www.worldometers.info/world-population/germany-population/ (accessed on 28 April 2021).
  161. U.K. Population (LIVE). Available online: https://www.worldometers.info/world-population/uk-population (accessed on 28 April 2021).
  162. Turkey Population (LIVE). Available online: https://www.worldometers.info/world-population/turkey-population/ (accessed on 28 April 2021).
  163. Italy Population (LIVE). Available online: https://www.worldometers.info/world-population/italy-population/ (accessed on 28 April 2021).
  164. France Population (LIVE). Available online: https://www.worldometers.info/world-population/france-population/ (accessed on 28 April 2021).
  165. Poland Population (LIVE). Available online: https://www.worldometers.info/world-population/poland-population/ (accessed on 28 April 2021).
  166. Europe Population (LIVE). Available online: https://www.worldometers.info/world-population/europe-population/ (accessed on 28 April 2021).
  167. Sönnichsen, N. Energy Sector in Belgium-Statistics and Facts. 2020. Available online: https://www.statista.com/topics/6051/energy-sector-in-belgium/ (accessed on 28 April 2021).
  168. Elia Group. Belgium Exported More Electricity than It Imported in 2019; Elia: Brussels, Belgium, 2020. [Google Scholar]
  169. Burke, D. Security of Supply-International Review of Standards and Implementation. 2017. Available online: https://nwcouncil.app.box.com/s/ssstzoyl5yioa9awmmbmol7by4upxccm/file/156079472541 (accessed on 28 April 2021).
  170. Kenton, W. Monte Carlo Simulation. 2020. Available online: https://www.investopedia.com/terms/m/montecarlosimulation.asp (accessed on 28 April 2021).
  171. Elia Group. Ready to Accelerate: Sustainability Report 2019; Elia: Brussels, Belgium, 2019. [Google Scholar]
  172. Elia Group. Study Regarding the Adequacy and Flexibility Needs of the Belgian Power System; Elia: Brussels, Belgium, 2019. [Google Scholar]
Figure 1. Cumulative installed capacity of RES in three countries located in various continents in the years 2016 to 2020 [29]: (a) New Zealand. (b) Belgium. (c) Uruguay.
Energies 14 02630 g001
Figure 2. Impact of RES intermittency on the reserve amount of the power system [34], modified by [35], reproduced with permission from [34,35].
Energies 14 02630 g002
Figure 3. Schematic of the expected and actual reduction in fuel consumption (FC) or CO 2 emissions (CDEs) with penetration of an intermittent RES, reproduced with permission from [35].
Energies 14 02630 g003
Figure 4. Transmission losses forecasting with and without wind generation in one month, reproduced with permission from [39].
Energies 14 02630 g004
Figure 5. Cumulative installed capacity of wind power in the last ten years in Europe and world [29]: (a) Onshore capacity. (b) Offshore capacity.
Energies 14 02630 g005
Figure 6. Turbulence, diurnal, and synoptic temporal variation peaks captured at Farm Brookhaven National Laboratory, U.S. [85], modified by [86], reproduced with permission from [85,86].
Energies 14 02630 g006
Figure 7. Schematic of a general PV system [97].
Energies 14 02630 g007
Figure 8. Schematic of CSP plants, reproduced with permission from [101,102]: (a) PT plant. (b) ST plant. (c) FR plant. (d) SD plant.
Energies 14 02630 g008
Figure 9. Incoming solar irradiance interaction with atmospheric components [105].
Energies 14 02630 g009
Figure 10. Global cumulative installed capacity of solar power in the last ten years in the Europe and world [29]: (a) PV capacity. (b) CSP capacity.
Energies 14 02630 g010
Figure 11. The impact of a moving cloud on the time-series of irradiance, reproduced with permission from [1].
Energies 14 02630 g011
Figure 12. Effect of aggregating intermittent RES plants: (a) Wind turbines aggregation impact on the output power, reproduced with permission from Pedro Rosas [126]. (b) Impact of aggregating 5 and 23 PV power plants on GHI variations on a partly cloudy day, reproduced with permission from [127].
Energies 14 02630 g012
Figure 13. The function of ESS for power smoothing [139].
Energies 14 02630 g013
Figure 14. Classification of different ESS types [142].
Energies 14 02630 g014
Figure 15. Comparison of various ESSs [24,142,147,148,149].
Energies 14 02630 g015
Figure 16. Phase out plan of nuclear plants in Belgium [153].
Energies 14 02630 g016
Figure 17. Annual share of RES in electricity generation in Belgium [154].
Energies 14 02630 g017
Figure 18. Electricity generation mix in 2020 in Belgium [157].
Energies 14 02630 g018
Figure 19. Historical values of produced CO 2 in Belgium [158].
Energies 14 02630 g019
Figure 20. Monthly energy mix in the years 2018 and 2019 in Belgium [168].
Energies 14 02630 g020
Figure 21. Occurred incidents in the Belgian power system at lower and higher than 150 kV for which TSO was responsible [171]: (a) Number of incidents. (b) Duration of incidents.
Energies 14 02630 g021
Figure 22. Historical and predicted RES share in electricity and energy consumption in Belgium [153].
Energies 14 02630 g022
Figure 23. Historical and predicted values of onshore wind installed capacity in Belgium [153].
Energies 14 02630 g023
Figure 24. Historical and predicted values of offshore wind installed capacity in Belgium [153].
Energies 14 02630 g024
Figure 25. Historical and predicted values of solar PV installed capacity in Belgium [153].
Energies 14 02630 g025
Figure 26. Generation volume of nuclear plants and annual net import of Belgium [157]: (a) Yearly absolute production. (b) Yearly net imports.
Energies 14 02630 g026
Figure 27. Weekly average total load in 2020 and previous five years in Belgium [157].
Energies 14 02630 g027
Table 1. Summary of the quantitative impacts of RES on the power system.
Parameter [32]RESPenetration LevelVariation of the ParameterRef.
System reserve
(short-term)
wind

wind
5–50%

0–50%
0.3–1.1%
(of the installed wind capacity)
0–0.1
(wind power reserve/load)
[36]

[37]
CO2 reduction
(short-term)
wind

wind-solar

wind-solar
11%

23%

33%
7%

2.3%

<1%
[35,36]

[35,36]

[35,36]
System losses
(short term)
wind

wind
20%

30%
2€/MWh
(extra transmission cost)
3€/MWh
(extra transmission cost)
[32]

[32]
Curtailment
(short-term)
wind-solar

wind-solar

wind
2.5–13.8%

10.9–25.3%

2.6%/9.8%/22.5%
9.7–0.3%

0.3–1.6%

11%/0.7%/3%
[40]

[40]

[41]
Capacity credit
(long-term)
wind

wind

wind-solar
<5%

>40%

16%/20%/27%
Equal to the average wind power

Towards a constant value

30%/26.6%/23.7% (of rated capacity)
[61]

[61]

[62]
Table 2. Summary of temporal wind variations and their predictability, reproduced with permission from [82].
ClassificationPredictabilityAggregation Effect
AnnualNot predictable but smallNA
SeasonalPredictableLimited
SynopticPredictable few days aheadThrough wider geographical dispersion
DiurnalPredictableNA
TurbulencesNot predictableIdeally n 1 2 rule
Table 3. Comparison of leading CSP technologies, reproduced with permission from [98,100].
TechnologyRelative
Cost
Land
Occupancy
Thermo-Dynamic
Efficienecy
Operating
Temperature
Range (°C)
Solar
Concentration
Ratio
Require
Cooling
System
PTLowLargeLow20–40015–45Yes
STHighMediumHigh300–565150–1500Yes
FRVery lowMediumLow50–30010–40Yes
SDVery highSmallHigh120–1500100–1000No
Table 4. Strengths and challenges of Belgium on the way to decarbonisation [152].
StrengthsChallenges
- In line with its strategy,
Belgium has established and
maintained a robust and interconnected
electricity and gas infrastructure as well
as a leading position in market design
and integration
- Stemming from small area of Belgium,
only a limited part of the country’s demand
could be provided by domestic renewable
generation, making Belgium unable to
rely upon domestic capacity on the way
of decarbonisation
- Surrounded by large countries such as Germany,
France and the UK with different strategies
in terms of energy, giving Belgium the freedom
to opt for their best choices
- In the current market design, with the
presence of higher amounts of renewables in the
system, the profitability of conventional
units are of concerns
- Situated at the center of Europe,
crossroads of important renewable
generation hubs and close to the
main load centers
- Meeting load demand becomes growingly
burdensome as in less than a decade from
now nuclear plants are supposed to phase-
out in Belgium
Table 5. Historical values of CO 2 emission per capita [158].
Year20152016201720172019
Index (Belgium) [159]10.4810.5710.6910.8910.78
Index (Country) No.1 [160](Germany)
9.48
(Germany)
9.37
(Germany)
9.20
(Germany)
8.79
(Germany)
7.64
Index (Country) No.2 [161](UK)
6.68
(UK)
6.27
(UK)
6.05
(UK)
5.91
(UK)
5.73
Index (Country) No.3 [162](Turkey)
4.33
(Turkey)
4.50
(Turkey)
4.89
(Turkey)
4.76
(Turkey)
4.60
Index (Country) No.4 [163](Italy)
5.44
(Italy)
5.44
(Italy)
5.49
(Italy)
5.47
(Italy)
5.37
Index (Country) No.5 [164,165](France)
4.76
(France)
4.83
(France)
4.90
(Poland)
8.42
(Poland)
8.02
Index (Country) No.6 [164,165](Poland)
7.71
(Poland)
8.05
(Poland)
8.31
(France)
4.73
(France)
4.59
Index (Europe) [166]5.665.735.775.695.50
Table 6. Hours and annual share of the whole consumed electricity when wind and solar generated more than 50% of consumed electricity in Belgium [157].
YearTotal HoursShare of Annual Consumed Electricity
201800.0%
201980.1%
20201191.4%
Table 7. Comparison of solar, wind and their related technologies.
RES TypeAdvantageDisadvantageTechnologyAdvantage
Wind- A proven renewable source
- Provide inertia for the grid
- Could be available 24/7
- Occupies a small are
- Intermittent
- Eyesore on the nature

- Noise pollution
Onshore- A proven technology
- Easier and quicker to install
- Shorter distance to load
- Cheaper compared to onshore turbines
Offshore- Higher wind speed
- More foreseeable and consistent wind
- Less mechanical stress of turbine
- Less importance of noise
Solar- A proven renewable source
- More predictable compared to wind
- Higher correlation with the demand
- Decreases inertia of the grid
- Not available after daylight
- Intermittent
PV- Collects all three components of the sunlight
- A proven technology
- Declining cost of equipment
- Easier to manufacture
- Low operating and maintenance cost
- Locally available
CSP- Able to use thermal storage systems
- Higher efficiency compared to PV
- Low operating cost
DisadvantageMaturityRecently DevelopingCumulative Installed Capacity
World/Belgium
- Noise pollution
- Occupies land
- Eyesore on the land
HighNA594.25/2.2 GW (Onshore)
- More maintenance costs
- Harder to build
- Eyesore on the sea
- Negative impact on marine life
MediumYes28.15/1.5 GW (Offshore)
- Needs additional equipment such as inverters
- Low efficiency
- Dependent on the location, such as for residential purposes or whether panels are
covered by tall buildings
- Requires large area for land-mounted plants
HighNA578.5/4.5 GW (PV)
- Only use DNI component of the sunlight
- Strongly dependant on the geographical location
- Hard and expensive to manufacture
- Requires large area
PT: High
ST: Medium
FR: Low
SD: Low
PT: NA
ST: Yes
FR: No
SD: No
6.3/- GW (CSP)
Publisher’s Note: MDPI stays neutral with regard to jurisdictional claims in published maps and institutional affiliations.

